Abstract
Slates transform from shales at relatively low-grade metamorphic conditions. They often reveal highly anisotropic microstructures and very strong crystal alignment that must be considered in seismic modeling and engineering construction. In this paper, we investigate nine slate samples from four regions in northern China: Fangshan, Beijing; Xushui, Hebei; Damao Qi, Inner Mongolia; and Zhengxiangbai Qi, Inner Mongolia. The microstructural characteristics were analyzed with scanning electron microscopy and explored with digital crystal size distribution analysis. Preferred crystal orientation characteristics of slate minerals were investigated with high-energy synchrotron X-ray diffraction and subsequent Rietveld refinement. This research shows that the main components of slates in this study are quartz, muscovite, chlorite, and minor orthoclase. In terms of morphology, muscovite, chlorite, and quartz are strongly elongated and oriented. The crystallographic orientation of sheet silicates is very strong, exceeding 100 multiples of random distribution for chlorite from Fangshan. However, quartz with a preferred strong shape orientation has a crystallographic preferred orientation close to random. The preferred orientation characteristics of minerals serve as a basis for calculating elastic properties and anisotropies of the Chinese slate samples that contribute significantly to seismic anisotropy documented in northern China.
1. Introduction
Slate is a low-grade metamorphic rock, which is distributed worldwide. It is an important rock type in the shallow crust and crystallizes mainly in greenschist facies. Slate is usually formed through regional or dynamic low-temperature metamorphism of shales and often appears in shear zones and orogenic belts. During the process of plate movement, rocks experience complex stress, causing the minerals inside the slate to become oriented, thus developing anisotropy. By studying the anisotropy of slate, geologists can infer the direction and intensity of the stress field in geological history and reconstruct the paleo-plate movement trajectories [1,2,3]. The anisotropic characteristics of slate are mainly reflected in aspects such as the magnitude of seismic wave velocity, shear wave splitting, the ratio of P-wave to S-wave velocity, and energy attenuation [4]. During an earthquake, the failure pattern of the rock is closely related to its schistosity structure, and the anisotropic characteristics of slate must be considered in seismic modeling, including interpretation of observed macroscopic seismic anisotropy [5].
Slate is often used as a building material. Its anisotropy has a significant impact on engineering stability [6]. Spain is still the world’s most significant high quality slate producer [7], but China [8] and Brazil [9] have reached similar levels.
Numerous scholars have carried out observational, computational, and simulation studies on the schistosity characteristics, seismic wave velocity magnitudes, and anisotropy of slate. Initially, optical microscopes were used to observe the slaty cleavage [10,11]. Subsequently, transmission electron microscopy [12] and scanning electron microscopy (SEM) were employed to study slate. Weber (1981) [13] explained the origin of the finite fabric of slate from a microscopic perspective and analyzed the slip parallel to the basal planes of phyllosilicates with a scanning electron microscope (SEM). With increasing advances in X-ray technology, geologists have applied X-ray microtomography to explore characteristics of slate [6,14]. Cárdenes et al. [15] utilized electron backscatter diffraction (EBSD) to analyze crystallographic preferred orientation (CPO) maps of slate-forming minerals and calculated seismic velocities based on CPO. Wenk et al. [16,17,18] used high-energy synchrotron X-ray diffraction to study the crystallographic orientation of minerals and discovered extreme alignment of muscovite and chlorite, stronger than previous records such as rolled metal foils. Overall, high-energy synchrotron X-ray diffraction can accurately assess the content of layered silicates and their alignment, averaging over much larger volumes than EBSD.
In northern China, low-grade metamorphic slates are widely distributed, and they are essential to understand anisotropy. The differences in the progressive failure strength of rocks in different directions are influenced by the oriented arrangement of minerals. Therefore, research on the mineral composition, shape preferred orientation (SPO), and crystallographic preferred orientation (CPO) of slate is of great significance. In previous studies, research on Chinese slate mainly focused on the analysis of its mechanical properties [19,20] and seismic parameters [21,22,23], with relatively little exploration of the crystallographic orientation of minerals in slate. In this paper, nine samples were collected from four typical regions (Figure 1) located in Hebei Province (Figure 1a [24,25]), Inner Mongolia (Figure 1b [26] and Figure 1c [27]), and Beijing (Figure 1d [28]) in northern China. The high-energy synchrotron radiation method is used to study the crystallographic preferred orientation of Chinese slate. This will help deepen the understanding of seismic anisotropy observed in the study area.
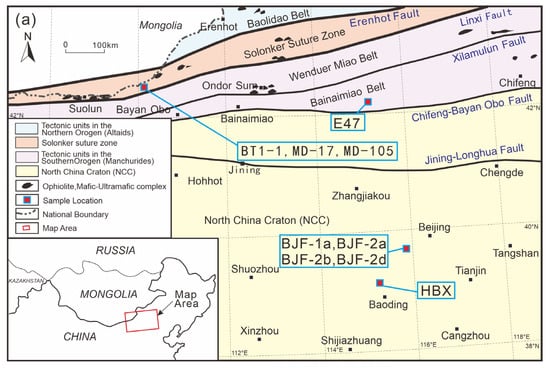
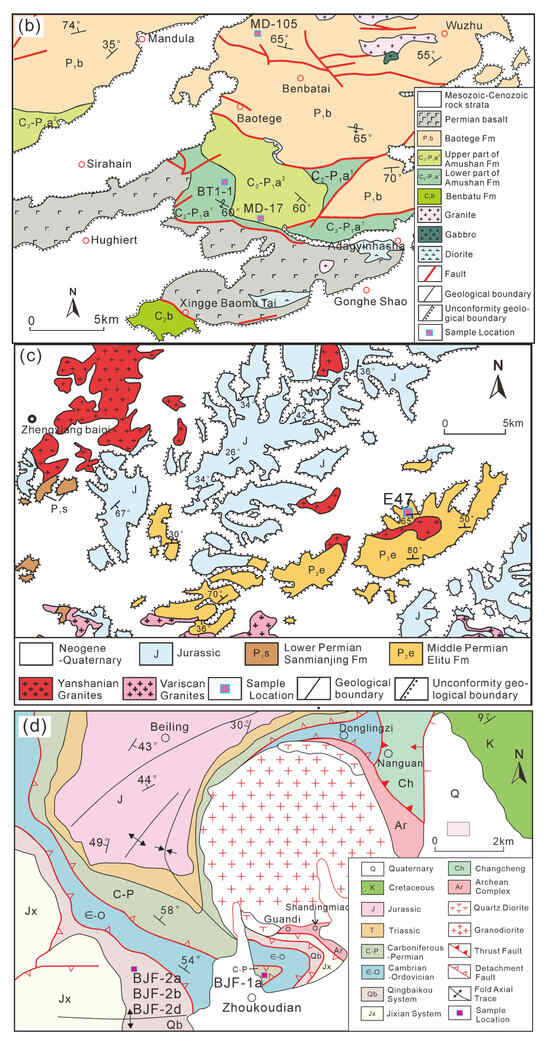
Figure 1.
Tectonic subdivision of the study region (modified from [24,25]). (a) Northern China including five geological structural units: Baolidao Belt, Solonker Zone, Wenduer Miao Belt, Bainamiao Belt, and North China Craton. (b) This area is in Mandula, Damao Qi, Inner Mongolia, and is part of the Solonker Zone. (c) This area is in Zhengxiangbai Qi, Inner Mongolia, which belongs to the Bainaimiao Belt. (d) This area is in Zhoukoudian, Fangshan District, Beijing, which belongs to the North China Craton. In (b–d) some strikes and dips give orientations of foliation planes.
2. Geological Context and Sample Locations
Nine slate samples were analyzed in this study (Table 1). Four of these samples were collected from the Central Asian Orogenic Belt (CAOB), while the other five samples were from the North China Craton (NCC) (Figure 1a). The CAOB formed by subduction and it is considered as an accretion of the Paleo-Asian Ocean (PAO) during the Neoproterozoic to Early Mesozoic. The CAOB is the largest accretionary orogenic belt in the world [24]. It occupies approximately 30% of the land area in Asia and contains a complex geological record of amalgamated accretionary zones and collisional sutures between the major cratons, namely Baltica, Siberia, Tarim, and NCC [29,30]. There are four samples collected in CAOB, three of them (BT1-1, MD-105, MD-17) from the Solonker Suture Zone and one (E47) from the Bainaimiao Belt [31,32].

Table 1.
Sampling locations and geological backgrounds of the samples. All slates are greenschist facies.
In the Mandula area of Damao Qi, located in the middle of the Solonker Suture Zone, the lower part of the Upper Carboniferous–Lower Permian Amushan Formation is characterized by tuffaceous sandstone and siltstone; graywacke feldspar sandstone interbedded with siltstone and tuff; and bioclastic limestone interbedded with tuff (Figure 1b). The upper part consists of sandstone and feldspar quartz sandstone interbedded with sandy slate. The Amushan Formation is unconformably overlain by the Lower Permian Baotege Formation. In this area, the lower part of the Baotege Formation is lithologically composed of glutenite and conglomerate interbedded with dacite, slate, and limestone. The middle part is thick-bedded volcanic conglomerate interbedded with gray-black volcanic ash tuff. The upper part is medium-coarse grained graywacke interbedded with glutenite, tuff, and limestone [26]. Sample BT1-1 was collected from the lower part of the Amushan Formation, while sample MD-17 was collected from the upper part of the Amushan Formation and sample MD-105 was collected from the Permian Baotege Formation.
One sample (E47) was collected from the Bainaimiao Belt, which is located along the northern margin of the North China Craton (NCC) [33]. This sample is derived from the Middle Permian Elitu Formation, which is widely distributed in the eastern part of the Inner Mongolia Autonomous Region (Figure 1c). It is a sedimentation of the back-shore basin on the continental margin in the Late Paleozoic. The lower part consists of variegated gravel-bearing coarse-grained feldspar sandstone, quartz sandstone, fine sandstone, siltstone, and silty shale interbedded with pyroclastic rocks. All the rocks are slightly metamorphosed. The upper part is composed of gray and gray-black tuff breccia and andesite [27].
Four samples were collected from Zhoukoudian, Fangshan District, Beijing. From a tectonic point of view, this area belongs to the Yanshan plate orogenic belt on the northern margin of the North China Block, located at the intersection of the Yanshan Mountains, Taihang Mountains, and the North China Basin [34]. It is a typical intra-plate (intra-continental) orogenic belt [28]. Metamorphic rocks are well-developed, mainly including Archean metamorphic complexes, Archean regional metamorphic rocks, and Early Cretaceous thermal contact metamorphic rocks around the Fangshan rock mass. In this study, two sampling sites were selected (as shown in Figure 1d). One sample is located in the Cambrian Jingeryu Formation near Huangyuan, and the other three are derived from the Carboniferous–Permian System on the northern side of the Zhoukoudian Site [28,35].
One sample (HBX) was collected from Xushui, Baoding, Hebei Province. Tectonically, this sample is located at the junction of the Taihang Mountain Uplift and the Jizhong Depression. Sample HBX is derived from Middle Cambrian metamorphic rocks.
Baoding (Hebei Province) and Fangshan (Beijing) are renowned slate-producing regions in China [36,37]. Baoding primarily yields rust-colored slate, yellow wood-grain slate, and black slate, whereas Fangshan produces yellow wood-grain slate, ocean-green slate, light green slate, and black slate (Figure 2). These slates not only occupy a significant position in the domestic market but are also exported to international markets.
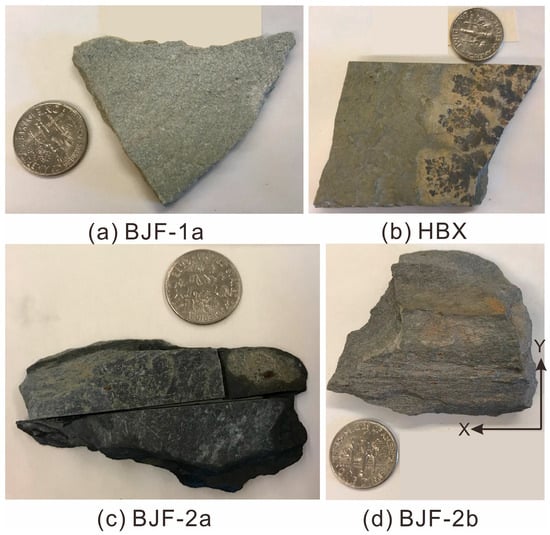
Figure 2.
Examples of hand specimens of slates. (a) BJF-1a, green slate. (b) HBX, rust-colored slate with pyrolusite dendrites. (c) BJF-2a, black slate. (d) BJF-2b, green slate. XY coordinates are indicated in (d). All samples have a coin as scale with 17.9 mm diameter.
3. Microstructures, Mineral Composition, and Shape Preferred Orientation Investigated with SEM
The slate samples collected in the field were cut into thin sections mounted on a glass slide, with a thickness of 30 μm, and then polished. The cutting direction (Figure 3) was perpendicular to the slaty cleavage (XY plane), i.e., the thin sections were oriented along the plane containing the X-axis and Z-axis.
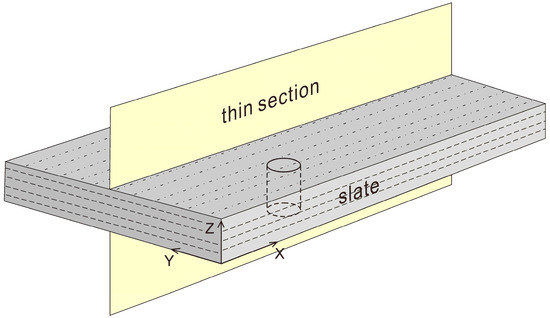
Figure 3.
Schematic diagram of cutting direction for thin sections and cylindrical sample for synchrotron X-ray diffraction. X is the lineation.
The average grain size in the slate samples is very small (5–30 μm); optical microscopy is not very informative. Therefore, a scanning electron microscope (SEM) was employed to observe and analyze mineral composition and microstructure. The crystal size distribution theory (CSD) was applied for quantitative crystal shape analysis [38].
Carbon-coated thin sections were analyzed with a Zeiss—EVO scanning electron microscope (Zeiss-USA, White Plains, NY, USA) at the Department of Earth and Planetary Science at the University of California Berkeley, in high vacuum mode at 20 kV and a beam current of 2 nA. Backscatter electron (BE) detectors were mainly used for imaging. An Energy Dispersive Spectrometer (EDS) EDAX-Genesis (Gatan-Ametek, Warrendale, PA, USA) was used to identify the minerals based on chemical composition. The main mineral components of the slate include quartz, muscovite, chlorite, apatite, and albite (Figure 4).
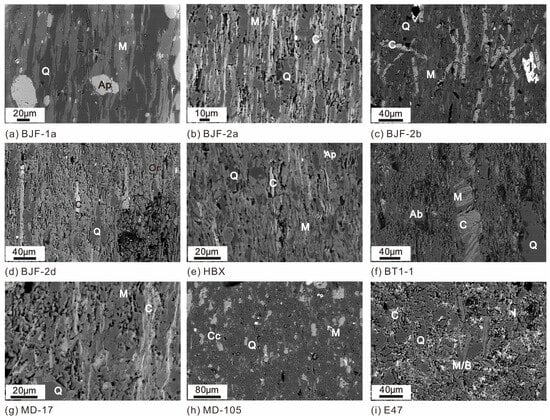
Figure 4.
BE-SEM images of details in the samples as discussed in the text. Phases identified using SEM-EDS are chlorite (C), muscovite (M), quartz (Q), albite (Ab), apatite (Ap), ilmenite (I), M/B muscovite–biotite intergrowth, and calcite (Cc). Foliation direction is vertical.
The BE-SEM images in Figure 4 display a wide diversity and considerable heterogeneity. BJF-1a is characterized by a regular fabric of flattened muscovite (M) and quartz grains (Q) intercepted by equiaxed apatite (A) (Figure 4a). Also, BJF-2a displays a very high alignment of chlorite (bright) and muscovite (bright grey), with extreme aspect ratios (~20). Quartz (darker grey) is also flattened, but less extreme (~5) (Figure 4b). BJF-2b is similar to BJF-2a but the alignment is not as pronounced, with euhedral muscovite crystals in different directions (Figure 4c). There are some fairly large ilmenite crystals (I). BJF-2d has a smaller chlorite content but some larger unbent and perfectly aligned crystals that appear to have crystallized in a late stage (Figure 4d). In HBX, the fabric is less regular, with some highly flattened chlorite (C) but less flattened and less aligned muscovite, some perpendicular to the cleavage plane (M). Also, quartz displays only moderate flattening (Q) (Figure 4e).
Samples from Inner Mongolia are more variable with different grain sizes. BT1 displays layers with interbedded chlorite (C) and muscovite (M). This interlayering is common in many samples and occurs at the micron scale, which limits the precision of EDS chemical analyses (Table 2). This sample has only a small fraction of chlorite and most of the matrix is muscovite and fairly equiaxed quartz (Q) with some fairly large albite (Ab) (Figure 4f). Slate MD-17 is dominated by quartz (Q), with aligned sheet-silicates in bands, mainly muscovite (M) and very bright chlorite (C) (Figure 4g). MD-105 is dominantly quartz, with some thin platelets of intergrown muscovite and chlorite. It displays a fabric with large equiaxed calcite crystals (Cc) (Figure 4h). E47 does not display much directionality. The fabric contains large equiaxed quartz (Q) (10 mm) and small bright ilmenite (I). Most remarkable are large, undeformed mica crystals, aligned in different directions (M/B). They represent intergrowths of biotite (bright) and muscovite (darker) (Figure 4i).
Table 2.
Chemical composition of muscovite (M), chlorite (C), and biotite (B) estimated from SEM-EDS analyses. Atomic fractions (%) by element.
We used SEM-EDS analyses to quickly identify accessories such as apatite, ilmenite, albite and calcite. They are generally equiaxed and have no crystallographic alignment. We also quantified the composition of muscovite and chlorite, and atomic fractions are listed in Table 2. As mentioned above, there is often muscovite–chlorite intergrowth. The composition of chlorite varies with Fe/Mg 1–2 and for E 47 biotite ~ 1.
The crystal size distribution (CSD) theory was used to quantitatively analyze the morphological characteristics and orientation of mineral grains in the slate in two dimensions. This method was initially used in the field of chemical engineering [39] and was later introduced into the study of crystalline rocks (igneous and metamorphic rocks) [40,41]. It can quantitatively analyze and interpret petrographic microstructures.
To achieve accurate segmentation and visualization of quartz, muscovite, and chlorite in SEM images, the following approach is employed: SEM images are imported into CorelDRAW 2020 [https://www.coreldraw.com/en/product/coreldraw] for manual boundary tracing of each mineral phase, with subsequent color filling. For instance, muscovite is rendered in light brown, chlorite in green, and quartz in blue (Figure 5). Critical operational criteria include ensuring non-intersecting and non-overlapping boundaries for grains of the same mineral to prevent misclassification during subsequent ImageJ [https://imagej.net/ij/download.html] processing, which could introduce errors in structural parameter quantification. All intact mineral grains, excluding edge-incomplete ones, are designated as statistical objects. Post-tracing, single-mineral images are exported in “.tif” format with RGB color mode and a resolution of 600 dpi to preserve morphological details. Figure 5 shows the delineation of mineral boundaries of nine samples. The first column on the left is the original SEM image, and the second to fourth columns are the outlined minerals. Prior to delineating mineral boundaries, it is necessary to first determine the mineral composition, and the specific delineation techniques and methods will also affect the final analysis results.
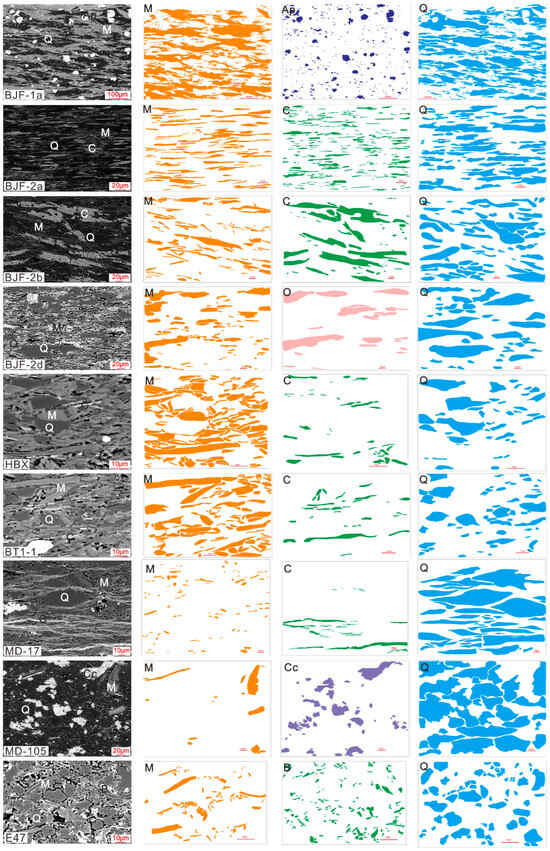
Figure 5.
BE-SEM images and extracted CSD images based on them. Phases are chlorite (C), muscovite (M), quartz (Q), apatite (Ap), biotite (B), orthoclase (O), and calcite (Cc).
When the mineral content is low in a sample, the measurable amount of the target mineral becomes limited, which in turn compromises the reliability of the analytical results. For this reason, minerals with low content are not included in the subsequent characterization. Three representative minerals were selected from each sample. The minerals involved in crystal size distribution (CSD) analysis in the samples include chlorite, muscovite, quartz, apatite, biotite, orthoclase, and calcite.
For the extraction of crystal size distribution (CSD) parameters, the “.tif” files are processed using ImageJ 1.43 [42,43,44], enabling the acquisition of CSD-related metrics, which are exported as “.CSD” files. The resultant Summary and Results Files contain key morphological data, including the count of traced grains (N) and the major and minor axes of ellipses fitted to each grain by ImageJ. These axes parameters serve as quantitative indicators of grain shape characteristics and directional attributes. To analyze crystal morphological orientation, the “.CSD” files are imported into the CSD Corrections software [40] for computational assessment of crystal morphology and distribution patterns. Focus is directed toward the alignment factor (AF), a core parameter for quantifying orientation degree. An AF value of 1 denotes perfect alignment with maximal morphological orientation, while a value of 0 indicates random orientation. Intermediate values (0–1) correlate proportionally with orientation intensity, with proximity to 1 signifying higher orientation and proximity to 0 indicating lower orientation.
The CSD results of nine slate samples from China are shown in Table 3, with the lowest number of mineral particles ranging from 7 to a maximum of 413. The values of major/minor range is between 1.96 and 12.47. Muscovite was depicted in nine slate samples, with an average value of 6.05. The highest value was in sample BJF-2a, which was 12.47, and the lowest value was in sample E47, which was 3.97. Chlorite was depicted in five slate samples, with an average value of 7.77. The highest value was in sample MD-17, which was 11.45, and the lowest value was in sample BJF-2b, which was 4.76. Quartz was depicted in nine samples, with an average value of 4.10. Among them, sample MD-17 had the highest value, which was 6.33, and sample E47 had the lowest value, which was 1.83. Values for apatite, orthoclase, biotite, and calcite are relatively low: 2.41, 6.13, 3.19, and 1.96. The aspect ratio of minerals is affected by the microstructure and is also related to the structure of the minerals themselves. The aspect ratios of phyllosilicates are generally higher than those of minerals such as quartz and apatite, but quartz also has a significant flattening or shape preferred orientation (SPO), as was documented for other slates (e.g., [18]).
Table 3.
Morphological and orientation parameters of minerals investigated with SEM. N: the number of mineral particles outlined; major/minor: average ratio of the length of the major axis to the length of the minor axis of the fitted ellipses for all the traced mineral grains; AF: alignment factor.
The AF values of minerals in most specimens were greater than 0.5. Among them, there were five specimens with AF values greater than 0.9, and only two specimens (E47 and MD-105) had AF values less than 0.5, indicating that most of the slates generally have strong orientation characteristics.
4. Crystallographic Preferred Orientation and Volume Fractions Measured with High Energy Synchrotron X-Ray Diffraction
High-energy synchrotron X-rays can characterize bulk grain statistics with high sample penetration and a low diffraction angle, thus enabling the analysis of the preferred orientation of minerals in fine-grained rocks such as slates [17,18]. The sample is grinded manually into a roughly cylindrical shape with a diameter of 3–5 mm. There is no requirement for the height. The extension direction of the cylinder should be perpendicular to the foliation direction of the slate (Figure 3). The orientation is marked with a white dot on both the bulk sample and the cylinder. Additionally, when preparing the cylindrical rock block, large mineral grains are avoided and a uniform area is selected. Then, the cylinder is mounted with glue on a brass or aluminum rod. The measurements are carried out at the high-energy beamline 11-ID-C of the Advanced Photon Source synchrotron (Lemont, IL, USA) at Argonne National Laboratory. The wavelength is 0.1173 Å (105.7 keV), the Perkin-Elmer 2D image plate detector (Perkin-Elmer, Waltham, MA, USA) is positioned at a distance of approximately 1950 mm from the sample, and the beam size is roughly 1 mm (Figure 6). A cylindrical sample is placed on a goniometer head and rotated (φ) incrementally around the Z-axis. The 2D detector captures the diffraction image (right side of Figure 6). In the upper-left part, a pole figure displays the coverage achieved through six images taken at different rotation angles. Each dot corresponds to a diffraction pattern that is the average over 5° in the azimuthal η direction.
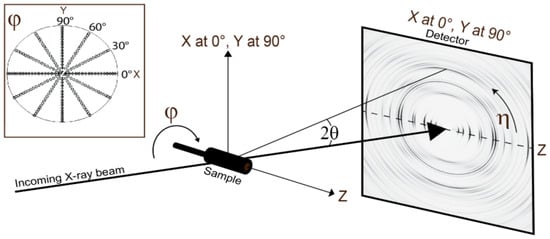
Figure 6.
Schematic of the X-ray diffraction experiment with incident X-ray (left), sample, and 2D detector. Images are recorded at different rotation angles ϕ. Pole-figure on top left displays coverage with 6 rotations at 30° intervals. In the actual experiment, 18 images were captured at 10° intervals.
Prior to the measurement of slate samples, the instrument geometry is calibrated using a LaB6 standard with a lattice parameter (a = 4.156468 Å). This calibration serves to refine crucial parameters such as the sample—detector distance, the precise detector orientation, and the instrumental resolution [45]. Subsequently, the slate samples are measured within a 170° φ range, with the sample being rotated around the Z-axis. A total of 18 “composite” images are obtained at 10° φ rotation intervals. Each measurement takes about 15 min. The 18 images are utilized to map the three-dimensional diffracted intensity distribution in relation to the sample coordinates XYZ. This distribution can then be projected onto a pole-figure (Figure 6, top left). The rotation occurs around the axis perpendicular to the cleavage plane (Z). The data provide a comprehensive coverage of various directions, especially the center of the pole figure, which corresponds to the (001) maximum in the phyllosilicate pole figures.
Afterwards, the 18 diffraction images of a single sample are simultaneously analyzed using the Rietveld method [46]. This method is based on a least-squares fitting approach, aiming to minimize the discrepancy between the experimental diffraction data and a calculated model. The calculated model takes into account multiple factors, including diffractometer parameters, beam intensity, scattering background, crystal structures, crystal preferred orientations, and volume fractions of the components. For the Rietveld refinement, version 2.994 of the software MAUD [47] (https://luttero.github.io/maud) was used. Detailed information regarding the software and the routine analysis procedures can be found in tutorials [48,49]. Initially, the 2D images are integrated over azimuthal sectors of 5° along the η angle to generate 72 conventional diffraction patterns. A total of 18 × 72 = 1296 patterns for each sample, with 2θ ranging from 1° to 4°, are then utilized in the Rietveld refinement process. When conducting texture analysis in MAUD for monoclinic crystals like muscovite and biotite, the first setting where 100 serves as the cleavage plane must be utilized, as opposed to the more commonly used second setting with 001 as the cleavage plane [50]. However, in the text, tables, and figures, when labeling lattice planes hkl, we adopt the more conventional second setting.
Figure 7 shows “unrolled” diffraction images of samples BJF-2a and BT-1-1, plotting 2θ as function of azimuth. They both display a strong preferred orientation, expressed in strong azimuthal intensity variations. Image intensities are at the bottom and the Rietveld fit is at the top. There is excellent agreement. After fitting with MAUD, volume fractions of the main minerals are obtained. Quartz, muscovite and chlorite are the main phases of the samples (Table 4).
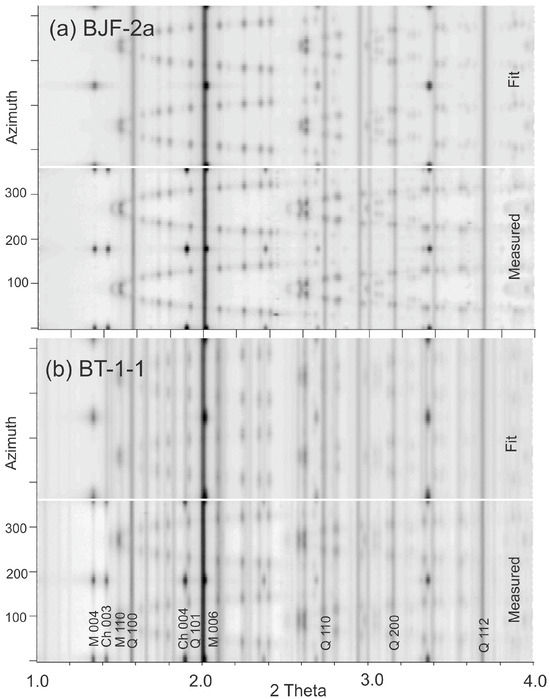
Figure 7.
“Unrolled” diffraction image of sample BJF-2a (a) and BT-1-1 (b) in MAUD, plotting azimuthal intensities as function of 2-Theta. This corresponds to a stack of 72 integrated diffraction patterns for one image. Some diffraction peaks are labeled. Experimental data are on the bottom and the Rietveld fit is at the top.
Table 4.
Volume fraction of each mineral (%) quantified by synchrotron X-ray diffraction Rietveld analysis. Standard deviations of volume fractions in parentheses (last digit).
The quartz contents in BJF-2b and MD-17 are the highest, exceeding 60%. HBX has the highest white mica content (51.5%). BJF-2a contains the most chlorite (17.0%). Additionally, some samples contain albite, apatite, calcite, biotite, and orthoclase.
The refined crystallographic preferred orientation functions (ODFs) are then processed with the BEARTEX software [51] (https://seismo.berkeley.edu/~wenk/TexturePage/beartex.htm) to calculate and plot pole-figures (Figure 8, Figure 9, Figure 10 and Figure 11). The sample is rotated so that the normal of the cleavage plane (Z-axis) is located at the center of the pole-figure. If there is a banded distribution, the band is perpendicular to the X-axis of the pole-figure, i.e., perpendicular to the lineation. The pole density values in the ODF and the pole-figures are expressed as multiples of random distribution (mrd), where 1 mrd corresponds to an isotropic distribution (no preferred orientation), and ∞ corresponds to a single crystal (Table 5). Pole-figures are represented in equal area projections on the cleavage plane (XY). This projection method is used to minimize the distortion of the dominant (001) maximum, which is located in the center, and to show any deviations from axial symmetry (Table 5).
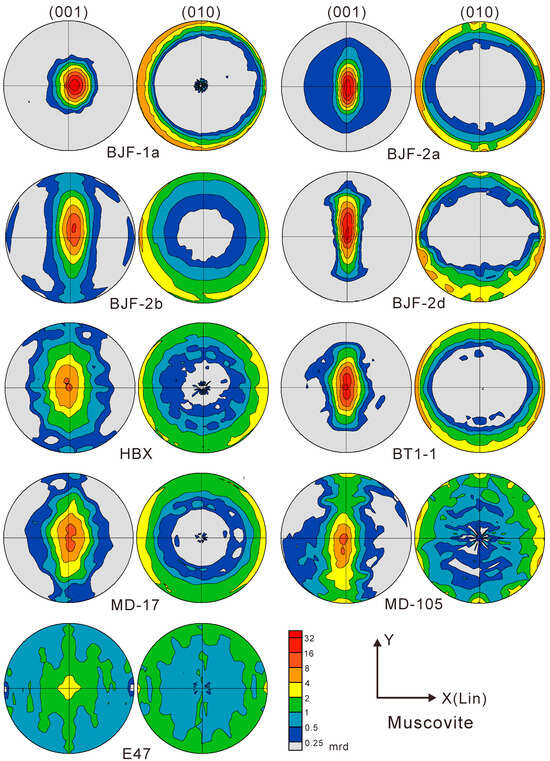
Figure 8.
Pole figures of muscovite. Equal area projection on cleavage plane. Contours in mrd, logarithmic scale. Coordinates X (lineation) and Y are indicated.
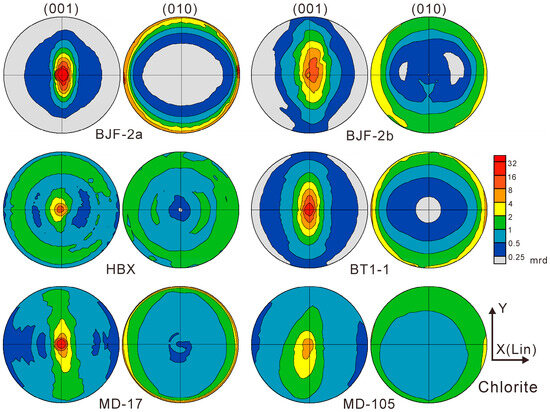
Figure 9.
Pole figures of chlorite. Equal area projection on cleavage plane. Contours in mrd, logarithmic scale. Coordinates X (lineation) and Y are indicated.
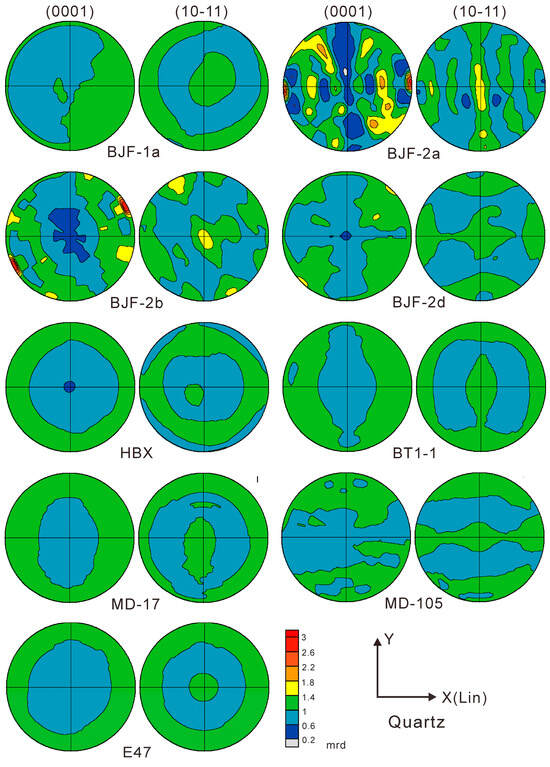
Figure 10.
Pole figures of quartz. Equal area projection on cleavage plane. Contours in mrd, linear scale. Coordinates X (lineation) and Y are indicated.
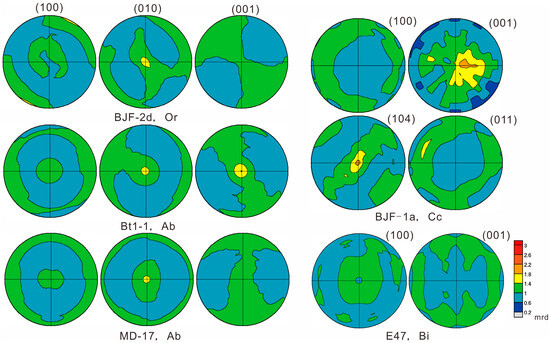
Figure 11.
Pole figures of orthoclase, albite, calcite, and biotite. Equal area projection on cleavage plane. Contours in mrd, linear scale.
Table 5.
Pole densities of crystals in different samples: (001) pole figure minima and maxima in mrd.
The maximum values of the (001) pole-figures of muscovite range from 3.9 mrd (E47) to 54.7 mrd (BT1-1). Muscovite in BJF-1a, BJF-2a, BJF-2d, and BT1-1 has strongest preferred orientation. For chlorite, the maximum values of the (001) pole-figures range from 7.3 mrd (MD105) to 104.4 mrd (BJF-2a). The (001) pole-figures of muscovite (Figure 8) and chlorite (Figure 9) show significant bending around the x-axis (lineation).
The CPOs of quartz (Figure 10), orthoclase, albite, calcite, and biotite are very weak (Figure 11). The maximum values of the (0001) pole-figures of quartz range from 1.1 mrd to 2.9 mrd, without obvious CPO. This is different from SPO where the major/minor ratio of quartz ranges from 1.83 to 6.33, documenting elongated characteristics, but the CPO is not directional (Table 3).
Slate is formed by the low-grade regional metamorphism of original rocks such as argillaceous rocks, silty rocks, or intermediate-acid tuffs, and its metamorphic temperature is usually between 150 and 400 °C [41]. Quartz in slate can be formed either by the recrystallization of residual siliceous particles from the protolith or by the crystallization of siliceous solutions introduced at a later stage. During recrystallization of residual quartz from the protolith (e.g., siltstone), quartz undergoes static recrystallization during low-grade metamorphism (under conditions of weak or non-directional stress) [15,16,17,18]. Fine-grained quartz particles regrow, but the absence of strong stress-driven forces results in a lack of oriented alignment. Precipitation from late-stage siliceous solutions suggests that silica-rich fluids precipitate and crystallize in interlayer fractures to form flattened quartz. Such fluid precipitation mostly occurs in environments with weak stress. Moreover, the three-dimensional framework structure of quartz enables its crystallization without being forced into directional alignment by applied stress, thus exhibiting a random orientation [18,52].
Muscovite and chlorite are newly crystallized or recrystallized during the metamorphic process. Muscovite is mostly formed by the metamorphic transformation of clay minerals and feldspar in the original rock, while chlorite is formed by the metamorphism of clay minerals and ferromagnesian minerals in the original rock. Under the action of directional stress and temperature, they grow perpendicular to the direction of maximum compression [52]. Therefore, muscovite and chlorite have strong preferred orientations.
5. Elastic Anisotropy
Based on crystal preferred orientation and volume fractions of components obtained in the Rietveld refinement, we can calculate bulk elastic properties and seismic velocities of Chinese slates. This was performed with the software BEARTEX 5.3 [49] by first averaging single crystal stiffness tensors over the orientation distributions of mineral phases using a geometric mean that obeys the statistically important group principle [53,54]. Here, we are not taking grain shape into account. A self-consistent averaging model has documented that the contribution of grain shapes to anisotropy in slates is minimal [18].
For single crystal stiffness tensors at ambient conditions, we used ref. [55] for muscovite, ref. [56] for chlorite, ref. [57] for quartz, ref. [58] for calcite, ref. [59] for albite, ref. [60] for orthoclase, and ref. [61] for biotite under ambient conditions (Table 6).
Table 6.
Elastic stiffness tensors of single crystals (MPa) with references to source.
Elastic properties of textured individual phases were then combined, taking volume fractions into account (Table 4), and averaged stiffness tensors for all samples are displayed in Table 7. Subsequently, seismic velocities (compressional (Vp) and shear-wave splitting (dVs)) in different directions were calculated and represented as pole-figures in the same coordinates as crystallographic pole-figures (Figure 8, Figure 9, Figure 10 and Figure 11) in Figure 12. For easier comparison, the same density (2.75 g/cm3) was assumed for all samples. Figure 12 also shows Vp anisotropy (An% = (200(Pmax Vpmax − Vpmin)/(Vpmax + Vpmin)) and maximum shear-wave splitting (dVs). P-wave anisotropies range from 28.4% (BJF-1a) to 7.2% (MD-105), which can be attributed to sheet silicate content (muscovite and chlorite, with high alignment, Figure 4 and Figure 5) and high elastic anisotropy. Samples with low anisotropy such as MD-105 have only 29% muscovite+chlorite, E47 38%, and MD-17 27%. For shear-wave splitting pole-figures, the fast polarization direction is also indicated as black lines in Figure 12. Shear-wave splitting ranges from 948 m/s (BJF-1a) to 229 m/s (MSD-15).
Table 7.
Chinese Slate. Elastic stiffness tensors (GPa). Arithmetic mean over all phases. Same coordinate system as pole figures in Figure 12.
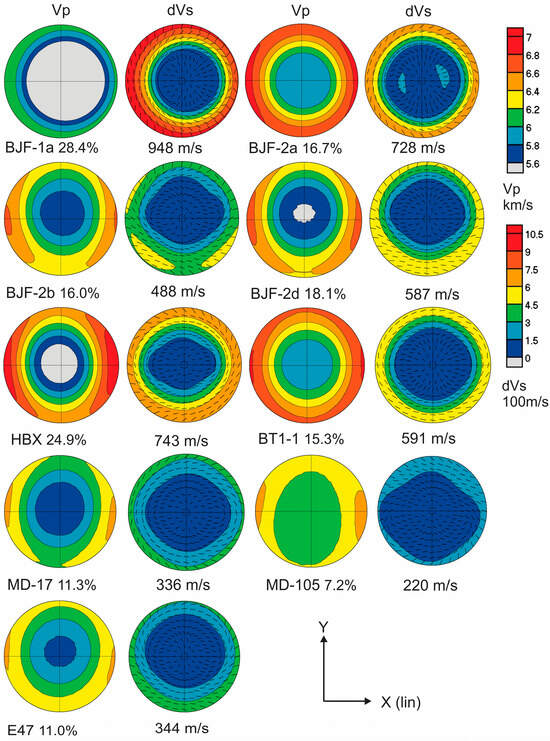
Figure 12.
P and dS velocities as function of direction, equal area projection on the cleavage plane. For dVs, lines indicate polarization of the fast S-wave. P-wave anisotropy coefficients values (%) and maximum shear-wave splitting values are given below the pole figures. Same orientation as CPO pole-figures (Figure 8, Figure 9, Figure 10 and Figure 11). Coordinates X (lineation) and Y are indicated.
6. Discussion
In the (001) pole figures of muscovite and chlorite in Chinese slates, concentric elliptical distortion can be observed, indicating that these samples have not only been subjected to axial compression but also experienced planar strain. There is stretching and simple shear in the direction of the lineation, which is similar to the (001) pole figures of Spanish slates [18].
BT1-1, MD-17, and MD-105 are located in the Solonker Suture Zone. This area was influenced by the Hercynian movement (also known as Variscan movement) that occurred during the Middle-Late Permian period. It was subjected to a compressive stress in the north–south direction. The continental plates on both sides of the Paleo-Asian Ocean moved towards each other, leading to the gradual closure of the ocean basin. During this process, the rocks underwent deformation and metamorphism [31]. Planar strain occurred perpendicular to the direction of compression. The mineral grains in the rocks were flattened and elongated, and they were arranged in a directional manner, forming a schistosity structure [62]. During the Early Triassic, the Solonker Suture Zone retained residual north–south compressive stress—consistent with the late-stage tectonic inheritance of the Permian Paleo-Asian Ocean closure. By the mid-to-late Early Triassic, this stress regime gradually transitioned to a mixed state characterized by coexisting regional extensional stress and local compressive stress [63]. It further enhanced the degree of axial compression and planar strain of the slate. In the Middle-Late Triassic, influenced by the long-distance effect of the Paleo-Pacific tectonic domain, the stress direction was rather complex. There were both near east–west extensional stresses generated due to the crustal thickening and lithospheric adjustment after plate collision, and NNE-SSW or NE-SW compressive stresses resulting from the westward subduction of the Paleo-Pacific Ocean [64,65]. It was mainly manifested as the modification of existing structures and the adjustment of the local stress field [66,67]. Locally, the slate could be stretched along certain directions, causing the mineral grains in the rocks to be elongated in the stretching direction and forming a lineation structure. At the same time, due to the interaction of stresses in different directions and the heterogeneity of the internal structure of the rocks, the slate would also undergo simple shear deformation, leading to the dislocation and rotation of the mineral grains in the rocks, which further changed the internal structure and structural characteristics of the slate.
E47 with weak CPO is from the Bainaimiao Belt [68], adjacent to the northern margin of the North China Plate (Figure 1a). Its geotectonic setting is related to continental island arcs and active continental margins, and it is a sediment in the back-arc basin [69]. Sample E47 was collected from the Elitu Formation of the Early Permian (Figure 1c). The CPOs of muscovite and chlorite in this sample are weak, suggesting that the influence of the Middle-Late Permian Hercynian movement on this stratum is relatively weak. Without strong tectonic stress, it is difficult for the rocks to undergo large-scale deformation and metamorphism.
BJF-1a, BJF-2a, BJF-2b, BJF-2d, and HBX were collected from the North China Craton (Figure 1a). Among the studied samples, sample BJF-1a is stratigraphically assigned to the Late Paleozoic era, and the subsequent four samples (BJF-2a, BJF-2b, BJF-2d, and HBX) were collected from Neoproterozoic strata. During the Paleozoic era, the NCC experienced a prominent marginal orogeny event. This orogeny was closely associated with the subduction and collision of the Paleo-Asian Ocean plate (to the north of the craton) and the Yangtze Craton plate (to the south) with the NCC. Driven by this orogenic process, the NCC was subjected to persistent NW-SE to E-W trending compressive stress [70]. In the early Mesozoic era, influenced by the westward subduction of the Paleo-Pacific Plate, the eastern part of the NCC was in a compressive environment, and the stress direction was mainly in the NNE-SSW direction [71,72,73]. The rocks were affected by compressive stress and shear stress, causing the minerals to be arranged perpendicular to the stress direction, thus forming a schistosity structure. BJF-1a, BJF-2a, BJF-2b, and BJF-2d were collected from the Zhoukoudian area in Beijing (Figure 1d). Previous studies, based on the variation trend of the illite crystallinity in this area [74], combined with geophysical data, speculated that the uplift of the concealed rock mass in the Early Mesozoic era led to softening and extension of the overlying strata. Eventually, the uplift of the Fangshan rock mass led to the final formation of the structural pattern of the Zhoukoudian metamorphic core complex and played a role in tectonically transforming the pre-existing regionally metamorphosed rocks around it [75]. Later, the protolith was subjected to compression (acting in a NW-SE direction, aligned with the late Paleozoic to Mesozoic stress regime of the North China Craton margin), stretching (dominated by NE-SW trending stretching and linked to the post-orogenic extensional setting of the North China Craton during the Late Cretaceous), and shearing (NE-SW trend) [74,75], which is consistent with the observed axial compression and planar strain developed in the slates described in this paper. The fabric observed in microstructures developed by recrystallization under strain at greenschist facies conditions, similar to slates from Brazil, the Belgian Ardennes, California and Spain [9,17,18].
Slate anisotropy described here is comparable with data from northern Spain [18] and the Belgian Ardennes [17]. It likely contributes significantly to observed seismic anisotropy observed in the continental crust of northern China that has been explored in great detail, both with P-waves [76,77,78,79,80] and with shear-wave splitting [78,81,82,83,84,85]. Observed shear wave splitting in the crust is 0.2–0.6 km/s (e.g., Figure 12 in [78]). Slates like BJF with maximum dVs~1 km/s, BJF-2a ~0.7 km/s and HBX ~0.7 km/s (Figure 12) are likely rock components that significantly contribute to recorded seismic anisotropy in northern China.
7. Conclusions
Research on slates from the Central Asian Orogenic Belt (CAOB) and the North China Craton (NCC) in northern China indicates that their main mineral components are quartz, muscovite, and chlorite. Among these, samples BJF-1a and BJF-2d from Zhoukoudian (NCC) and sample E47 from the Elitu Formation (CAOB) contain almost no chlorite. Some slates also include albite, apatite, calcite, biotite, or orthoclase. Muscovite, chlorite, and quartz exhibit an elongated geometric orientation and, with scanning electron microscopy (SEM) and digital crystal size distribution analysis, show evidence of axial compression and plane strain features, attributed to the protolith being subjected to compressive, tensile, and shear forces. Synchrotron diffraction and Rietveld analysis reveals that muscovite and chlorite exhibit very strong crystal preferred orientations, whereas quartz in slates shows a random orientation. Consequently, the higher the quartz content, the lower the overall anisotropy of the slate. With these data, elastic anisotropy of the Chinese slates has been calculated and should be considered in future seismic modeling.
Author Contributions
All authors contributed to the experiments, data analysis, writing, and revision of the manuscript. J.H. collected the samples, performed SEM analyses, and conducted Rietveld data analysis to obtain quantitative texture information. H.-R.W. was responsible for writing the section on elastic anisotropy, preparing the corresponding figures, and revising the entire manuscript. M.D. assisted in preparing the rock thin sections and conducted synchrotron experiments at APS. All authors have read and agreed to the published version of the manuscript.
Funding
This research was funded by Langfang Science and Technology Support Program (2022011035) for J. Huang and by DOE grant DE-FG02-ER15637 and NSF 2154351 for H.-R. Wenk.
Data Availability Statement
The data presented in this study are available on request from the corresponding author. The data are not publicly available due to ethical and legal concerns.
Acknowledgments
We acknowledge access to beamline 11-ID-C of the Advanced Photon Source at Argonne National Laboratory and supported by DOE Office of Science under Contract No. DE-AC02-06CH11357 and help from beamline scientist Olaf Borkiewitz, and the Zeiss EVO scanning electron microscope at EPS, UC Berkeley, supported by NSF grant 2154351. We thank John Grimsich for assistance with preparing of slate thin sections and help with the SEM. We are grateful to MDPI for inviting us to submit this manuscript, the editorial and technical staff of MDPI and three anonymous reviewers for valuable comments that helped us to improve the manuscript. Thanks to Tengjian Li for his help in the collection of samples in Zhoukoudian, Beijing. J.H is grateful for hospitality during her research leave at the University of California.
Conflicts of Interest
The authors declare no conflicts of interest.
References
- Twiss, R.J.; Moores, E.M. Structural Geology; W.H. Freeman and Company: New York, NY, USA, 2006; pp. 55–78. [Google Scholar]
- Marshak, S. Essentials of Geology; W. W. Norton & Company: New York, NY, USA, 2016; pp. 65–96. [Google Scholar]
- Fossen, H. Structural Geology; Cambridge University Press: Cambridge, UK, 2016; pp. 77–105. [Google Scholar]
- Sun, B.; Ren, F.; Wang, H. Experimental investigation on anisotropic characteristics of carbonaceous slate under uniaxial compression. Environ. Earth Sci. 2022, 81, 405. [Google Scholar] [CrossRef]
- Ding, C.; Hu, D.; Zhou, H.; Lu, J.; Lv, T. Investigations of P-Wave velocity, mechanical behavior and thermal properties of anisotropic slate. Int. J. Rock Mech. Min. Sci. 2020, 127, 104176. [Google Scholar] [CrossRef]
- Cárdenes, V.; Rubio-Ordoñez, A.; Wichert, J.; Cnudde, J.P.; Cnudde, V. Petrography of roofing slates. Earth Sci. Rev. 2014, 138, 435–453. [Google Scholar] [CrossRef]
- Cárdenes, V.; Ponce de León, M.; Rodríguez, X.A.; Rubio-Ordoñez, A. Roofing slate industry in Spain: History, geology, and geoheritage. Geoheritage 2019, 11, 19–34. [Google Scholar] [CrossRef]
- Sun, J. The characteristics of black roofing slate deposit in Western Hubei. Chin. Non-Met. Min. Ind. Her. 2010, 2, 52–53. [Google Scholar]
- Chiodi Filho, C.; Rodrigues, E.; Artur, A.C. Ardosias de Minas Gerais, Brasil: Caracteristicas geologicas petrograficas e quimicas. Geociencias 2003, 22, 119–127. [Google Scholar]
- Sorby, H.C. On the origin of slaty cleavage. New Philos. J. 1853, 55, 137–148. [Google Scholar] [CrossRef]
- Sorby, H.C. On the theory of the origin of slaty cleavage. Philos. Mag. 1856, 12, 127–129. [Google Scholar] [CrossRef]
- Oertel, G.; Curtis, C.D. Clay ironstone concretion preserving fabrics due to progressive compaction. Geol. Soc. Am. Bull. 1972, 83, 2597–2606. [Google Scholar] [CrossRef]
- Weber, K. Kinematic and metamorphic aspects of cleavage formation in very low-grade metamorphic slates. Tectonophysics 1981, 78, 291–306. [Google Scholar] [CrossRef]
- Kamil, S.; Tomáš, D.; Martin, V.; Jiří, B. Utilisation of X-Ray computed microtomography for evaluation of iron sulphide distribution in roofing slate. EGU Gen. Assem. 2016, 18, 2779. [Google Scholar]
- Cárdenes, V.; López-Sánchez, M.A.; Barou, F.; Olona, J.; Llana-Fúnez, S. Crystallographic preferred orientation, seismic velocity and anisotropy in roofing slates. Tectonophysics 2021, 808, 228815. [Google Scholar] [CrossRef]
- Wenk, H.-R.; Kanitpanyacharoen, W.; Ren, Y. Slate—A new record for crystal preferred orientation. J. Struct. Geol. 2019, 125, 319–324. [Google Scholar] [CrossRef]
- Wenk, H.-R.; Yu, R.; Cardenes, V.; Lopez-Sanchez, M.A.; Sintubin, M. Review: Fabric and anisotropy of slates: From classical studies to new results. J. Struct. Geol. 2020, 138, 104066. [Google Scholar] [CrossRef]
- Wenk, H.-R.; Huang, J.; Devoe, M.; Gómez-Barreiro, J.; Vasin, R.; Ren, Y.; Barrios-Sánchez, S. Crystallographic and shape preferred orientation producing anisotropy in slates from Northern Spain. J. Struct. Geol. 2022, 164, 104730. [Google Scholar] [CrossRef]
- Liu, Y.; Fu, H.; Rao, J. Research on brazilian disc splitting tests for anisotropy of slate under influence of different bedding orientations. Chin. J. Rock Mech. Eng. 2012, 31, 785–791. [Google Scholar]
- Zhu, Y.; Wang, X.; Liu, B.; Xue, H. The anisotropic time-dependent properties and constitutive model analysis of carbonaceous slate with different foliation angles. Appl. Sci. 2025, 15, 236. [Google Scholar] [CrossRef]
- Guo, B.; Wang, H.; Zhao, W.; Ji, S.; Sun, D.; Li, A.; Long, C. Analysis of seismic anisotropy of slate and its application. Chin. J. Geophys. 2014, 57, 837–846, (In Chinese with English abstract). [Google Scholar]
- Zhang, B.; Liu, C.; Yang, Z.; Qin, Y.; Li, M. Shear Wave Velocity Estimation for Shale with Preferred Orientation Clay Minerals. Minerals 2025, 15, 738. [Google Scholar] [CrossRef]
- Deng, T.; Huang, B.; Yang, L. Anisotropy comparison of P wave and S wave velocity for compacted rocks. Rock Soil Mech. 2007, 3, 493–498, (In Chinese with English abstract). [Google Scholar]
- Zhang, S.; Gao, R.; Li, H.; Hou, H.; Wu, H.; Li, Q.; Yang, K.; Li, C.; Li, W.; Zhang, J.; et al. Crustal structures revealed from a deep seismic reflection profile across the Solonker suture zone of the Central Asian Orogenic Belt, northern China: An integrated interpretation. Tectonophysics 2014, 612, 26–39. [Google Scholar] [CrossRef]
- Xiao, W.; Windley, B.F.; Hao, J.; Zhai, M. Accretion leading to collision and the Permian Solonker suture, Inner Mongolia, China: Termination of the central Asian orogenic belt. Tectonics 2003, 22, 1069. [Google Scholar] [CrossRef]
- Chen, C.; Zhang, Z.; Guo, S.; Li, J.; Feng, Z.; Tang, W. Geochronology, geochemistry, and its geological significance of the Permian Mandula mafic rocks in Damaoqi, Inner Mongolia. Sci. China Earth Sci. 2012, 55, 39–52, (In Chinese with English abstract). [Google Scholar] [CrossRef]
- Wang, B.; Shi, L.; Ruan, Z.; Cui, X.; Luo, L. Sedimentary Characteristics of Elitu formation in Zhengxiangbai Qi of Inner Mongolia identified by Markov chain analysis. Geol. Res. 2023, 32, 21–30, (In Chinese with English abstract). [Google Scholar]
- Yuan, D.; Li, D.; Chen, Q.; Zeng, P.; Xu, Q. Geochronology and geochemical characteristics of amphibolite in Guandi Complex, Zhoukoudian area and its geological significance. Northwest Geol. 2016, 49, 149–164, (In Chinese with English abstract). [Google Scholar]
- Zhou, T.; Liu, Y.; Guan, Q.; Liu, B.; Xiao, W.; Li, S.; Chen, Z.; Peskov, A.Y. Tectonic evolution of the eastern Central Asian Orogenic Belt during the Carboniferous–Permian. Earth-Sci. Rev. 2025, 262, 105046. [Google Scholar] [CrossRef]
- Liu, Y.; Li, W.; Feng, Z.; Wen, Q.; Neubauer, F.; Liang, C. A review of the Paleozoic tectonics in the eastern part of Central Asian Orogenic Belt. Gondwana Res. 2017, 43, 123–148. [Google Scholar] [CrossRef]
- Li, H.; Zhou, J.; Wilde Simon, A. Nature and development of the South Tianshan-Solonker suture zone. Earth Sci. Rev. 2022, 233, 104189. [Google Scholar] [CrossRef]
- Han, J.; Zhou, J.; Wang, B.; Cao, J.-L. The final collision of the CAOB: Constraint from the zircon U–Pb dating of the Linxi Formation, Inner Mongolia. Geosci. Front. 2015, 6, 211–225. [Google Scholar] [CrossRef]
- Du, J.; Qian, C.; Wu, W.; Zhang, Y.; Zhang, C.; Qin, T.; Ma, Y.; You, H. Discovery of ~2.5 Ga zircon U-Pb age from the diabase, Ar Horqin Banner Area, Inner Mongolia: Implications for Neoarchean crystalline basement of Bainaimiao Arc Belt. China Geol. 2023, 6, 531–532. [Google Scholar] [CrossRef]
- Song, H.; Shan, W.; Fu, Z. Structural Analysis of Zhoukoudian Area in Beijing. Geosci. Front. 1995, 2, 246–247. (In Chinese) [Google Scholar]
- Yang, Z.; Chen, Y.; Wang, H. The Geology of China, 3rd ed.; Clarendon Press: Oxford, UK, 1986; pp. 10–116. [Google Scholar]
- Chen, J. Hebei Yixian natural slate association established. China Building Materials News, 3 August 2006; p. 1. (In Chinese) [Google Scholar]
- Wen, B. Beijing slate is popular overseas. China Construction News, 24 March 2001; p. 11. (In Chinese) [Google Scholar]
- Cashman, K.V.; Ferry, J.M. Crystal size distribution (CSD) in rocks and the kinetics and dynamics of crystallization Ⅲ: Metamorphic crystallization. Contrib. Mineral. Petr. 1988, 99, 401–415. [Google Scholar] [CrossRef]
- Randolph, A.D.; White, E.T. Modeling size dispersion in the prediction of crystal-size distribution. Chem. Eng. Sci. 1977, 32, 1067–1076. [Google Scholar] [CrossRef]
- Marsh, B.D. Crystal size distribution (CSD) in rocks and the kinetics and dynamics of crystallization: Ⅰ. Theory. Contrib. Mineral. Petr. 1988, 99, 277–291. [Google Scholar] [CrossRef]
- Akker, I.V.; Berger, A.; Schrank, C.E.; Jones, M.W.; Kewish, C.M.; Klaver, J.; Herwegh, M. The evolution of slate microfabrics during progressive accretion of foreland basin sediments. J. Struct. Geol. 2021, 150, 104404. [Google Scholar] [CrossRef]
- Higgins, M.D. Measurement of crystal size distributions. Am. Mineral. 2000, 85, 1105–1116. [Google Scholar] [CrossRef]
- Higgins, M.D. Verification of ideal semi-logarithmic, log-normal or fractal crystal size distributions from 2D datasets. J. Volcanol. Geotherm. Res. 2006, 154, 8–16. [Google Scholar] [CrossRef]
- Yang, Z.; Li, J.; Jiang, X.; Qu, L.; Yuan, Y.; Li, Y.; Peng, H.; Rao, T.; Ma, B.; Xu, Z. Two dimensional quantitative analysis method for igneous rock structure. Geosci. Front. 2020, 27, 23–38, (In Chinese with English abstract). [Google Scholar]
- Caglioti, G.; Paoletti, A.; Ricci, F.P. Choice of collimators for a crystal spectrometer for neutron diffraction. Nucl. Instrum. Meth. A 1958, 3, 223–228. [Google Scholar] [CrossRef]
- Rietveld, H.M. A profile refinement method for nuclear and magnetic structures. J. Appl. Cryst. 1969, 2, 65–71. [Google Scholar] [CrossRef]
- Lutterotti, L.; Matthies, S.; Wenk, H.-R.; Schultz, A.J.; Richardson, J.W. Combined texture and structure analysis of deformed limestone from time-of-flight neutron diffraction spectra. J. Appl. Phys. 1997, 81, 594–600. [Google Scholar] [CrossRef]
- Lutterotti, L.; Vasin, R.; Wenk, H.-R. Rietveld texture analysis from synchrotron diffraction images. I. Calibration and basic analysis. Powder Diffr. 2014, 29, 76–84. [Google Scholar] [CrossRef]
- Wenk, H.-R.; Lutterotti, L.; Kaercher, P.; Kanitpanyacharoen, W.; Miyagi, L.; Vasin, R. Rietveld texture analysis from synchrotron diffraction images: II. Complex multiphase materials and diamond anvil cell experiments. Powder Diffr. 2014, 29, 220–232. [Google Scholar] [CrossRef]
- Matthies, S.; Wenk, H.-R. Transformations for monoclinic crystal symmetry in texture analysis. J. Appl. Cryst. 2009, 42, 564–571. [Google Scholar] [CrossRef]
- Wenk, H.-R.; Matthies, S.; Donovan, J.; Chateigner, D. BEARTEX: A Windows-based program system for quantitative texture analysis. J. Appl. Cryst. 1998, 31, 262–269. [Google Scholar] [CrossRef]
- Haerinck, T.; Wenk, H.-R.; Debacker, T.N.; Sintubin, M. Preferred mineral orientation of a chloritoid-bearing slate in relation to its magnetic fabric. J. Struct. Geol. 2015, 71, 125–135. [Google Scholar] [CrossRef]
- Matthies, S.; Humbert, M. On the principle of a geometric mean of even-rank symmetric tensors for textured polycrystals. J. Appl. Cryst. 1995, 28, 254–266. [Google Scholar] [CrossRef]
- Matthies, S.; Priesmeyer, H.G.; Daymond, M.R. On the diffractive determination of single-crystal elastic constants using polycrystalline samples. J. Appl. Cryst. 2001, 34, 585–601. [Google Scholar] [CrossRef]
- Vaughan, M.T.; Guggenheim, S. Elasticity of muscovite and its relationship to crystal structure. J. Geophys. Res. 1986, 91, 4657–4664. [Google Scholar] [CrossRef]
- Mookherjee, M.; Mainprice, D. Unusually large shear wave anisotropy for chlorite in subduction zone settings. Geophys. Res. Lett. 2014, 41, 1506–1513. [Google Scholar] [CrossRef]
- Heyliger, P.; Ledbetter, H.; Kim, S. Elastic constants of natural quartz. J. Acoust. Soc. Am. 2003, 114, 644–650. [Google Scholar] [CrossRef] [PubMed]
- Chen, C.-C.; Lin, C.C.; Liu, L.-G.; Sinogeikin, S.V.; Bass, J.D. Elasticity of single crystal calcite and rhodochrosite by Brillouin spectroscopy. Am. Min. 2001, 86, 1525–1529. [Google Scholar] [CrossRef]
- Brown, J.M.; Angel, R.J.; Ross, N.L. Elasticity of plagioclase feldspars. J. Geophys. Res. 2016, 121, 663–675. [Google Scholar] [CrossRef]
- Waeselmann, N.; Brown, J.M.; Angel, R.J.; Ross, N.; Zhao, J.; Kamensky, W. The elastic tensor of monoclinic alkali feldspars. Am. Min. 2016, 101, 1228–1231. [Google Scholar] [CrossRef]
- Chheda, T.D.; Mookherjee, M.; Mainprice, D.; dos Santos, A.; Molaison, J.J.; Chantel, J.; Manthilake, G.; Bassett, W. Structure and elasticity of phlogopite under compression: Geophysical implications. Phys. Earth Planet. Int. 2014, 233, 1–12. [Google Scholar] [CrossRef]
- Fu, D.; Huang, B.; Kusky, T.M.; Li, G.; Wilde, S.A.; Zhou, W.; Yu, Y. A Middle Permian ophiolitic mélange belt in the Solonker suture zone, Western Inner Mongolia, China: Implications for the evolution of the Paleo-Asian Ocean. Tectonics 2017, 37, 1292–1320. [Google Scholar] [CrossRef]
- Zhang, H.; Liu, J.; Yang, J.; Ge, J.; Wang, J.; Li, Z. Testing final closure time of the Paleo-Asian Ocean along the Solonker suture by a transition of compressional and extensional setting. Geosci. Front. 2020, 11, 1935–1951. [Google Scholar] [CrossRef]
- Li, K.; Jolivet, M.; Zhang, Z.; Li, J.; Tang, W. Long-term exhumation history of the Inner Mongolian Plateau constrained by apatite fission track analysis. Tectonophysics 2016, 666, 121–133. [Google Scholar] [CrossRef]
- Eizenhöfer, P.R.; Zhao, G.; Zhang, J.; Sun, M. Final closure of the Paleo-Asian Ocean along the Solonker Suture Zone: Constraints from geochronological and geochemical data of Permian volcanic and sedimentary rocks. Tectonics 2014, 33, 441–463. [Google Scholar] [CrossRef]
- Song, D.; Xiao, W.; Ao, S.; Mao, Q.; Wan, B.; Zeng, H. Contemporaneous closure of the Paleo-Asian Ocean in the Middle-Late Triassic: A synthesis of new evidence and tectonic implications for the final assembly of Pangea. Earth-Sci. Rev. 2024, 253, 104771. [Google Scholar] [CrossRef]
- Xue, F.; Santosh, M.; Kim, S.W. Differential lithospheric evolution during craton destruction: Insights from Mesozoic mafic magmatic suites with transitional features in the North China Craton. Gondwana Res. 2025, 139, 118–135. [Google Scholar] [CrossRef]
- Windley, B.F.; Alexeiev, D.; Xiao, W.; Kröner, A.; Badarch, G. Tectonic models for accretion of the Central Asian Orogenic Belt. J. Geol. Soc. Lond. 2007, 164, 31–47. [Google Scholar] [CrossRef]
- Zhang, Q.; Zhang, S.; Zhao, Y.; Hu, G. Compositionally variable basement and tectonic affinity of the Bainaimiao arc belt: Implications for crustal growth of the Central Asian Orogenic Belt. J. Asian Earth Sci. 2024, 263, 106009. [Google Scholar] [CrossRef]
- Zhai, M.; Santosh, M. Metallogeny of the North China Craton: Link with secular changes in the evolving Earth. Gondwana Res. 2013, 24, 275–297. [Google Scholar] [CrossRef]
- Zhao, Y.; Cui, S.; Guo, T.; Xu, G. Evolution of a Jurassic basin of the Western Hills, Beijing North China and its tectonic implications. Geol. Bull. China 2002, 21, 211–217, (In Chinese with English abstract). [Google Scholar]
- Hao, W.; Zhu, G.; Zhu, R. Timing of the Yanshan Movement: Evidence from the Jingxi Basin in the Yanshan fold-and-thrust belt, eastern China. Int. J. Earth Sci. 2019, 108, 1961–1978. [Google Scholar] [CrossRef]
- Zhai, M.; Shao, J.; Hao, J.; Peng, P. Geological Signature and Possible Position of the North China Block in the Supercontinent Rodinia. Gondwana Res. 2003, 6, 171–183. [Google Scholar] [CrossRef]
- He, B.; Xu, Y.-G.; Paterson, S. Magmatic diapirism of the Fangshan pluton, southwest of Beijing, China. J. Struct. Geol. 2009, 31, 615–626. [Google Scholar] [CrossRef]
- Yan, J.; Cui, Y.; Liu, X. Evolution of contact-metamorphic rocks in the Zhoukoudian area: Evidence from phase equilibrium modelling. Minerals 2023, 13, 1056. [Google Scholar] [CrossRef]
- Cheng, C.; Chen, L.; Yao, H.; Jiang, M.; Wang, B. Distinct variations of crustal shear wave velocity structure and radial anisotropy beneath the North China Craton and tectonic implications. Gondwana Res. 2013, 23, 25–38. [Google Scholar] [CrossRef]
- Fu, Y.V.; Chen, Y.J.; Li, A. Seismic anisotropy beneath the Chinese mainland. Earthq. Sci. 2010, 23, 583–595. [Google Scholar] [CrossRef][Green Version]
- Fu, Y.V.; Gao, Y.; Li, A.; Lu, L.; Shi, Y.; Zhang, Y. The anisotropic structure in the crust in the northern part of North China from ambient seismic noise tomography. Geophy. J. Int. 2016, 204, 1649–1661. [Google Scholar] [CrossRef]
- Gao, Y.; Wu, J.; Yi, G.; Shi, Y. Crust-mantle coupling in North China: Preliminary analysis from seismic anisotropy. Chin. Sci. Bull. 2010, 55, 3599–3605. [Google Scholar] [CrossRef]
- Gao, Y.; Wu, J.; Fukao, Y.; Shi, Y.; Zhu, A. Shear-wave splitting in the crust in North China: Stress, faults and tectonic implications. Geophys. J. Int. 2011, 187, 642–654. [Google Scholar] [CrossRef]
- Chang, L.; Wang, C.; Ding, Z. Upper mantle anisotropy beneath North China from shear wave splitting measurements. Tectonophysics 2012, 552–553, 235–242. [Google Scholar] [CrossRef]
- Fu, Y.V.; Gao, Y.; Li, A.; Shi, Y. Lithospheric shearwave velocity and radial anisotropy beneath the northern part of North China from surface wave dispersion analysis. Geochem. Geophys. Geosyst. 2015, 16, 2619–2636. [Google Scholar] [CrossRef]
- Iidaka, T.; Niu, F. Mantle and crust anisotropy in the eastern China region inferred from waveform splitting of SKS and PpSms. Earth Planets Space 2001, 53, 159–168. [Google Scholar] [CrossRef]
- Liu, K.H.; Gao, S.S.; Gao, Y.; Wu, J. Shear wave splitting and mantle flow associated with the deflected Pacific slab beneath northeast Asia. J. Geophys. Res. 2008, 113, B01305. [Google Scholar] [CrossRef]
- Zhao, L.; Zheng, T. Using shear wave splitting measurements to investigate the upper mantle anisotropy beneath the North China Craton: Distinct variation from east to west. Geophys. Res. Lett. 2005, 32, L10309. [Google Scholar] [CrossRef]
Disclaimer/Publisher’s Note: The statements, opinions and data contained in all publications are solely those of the individual author(s) and contributor(s) and not of MDPI and/or the editor(s). MDPI and/or the editor(s) disclaim responsibility for any injury to people or property resulting from any ideas, methods, instructions or products referred to in the content. |
© 2025 by the authors. Licensee MDPI, Basel, Switzerland. This article is an open access article distributed under the terms and conditions of the Creative Commons Attribution (CC BY) license (https://creativecommons.org/licenses/by/4.0/).