Article

Subresolution Porosity Estimation of Porous Rocks from CT Images: Incorporating X-Ray Mass Attenuation Coefficients

1
Department of Civil Engineering, School of Engineering and Technology, China University of Geosciences (Beijing), Haidian District, Beijing 100083, China
2
School of Science, Harbin Institute of Technology (Shenzhen), Shenzhen 518055, China
*
Author to whom correspondence should be addressed.
Minerals 2025, 15(9), 966; https://doi.org/10.3390/min15090966
Submission received: 1 August 2025 / Revised: 4 September 2025 / Accepted: 10 September 2025 / Published: 12 September 2025
(This article belongs to the Section Clays and Engineered Mineral Materials)

Abstract

Rock porosity is a key parameter for quantifying fluid flow properties and predicting mechanical behaviour. Although X-ray CT imaging has been widely used to estimate porosity, the accuracy of such methods is still hindered by beam energy and mineralogical heterogeneity. In this study, a methodology for the estimation of subresolution porosity is proposed, taking into account the relative relationship of X-ray mass attenuation coefficients (MACs) among minerals. The approach segments macroparticles, matrix, and macropores and calibrates their relative X-ray MAC relationships to establish the upper and lower bounds of the matrix LAC. Subresolution porosity is then estimated based on these calibrated limits. Taking Belgian Fieldstone and Bentheimer Sandstone as examples, the method described in this paper has stronger connectivity than does the binarised porosity estimation method and higher estimation accuracy than does the subresolution porosity calculation method, which does not consider the MAC. The proposed method is intended to refine the rationality of the subresolution porosity calculation and to broaden its theoretical scope of application.

1. Introduction

As a parameter that describes the pore characteristics of rock materials, porosity plays an important role in pore flow analysis [1,2] and provides an important basis for parameter discounting in rock mechanics simulations [3,4,5,6,7]. The characteristics of pore flow are influenced not only by the total porosity but also by the heterogeneity of the pore distribution [8,9,10,11]. The distribution of fine-scale porosity can provide a more accurate description of such microscopic flows, thus providing a more reliable basis for numerical simulations of processes such as fluid flow, heat transfer and mechanical analysis [12,13,14].
X-ray CT is a widely used technique for obtaining fine-scale porosity distributions [15,16]. CT is an imaging modality that utilises the disparate absorption capacities of X-rays by differing material types and densities to generate images of a subject. The contrast in CT images arises from the different X-ray attenuation capacities of materials, which can be quantified by the linear attenuation coefficient (LAC). The mass attenuation coefficient (MAC), defined as the ratio of the LAC to material density, represents an intrinsic property, independent of density. Their relationship is expressed in Equation (1).
μ l = μ m · ρ
where μ l is the LAC value, μ m is the MAC value, and ρ is the density.
Conventionally, CT data undergo a process of binarisation, wherein the scans are segmented into two distinct categories: solid space and pore space [17,18,19,20]. In principle, the binarisation process is unable to accurately represent information regarding smaller-than-resolution pores in a sample when these pores are not negligible. The treatment of subresolution pores as solid entities affects pore connectivity [21]. Conversely, the treatment of subresolution pores as complete pores results in a discrepancy between the total porosity and reality. Subresolution porosity is defined as the porosity contained within a single voxel of the CT dataset, which cannot be explicitly resolved due to the spatial resolution limit but can be inferred from greyscale mixing effects arising from the coexistence of solid and void phases. It is evident that subresolution pores, despite their minute dimensions, can function as pivotal conduits within the pore structure of porous media, including rocks, concrete mixes, and bricks [22,23,24]. In the initial phases, small pores frequently assume a pivotal role, manifesting as preferential water adsorption or chemical erosion [25,26]. There is a cross-scale challenge in overly detailed descriptions of the microstructure of porous media [27,28].
Expressing the subresolution pores in terms of the representative volume elements (REV) more fully takes into account their contribution to pore connectivity. The method takes into account the effect of fine pores without significantly affecting the macroscopic simulation results [29,30]. Subresolution porosity estimation methods have been proposed based on this idea [31,32,33]. These studies assume that the imaged rocks are monomineralic or that the mass attenuation coefficients (MACs) of different minerals are identical. Under this assumption, solid, gas, and solid–gas mixed matrices are distinguished using delayed segmentation or thresholding methods, and the subresolution porosity is then estimated on the basis of the LAC (or the equivalent greyscale values) of X-ray CT.
However, the MAC homogeneity assumption is only satisfied at low CT energies and in the absence of heavy metals [34]. As the resolution of CT becomes progressively higher and the X-ray energy increases, the percentage of the MAC difference between the macroparticles and the matrix becomes progressively larger. In this case, ignoring the MAC difference between minerals will lead to incorrect calibration of the upper LAC limit of the matrix and its corresponding lower porosity limit, which will eventually lead to a large deviation in porosity estimation.
Therefore, this paper proposes a subresolution porosity estimation method that considers the relative relationship of the X-ray MAC between minerals to improve the accuracy and extend the scope of application. The approach establishes the relative relationship between the LAC of the solid part of the matrix and that of macroparticles, determines the upper limit of the matrix LAC and its corresponding porosity, and linearly estimates subresolution porosity between the upper and lower limits of the matrix LAC. We analyse the differences in connectivity and accuracy between the proposed method, the conventional binarisation method, and a subresolution estimation method that neglects MACs. The findings provide a more refined porosity distribution for pore-scale flow simulations, thereby enabling more accurate characterisation of transport processes in heterogeneous rocks.

2. Methods

2.1. Component Segmentation

On the basis of X-ray CT data, the components of the samples were classified into 3 types: macroparticles, matrix and macropores [33]. The macropores are exclusively in the gas phase, the macroparticles are exclusively in the solid phase, and the matrix is a mixture of gas and solid phases, as shown in Figure 1. Macroparticles are usually composed of a single mineral or a few minerals and have a dense structure. The matrix is the main contributor to subresolution porosity and contains pore information that is difficult to detect directly.

2.1.1. Linear Attenuation Coefficient (LAC) Clustering

The clustering procedure based on LAC is presented in Algorithm 1.
First, representative slices are identified. By statistically analysing the range of LACs for each slice, the slices with the broadest coverage and most distinct features are selected as representative. If multiple slices meet these criteria, they are included in the clustering analysis. The clustering results of these representative slices are then applied to the compositional division of the entire 3D geometric model.
Second, a clustering analysis of the LACs of the representative slices is conducted. The LAC data of the representative slices are unfolded into a one-dimensional array. Clustering is then performed on the one-dimensional array via the k-means algorithm, with multiple iterations carried out in natural number order (with at least two clusters). The LAC range and cluster centre for each class are obtained. K-means clustering was adopted because it is a widely used unsupervised method capable of efficiently distinguishing components with distinct density distributions in CT data.
Subsequently, the number of clusters is determined by the user on the basis of the maximum clustering principle. The primary aim of clustering is to identify the regions corresponding to macroparticles and their subclasses. The clustering results are listed during program execution, with the highest possible number of clusters being selected, whilst ensuring that single minerals are not divided into multiple classes. This step requires identification by the user.
Ultimately, the number of clusters for the complete macroparticles is ascertained. Ordinarily, the LAC of complete particles is considerably greater than that of the matrix. After the clusters for macroparticles are determined, the macroparticles and matrix can be distinguished. Known mineral types of macroparticles, along with their corresponding LACs, are selected for the calibration of the matrix limit.
Following the selection of the number of clusters, it may be necessary to distinguish the particle gaps by considering the clustering results with larger values of k. This method optimises the local details after the number of clusters is determined, enabling the differentiation of the matrix with lower porosity from the solid phase. The k value selected on the basis of the maximum clustering principle may lead to the adhesion of adjacent particles. This phenomenon may be attributed to the particle gaps being too narrow, resulting in their LACs being influenced by the surrounding solid phase, leading to an increase. While the clustering results with a larger k value may lack physical significance, they can, to a certain extent, enhance the distinction between the particle gaps.
Algorithm 1. LAC-based clustering procedure for component segmentation
Input: 3D CT dataset V; candidate slices S; maximum number of clusters Kmax
Output: Labels for macroparticles and matrix across V
  • Select representative slices R from S (broad LAC coverage, distinct features).
  • Extract LAC values of R and flatten into a 1D array x.
  • For k = 2 … Kmax:
    o
    Apply k-means clustering to x.
    o
    Record cluster centers and LAC ranges.
  • Determine the optimal k (maximum clusters without splitting single minerals).
  • Assign clusters: high LAC → macroparticles; low LAC → matrix.
  • Optionally refine particle gaps using larger k values if needed.
  • Apply the final clustering boundaries to the full 3D dataset V.

2.1.2. Detection and Removal of Closed Pores

Following the classification of macropores, macroparticles and matrix into three categories, closed pores within the macroparticles are detected and marked. As the classification of macropores, macroparticles and matrix is based on LACs, closed pores within the macroparticles are also included. Theoretically, both nuclear magnetic resonance (NMR) and mercury intrusion porosimetry (MIP) results do not account for closed pores, particularly those that mainly originate from the interior of complete minerals.
Definition and Selection of Connectivity Structures. This study draws on the definition of discrete velocity models (DnQm) from the lattice Boltzmann method [35], which offers three connectivity modes, as shown in Figure 2. The connectivity mode was selected in accordance with commonly used lattice Boltzmann (LBM) pore flow simulation schemes (e.g., D3Q7, D3Q19, D3Q27), ensuring consistency with subsequent flow modelling requirements. Depending on the specific requirements, a suitable connectivity structure can be selected for identifying closed pores.

2.2. Determination of the LAC Limit for Matrix

In CT image analysis, the lower limit of the LAC related to the matrix ( μ l _ m i n ) and its corresponding porosity are typically referenced via the results from air during the current scan ( μ l _ a , φ = 100 % ).
The upper limit of the matrix’s LAC ( μ l _ m a x ) and its corresponding porosity are calculated as follows. First, it is necessary to identify the mineral components and their respective proportions within the rock. The different minerals present in the matrix can be distinguished via dual-energy X-ray CT or XRD. The MAC ( μ m ) of the identified minerals in their crystalline state can be queried from the NIST XCOM database, with the corresponding value selected on the basis of the X-ray energy used during the experiment. The density ( ρ ) of the identified minerals can be retrieved from the Mindat.org database. While this approach introduces uncertainties due to potential discrepancies between database reference values and actual mineral compositions or CT experimental conditions, the use of relative MAC relationships mitigates these effects.
Second, the relationships among the LACs of different mineral types are calculated. The relationships among the LAC, MAC, and density are given by Equation (1). The LACs of macroparticles are relatively concentrated and stable, whereas the LACs of the matrix are usually more dispersed due to variations in porosity. By substituting the MACs and densities of any two mineral types in their crystalline state into Equation (1), the ratio of their LACs can be obtained. This allows the derivation of the relative relationship between the LACs of macroparticles and the solid part of the matrix, as shown in Equation (2).
μ l _ m a x = μ m _ m · ρ m μ m _ p · ρ p · μ l _ p
where μ l _ m a x is the upper limit of the LAC of the matrix, μ m _ m is the MAC of the matrix, μ m _ p is the MAC of the macroparticles, ρ m is the density of the solid part of the matrix, ρ p is the density of the macroparticle minerals in the crystalline state, and μ l _ p is the centre of clustering of the macroparticle LACs.

2.3. Estimating Subresolution Porosity

Determination of the range of the LAC of the matrix and its corresponding porosity allows linear interpolation to be applied to estimate the subresolution porosity within that range. According to Equation (1), the LAC of the same substance is linearly related to the density of the substance when the X-ray energy is fixed. Further derivation reveals that there is also a linear correlation between the LAC (or CT image grey value) and porosity ( φ ). When the matrix is entirely composed of solid, its porosity can be considered as 0%, with the corresponding LAC being ( μ l _ m a x , φ = 0 ); conversely, when the porosity reaches 100%, it indicates full occupancy by macropores, with the corresponding LAC being ( μ l _ a , φ = 100 % ). The mapping between the upper and lower limits of the LAC and porosity of the matrix is defined on the basis of this linear relationship, and Equation (3) provides a method for calculating the porosity of the matrix.
φ j = μ l _ m a x μ l _ j μ l _ m a x μ l _ a
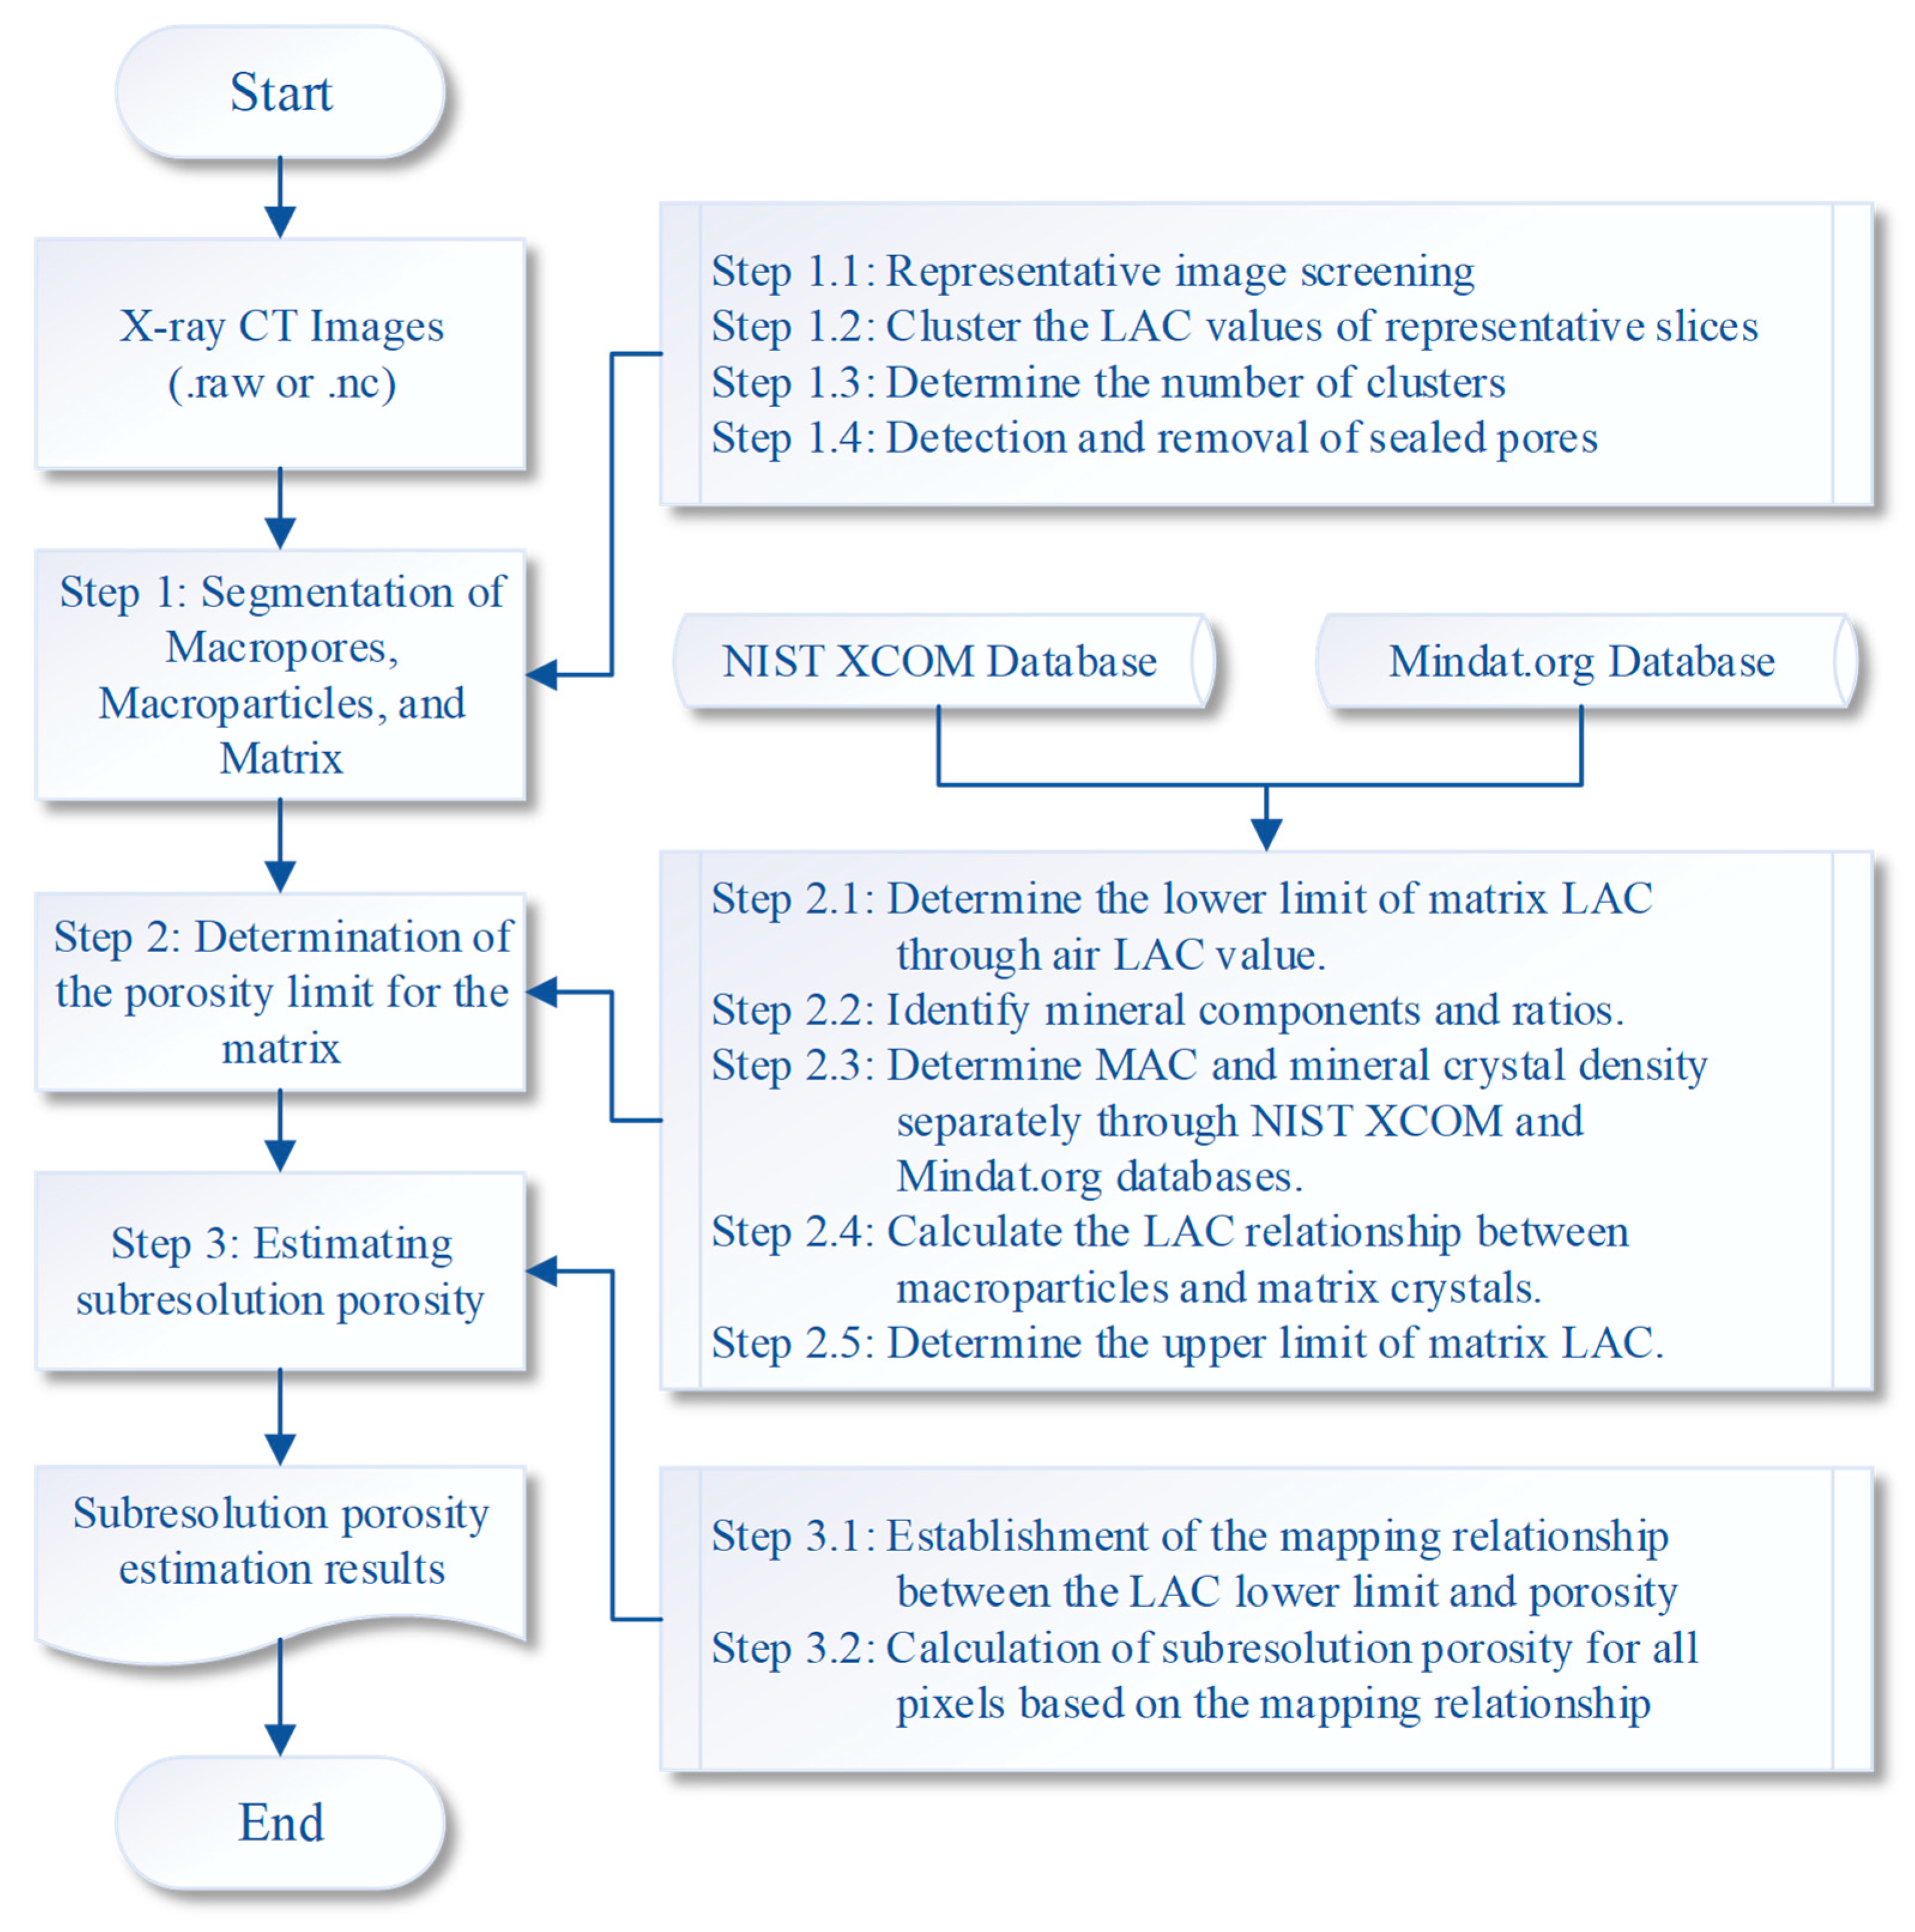
where φ j is the subresolution porosity, μ l _ j is the LAC corresponding to position j, μ l _ m a x denotes the LAC associated with the solid part of the matrix, and μ l _ a is the maximum value of the LAC corresponding to macropores. The flow of the subresolution porosity estimation method described is shown in Figure 3. Previous work used the average value of the LAC corresponding to macroparticles as μ l _ m a x , which is subject to large uncertainties and chance.

3. Results

3.1. Data Sources

The CT data used in this study were sourced from the open platform Digital Rocks Portal. This paper selected CT data from one Belgian Fieldstone sample and two Bentheimer Sandstone samples [36,37,38,39,40,41]. The samples in these datasets are widely studied, with comprehensive mineral composition and porosity information, making them valuable for validation. The CT data formats are RAW (.raw) or NetCDF (.nc), and the three-dimensional voxel models are shown in Figure 4. Detailed information about the samples is provided in Table 1.

3.2. Component Segmentation Results

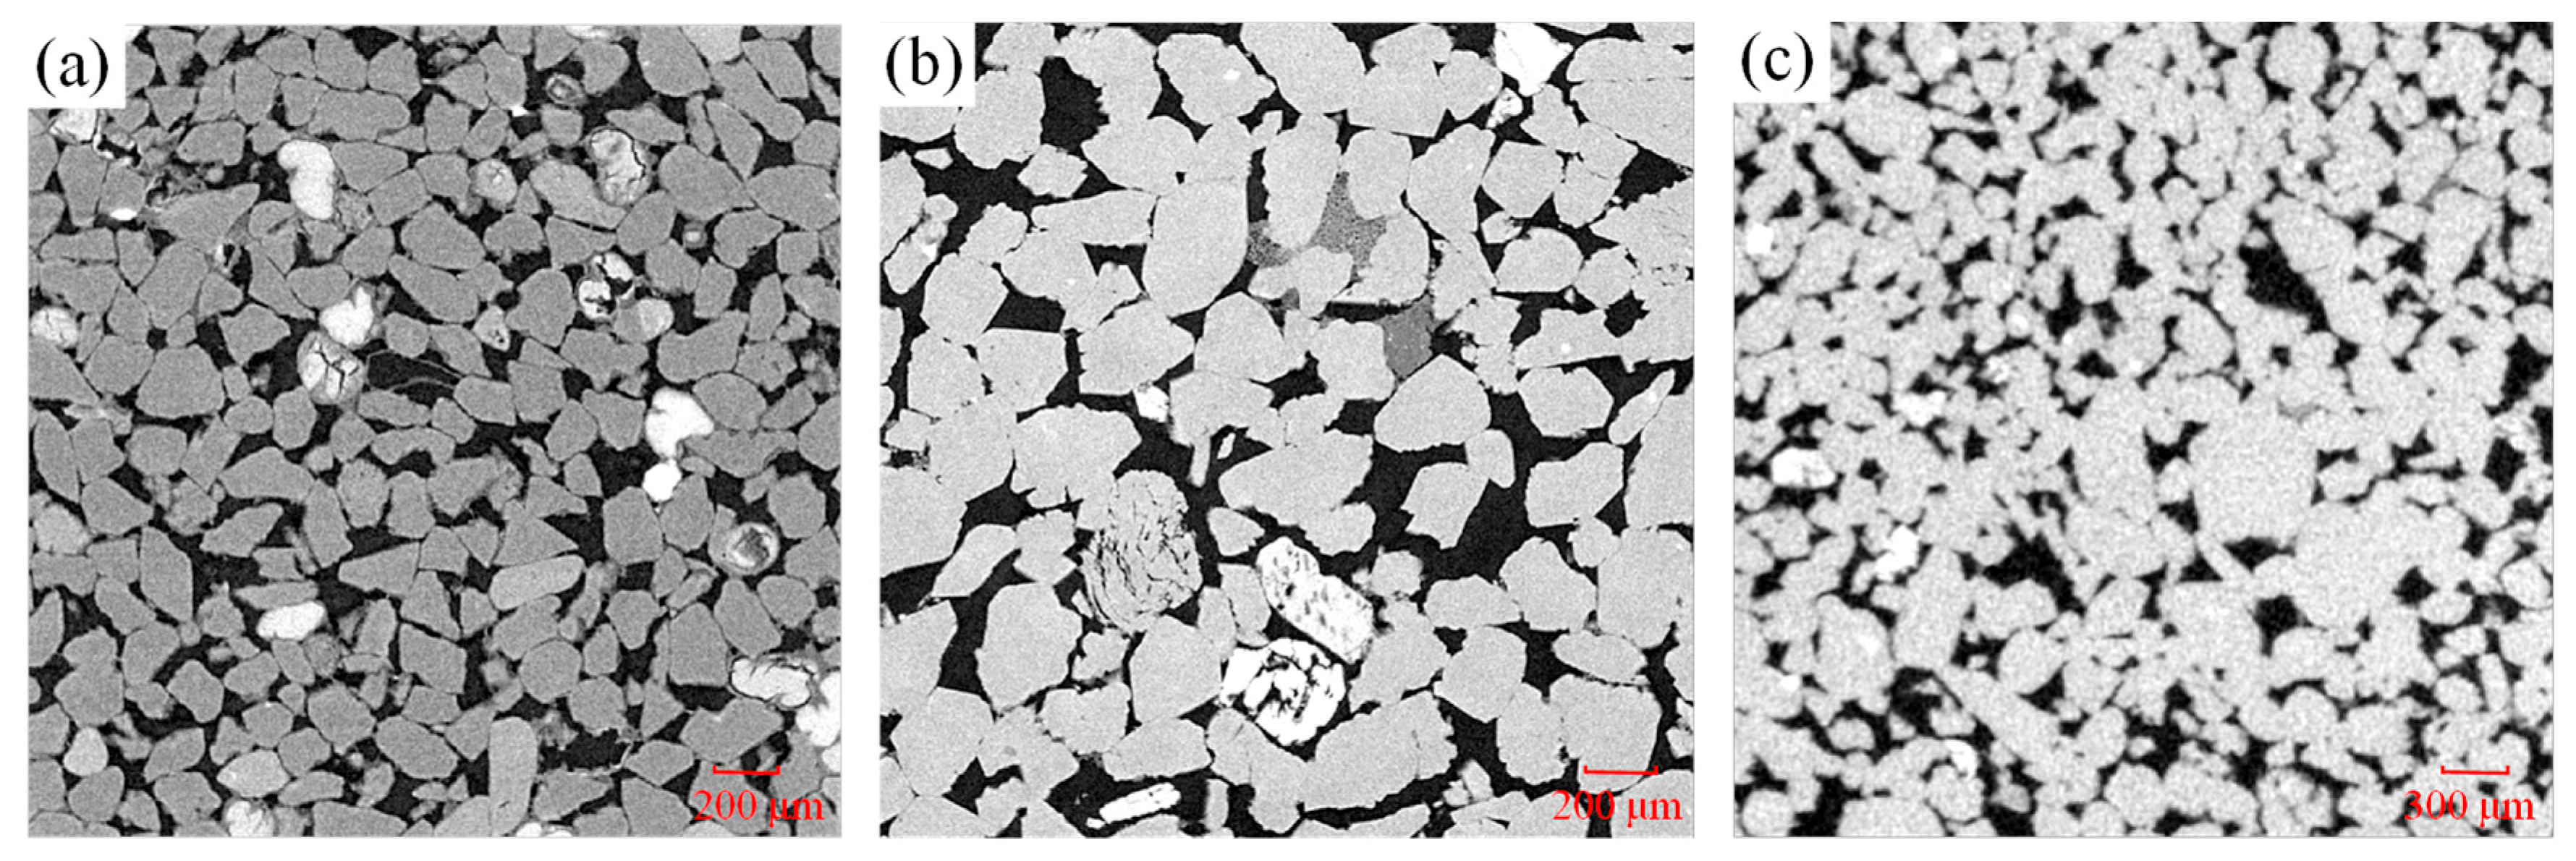
By counting the range of distribution of LACs for all slices in the CT data, the most widely distributed slice was selected as the representative slice. The representative slices for the Belgian Fieldstone and the two Bentheimer samples used in this paper are numbered 8, 400 and 442, respectively, as shown in Figure 5.
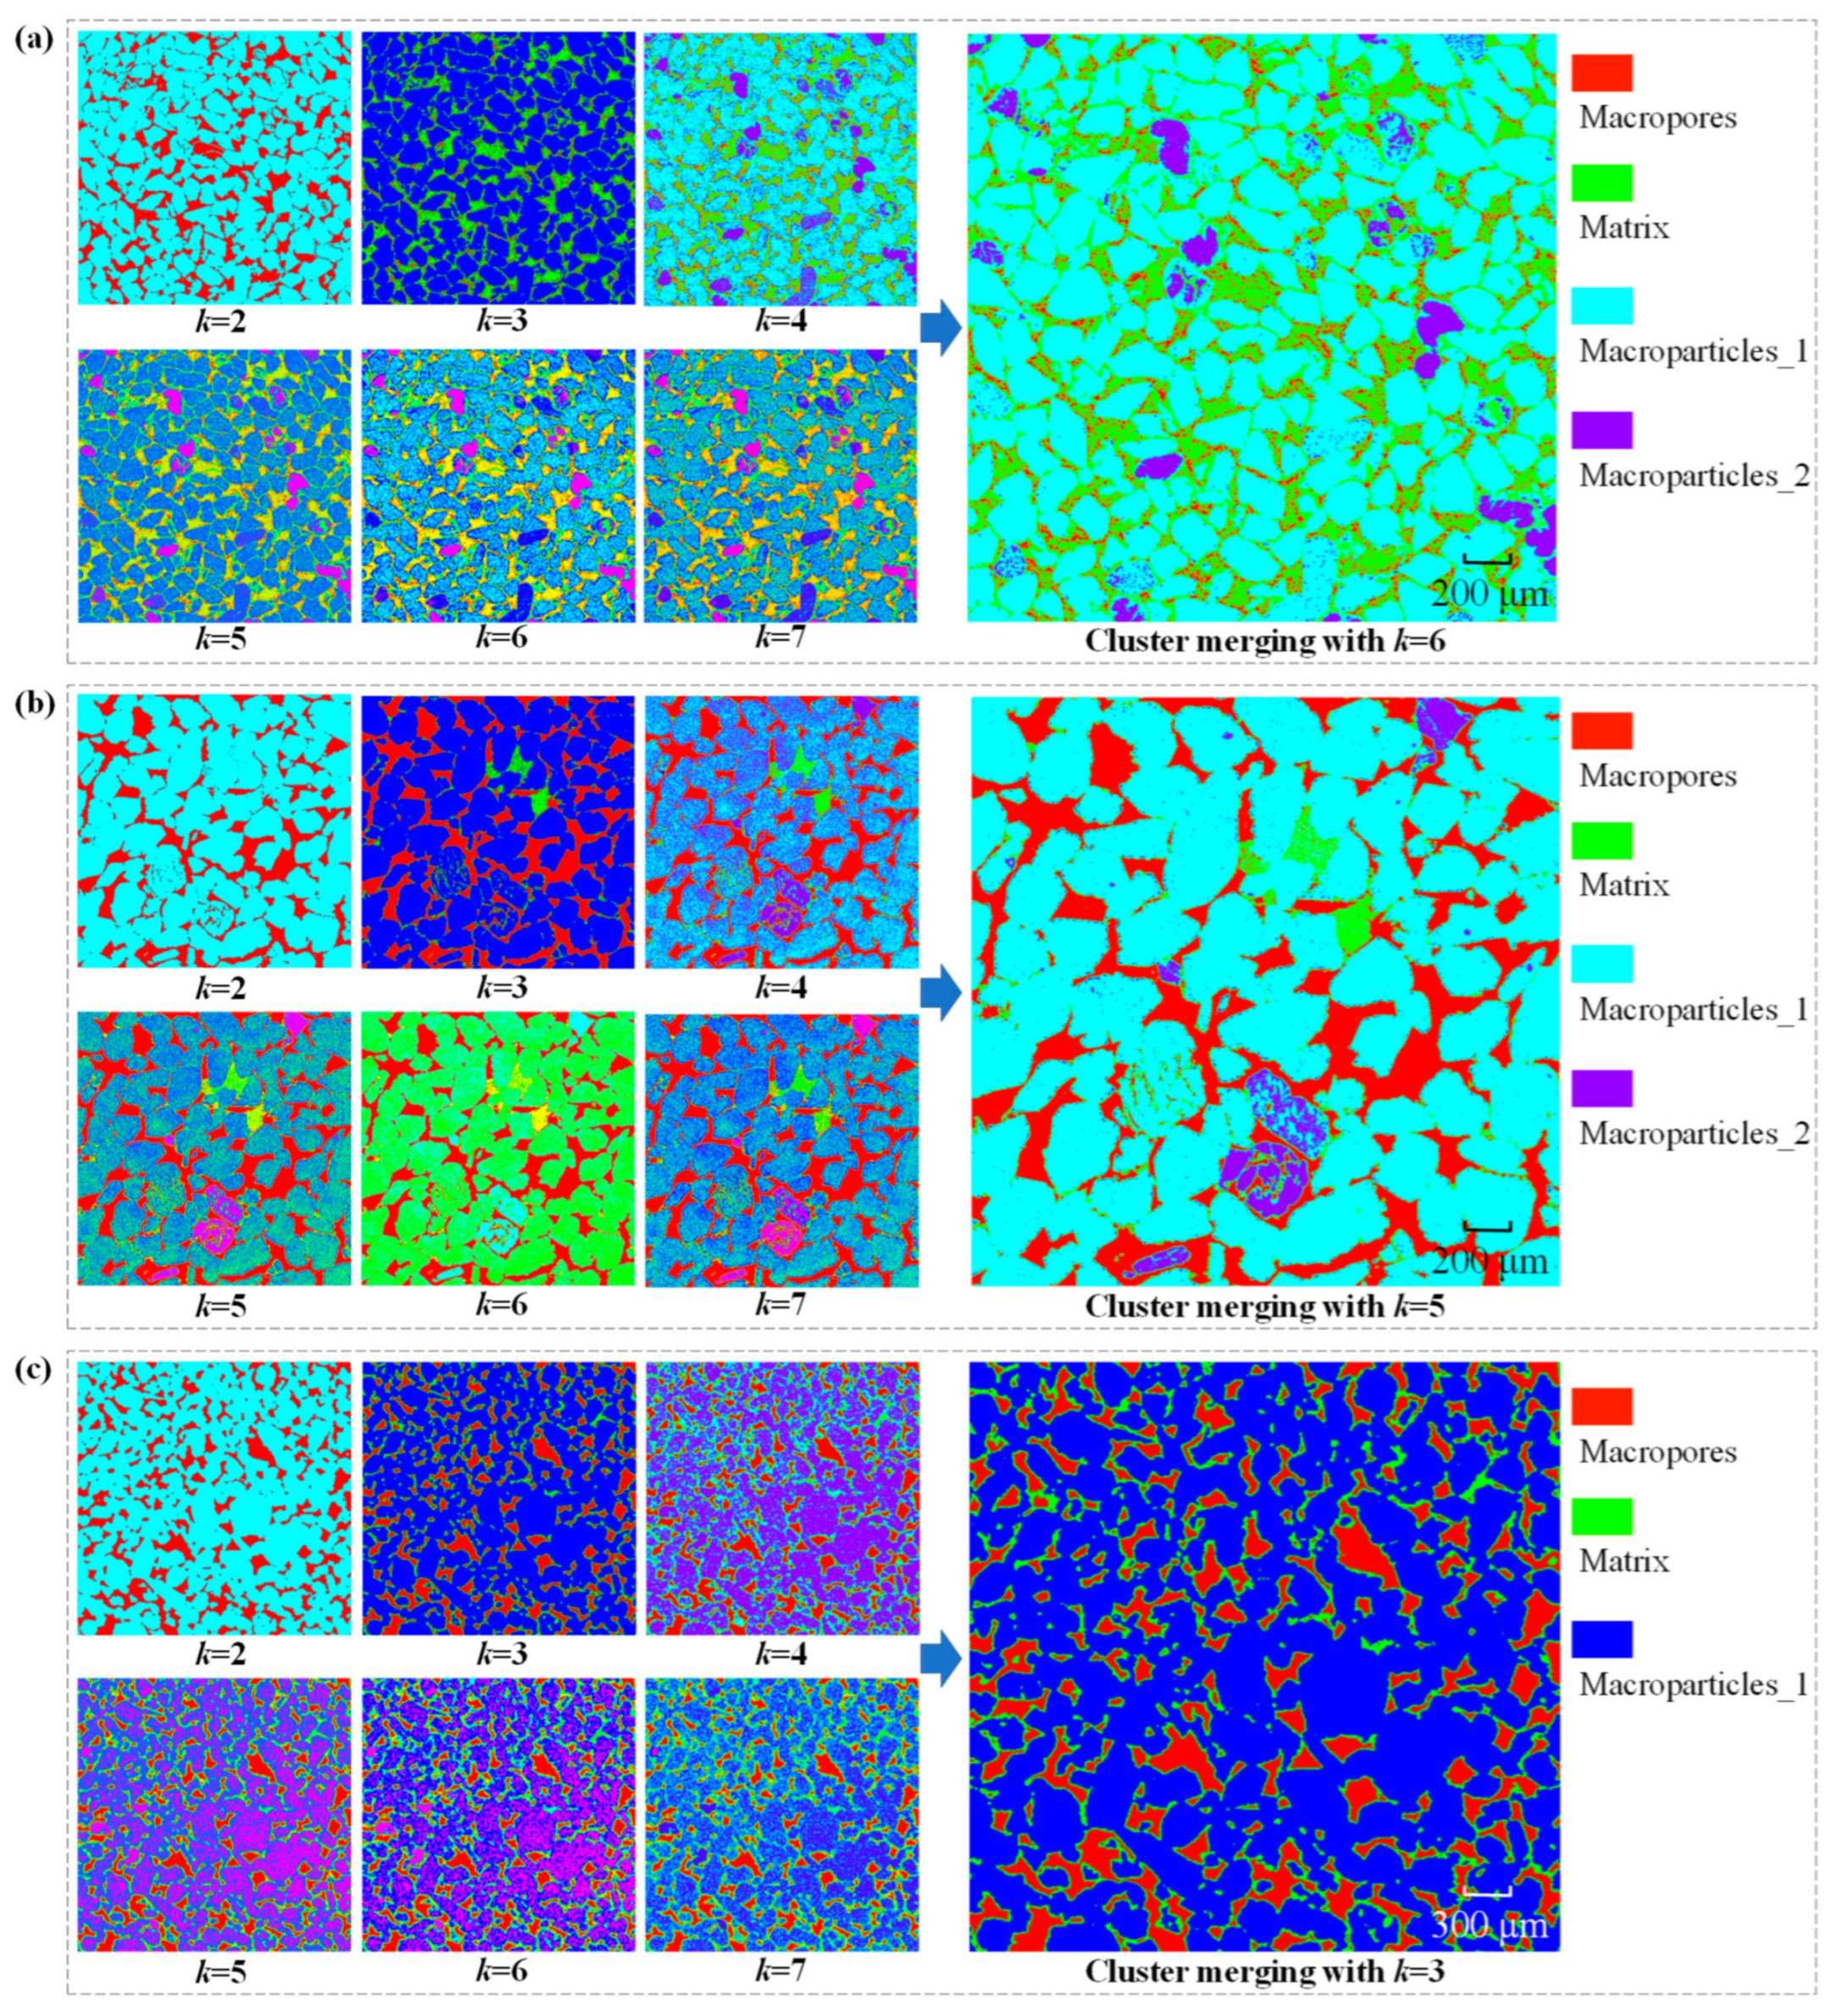
K-means clustering analysis was performed on the LACs of the representative slices. The compositional clustering results for the Belgian Fieldstone and the two Bentheimer samples utilised in this study are presented in Figure 6. The final determined numbers of clusters, macroparticle types, matrix types, and macropore types are presented in Table 2. The clustering results were applied to the entire 3D model, successfully segmenting the macroparticles, matrix, and macropores. This step led to a substantial reduction in the computational load through the selection of representative slices while ensuring the accuracy of the segmentation.
Following the initial segmentation of macroparticles, matrix, and macropores, closed pore regions were detected and excluded through connectivity analysis. The D3Q19 connectivity model was adopted to define connectivity. In these cases, the number of closed pores in Belgian Fieldstone accounts for approximately 0.4% of the connected pores, whereas in Bentheimer, it accounts for approximately 0.5%. Both Belgian Fieldstone and Bentheimer Sandstone have highly open and interconnected pore structures, as has been corroborated in the literature [38].

3.3. Determination of the Matrix LAC and Porosity Limits

On the basis of the clustering result, the LAC ranges and clustering centre results for each component are shown in Table 3. According to the method used in this study, the upper limit of the LAC for macropores is μ l _ a (corresponding to φ = 100 % ).
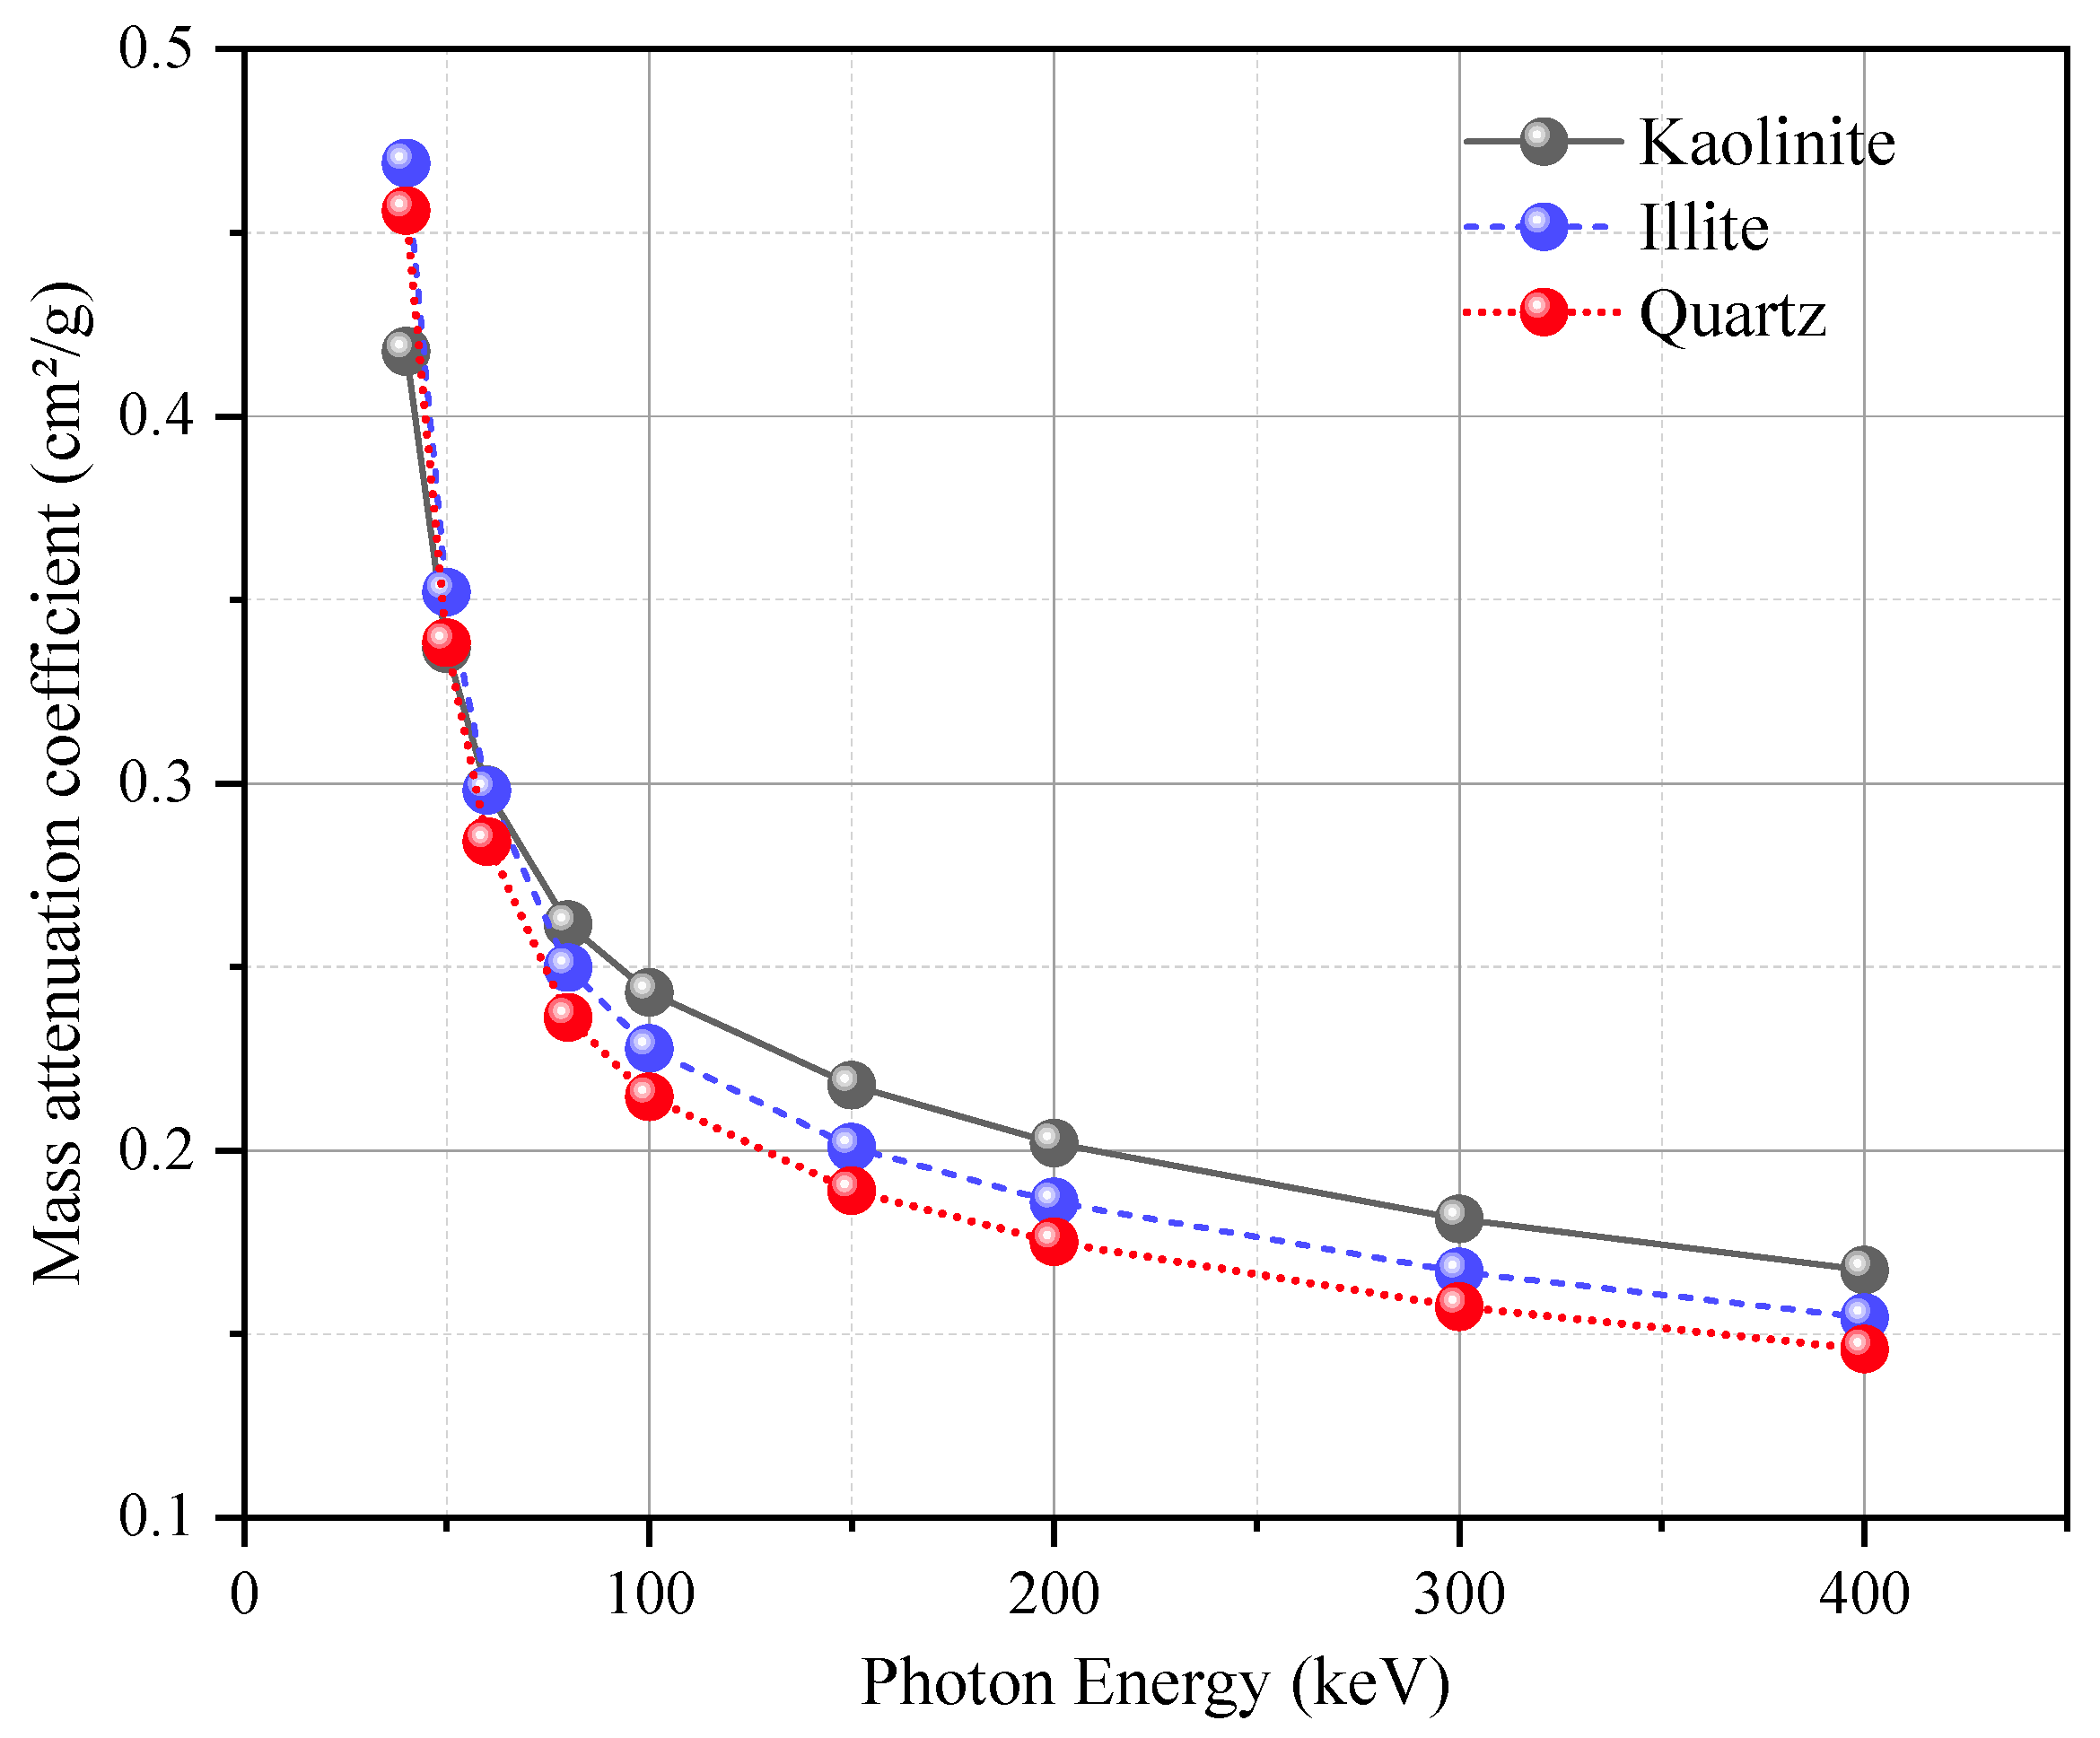
The upper limit of the LAC for the matrix fraction (corresponding to φ = 0) was calculated as follows. The mineral fractions of Belgian Fieldstone are quartz, sea chlorite and illite clay minerals, and the mineral fractions of the Bentheim sample are quartz, feldspar and kaolinite clay minerals. Through the Mindat.org database, the corresponding chemical formulas and densities of quartz, feldspar, illite and kaolinite are shown in Table 4. The trends of the MACs of the queried minerals with respect to X-ray energy through the NIST XCOM database are shown in Figure 7. In these samples, the quartz content is dominant, and the LACs (or greyscale values) are stable. Therefore, quartz was chosen as a control to calculate the LAC relative to the matrix crystals. For the case samples, the upper LAC limit ( μ l _ m a x ) was calculated for the matrix as shown in Table 5.

3.4. Subresolution Porosity Calculation Results

On the basis of the upper and lower limits of the matrix LAC ( μ l _ m a x , μ l _ a ) obtained in Section 3.3, the porosity is calculated by iterating the μ l _ j of the matrix part via Equation (3), which yields the following results.
The spatial distribution of subresolution porosity on representative slices is shown in Figure 8. The results show that the porosity significantly differs between the macroporous and matrix regions. The porosity of the macroporous part was close to 100%, whereas the porosity of the matrix part was mainly distributed between 70% and 100%. It should be noted that, although representative slices are shown in the figures for illustration, all statistical analyses were performed on the complete 3D CT datasets.
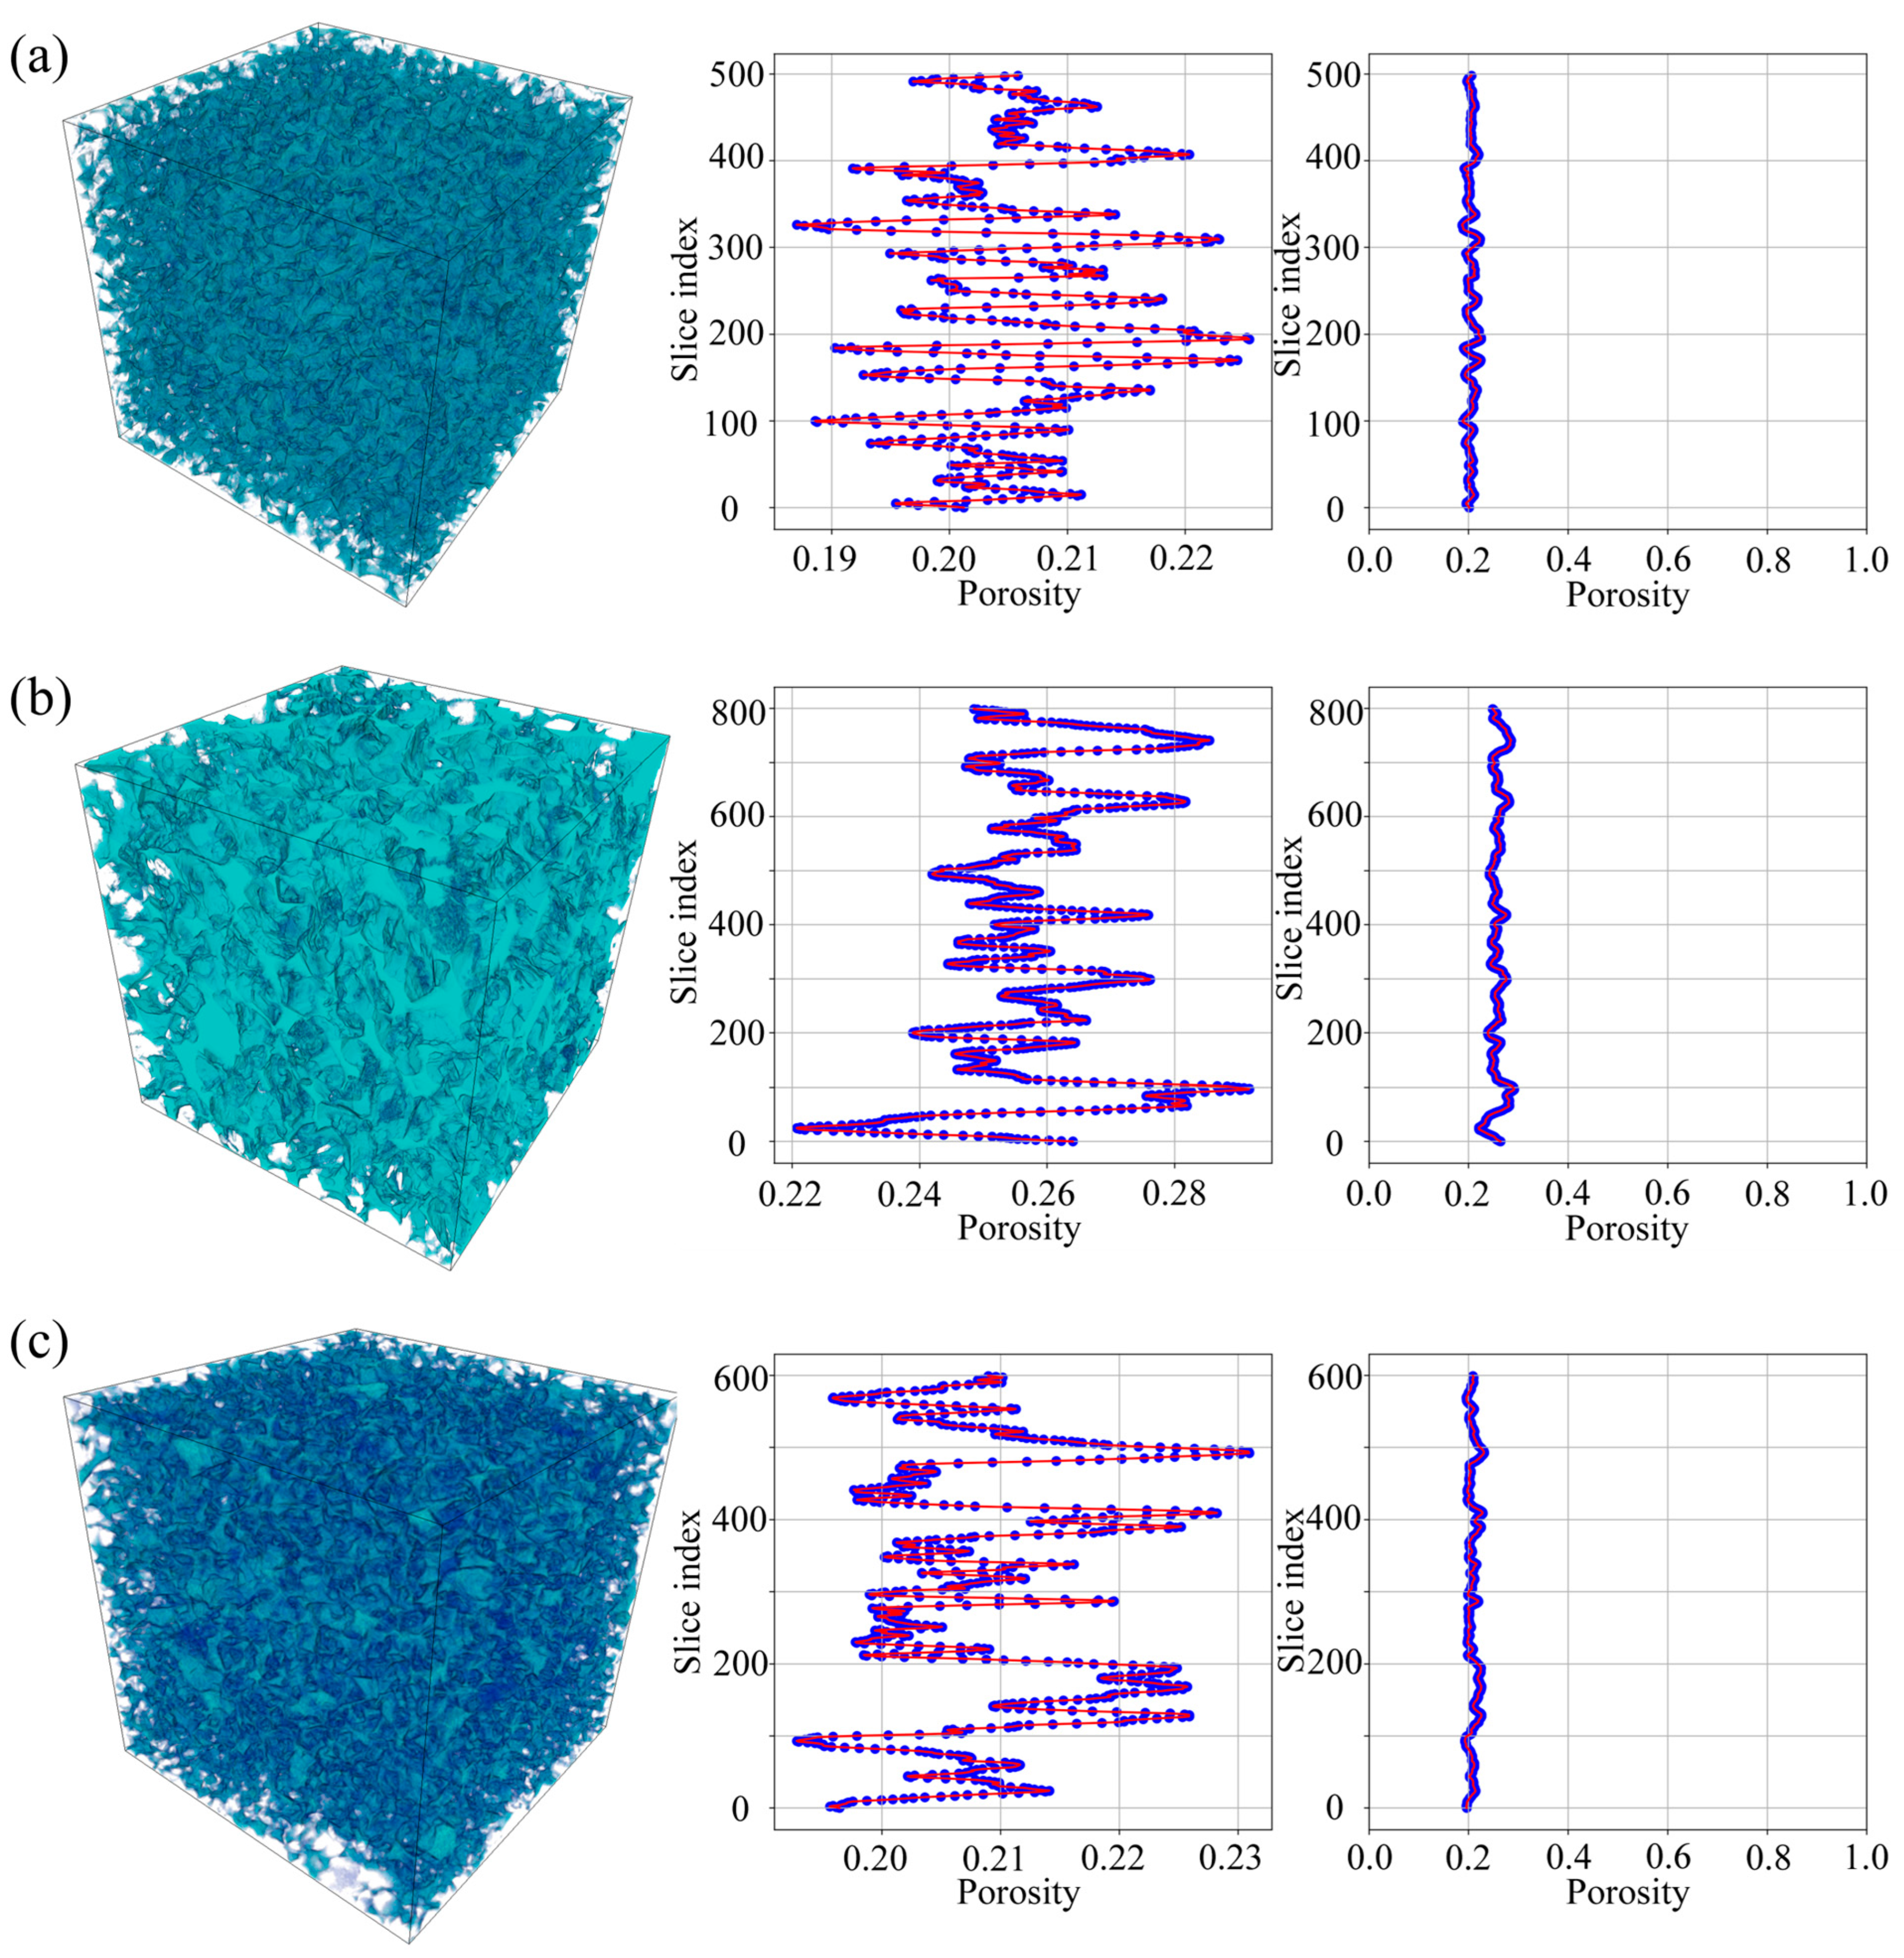
The three-dimensional total porosity distribution shows significant heterogeneity in the porosity distribution within the sample. The porosity in the macropore region is significantly greater than that in the matrix region, and the total porosity fluctuates along the slice sequence, as shown in Figure 9. The fluctuation in average porosity may be related to the distribution of particles, the characteristics of particle contact interfaces, and the localised distribution of closed pores.
The implementation was developed in Python 3.11 and tested on a workstation with 128 GB RAM and a 13th Gen Intel(R) Core(TM) i5-13600KF CPU. For a CT dataset of 800 × 800 × 800 voxels, a single case required approximately 5–10 min of computation time, with memory usage of around 30% of the total RAM. The program was designed for simplicity and has not yet been optimized for memory management, indicating potential for further performance improvements.

4. Discussion

4.1. Validation of Results

The LAC clustering method used in this study provides the volumetric fractions of three components, macropores, matrix and macroparticles, in the Bentheimer_1 sample. Specifically, the volumetric fraction of the macropore region is 21.55%, the volumetric fraction of the matrix region is 4.52%, and the volumetric fraction of the macroparticle region is 73.93%. It can be estimated that the macropores account for 82.66% of the total porosity.
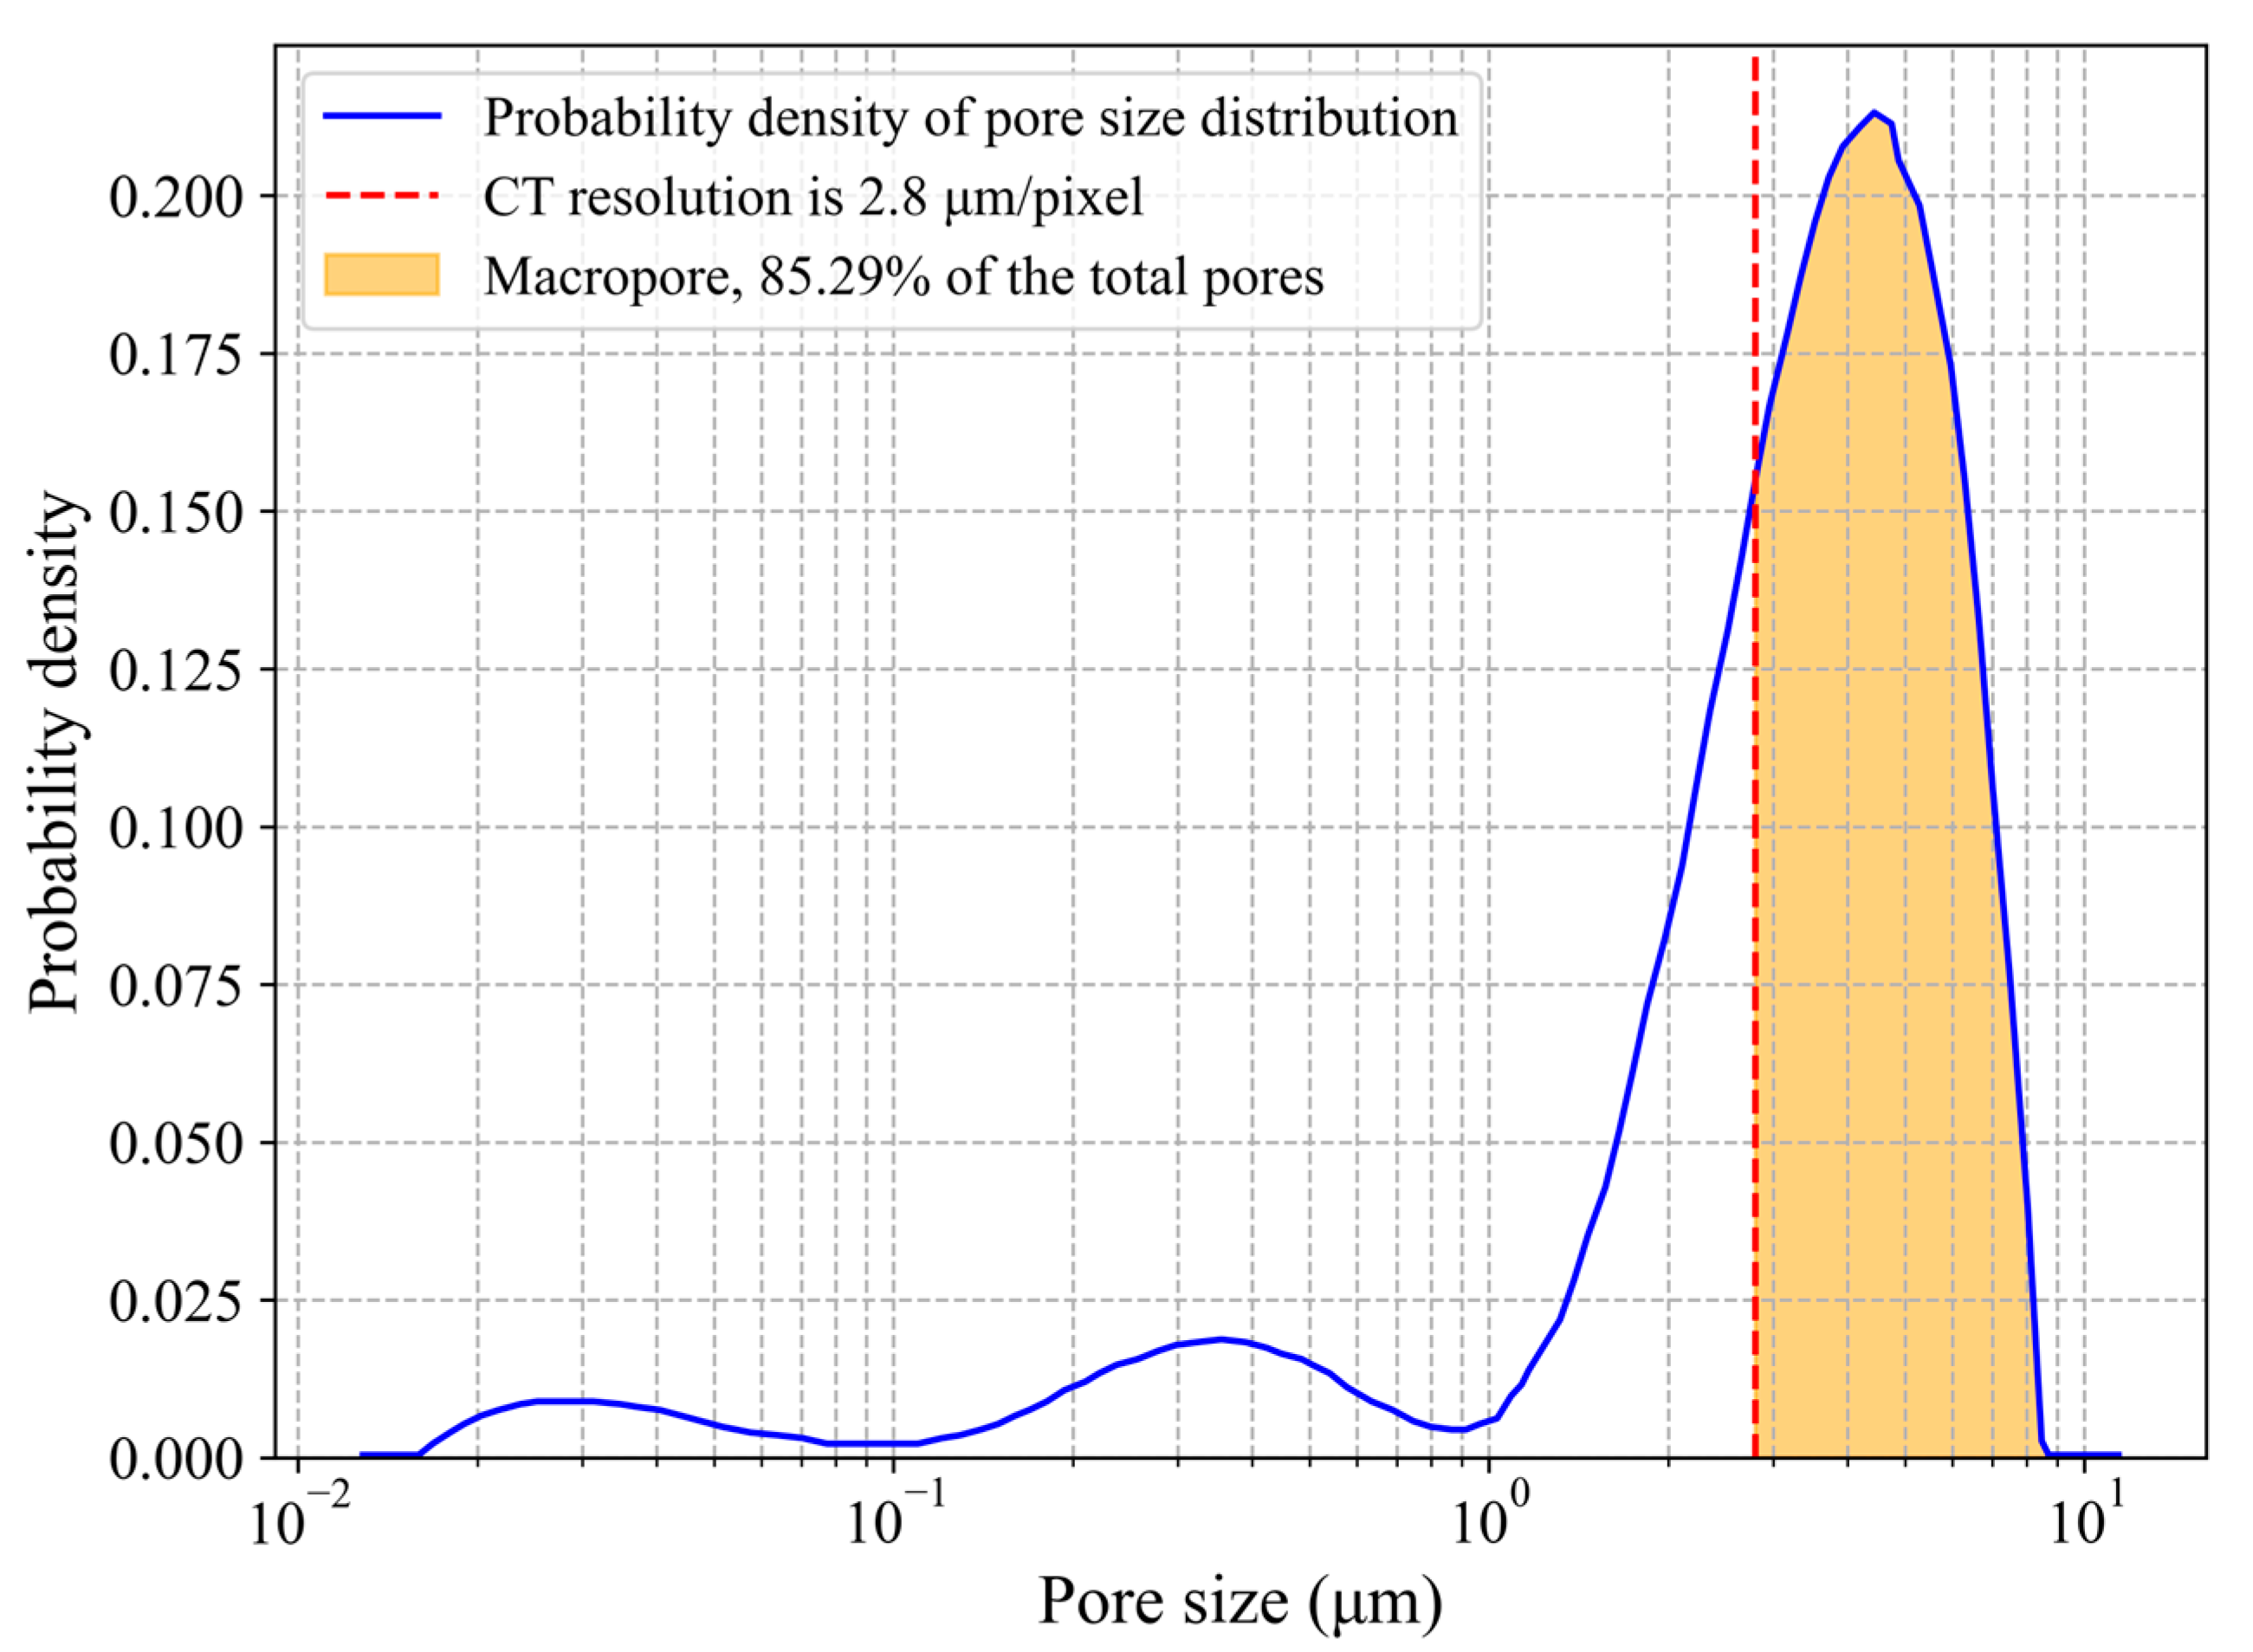
The volumetric fractions of the macropores and matrix estimated from the CT images were compared in detail with the pore size distributions obtained through NMR technology. In this case study, the Bentheimer_1 sample provided mineral composition data and underwent NMR analysis [44]. The pore size distribution was calculated via the provided T2 spectrum and surface relaxation (ρ2), as shown in Figure 10. Given that the CT energy is 150 keV and the resolution is 2.8 μm/voxel, macropores larger than this value account for 85.29% of the total porosity.
The comparison shows that the macropore and matrix volume fractions estimated from the CT images in this study are close to the results obtained from the NMR measurements, which are 82.66% and 85.29%, respectively. These findings indicate that the porosity distribution estimated from high-resolution μ-CT images has good accuracy in segmenting the macropore and matrix regions.
The total porosities of the samples were extrapolated by estimating the subresolution porosities of three different samples, as detailed in Table 6. Comparing the method of this paper with the binarised method, the percentage enhancement of the connectivity domain per 1% matrix is defined as A1. Comparing the method of this paper with the subresolution porosity estimation method that does not consider the intercomponent MACs and densities, the percentage enhancement of the matrix porosity is defined as A2. A1 and A2 reflect the effects of different matrix contents on the results of the calculations made via the different methods.
Compared with binarisation methods, subresolution porosity estimation methods are more accurate. First, compared with the total porosity in Table 1, the results of the two methods of subresolution porosity are similar to the reference value, whereas the results of the binarisation method significantly deviate from the reference value. Second, the subresolution porosity estimation methods are richer in terms of the distribution of pore space. Compared with the binarised porosity estimation method, the method in this paper increases the pore connectivity domain by 0.08%–3.52% per 1% matrix content. The number of pores and connectivity of the subresolution porosity calculation results are greater under the same porosity conditions.
The total porosity estimated via the subresolution porosity method in this paper is greater than that estimated via the method without considering the MAC and density. The reason for this is that considering the MAC and density results in a higher upper limit of the linear attenuation coefficient of the matrix and thus a higher total porosity (6.64%–15.50% increase). This also suggests that disregarding the MAC and density results in an underestimation of the porosity of the matrix.

4.2. Limitations and Multisource Data Calibration

4.2.1. Correction of the Ratio of Macropores to the Matrix

The rationale for correcting the macropore–matrix ratio lies in a fundamental identifiability issue caused by limited spatial resolution and partial-volume effects. When pores larger than the voxel size coexist with a fine-scale matrix, the empirical distribution of linear attenuation coefficients (LACs) conflates low-LAC macropores with the lower tail of the matrix. If left unconstrained, this conflation biases the inferred lower bound of matrix porosity and, in turn, the bulk porosity estimate. In our framework, an independently obtained pore size distribution (e.g., from NMR or MIP) is used only as a prior on the total fraction of macropores ( p m a c ). Conceptually, this prior anchors the low-LAC tail of the CT histogram, preventing the matrix lower bound from drifting into the macropore domain.
The macropore–matrix ratio can be corrected using the following steps. First, the range of pore diameters for macropores is defined. Macropores are those whose diameter exceeds the image resolution. The spatial resolution of the CT scanner used to scan the sample is determined, and by dividing the actual length of the sample by the number of pixels it contains, the real scale value represented by each pixel (μm/pixel) is obtained. Next, the relative volume fraction of macropores ( p m a c ) is determined. The pore size distribution of a sample is measured via NMR or MIP techniques [45], and the fraction of pores larger than the spatial resolution is calculated as p m a c . Finally, the positions of the macropores are identified. The LACs of all slices are sorted in ascending order, and the threshold for macropores is defined by the μ l _ p corresponding to the lower end of the p m a c fraction. Any value below this threshold is considered to represent a macropore.
This anchoring has two practical consequences. First, it stabilizes threshold selection across samples and scanners by tying the low-LAC tail to a physically measured volume fraction rather than to purely image-driven heuristics. Second, it reduces class-overlap errors: voxels with LACs that fall within the lowest p m a c quantile are more consistently treated as macropores, which in turn sharpens the estimate of the matrix LAC envelope.
The value of this correction is resolution-dependent. Its impact grows when (i) the CT voxel size is large relative to the characteristic macropore diameter, (ii) the pore size distribution is heavy-tailed (i.e., a larger p m a c ), or (iii) strong mineralogical contrast amplifies mass-attenuation differences so that matrix voxels encroach on the low-LAC tail. By contrast, at very high resolution—where pores rarely exceed a voxel— p m a c is small and the matrix mode remains well separated from the tail, so the correction is marginal. This resolution sensitivity is desirable: it makes the correction material only when image physics make macropore–matrix conflation likely.
The subresolution porosity calculation method proposed in this paper demonstrates strong scalability across rock types and CT energy conditions. Since it is based on the relative relationships of MACs among minerals, it is particularly applicable to porous sedimentary rocks, where mineral phases and pore structures can be distinguished at the resolution of CT imaging. However, the approach is less suitable for dense rocks, especially igneous lithologies, because mineral identification relies on CT greyscale values (LACs), and current X-ray CT resolution is insufficient to capture mineral-scale heterogeneity in such tight systems. In terms of imaging conditions, the method can be readily adapted to different CT energy levels by recalibrating the relative MAC relationships, ensuring applicability under varying beam spectra.

4.2.2. Calibration of Total Porosity

Calibration of total porosity is necessary because CT-based segmentation of pores and matrix is inherently prone to bias. Such bias primarily arises from two sources: (i) the limited resolution of CT imaging, which causes pores smaller than the voxel size to be unresolved or partially represented, and (ii) the overlap of attenuation values between minerals and voids, which leads to misclassification during thresholding. As a result, the uncalibrated matrix porosity derived directly from CT images often deviates from bulk porosity values obtained through laboratory techniques such as NMR or MIP.
During this calibration process, the segmentation of the macropores and matrix remains unchanged, with the porosity of the macropores always considered to be 100%. Calibration adjusts only the overall value of the matrix porosity without changing the relative ratio of the internal porosity. The calibration procedure consists of the following steps. First, the measured matrix porosity ( p m t x ) is determined by subtracting the macropore porosity ( p m a c ) from the total porosity ( p t o t a l ) of the sample. Then, the measured matrix pore volume ( V m t x _ c ) is calculated by multiplying the pixel volume of the sample by the measured matrix porosity, and the uncalibrated matrix pore volume ( V m t x ) is calculated via Equation (4). Subsequently, the coefficient of proportionality ( C ) between the measured matrix pore volume and the uncorrected matrix pore volume is calculated via Equation (5). Finally, this scaling factor is applied to the uncorrected matrix porosity to obtain the corrected matrix porosity distribution; see Equation (6).
V m t x = φ m t x
C = V m t x _ c V m t x
φ m t x _ c = C · φ j _ m t x
The benefits of calibration are most evident when discrepancies between CT-derived and laboratory porosity are large. The correction is especially important in low-resolution scans and in rocks with significant microporosity, where CT alone omits a substantial fraction of pores. This approach, however, rests on several assumptions. It assumes that laboratory measurements of total porosity are both accurate and representative of the same volume scanned by CT. Any mismatch in sampling may introduce bias. Furthermore, the proportional rescaling implicitly assumes a uniform underestimation of porosity across the matrix, which may not hold if lithological heterogeneity or mineralogical artifacts are present.

4.3. Outlook

Beyond methodological improvements, the proposed approach has significant potential applications. In reservoir engineering, more accurate subresolution porosity estimation can improve the evaluation of reservoir quality and permeability distribution. In CO2 geological storage, reliable characterisation of pore connectivity is essential for predicting CO2 migration pathways, storage capacity, and long-term sealing integrity. In geomechanics, better estimates of pore structure can support more accurate modelling of rock strength, deformation, and failure mechanisms. Therefore, the proposed method not only advances porosity estimation methodology but also provides a valuable tool for addressing practical challenges in subsurface resource development and environmental engineering.

5. Conclusions

This study presents a subresolution porosity estimation method that incorporates the relative relationships of X-ray MACs among minerals. By moving beyond conventional binarisation and non-MAC-based approaches, the method provides more accurate and realistic porosity estimates, with improved pore connectivity. Specific conclusions are presented below:
(1)
Compared with conventional binarised porosity estimation methods, the proposed approach enables the estimation of porosity values ranging between 0 and 1 for each voxel. Under the same conditions, the subresolution porosity estimation results exhibit greater connectivity.
(2)
Compared to the subresolution porosity estimation method, which does not take into account MAC and density, this method more accurately estimates the upper LAC limit of the matrix, bringing the porosity of the matrix closer to reality.
The method adopted in this study enhances the rationality of subresolution porosity estimation. However, it should be noted that, under fixed-energy X-ray CT, the linear attenuation coefficients of the matrix at certain porosity levels may overlap with those of mineral particles, making it difficult to achieve accurate component segmentation using image-processing techniques alone. Future work should explore the use of multi-energy CT to improve mineral phase discrimination, as well as the integration of machine learning techniques to address these issues and improve segmentation accuracy.

Author Contributions

J.C.: Conceptualization, Data curation, Formal analysis, Investigation, Methodology, Software, Validation, Visualization, Writing—original draft, Writing—review and editing. Z.Z.: Conceptualization, Formal analysis, Funding acquisition, Methodology, Project administration, Resources, Supervision, Validation, Writing—original draft, Writing—review and editing. Z.L.: Conceptualization, Formal analysis, Methodology, Validation, Review. Q.Z.: Conceptualization, Formal analysis, Methodology, Validation, Review. Z.Y.: Conceptualization, Formal analysis, Review. All authors have read and agreed to the published version of the manuscript.

Funding

This research was funded by the financial support from the National Natural Science Foundation of China (Key Project, No. 42530718) and the National Natural Science Foundation of China (No. 42272336).

Data Availability Statement

Some or all data, models, or codes that support the findings of this study are available from the corresponding author upon reasonable request.

Acknowledgments

The authors sincerely thank the academic editor and anonymous reviewers for their valuable comments and constructive suggestions, which greatly improved the quality of this manuscript.

Conflicts of Interest

The authors declare no conflict of interest.

References

  1. Iraji, S.; Soltanmohammadi, R.; Munoz, E.R.; Basso, M.; Vidal, A.C. Core scale investigation of fluid flow in the heterogeneous porous media based on X-ray computed tomography images: Upscaling and history matching approaches. Geoenergy Sci. Eng. 2023, 225, 211716. [Google Scholar] [CrossRef]
  2. Frouté, L.; Guan, K.M.; Yun, W.; Lewis, S.J.Y.; Stripe, B.D.; Yang, X.; Lapene, A.; Kovscek, A.R.; Creux, P. Micro X-ray fluorescence reveals pore space details and spatially-resolved porosity of rock-based microfluidic devices. Lab Chip 2023, 23, 3978–3988. [Google Scholar] [CrossRef]
  3. Deng, W.; Fu, L.; Morozov, I.B.; Wang, Z. Macroscopic mechanical properties of fluid-saturated sandstone at variable temperatures. Geophysics 2023, 88, MR127–MR139. [Google Scholar] [CrossRef]
  4. Das, V.; Saxena, N.; Hofmann, R. Compressibility predictions using digital thin-section images of rocks. Comput. Geosci. 2020, 139, 104482. [Google Scholar] [CrossRef]
  5. Li, X.; Zhu, Y.; Wang, L.; Qu, D.; Luo, Y.; Meng, F.; Pei, C.; Li, W. Study on the micro-mechanical behavior and pore structure evolution mechanism of coral reef limestone based on digital rock core. Comput. Geotech. 2025, 177, 106845. [Google Scholar] [CrossRef]
  6. Heidari, M.; Khanlari, G.R.; Torabi-Kaveh, M.; Kargarian, S.; Saneie, S. Effect of Porosity on Rock Brittleness. Rock Mech. Rock Eng. 2014, 47, 785–790. [Google Scholar] [CrossRef]
  7. Wang, H.L.; Xu, W.Y.; Cai, M.; Xiang, Z.P.; Kong, Q. Gas Permeability and Porosity Evolution of a Porous Sandstone Under Repeated Loading and Unloading Conditions. Rock Mech. Rock Eng. 2017, 50, 2071–2083. [Google Scholar] [CrossRef]
  8. Chen, L.; He, A.; Zhao, J.; Kang, Q.; Li, Z.; Carmeliet, J.; Shikazono, N.; Tao, W. Pore-scale modeling of complex transport phenomena in porous media. Prog. Energy Combust. Sci. 2022, 88, 100968. [Google Scholar] [CrossRef]
  9. Liu, H.; Kang, Q.; Leonardi, C.R.; Schmieschek, S.; Narváez, A.; Jones, B.D.; Williams, J.R.; Valocchi, A.J.; Harting, J. Multiphase lattice Boltzmann simulations for porous media applications. Comput. Geosci. 2016, 20, 777–805. [Google Scholar] [CrossRef]
  10. Nasir, M.; Kaito, K.; Patmonoaji, A.; Mahardika, M.A.; She, Y.; Matsushita, S.; Suekane, T. Three-dimensional pore-scale observation of drying process of porous media. Int. J. Heat Mass. Transf. 2022, 196, 123299. [Google Scholar] [CrossRef]
  11. Jiang, Z.; Liu, J.; Leung, A.K. Tracking spatial heterogeneity of local degree of saturation in unsaturated soils at different scales via X-ray computed tomography. J. Rock Mech. Geotech. Eng. 2025, 17, 3807–3818. [Google Scholar] [CrossRef]
  12. Zhao, Z.; Zhou, X.; Chen, J. Pore-scale hydraulic properties of virtual sandstone microstructures: Spatial variations and voxel scale effects. Arch. Civ. Mech. Eng. 2022, 23, 22. [Google Scholar] [CrossRef]
  13. Zhou, X.; Xiao, N. Analyzing fracture properties of the 3D reconstructed model of porous rocks. Eng. Fract. Mech. 2018, 189, 175–193. [Google Scholar] [CrossRef]
  14. Zhang, Y.; Ma, G.; Zhou, H.; Wei, X.; Chen, Y. A CT-XRD-based thermo-mechanical coupling DLSM for quantitative analysis of extreme temperature-induced damage in rocks. Comput. Geotech. 2025, 179, 107056. [Google Scholar] [CrossRef]
  15. Cnudde, V.; Boone, M.N. High-resolution X-ray computed tomography in geosciences: A review of the current technology and applications. Earth-Sci. Rev. 2013, 123, 1–17. [Google Scholar] [CrossRef]
  16. Inês Silva, M.; Malitckii, E.; Santos, T.G.; Vilaça, P. Review of conventional and advanced non-destructive testing techniques for detection and characterization of small-scale defects. Prog. Mater. Sci. 2023, 138, 101155. [Google Scholar] [CrossRef]
  17. Kim, J.; Chung, S.; Stephan, D.; Han, T. Issues on characterization of cement paste microstructures from μ-CT and virtual experiment framework for evaluating mechanical properties. Constr. Build. Mater. 2019, 202, 82–102. [Google Scholar] [CrossRef]
  18. Qsymah, A.; Sharma, R.; Yang, Z.; Margetts, L.; Mummery, P. Micro X-ray computed tomography image-based two-scale homogenisation of ultra high performance fibre reinforced concrete. Constr. Build. Mater. 2017, 130, 230–240. [Google Scholar] [CrossRef]
  19. Chung, S.; Han, T.; Kim, S.; Jay Kim, J.; Youm, K.S.; Lim, J. Evaluation of effect of glass beads on thermal conductivity of insulating concrete using micro CT images and probability functions. Cem. Concr. Compos. 2016, 65, 150–162. [Google Scholar] [CrossRef]
  20. Hu, Z.; Zhang, R.; Zhu, K.; Li, D.; Jin, Y.; Guo, W.; Liu, X.; Zhang, X.; Zhang, Q. Probing the Pore Structure of the Berea Sandstone by Using X-ray Micro-CT in Combination with ImageJ Software. Minerals 2023, 13, 360. [Google Scholar] [CrossRef]
  21. Shen, Z.; Meng, Z.; Liu, Y.; Lei, J.; Shen, W.; Ren, H.; Gao, T.; Zhang, K.; Wang, Y.; Tan, L. Relationship between multiscale nanopore structure and coal connectivity during coalification process. Microporous Mesoporous Mater. 2023, 360, 112717. [Google Scholar] [CrossRef]
  22. Tiberti, G.; Minelli, F.; Plizzari, G. Reinforcement optimization of fiber reinforced concrete linings for conventional tunnels. Compos. Part B Eng. 2014, 58, 199–207. [Google Scholar] [CrossRef]
  23. Duggal, P.; Tomar, R.K.; Kaushika, N.D. Design and application of concrete bricks using phase change materials. Int. J. Syst. Assur. Eng. Manag. 2024. [Google Scholar] [CrossRef]
  24. Hou, F.; Qu, G.; Yan, Z.; Zheng, M.; Ma, Y.; Li, J.; Fan, F.; Zhang, J. Properties and relationships of porous concrete based on Griffith’s theory: Compressive strength, permeability coefficient, and porosity. Mater. Struct. 2024, 57, 52. [Google Scholar] [CrossRef]
  25. Lin, X.; Li, Z.; Jiang, Z.; Miao, H.; Zhang, C. The Effects of Pore Wettability on the Adsorption and Flow Capacity of Shale Gas: New Insights from Molecular Dynamic Modeling. Energy Technol. 2023, 11, 2300004. [Google Scholar] [CrossRef]
  26. Zhou, J.; Zhang, C.; Ranjith, P.G. Behaviours of methane and water in heterogeneous shale nanopores: Effect of water saturation and pore size. Fuel 2023, 335, 126675. [Google Scholar] [CrossRef]
  27. Keller, L.M.; Schuetz, P.; Erni, R.; Rossell, M.D.; Lucas, F.; Gasser, P.; Holzer, L. Characterization of multi-scale microstructural features in Opalinus Clay. Microporous Mesoporous Mater. 2013, 170, 83–94. [Google Scholar] [CrossRef]
  28. Yin, S.; Chen, X.; Yan, R.; Wang, L. Pore Structure Characterization of Undisturbed Weathered Crust Elution-Deposited Rare Earth Ore Based on X-ray Micro-CT Scanning. Minerals 2021, 11, 236. [Google Scholar] [CrossRef]
  29. Liu, Q.; Sun, M.; Sun, X.; Liu, B.; Ostadhassan, M.; Huang, W.; Chen, X.; Pan, Z. Pore network characterization of shale reservoirs through state-of-the-art X-ray computed tomography: A review. Gas Sci. Eng. 2023, 113, 204967. [Google Scholar] [CrossRef]
  30. Singh, A.; Regenauer Lieb, K.; Walsh, S.D.C.; Armstrong, R.T.; van Griethuysen, J.J.M.; Mostaghimi, P. On Representative Elementary Volumes of Grayscale Micro-CT Images of Porous Media. Geophys. Res. Lett. 2020, 47, e2020GL088594. [Google Scholar] [CrossRef]
  31. Smal, P.; Gouze, P.; Rodriguez, O. An automatic segmentation algorithm for retrieving sub-resolution porosity from X-ray tomography images. J. Pet. Sci. Eng. 2018, 166, 198–207. [Google Scholar] [CrossRef]
  32. Godoy, W.; Pontedeiro, E.M.; Barros, R.A.B.R.; de Vries, E.T.; Raoof, A.; van Genuchten, M.T.; Couto, P. Modeling sub-resolution porosity of a heterogeneous carbonate rock sample. Vadose Zone J. 2024, 23, e20348. [Google Scholar] [CrossRef]
  33. Zhuang, L.; Shin, H.; Yeom, S.; Pham, C.N.; Kim, Y. A novel method for estimating subresolution porosity from CT images and its application to homogeneity evaluation of porous media. Sci. Rep. 2022, 12, 16229. [Google Scholar] [CrossRef] [PubMed]
  34. Ghadiri, M.; Harrison, S.T.L.; Fagan-Endres, M.A. Quantitative X-ray µCT Measurement of the Effect of Ore Characteristics on Non-Surface Mineral Grain Leaching. Minerals 2020, 10, 746. [Google Scholar] [CrossRef]
  35. Qian, Y.H.; Humières, D.D.; Lallemand, P. Lattice BGK Models for Navier-Stokes Equation. Europhys. Lett. 1992, 17, 479. [Google Scholar] [CrossRef]
  36. Cui, Y.; Shikhov, I.; Li, R.; Liu, S.; Arns, C.H. A numerical study of field strength and clay morphology impact on NMR transverse relaxation in sandstones. J. Pet. Sci. Eng. 2021, 202, 108521. [Google Scholar] [CrossRef]
  37. Cui, Y.; Shikhov, I.; Arns, C.H. NMR Relaxation Modelling in Porous Media with Dual-Scale-Resolved Internal Magnetic Fields. Transp. Porous Media 2022, 142, 453–474. [Google Scholar] [CrossRef]
  38. De Boever, W.; Bultreys, T.; Derluyn, H.; Van Hoorebeke, L.; Cnudde, V. Comparison between traditional laboratory tests, permeability measurements and CT-based fluid flow modelling for cultural heritage applications. Sci. Total Environ. 2016, 554–555, 102–112. [Google Scholar] [CrossRef]
  39. Jackson, S.J.; Lin, Q.; Krevor, S. Representative Elementary Volumes, Hysteresis, and Heterogeneity in Multiphase Flow from the Pore to Continuum Scale. Water Resour. Res. 2020, 56, e2019WR026396. [Google Scholar] [CrossRef]
  40. Lv, P.; Liu, Y.; Liu, F.; Yang, W.; Liu, H.; Zhang, B.; Song, Y. Pore-based architecture and representative element volume evaluation in artificial sand packs and natural rock cores. Pet. Sci. 2022, 19, 1473–1482. [Google Scholar] [CrossRef]
  41. Huang, R.; Herring, A.L.; Sheppard, A. Effect of Saturation and Image Resolution on Representative Elementary Volume and Topological Quantification: An Experimental Study on Bentheimer Sandstone Using Micro-CT. Transp. Porous Media 2021, 137, 489–518. [Google Scholar] [CrossRef]
  42. Wang, C.; Yao, J.; Huang, Z.; Liu, F.; Yang, Y. Digital core reconstruction based on discrete element and Markov chain-Monte Carlo methods. Geoenergy Sci. Eng. 2024, 236, 212422. [Google Scholar] [CrossRef]
  43. Peksa, A.E.; Wolf, K.-H.A.A.; Zitha, P.L.J. Bentheimer sandstone revisited for experimental purposes. Mar. Pet. Geol. 2015, 67, 701–719. [Google Scholar] [CrossRef]
  44. Lucas Oliveira, E.; Araujo Ferreira, A.G.; Trevizan, W.A.; dos Santos, B.C.C.; Bonagamba, T.J. Sandstone surface relaxivity determined by NMR T2 distribution and digital rock simulation for permeability evaluation. J. Pet. Sci. Eng. 2020, 193, 107400. [Google Scholar] [CrossRef]
  45. Zhang, C.; Jia, S.; Huang, X.; Shi, X.; Zhang, T.; Zhang, L.; Wang, F. Accurate characterization method of pores and various minerals in coal based on CT scanning. Fuel 2024, 358, 130128. [Google Scholar] [CrossRef]
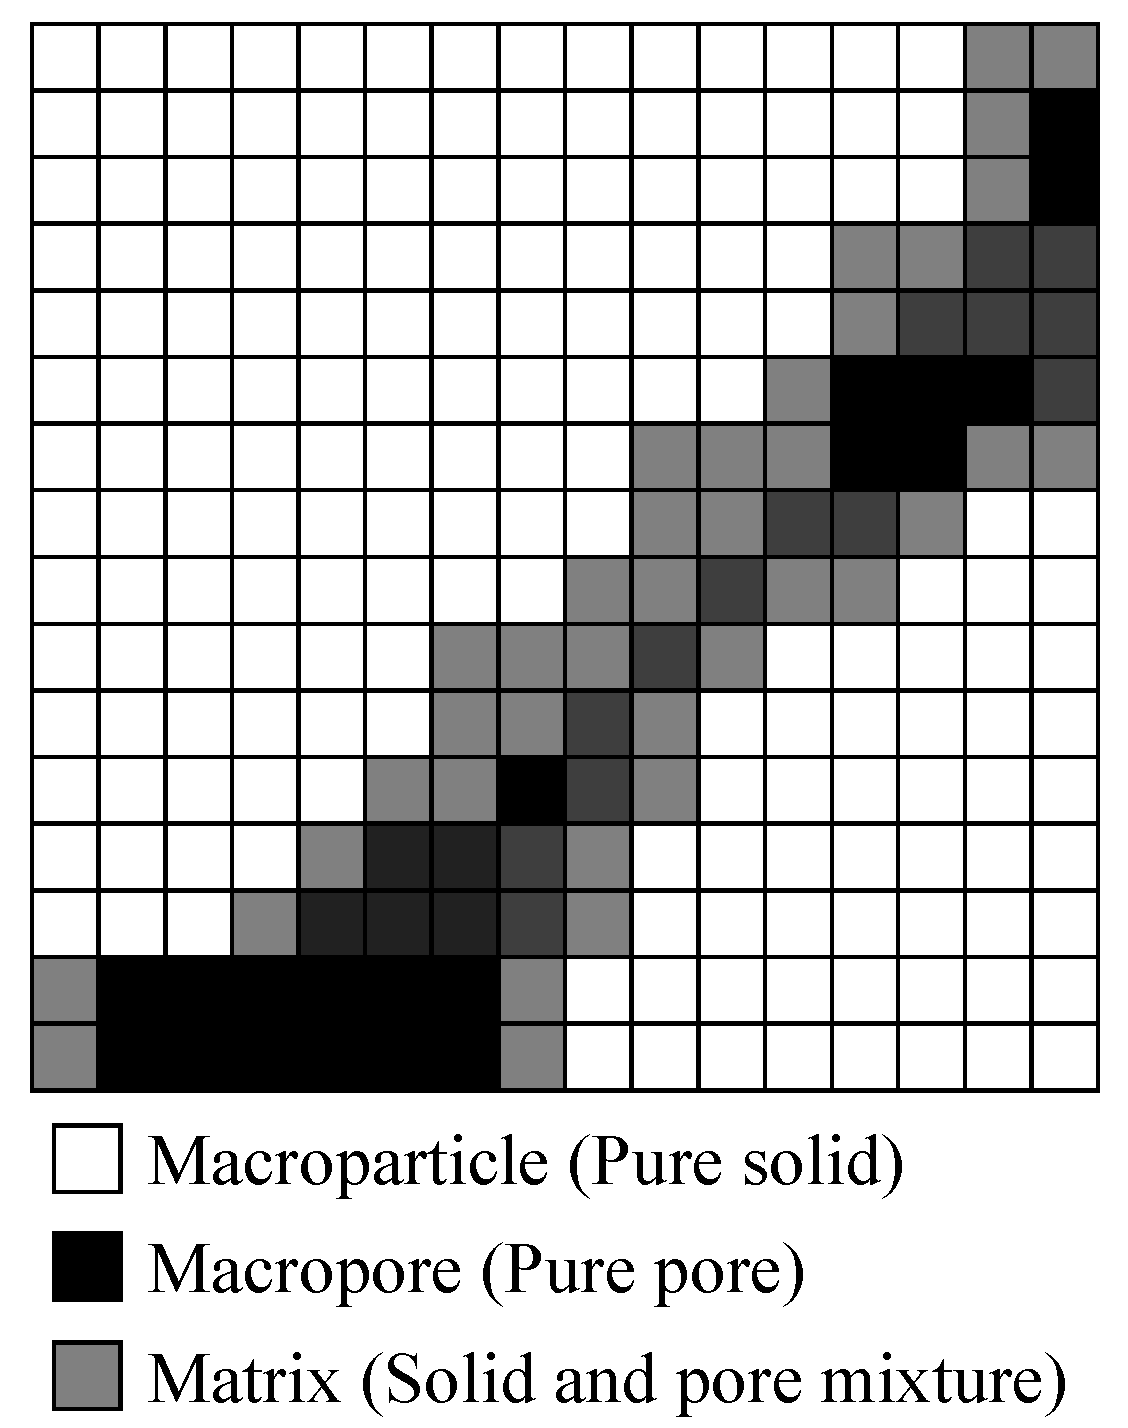
Figure 1. Schematic diagram illustrating the three components identified from CT images. Macropores (black) are exclusively assigned to the gas phase; macroparticles (white) are exclusively assigned to the solid phase; and the matrix (shades of grey) is considered as a mixed phase containing both solid material and subresolution pores.
Minerals 15 00966 g001
Figure 2. Connectivity structures used in the lattice Boltzmann method. (a) D3Q7: each voxel connects to its six face-centred neighbours; (b) D3Q19: connectivity is extended to both face- and edge-centred neighbours; (c) D3Q27: connectivity further includes corner-centred neighbours, resulting in the most comprehensive linkage. These discrete velocity models (DnQm) define the connectivity modes adopted for simulating pore-scale transport.
Minerals 15 00966 g002
Figure 3. Flowchart of the subresolution porosity estimation method used in this study.
Minerals 15 00966 g003
Figure 4. CT voxel models. (a) Belgian Fieldstone; (b) Bentheimer_1; (c) Bentheimer_2.
Minerals 15 00966 g004
Figure 5. Representative slices. (a) Belgian Fieldstone slice-8; (b) Bentheimer_1 slice-400; (c) Bentheimer_2 slice-442.
Minerals 15 00966 g005
Figure 6. Segmentation results for different numbers of clusters. (a) Belgian Fieldstone slice-8; (b) Bentheimer_1 slice-400; (c) Bentheimer_2 slice-442.
Minerals 15 00966 g006
Figure 7. MACs of common minerals in the X-ray energy range of 40–400 keV.
Minerals 15 00966 g007
Figure 8. Porosity distributions of representative sections. (a) Belgian Fieldstone slice-8; (b) Bentheimer_1 slice-400; (c) Bentheimer_2 slice-442.
Minerals 15 00966 g008
Figure 9. Porosity distribution in three dimensions and along the slice order. Each row corresponds to one group: (a) Belgian Fieldstone; (b) Bentheimer_1; (c) Bentheimer_2.
Minerals 15 00966 g009
Figure 10. T2 spectrum to pore size distribution of Bentheimer_1 from NMR.
Minerals 15 00966 g010
Table 1. Summary of sample information.
Sample NameCT Resolution
(μm/Voxel)
X-Ray Energy (keV)3D Voxel Dimensions (Voxel)Mineral Component and Content (wt%)Total Porosity (%)
Belgian Fieldstone4.98100500 × 500 × 500Quartz, Chloriteaveraged 20 [42]
Bentheimer_12.8150800 × 800 × 800Quartz (95.8), Feldspar (2.3), Kaolinite clay minerals (1.9)21~27 [43]
Bentheimer_2 6.0100600 × 600 × 600Quartz, Feldspar, Kaolinite clay minerals21~27 [43]
Table 2. Statistical results of compositional segmentation for the cases.
Sample NameNumber of Macroparticle Types (%)Number of Matrix Types (%)Number of Macroporosity Types (%)
Belgian Fieldstone2 (70.14%)1 (24.59%)1 (5.27%)
Bentheimer_12 (73.93%)1 (4.52%)1 (21.55%)
Bentheimer_21 (68.93%)1 (14.19%)1 (16.88%)
Table 3. Range of LACs and clustering centres.
Sample NameComponentCluster RangeCluster Centres
Belgian FieldstoneMacroparticle 132,019~65,53535,631.1
Macroparticle 2 (Quartz)22,760~32,01826,880.5
Matrix10,923~22,75915,256.6
Macropore0~10,922 (Air)-
Bentheimer_1Macroparticle 114,173~32,76514,602.3
Macroparticle 2 (Quartz)12,721~14,17213,550.8
Matrix11,373~12,72012,160.0
Macropore−32,715~11,37210,584.3
Bentheimer_2Macroparticle (Quartz)8364~65,5359948.8
Matrix995~83636779.0
Macropore0~994 (Air)-
Table 4. Density and X-ray MACs of minerals in the samples.
Mineral NameChemical FormulaCrystal Density
(g/cm3)
MACs (cm2/g)
IlliteK0.6–0.85(Al,Mg)2(Si,Al)4O10(OH)22.800.178 (100 keV)
0.151 (150 keV)
KaoliniteAl2Si2O5(OH)42.680.193 (100 keV)
0.152 (150 keV)
QuartzSiO22.650.165 (100 keV)
0.125 (150 keV)
Table 5. Upper limits of the matrix LAC ( μ l _ m a x ) in the samples.
Sample NameX-Ray Energy (keV)Main Components of the MatrixCalibrated Mineral μ l _ m a x
Belgian Fieldstone100IlliteQuartz1.14 μ l _ p
Bentheimer_1150KaoliniteQuartz 1.23 μ l _ p
Bentheimer_2100KaoliniteQuartz 1.18 μ l _ p
Table 6. Comparison of the results of different porosity estimation methods using CT images.
ABCalculation Results of Total Porosity (%)A1(%)A2(%)Reference range for Total Porosity (%)
CDE
Matrix Content (%)Macroporous Content (%)Binarisation Method Subresolution   Method :   Disregarding   μ m and ρ. Subresolution   Method :   Considering   μ m and ρ.
(This Paper)
(C-E)/100A E(E-D)/A
Belgian Fieldstone24.595.2729.8621.5223.451.11
(total 27.33)
7.85averaged 20 [42]
Bentheimer_14.5221.5526.0725.6825.980.08
(total 0.35)
6.6421~27 [43]
Bentheimer_214.1916.8831.0718.5320.733.52
(total 49.88)
15.521~27 [43]
Disclaimer/Publisher’s Note: The statements, opinions and data contained in all publications are solely those of the individual author(s) and contributor(s) and not of MDPI and/or the editor(s). MDPI and/or the editor(s) disclaim responsibility for any injury to people or property resulting from any ideas, methods, instructions or products referred to in the content.