Article

Process Mineralogy Study and Flotation Testwork of a Complex Lead–Gold Rougher Concentrate

1
School of Metallurgy, Northeastern University, Shenyang 110819, China
2
Liaoning Tianli Gold Industry Co., Ltd., Dandong 118103, China
3
Joe Zhou Mineralogy Ltd., Peterborough, ON K9L 2A6, Canada
4
China National Gold Group Co., Ltd., Beijing 100011, China
*
Authors to whom correspondence should be addressed.
Minerals 2025, 15(9), 967; https://doi.org/10.3390/min15090967
Submission received: 5 June 2025 / Revised: 7 August 2025 / Accepted: 4 September 2025 / Published: 12 September 2025
(This article belongs to the Section Mineral Processing and Extractive Metallurgy)

Abstract

A lead–gold rougher concentrate was studied to investigate the efficiency of mineral processing. Using process mineralogy as the guiding theory, mineralogical parameters such as chemical composition, mineral composition, mineral particle size, and symbiotic association between minerals were studied in detail. A systematic lead flotation testwork program was carried out to obtain the optimal flotation and separation conditions, and the products obtained were analyzed. The results show that the concentrate contains a wide variety of minerals with complex material composition, and the lead mineral was mainly galena with a relative content of 3.43% and a particle size −37 μm accounting for 94.72%, while the gold minerals were dominated by electrum. The grades of gold, silver, and lead in the balland obtained through the flotation closed-circuit test were 512.10 g/t, 1632.80 g/t, and 40.38%, and the recoveries were 70.65%, 73.86%, and 75.37%, respectively. The gold lost in the flotation tailings was mainly dominated by gold encapsulated in metal sulfide (accounting for 55.67%), and the lead lost was mainly in gangue and metal oxides (accounting for 62.72%).

1. Introduction

Lead is an important industrial raw material due to its low melting point [1], high corrosion resistance, and strong X-ray shielding capacity. It is widely used in various industries, including chemical manufacturing and battery production [2,3]. Gold and silver, as two critical precious metals, not only have broad industrial applications but also serve as vital assets for investment and national reserves [4]. These metals are commonly found in their native states or embedded within the structures of sulfide and silicate minerals, frequently coexisting with minerals such as chalcopyrite, galena, sphalerite, and pyrite [5,6]. In most flotation plants, gold is often enriched alongside lead, copper, zinc, and pyrite minerals [7]. With the depletion of high-grade, easily processed ore resources, increasing attention in the mining sector has shifted toward the efficient utilization of complex and refractory polymetallic ores. Among these, lead-bearing polymetallic concentrates have become a research focus due to their significant economic potential [8,9]. These concentrates typically contain lead, gold, silver, and other valuable metals. The efficient separation and enrichment of these metals are not only essential for maximizing economic returns but also play a key role in improving mining efficiency and resource utilization rates [10,11]. Lead–gold mixed rougher concentrates often exhibit complex compositions. In addition to galena (PbS), they commonly contain pyrite (FeS2), sphalerite (ZnS), arsenopyrite (As2S3), and native gold and silver [12,13]. The intricate interlocking of these minerals, combined with their diverse physical and chemical properties, poses significant challenges to traditional mineral processing techniques [14,15]. For instance, lead minerals are often finely disseminated, while gold and silver may occur as ultrafine particles embedded within sulfide minerals [16,17], rendering them difficult to recover via single beneficiation methods [18]. Therefore, integrated separation strategies are required [12].
Depending on the bulk mineralogy and metal deportment, gravity concentration and flotation are often employed prior to chemical treatment [5]. Among them, flotation is the preferred method due to its effectiveness in concentrating and separating fine-grained minerals [19]. However, to optimize flotation performance, a detailed process mineralogical investigation must be conducted in advance to guide reagent selection and parameter settings. As an interdisciplinary field integrating mineralogy, metallurgy, and materials science, process mineralogy has become a powerful theoretical tool for addressing the beneficiation challenges of complex ores [10,20]. Through systematic analysis of mineral composition, particle size distribution, liberation characteristics, texture, and mineral associations, process mineralogy provides essential data for flowsheet design and optimization [21]. Modern analytical techniques such as mineral liberation analysis (MLA), scanning electron microscopy (SEM), and electron probe microanalysis (EPMA) enable quantitative determination of the occurrence states and interactions of valuable minerals. Such information is critical for guiding the selection and adjustment of beneficiation processes including flotation, gravity separation, roasting, and leaching [22,23].
As one of the most commonly and effectively used techniques for treating sulfide ores and their complex counterparts, flotation has been extensively applied in the recovery of galena, gold, and silver minerals [24,25]. However, flotation efficiency is greatly influenced by factors such as mineral liberation, reagent regimes, and process parameters [26]. Previous studies have demonstrated that a deep understanding of mineral surface chemistry, particle size effects, and interlocking relationships is essential for improving flotation performance [3,27]. Luo et al. [28] enhanced lead mineral recovery from low-grade lead–zinc ores by raising slurry concentration from 27% to 55%, increased lead recovery from 60% to 80%, and boosted lead grade from 27.5% to 29.1%. Li et al. [13] proposed a synergistic MIBC + kerosene decarburization before flotation to reduce metal loss, and achieved subsequent flotation recoveries of lead and zinc at 87.64% and 94.09%, respectively. Yu et al. [9] conducted detailed mineralogical characterization and flotation optimization on low-grade oxidized lead–zinc ore. Through the study, they clarified the mineral symbiosis and determined an optimal process route, achieving a lead grade of 2.83% with 57.56% recovery, and a zinc grade of 28.64% with 83.45% recovery. Li et al. [10] employed a gold flotation-concentrate leaching lead–zinc flotation process for low-grade refractory ores. This yielded a gold concentrate with an Au concentration of 40.23 g/t and 86.25% recovery, achieving a 98.76% leaching rate, along with effective recovery of lead and zinc.
The complex lead–gold rougher concentrate investigated in this study was derived from a pre-concentration flotation operation and features a complex mineralogical composition. It primarily includes galena, pyrite, arsenopyrite, electrum, and minor amounts of chalcopyrite and sphalerite. Preliminary chemical analysis revealed that the concentrate contained 3.74% Pb, 50.50 g/t Au, and 154.80 g/t Ag, indicating high economic value. However, most of the gold was either embedded in or encapsulated by fine-grained sulfide minerals, posing significant challenges to traditional flotation and leaching technologies.
In this study, a detailed process mineralogical analysis of the Pb–Au concentrate was carried out using X-ray fluorescence spectrometry (XRF), mineral liberation analysis (MLA), and electron probe microanalysis (EPMA) and polarized light microscopy. This work characterized the mineral composition, particle size, and mineral associations of lead, gold, and silver, providing theoretical support for selecting appropriate flotation methods. Systematic flotation experiments were conducted to determine optimal separation conditions. Additionally, exploratory cyanide leaching tests were performed on the flotation concentrate, and the products were thoroughly evaluated. By integrating process mineralogy with flotation techniques, this study proposes a theoretical and technical framework for the efficient utilization of complex Pb–Au rougher concentrates. The findings offer valuable guidance for the comprehensive recovery of similar refractory polymetallic mineral resources and hold significant academic and engineering implications.

2. Experiment

2.1. Materials

2.1.1. Sample

The lead–gold rougher concentrate material, weighing approximately 200 kg, was received from a company in Liaoning. The sample was dried, blended, split, and bagged for the testwork.

2.1.2. Reagent

Activated carbon and sodium sulfide were used as detackifiers; zinc sulfate, sodium thiosulfate, sodium sulfide, and sodium sulfite were used as inhibitors; sulfur, SN9, butyl ammonium black, aniline black, ethyl yellow, isopropyl yellow, and CG1325 as trapping agents; and MIBC as a foaming agent. Sodium cyanide was used as the leaching agent for gold, while sodium carbonate and calcium oxide were used as slurry conditioners. Tap water was used throughout, and all chemicals were sourced from McLean Biochemical Technology Co. (Shanghai, China). All reagents were of analytical grade, and pH modifiers were used as necessary for the reactions.

2.2. Methods

2.2.1. Process Mineralogy Study

Lead, gold, and silver in the raw materials were characterized using a Mineral Liberation Analyzer (Thermo Fisher Scientific, Waltham, MA, USA), Polarizing Microscope (Eclipse LV100POL, Nikon, Tokyo, Japan), Electron Probe Microanalyzer (EPMA JXA-8230, UZONGLAB, Shanghai, China), and Scanning Electron Microscope (Sigma 300, Kefu Mechanical and Electrical Equipment Co., Ltd., Hangzhou, China). Various particle size fractions were analyzed for mineralogical characteristics and mineral liberation. The chemical composition of the sample was analyzed using an X-ray Fluorescence Spectrometer (EDX-7000, Xinyichuang Technology Co., Ltd., Shenzhen, China) and an Inductively Coupled Plasma Spectrometer (PerkinElmerAvio550, PerkinElmer, Shanghai, China).
To analyze the particle size distribution and morphology of gold minerals, heavy mineral concentrates were first obtained through manual panning (gravity concentration). The recovered concentrate was then observed under a polarizing microscope. Gold particles were manually picked and transferred onto glass slides for imaging. Their sizes were measured using a calibrated eyepiece micrometer, and morphological types were recorded and classified based on visual characteristics (e.g., flaky, angular, elongated). A sufficient number of particles were examined to ensure representative statistical data. This manual method was adopted due to the low content and fine-grained nature of the gold particles, and was effective in capturing their liberation state and surface features.

2.2.2. Flotation

The flotation test was conducted by preparing a slurry with 28% solid concentration (comprising 500 g of ore and water) in a plastic bucket. The slurry was stirred using a mechanical stirrer at 400 rpm for 5 min. After mixing, the slurry was quantitatively transferred to a 1.5 L air-inflated flotation cell for testing. Care was taken to prevent sample stratification during transfer. The flotation machine was operated at 1900 rpm. Depending on the test requirements, reagents such as collector, inhibitor, depressant, regulator, and frother were added, and pH monitoring was conducted during the flotation tests. Flotation was performed at room temperature, with a mixing time of 8 min. The flotation concentrates, middlings, and tailings were dried, weighed, and sampled for analysis of the target element grades. The corresponding yields and recoveries were then calculated.

2.2.3. Leaching

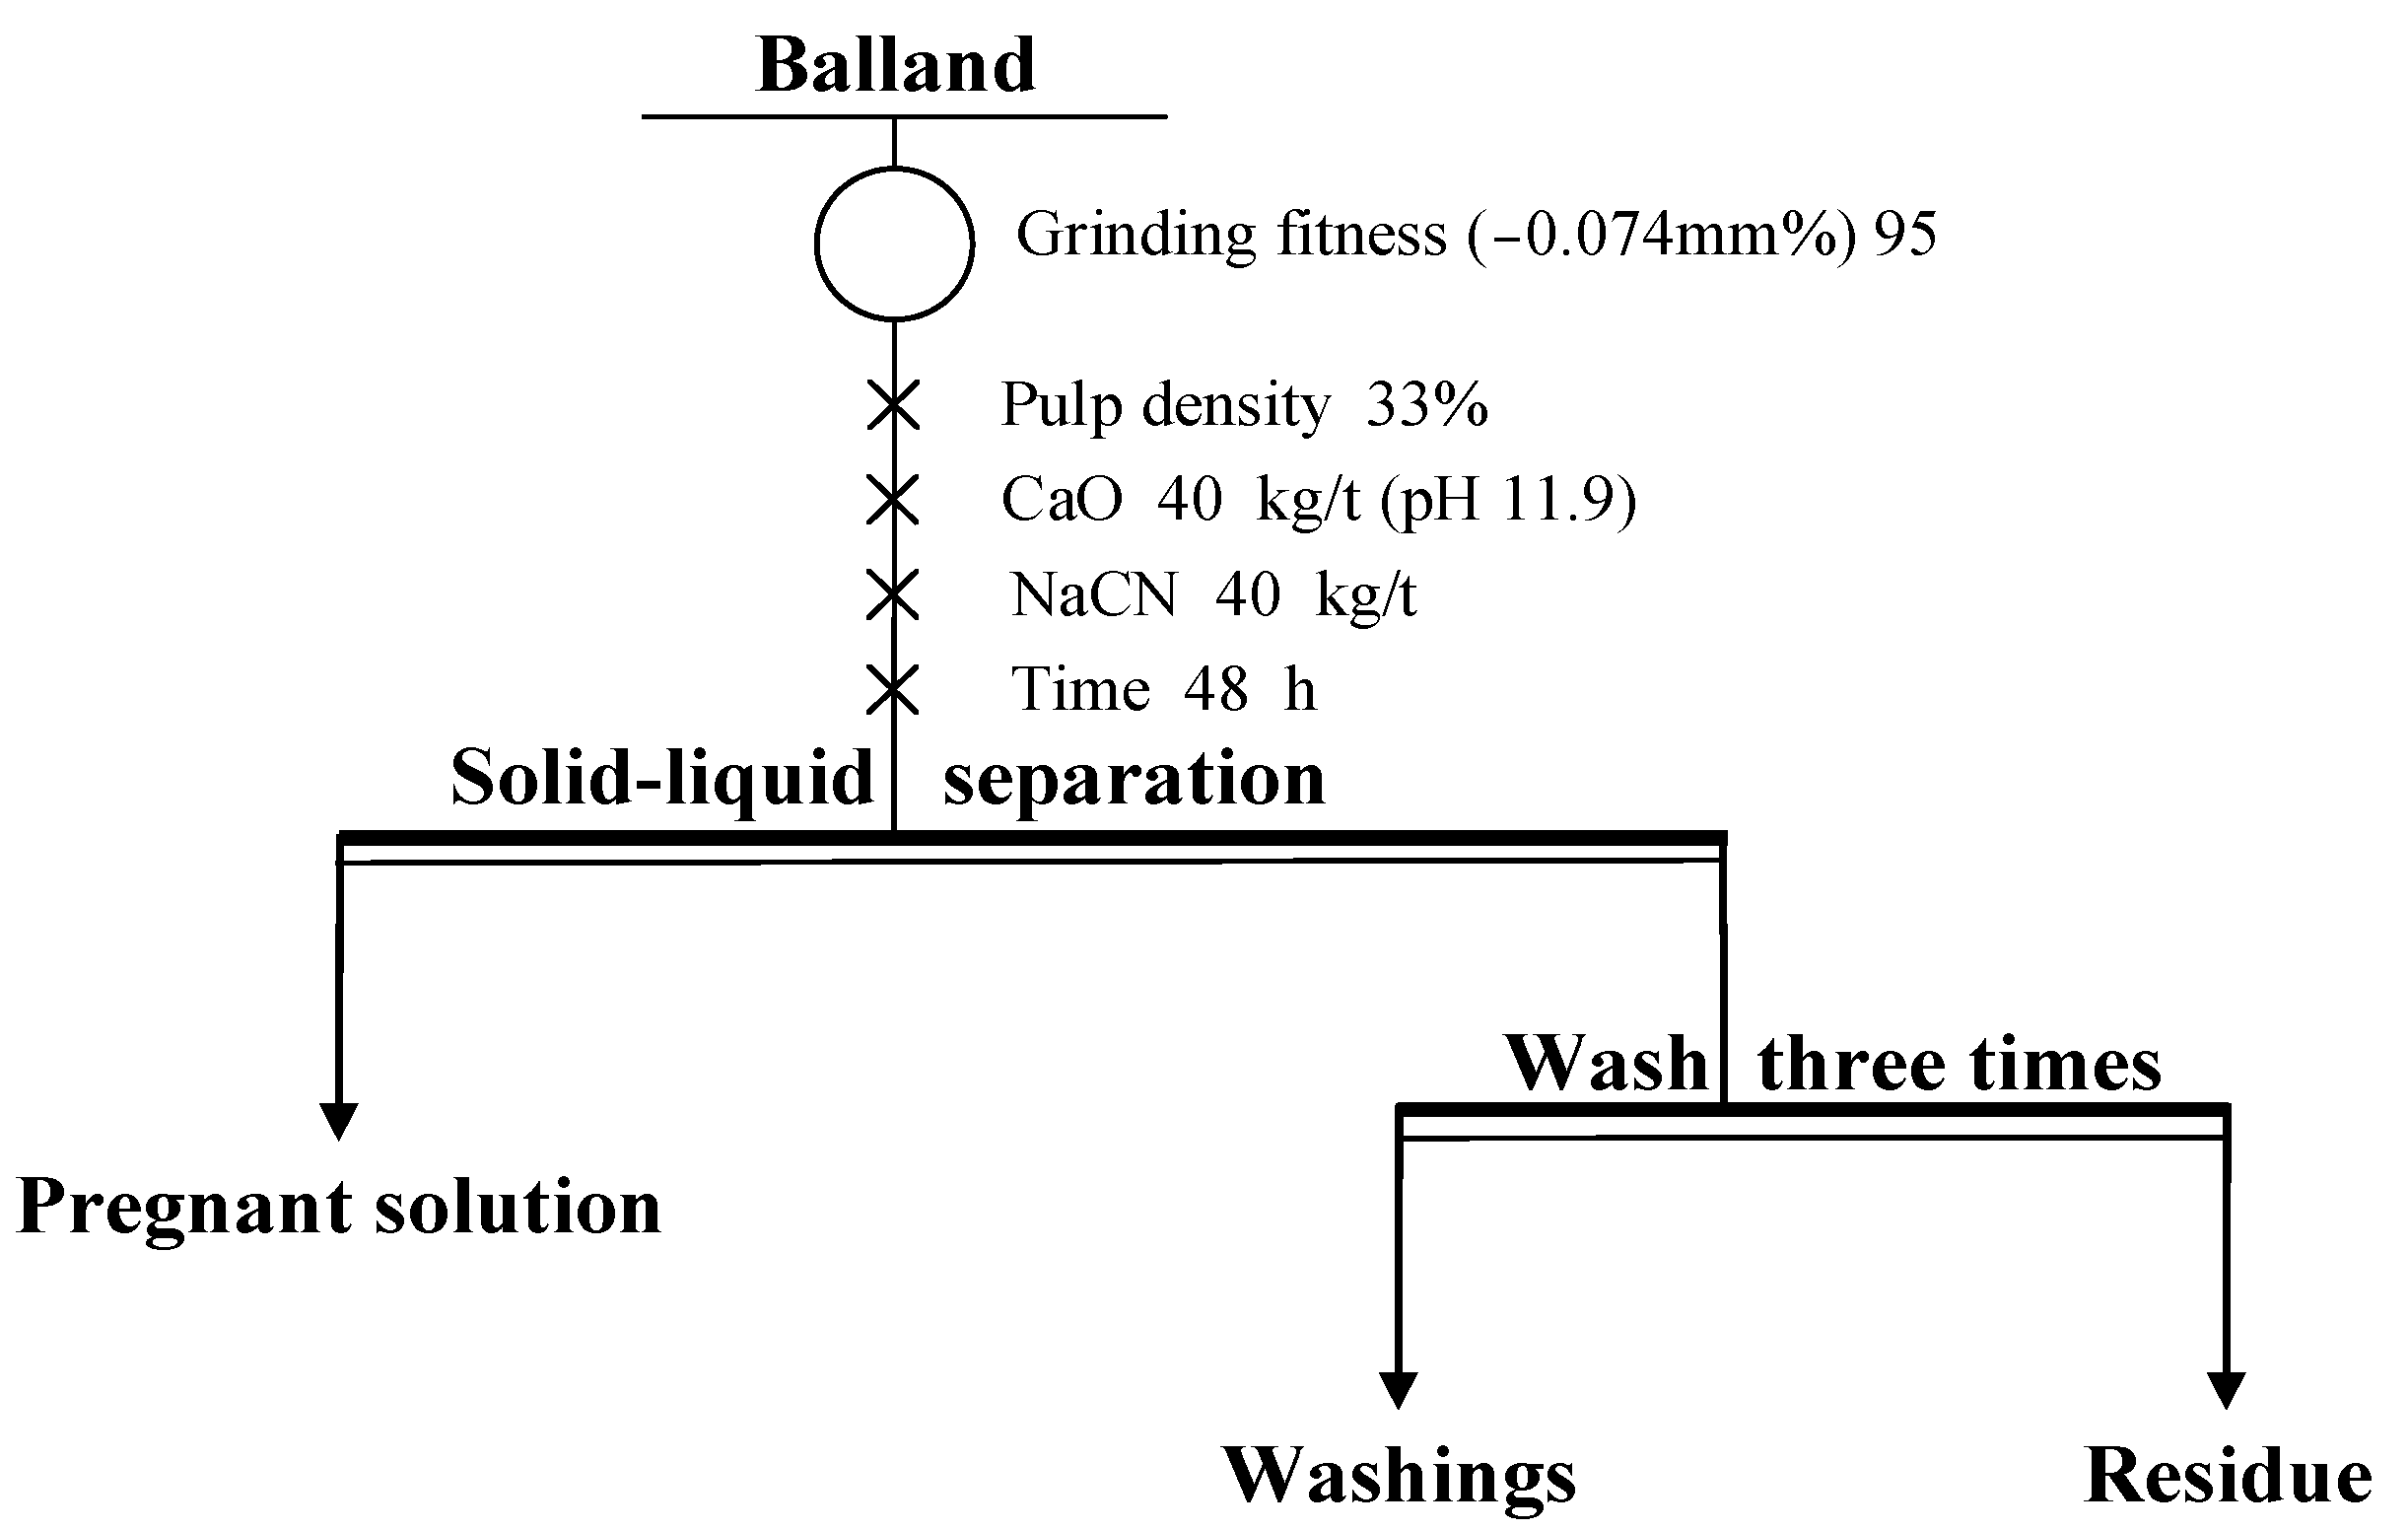
Leaching tests were conducted in a 0.5 L conical flask in the magnetic stirring water bath with a slurry concentration of 33%. A 100 g concentrate sample and water were added, followed by pretreatment with calcium oxide for a specified duration. Sodium cyanide was then added for leaching over a period of 48 h. The leachate and leaching residue were collected. The residue was washed three times before being sent for analysis. The leaching rate (α) was calculated using the following formula: where m0 and mt are the ore masses before and after leaching, and w0 and wt represent the corresponding metal grades.
α = 1 m t w t / m 0 w 0
Comparative tests analyzed the fluctuation range of recovery and grade for each factor in the flotation condition tests, assessing the impact of these factors on flotation indices. The fluctuation range was calculated as follows:
γ = γ m a x γ m i n
β = β m a x β m i n
where γ represents the recovery rate, fluctuation β represents the grade fluctuation, γ m a x represents the maximum recovery rate of each factor, and γ m i n represents the minimum recovery rate of each factor. β m a x is the maximum grading rate of each factor and β m i n is the minimum grading rate of each factor [9].

2.3. Process Flow Chart

The process flow chart is presented in Figure 1. The complex and refractory lead–gold rougher concentrate underwent rougher flotation to produce a rougher concentrate and rougher flotation tailings. The rougher concentrate was further cleaned to obtain lead concentrate and cleaner tailings. The balland then underwent preliminary cyanide leaching to produce a gold and pregnant solution enriched in silver and leaching residue.

3. Results and Discussion

3.1. Process Mineralogy Analysis

3.1.1. Chemical Composition

The spectral analysis, multi-element analysis, and lead phase analysis results of the lead–gold rougher concentrate are presented in Table 1 and Table 2, respectively. Chemical composition analysis (Table 1) shows that the concentrations of Au and Ag in the samples were 50.5 g/t and 154.8 g/t, respectively. The concentrations of Pb, Zn, As, S, and SiO2 were 3.74%, 1.59%, 10.61%, 35.89%, and 11.06%, respectively, indicating that the sample comprised sulfide, arsenate, and silicate minerals. The main recoverable metals were gold, silver, lead, iron, and zinc. This study primarily focuses on the recovery of lead, gold, and silver minerals. Table 2 shows that lead minerals were present as sulfides (89.84%) and oxides (10.16%). These results indicate that the sample was a low-grade lead–zinc–gold–silver mixed sulfide concentrate with significant amounts of iron, silicon, and arsenic.

3.1.2. Composition and Mineralogical Characteristics

Composition and Content
As shown in Table 3, the composition of the rougher concentrate revealed 82.14% metal sulfides, primarily pyrite, and arsenopyrite, with minor galena, sphalerite, chalcopyrite, chalcopyrite, antimony lead sulfide, cuprite, azurite, and zoisite. Metal oxides constituted 1.37%, mainly lead oxides, limonite, hematite, and magnetite. Gangue minerals were predominantly quartz, with lesser amounts of feldspar, carbonate, mica, and small quantities of other gangue minerals. Gangue minerals were composed mainly of quartz, followed by feldspar, pyroxene, carbonate, and mica, with other minerals present in minor amounts.
Particle Size Distribution of Major Metal Sulfides
Pyrite and arsenopyrite were predominantly concentrated in medium-size fractions (−0.074~+0.037 mm), accounting for 64.32% and 64.95% respectively, with 25%–28% in coarse fractions (>0.074 mm). In contrast, chalcopyrite and galena exhibited significant fine-grained characteristics: 86.70% of chalcopyrite and 94.72% of galena occurred in fine fractions (<0.037 mm) (Table 4).
Mineral Locking Characteristics
As illustrated in Figure 2a–c, pyrite was the predominant metal sulfide in the sample, accounting for 51.16% of the total mineral content. Its particle size predominantly ranged from 0.074 mm to 0.037 mm, appearing mainly as crystalline or semi-crystalline grains. Cubic and pentagonal dodecahedral forms were rare. Pyrite primarily occurs as liberated grains (79.76%), with minor associations with arsenopyrite, chalcopyrite, galena, and sphalerite. In certain cases, chalcopyrite and galena were observed filling fractures in pyrite or being encapsulated by other metal sulfides. Gold minerals were found within or along the edges of pyrite, indicating that pyrite acts as a carrier mineral for gold [29].
As illustrated in Figure 2d,e, arsenopyrite was the primary arsenic-bearing sulfide, comprising 21.21% of the mineral content, with grain sizes ranging from 0.1 mm to 0.037 mm. Its morphology is predominantly rhombic, wedge-shaped, or columnar in semi-autoclastic forms, with granular types being uncommon. Arsenopyrite mainly occurs as individual grains, with some particles locked within gangue or associated with galena and sphalerite. As shown in Figure 2f, arsenopyrite is closely associated with gold minerals, often encapsulating them, and thus acts as a major carrier of gold.
As illustrated in Figure 2g–i, galena accounted for 3.43% of the mineral content, primarily occurring as irregular grains. Some grains occurred in a semi-autonomous state, while others were embedded within or associated with pyrite. Galena particles were mostly smaller than 0.037 mm and were primarily associated with pyrite, chalcopyrite, and sphalerite. Lead oxides were frequently observed along galena grain boundaries (Figure 2j,k), and no gold minerals were detected in association with galena.
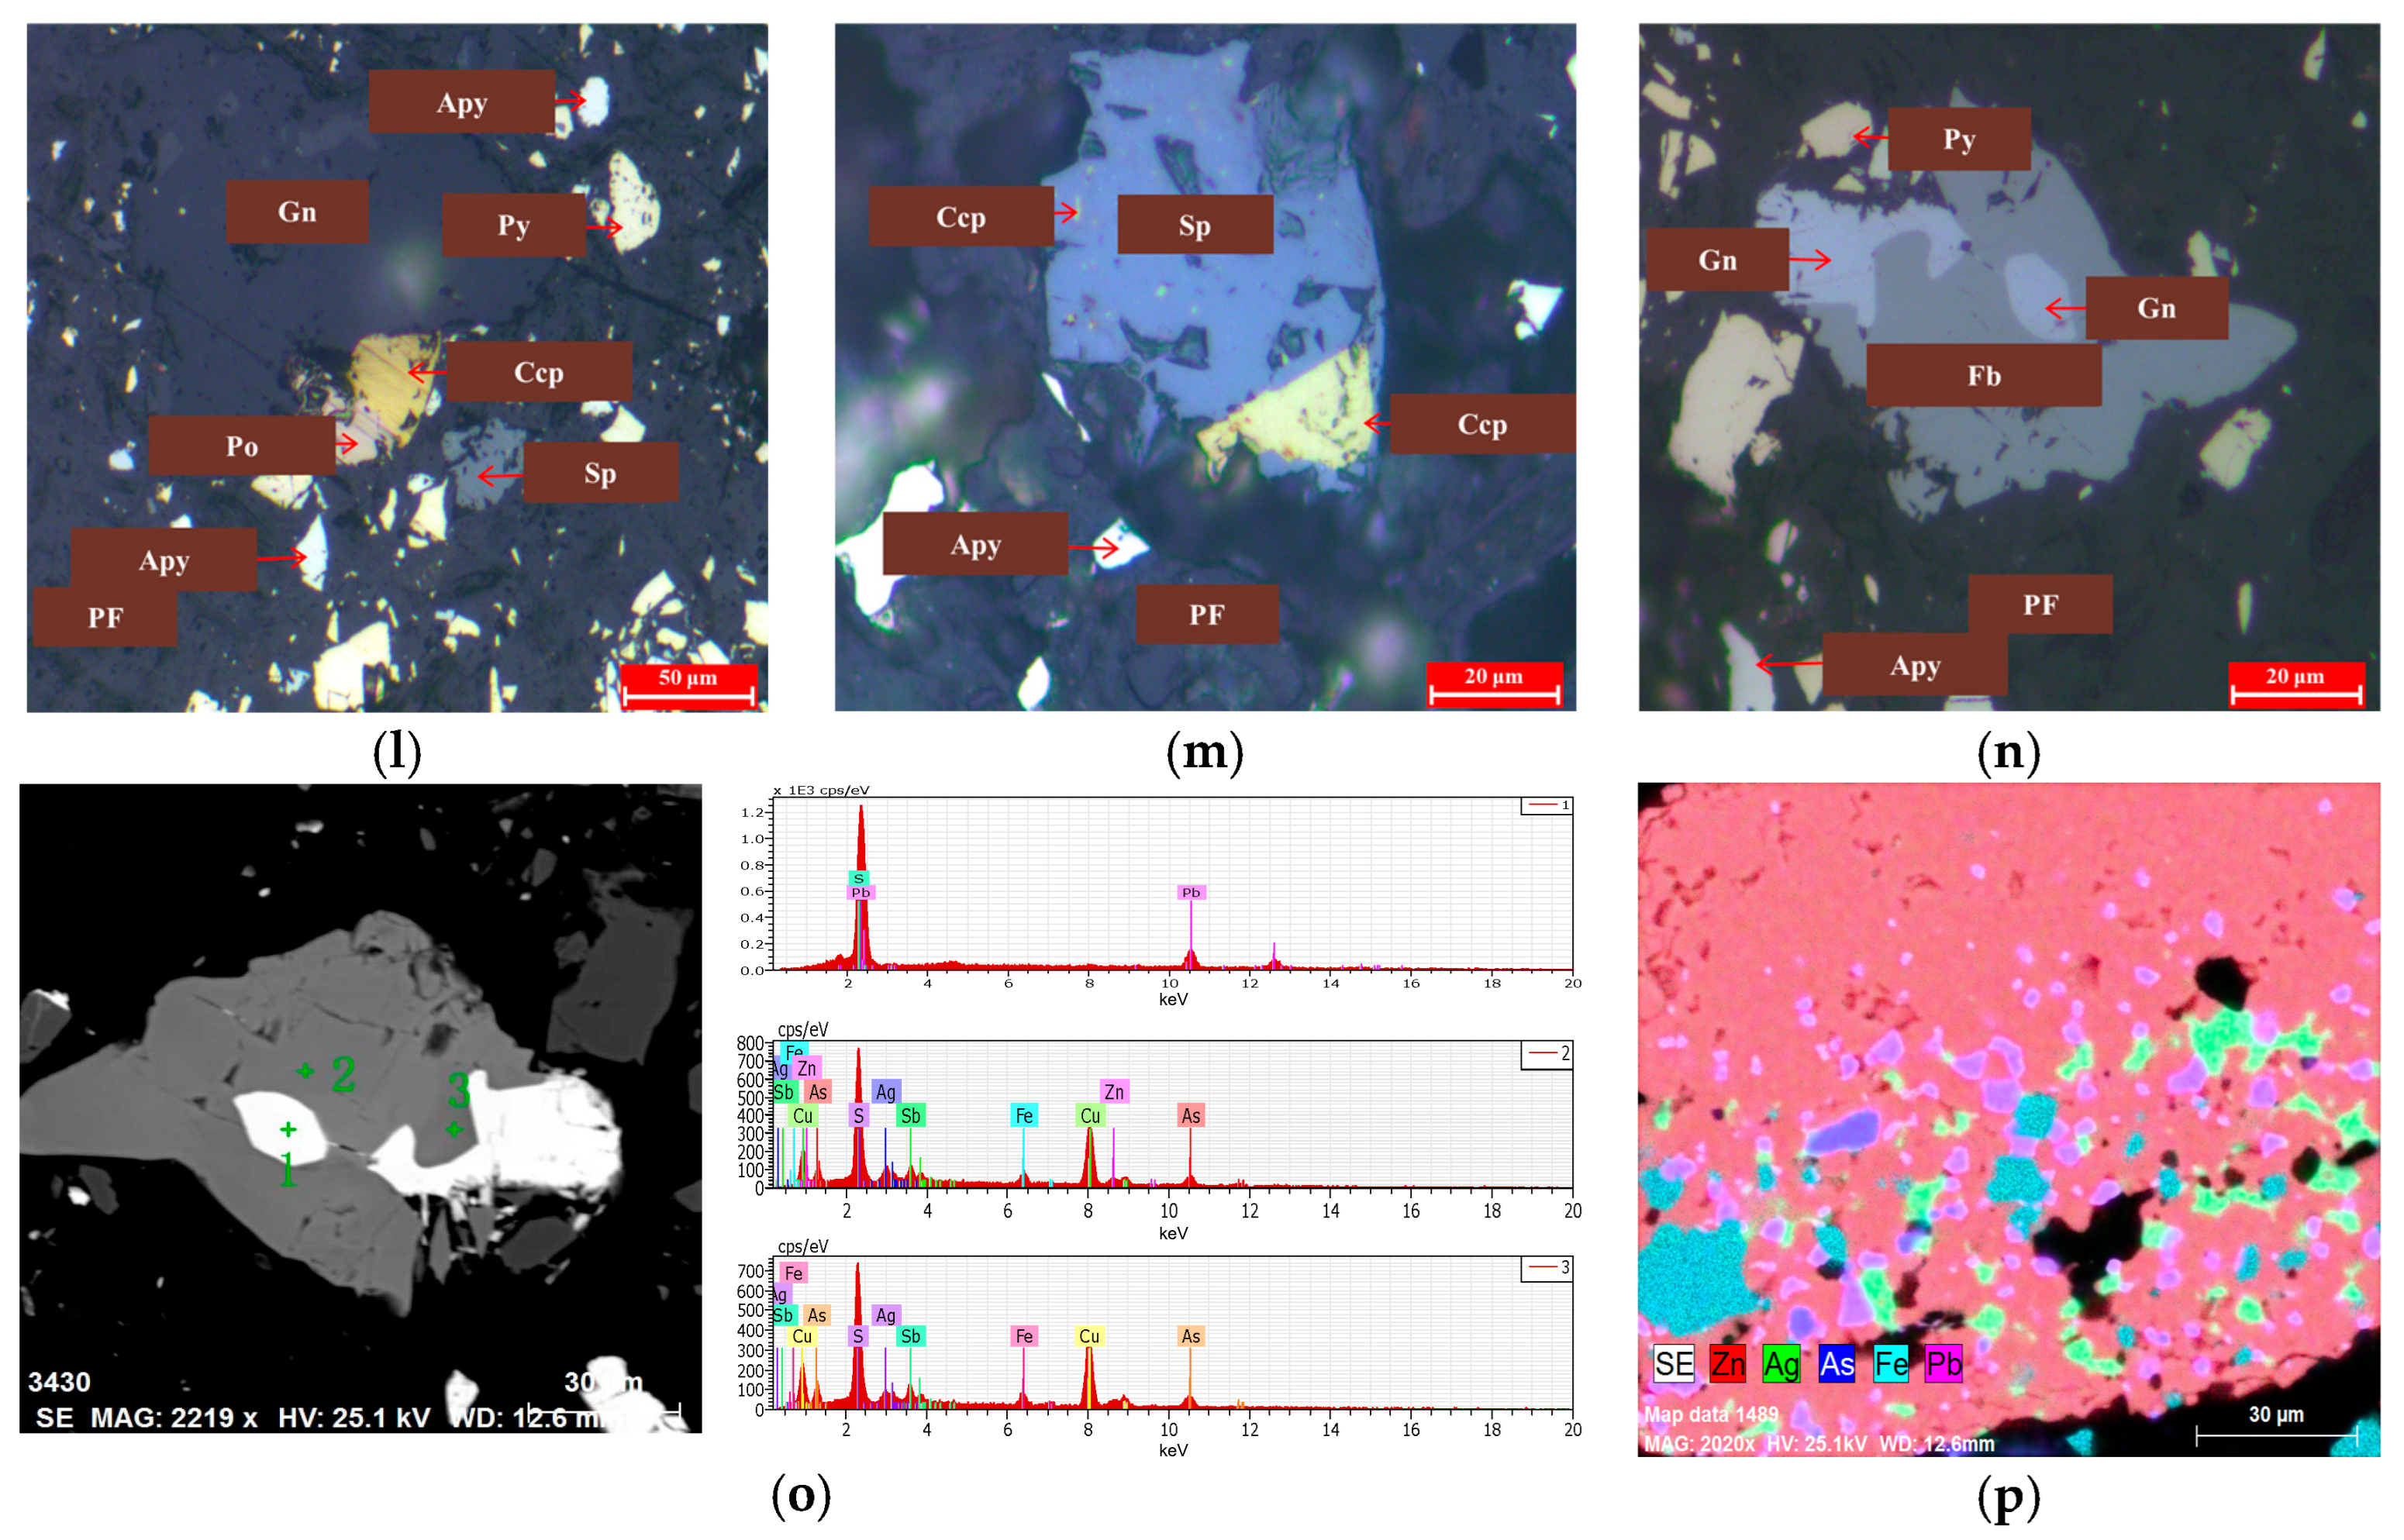
According to Figure 2l,m, chalcopyrite and covellite together constituted 0.41% of the total mineral content, whereas tetrahedrite and freibergite accounted for only 0.01%. Chalcopyrite grains were generally <0.037 mm and exhibited a granular morphology. Some chalcopyrite grains were located along galena edges or secondary copper minerals, with minor exsolution dispersed in sphalerite, indicating a close association with other sulfides. Chalcopyrite predominantly occurred as individual grains (Figure 2n). Tetrahedrite and freibergite occurred in trace amounts and were typically associated with or enclosed within galena, chalcopyrite, or sphalerite. Tetrahedrite often contained silver, with concentrations reaching freibergite levels (Figure 2o). The element mapping image in Figure 2p provides a reference for the complex multiphase distribution of ore metals [30].
Using MLA and optical microscopy, the locked association of pyrite, arsenopyrite, and galena was examined and summarized in Table 5 [21]. Pyrite, arsenopyrite, and galena mainly existed as liberations, comprising 60%–80% of total minerals, followed by sulfides that were associated or encapsulated within other sulfides. Pyrite, arsenopyrite, and chalcopyrite were associated with or encapsulated by chalcopyrite, accounting for less than 5%. Galena was encapsulated by chalcopyrite (2.58%), and was associated with chalcopyrite at 8.21%.

3.1.3. Process Mineralogy Characteristics of Gold Minerals

Analysis of Minerals and Fineness
Electrum (fineness 634.9‰) constituted 76.18% of gold minerals by abundance, whereas native gold (fineness 938.9‰) contributed 48.37% of the total gold content (Table 6). Although electrum showed higher distribution proportion in flotation products (68.38% vs. 31.62%), coarse-grained native gold may have been incompletely liberated [31].
Size Distribution of Gold Minerals
As shown in Figure 3a,b and Table 7, a dominant 96.70% of gold minerals occurred in fine fractions (<0.037 mm), with ultra-fine particles (<0.010 mm) accounting for 47.36% (Table 7). Coarse gold (>0.074 mm) constituted only 0.36%, indicating that gold primarily hosts in fine sulfides or as free particles. The largest gold particle observed in this test measured 0.21 × 0.32 × 0.10 mm, seen as a plate flake with an unclean surface (Figure 3c).
The Morphology of Gold Minerals
The morphology of gold minerals, shown in Table 8, was primarily plate-like flakes, elongated angular grains, angular grains, and sharp angular grains, with other morphologies occurring less frequently.
Association of Gold Minerals
The locked association of gold, shown in Table 9 and Figure 4a–c, revealed through selective dissolution tests that 44.38% of gold existed as monolithic gold. Metal sulfide-encrusted gold, primarily encrusted by arsenopyrite and pyrite, accounted for 35.69%. Locked gold accounted for 18.62%, mostly with arsenopyrite (12.52%), with minor amounts of other congenial morphologies. The gold enclosed in gangue comprised 1.31%.

3.1.4. Process Mineralogy Characteristics of Silver Minerals

Content and Distribution
The silver content in Ag-bearing minerals such as tetrahedrite, freibergite, and gold minerals was analyzed by SEM and EPMA compositional analysis, with detailed results shown in Table 10. The average silver content was calculated to be 4.88%, 16.79%, and 29.27%, respectively, with the metal distribution of silver in silver-bearing tetrahedrite, freibergite, and gold minerals at 40.98%, 43.38%, and 9.55%, respectively.
Association Characteristics
As shown in Table 11 and Figure 5, the locked association of silver in the rougher concentrate was analyzed. The relative content of leachable silver was 60.03% (“leachable” silver refers to silver particles with exposed surfaces, which are not encapsulated or tightly bound within sulfide or gangue minerals), while metal sulfide-encrusted silver and gangue and metal oxide-encrusted silver accounted for 21.23% and 18.74%, respectively.

3.2. Flotation Tests

3.2.1. Flotation Conditions Tests

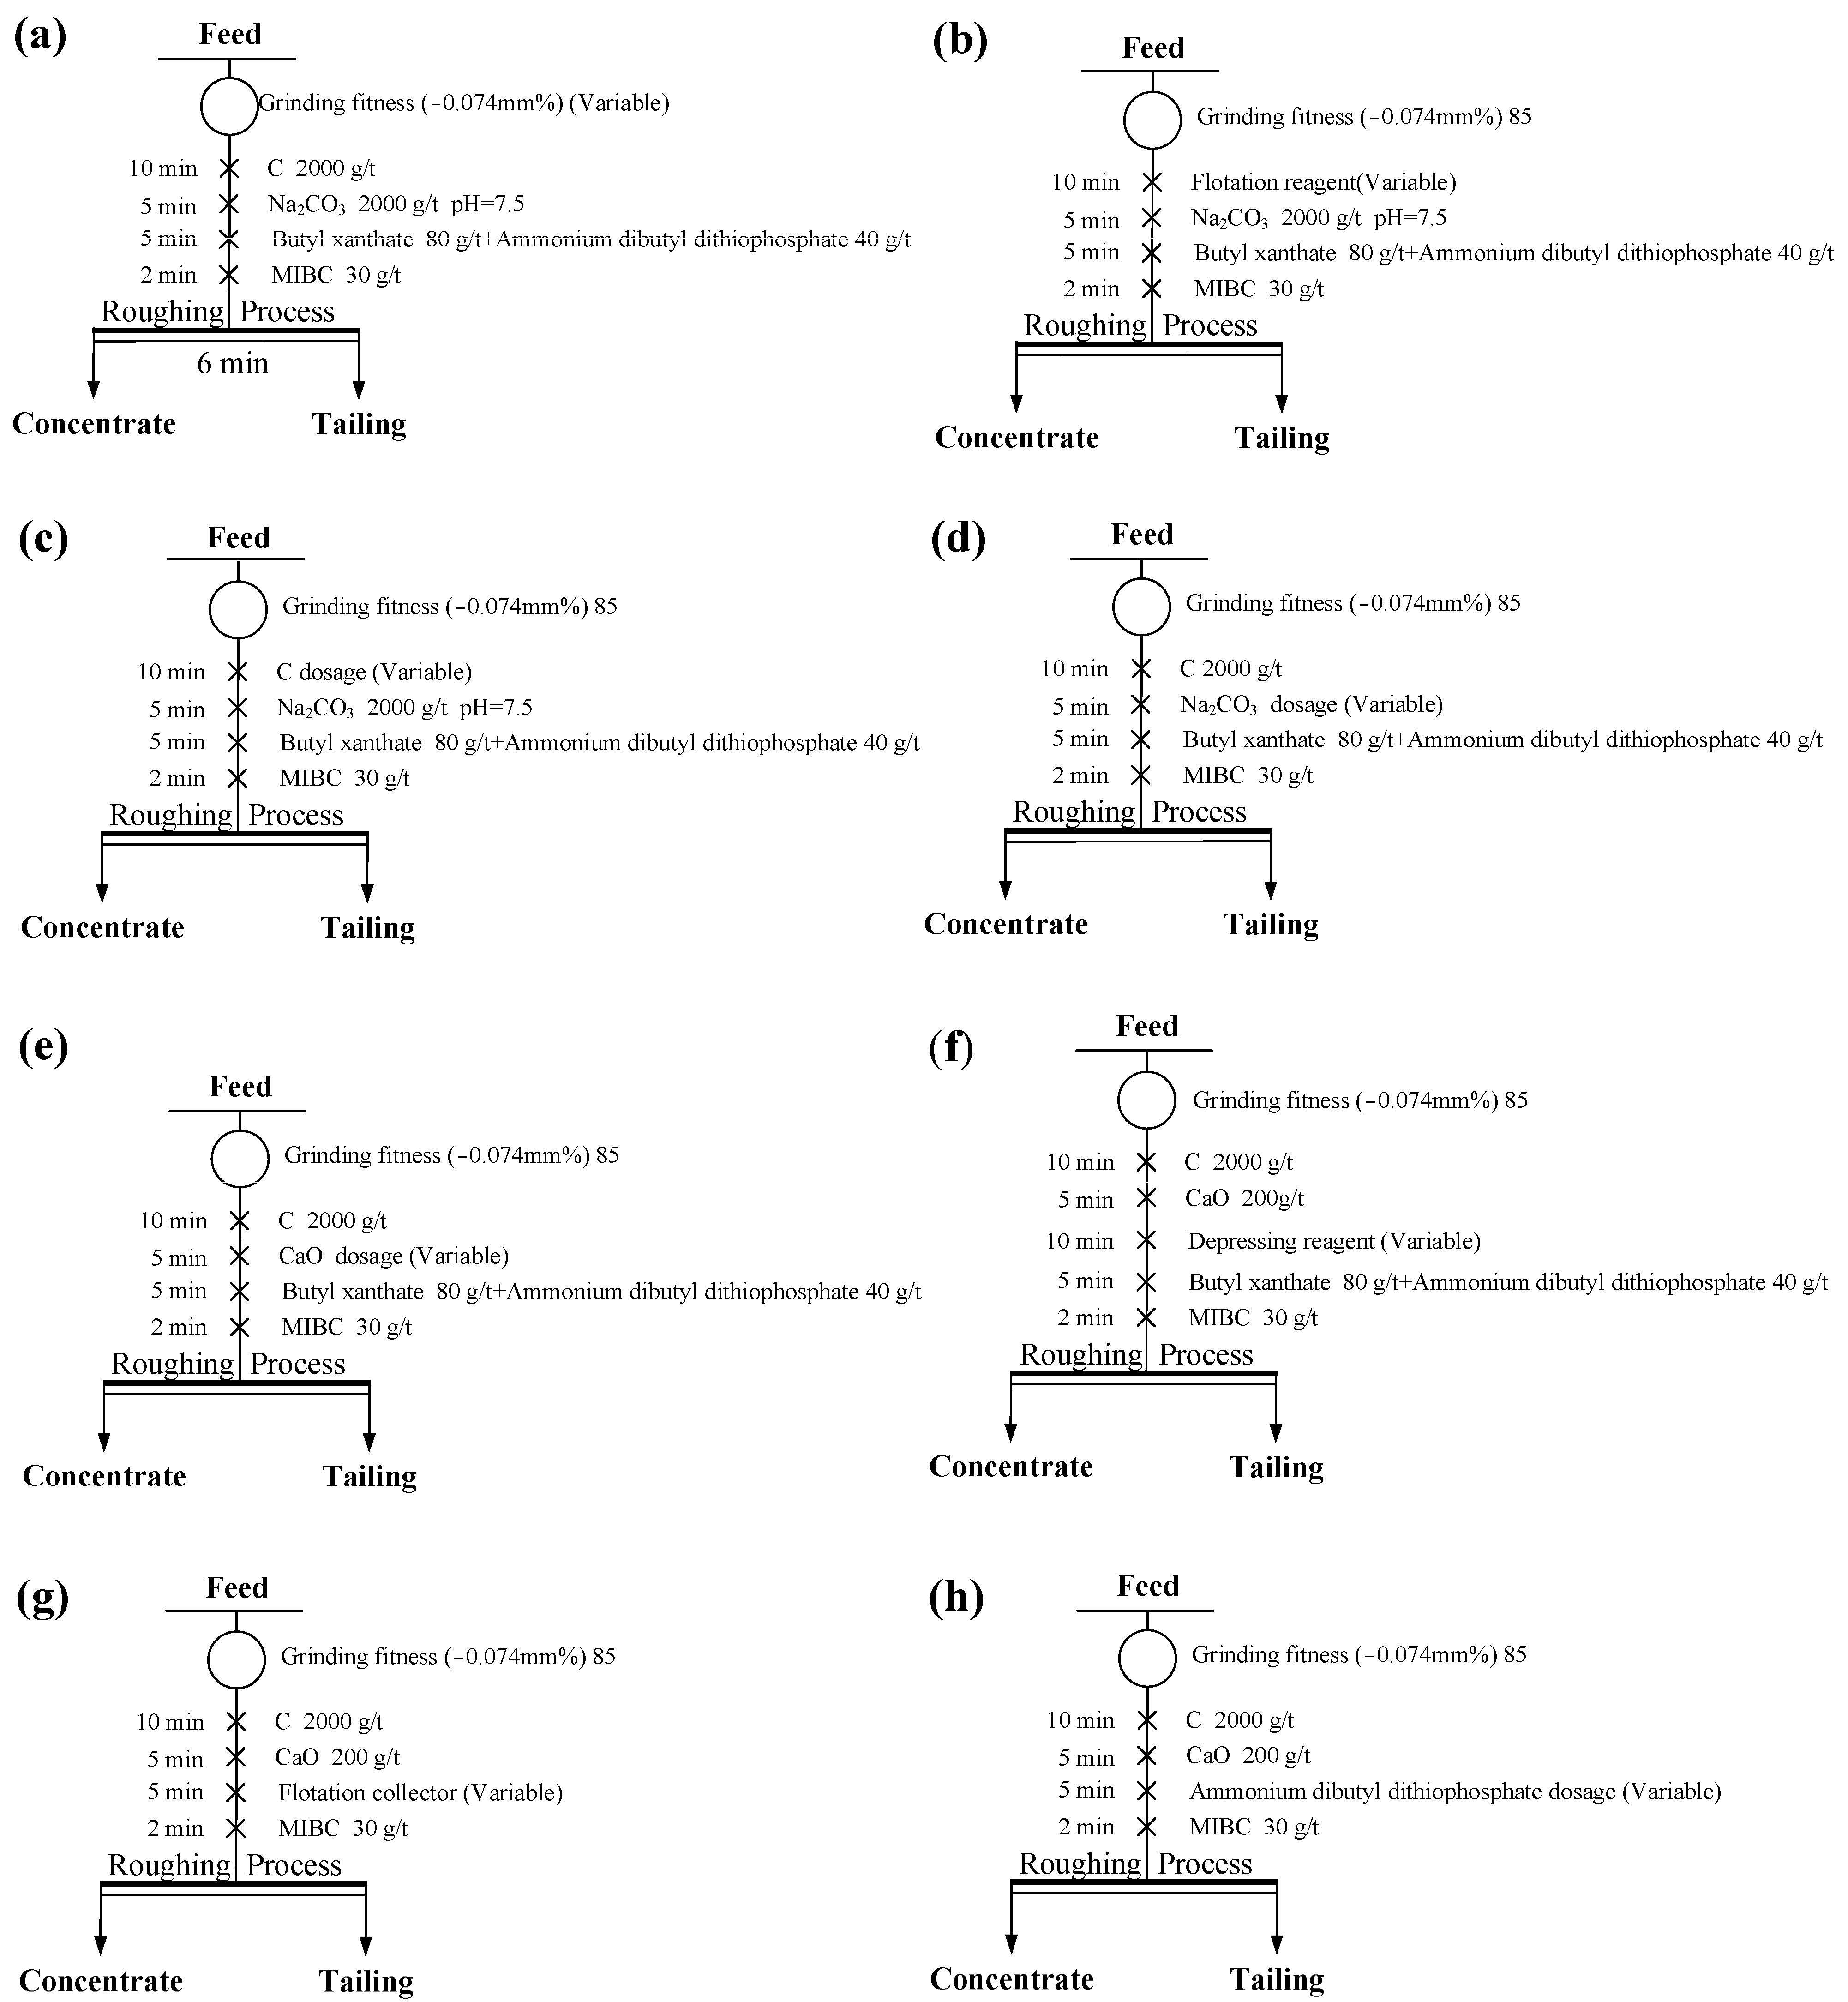
Based on the concentrate’s characteristics and mineral composition, multiple roughing and concentrating stages are typically required to obtain high-quality ballands, as well as gold and silver concentrates. Metal recovery and concentrate grade can be significantly enhanced by selecting appropriate trapping, frothing agents, and conditioners, along with optimizing the flotation process and parameters [32,33]. Consequently, a one-factor test was conducted on the rougher flotation conditions. The lead flotation flow for this process is shown in Figure 6, while Figure 7 displays the effects of key test factors on the lead rougher concentrate’s flotation [9].
Five grinding fineness settings, each representing a different percentage of particles at −0.074 mm, were tested as independent variables to assess their impact on lead recovery and grade [31]. As shown in Figure 7a, when 85% of the particles were at −0.074 mm, lead recovery in the rougher concentrate was 80.54%, and the lead grade was 17.41%. Further increases in fineness showed no significant improvement in flotation indices, thus the optimal fineness was set at 85% for −0.074 mm particles. Figure 7b shows that various reagent removal agents had minimal effect on lead recovery, which remained between 80.0% and 81.5%. The type of reagent removal agent influenced the lead grade in the rougher concentrate. Activated carbon provided a higher lead grade of 17.41%, compared to 8.85% with sodium sulfide and 9.04% with water washing, indicating that sulfide and water washing cannot effectively remove the adhered flotation agent. Therefore, activated carbon was selected as the reagent removal agent. Figure 7c shows that as the activated carbon dosage increased, the yield of lead rougher concentrate gradually decreased, while the grade increased. At 2000 g/t, Pb recovery was 80.54%, and the grade reached 17.45%. Further increases in dosage provided minimal improvement, confirming 2000 g/t as the optimal dosage [34].
From the dosage tests for sodium carbonate and calcium oxide (Figure 7d,e), it was observed that Pb recovery and grade in the lead rougher concentrate gradually decreased as the calcium oxide dosage increased. The optimal calcium oxide dosage was set at 200 g/t, yielding a Pb recovery of 80.15% and a grade of 17.98%. For sodium carbonate, the optimal dosage was 1000 g/t. Test results in Figure 7f show that sodium sulfite increased the lead grade but significantly reduced recovery. Other inhibitors improved the lead grade but decreased recovery compared to no inhibitor use. Additional agents were avoided to simplify the process and reduce water use and costs; thus, no inhibitors were added to the flotation process. As shown in Figure 7g, tests on different trapping agents revealed that butylammonium black at 60 g/t yielded a Pb recovery of 82.05% and a grade of 18.82%, while a combination (80 + 40) g/t produced a recovery of 80.15% and a grade of 17.98%. Butylammonium black at 60 g/t outperformed the combined agents, leading to its selection as the sole trapping agent [35]. As shown in Figure 7h, increasing the dosage of butylammonium black improved lead recovery. At 60 g/t, lead recovery and grade reached their peak; further increases to 70 g/t had minimal effect. Thus, the optimal dosage for butylammonium black was set at 60 g/t.
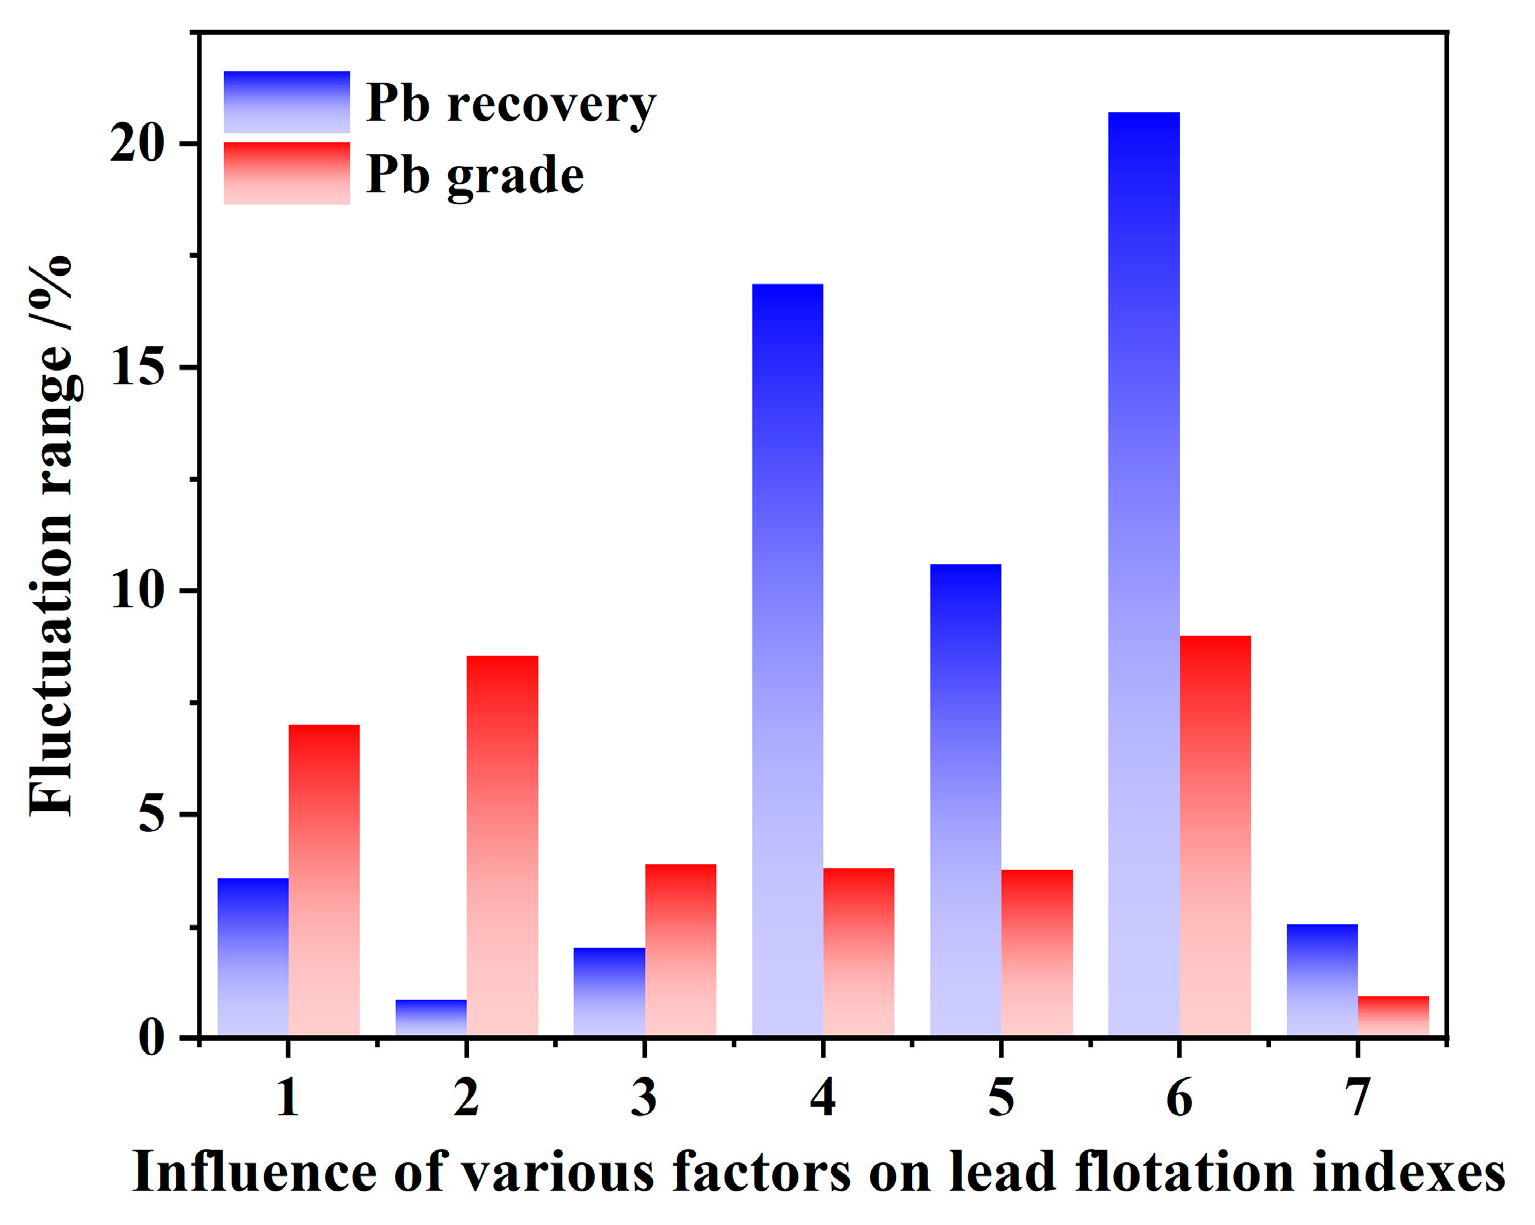
Figure 8 shows the fluctuation in lead recovery and grade with various factors, including grinding fineness, reagent removal agent type, activated carbon dosage, adjuster type and dosage, inhibitor type, collector type, and butylammonium black dosage. The lead recovery rate was primarily affected by grinding fineness, adjuster dosage, inhibitor type, and collector type, while the lead grade was mainly influenced by grinding fineness, reagent removal agent type, and collector type. The high impact of reagent removal agent type, adjuster, inhibitor, and collector types on lead recovery and grade underscores the importance of selecting appropriate flotation chemicals. The trapping agent type had the greatest influence on flotation indices, while its dosage had the least impact.

3.2.2. Comprehensive Conditioning Test

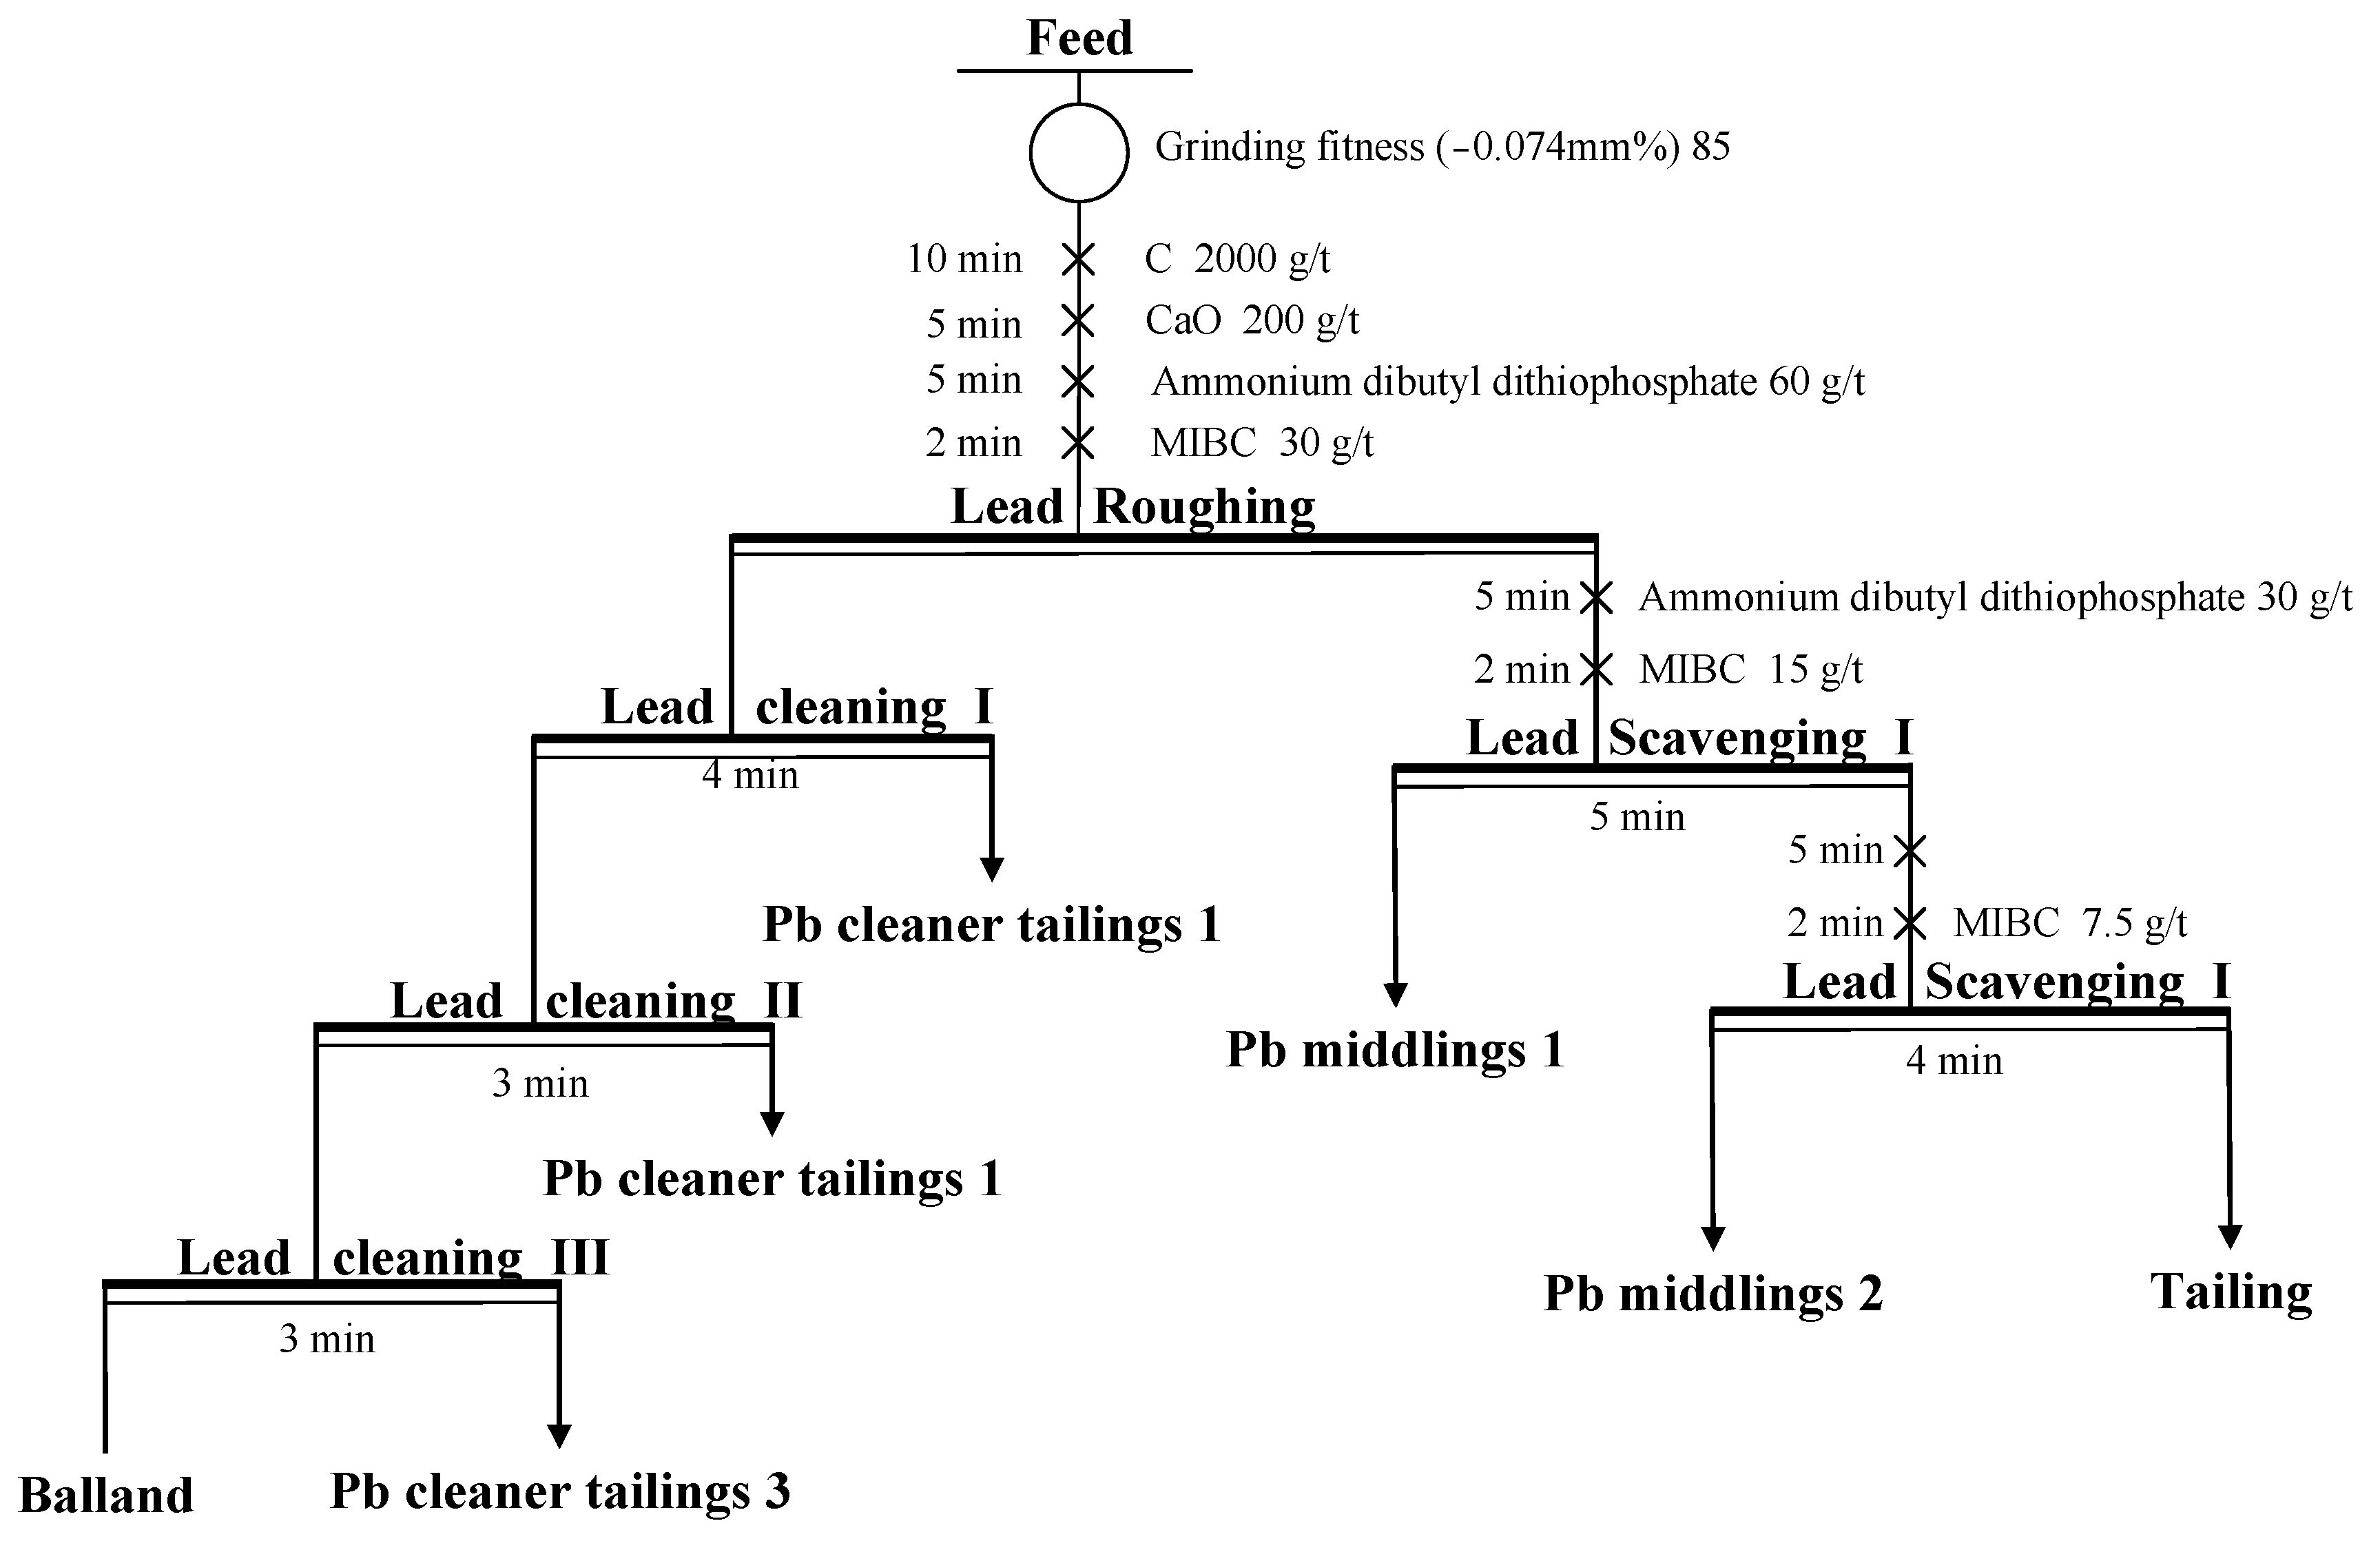
Based on the flotation condition results, a comprehensive test with “one roughing, two-stage scavenging, and three rounds of cleaning” was conducted, as shown in Figure 9. The results from the comprehensive test (Table 12) show that after three rounds of cleaning, the balland grade reached 55.14%, with a recovery rate of 52.36%. After two-stage scavenging, the lead grade in the tailings was 0.54%, and the recovery rate in the tailings was 10.49% [9].

3.2.3. Flotation Flowchart Development

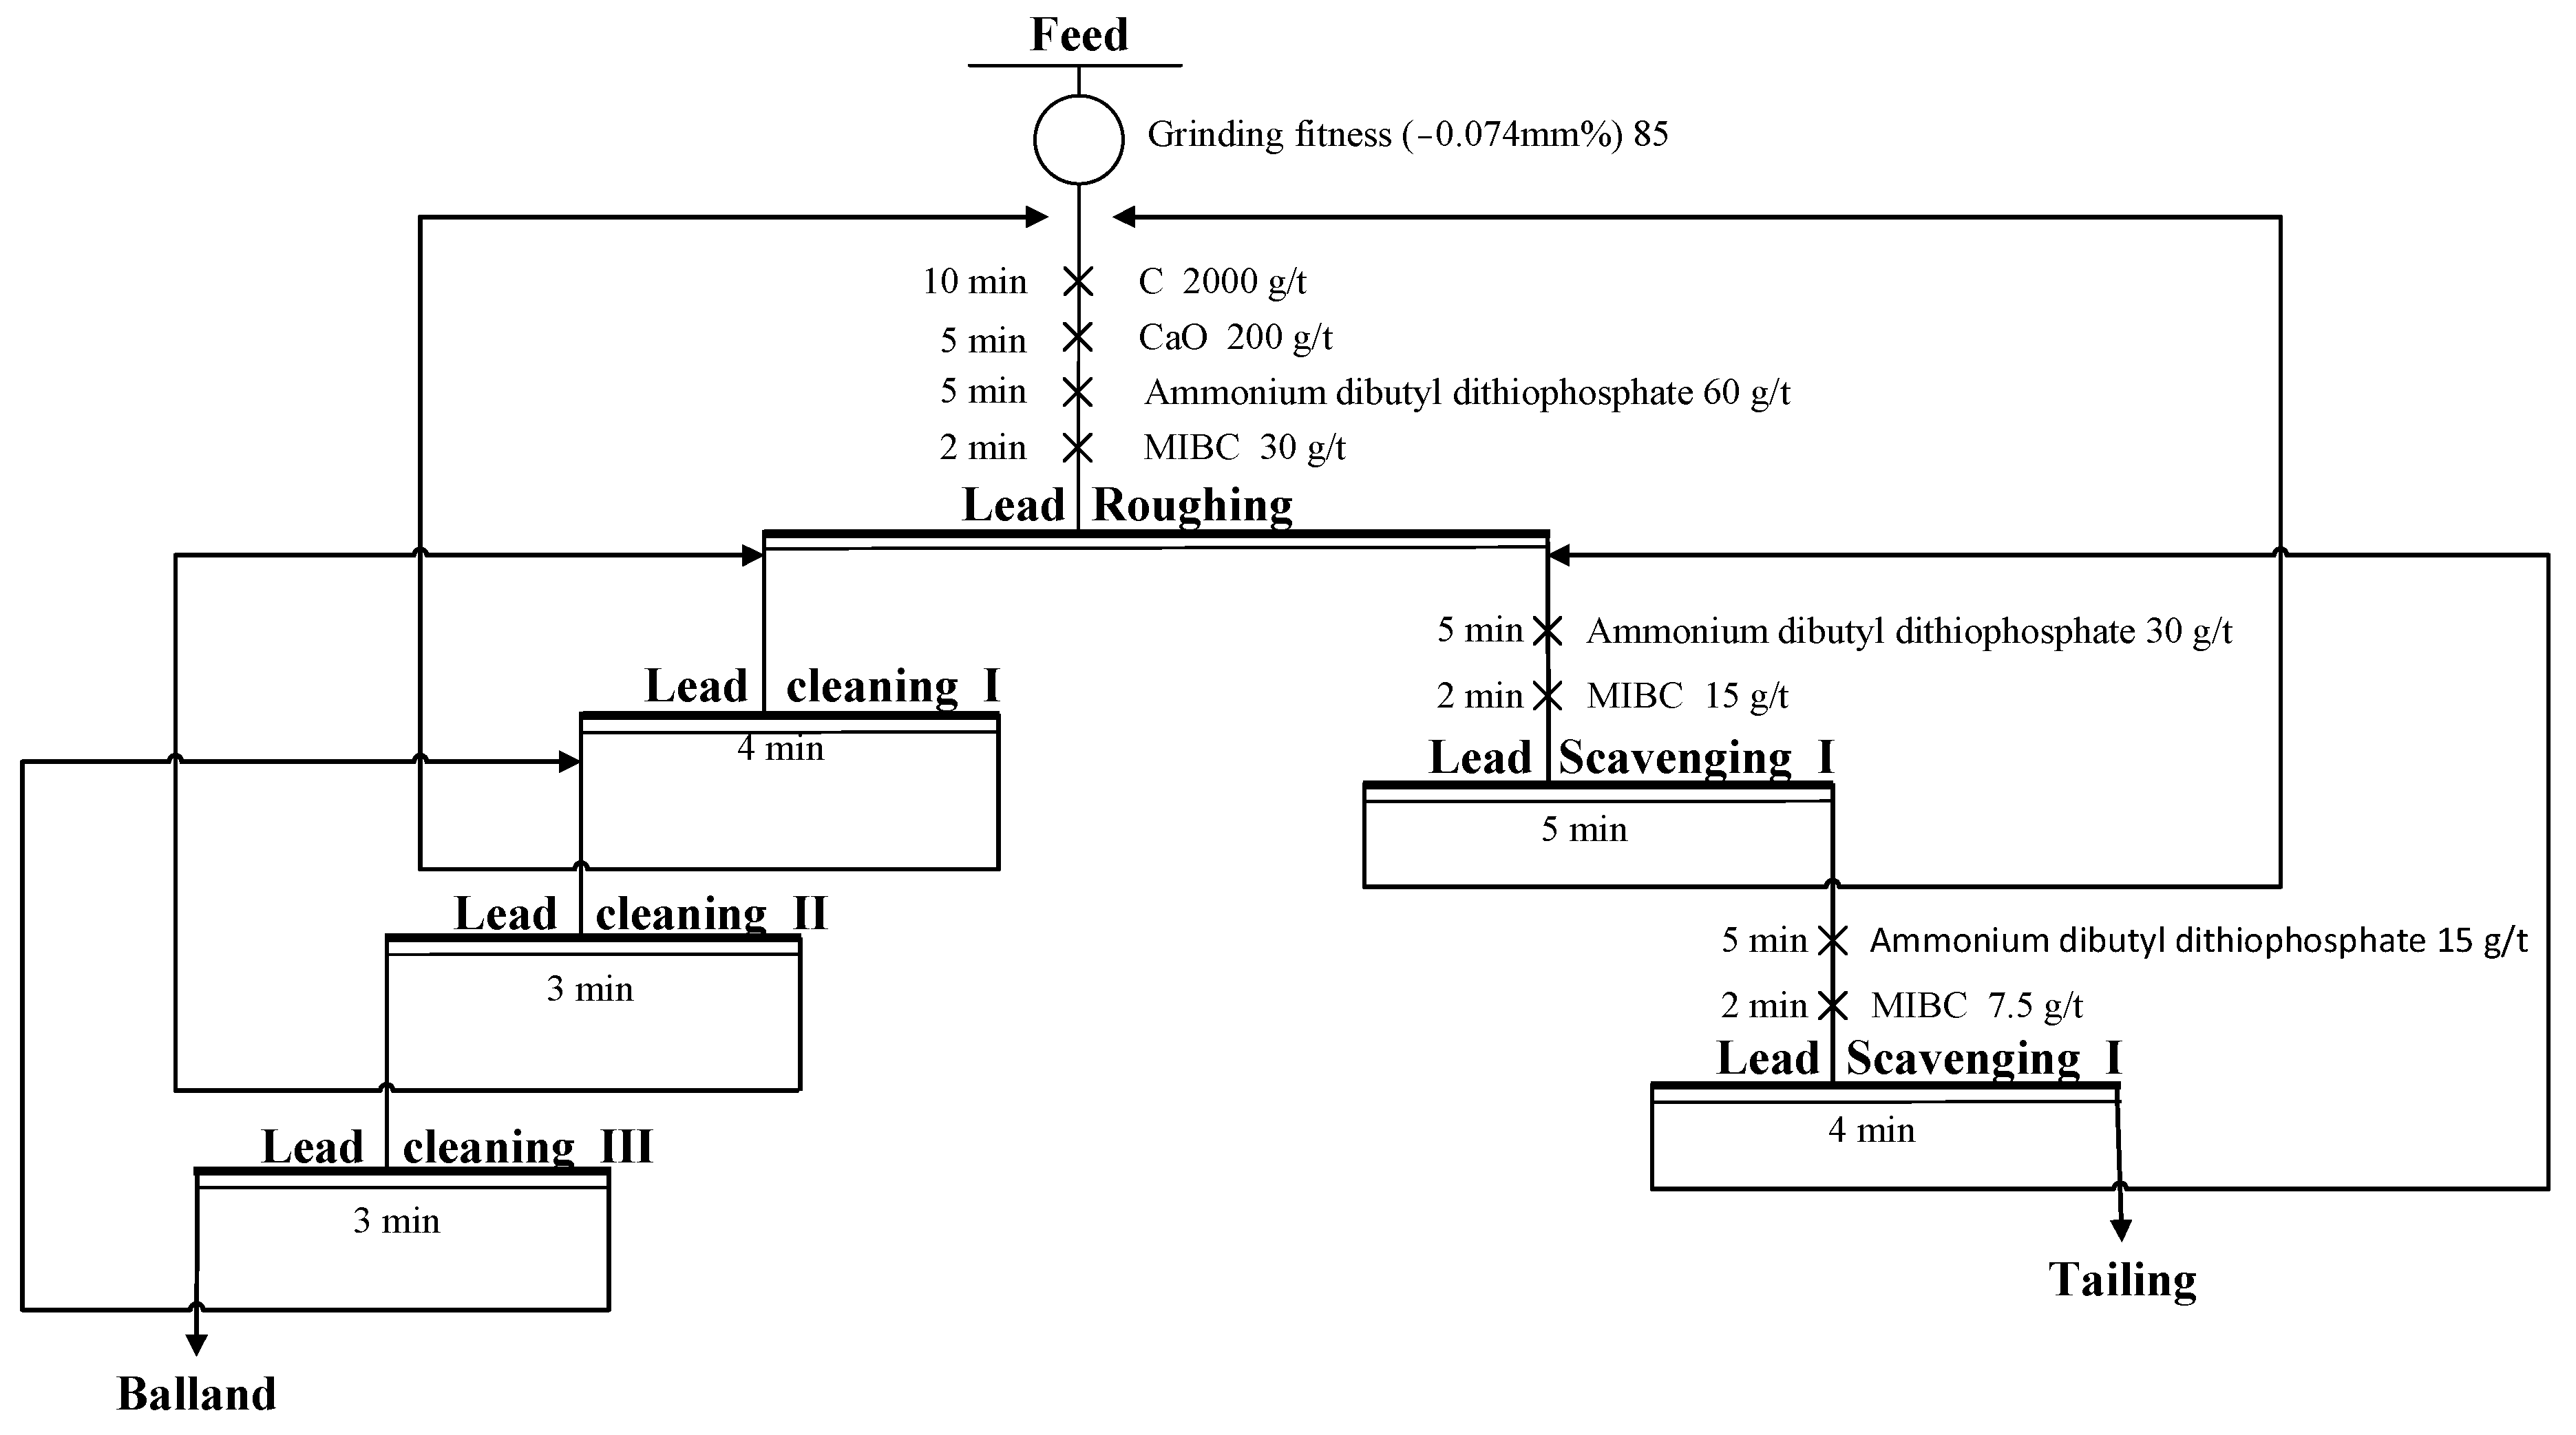
The closed-circuit flow and conditions are shown in Figure 10, with the recoveries and grades of gold, silver, and lead in the balland and tailings presented in Table 13. The closed-circuit test results indicate that, after three concentrations and two-stage scavenging, the grades of gold, silver, and lead in the balland were 512.10 g/t, 1632.80 g/t, and 40.38%, with recoveries of 70.65%, 73.86%, and 75.37%, respectively. In the tailings, the grades of gold, silver, and lead were 50.59 g/t, 154.31 g/t, and 0.99%, with respective recoveries of 29.35%, 26.14%, and 24.63% [12]. Based on these findings, to reduce grinding costs, closed-circuit tests were performed without regrinding. As shown in Table 14, using a three-stage concentration and second scavenger process, the balland grades for gold, silver, and lead were 468.80 g/t, 1543.70 g/t, and 37.47%, with recoveries of 67.77%, 73.03%, and 73.05%, respectively. In the tailings, the grades of gold, silver, and lead were 17.58 g/t, 44.96 g/t, and 1.09%, with recoveries of 32.23%, 26.97%, and 26.95%, respectively. Comparing the results of regrinding and non-regrinding closed-circuit tests, increasing concentrate fineness improved the recovery of gold, silver, and lead, and increased their grades in the balland [36].

3.3. Leaching Test

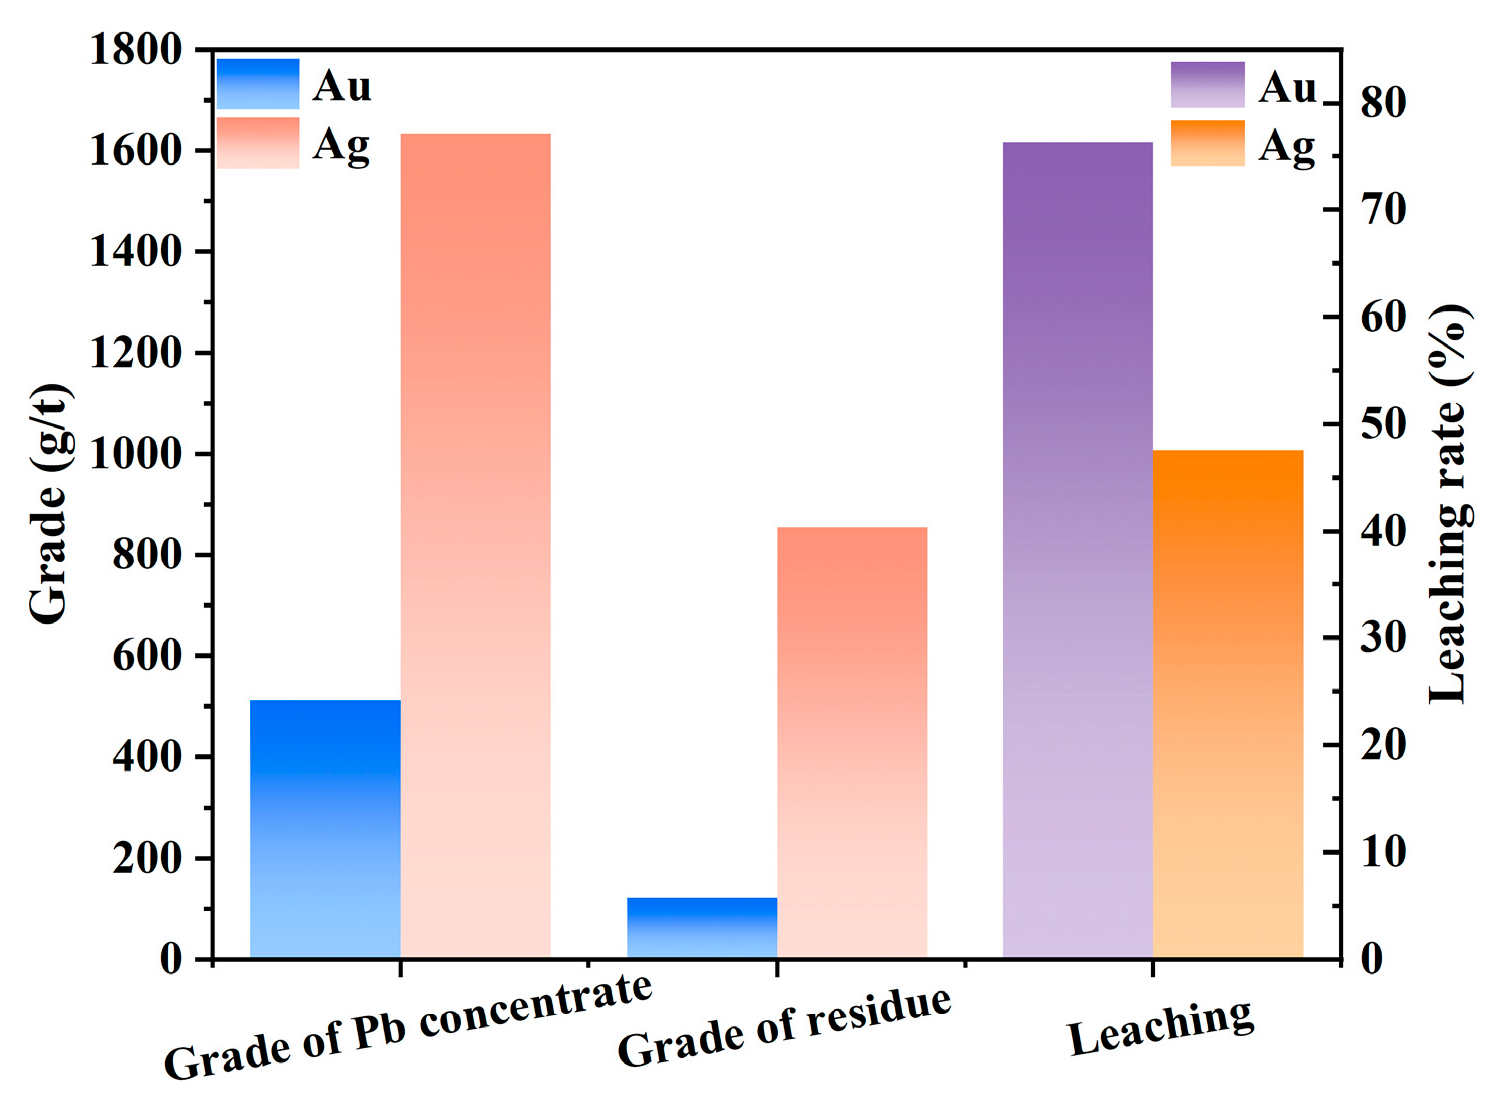
To investigate the leaching performance of the flotation balland, a cyanide leaching test was conducted, as shown in Figure 11, with results presented in Figure 12. Test results show that under conditions of regrinding fineness at −0.045 mm (95% content), a calcium oxide dosage of 40 kg/t, a sodium cyanide dosage of 40 kg/t, 33% leaching concentration, and 48-h leaching time, the leaching rates of gold and silver were 76.27% and 47.60%, respectively. Further optimization of reagents and test conditions is necessary to improve gold and silver leaching from lead concentrates. Further optimization of chemicals and test conditions is required to enhance gold and silver leaching from the lead concentrate [4,8].

3.4. Product Analysis

3.4.1. Association of Balland

Liberation and locking association of galena, analyzed by MLA, is shown in Table 15. Liberated galena accounted for 80.66%, while other morphologies included associations with sulfides, encapsulation by sulfides, and associations with or encapsulation by gangue minerals and metal oxides. The selective dissolution method, combined with microscopic analysis, was used to examine the distribution of gold minerals in the rougher concentrate (85% at −0.074 mm). Table 16 shows that liberated gold and congenial gold made up 61.88% and 10.37%, respectively, while gold encapsulated in metal sulfide, chalcopyrite, and metal oxides accounted for 26.52% and 1.23%.

3.4.2. Flotation Tailings Analysis

Using MLA and microscopic analysis, the loss patterns of lead minerals in the samples were comprehensively assessed (Table 17). The analysis indicated that lead minerals lost to the tailings were largely associated with gangues and metal oxides, comprising 62.72% of the total, with 51.47% associated with these materials and 11.25% encapsulated by oxidized gangue and metal. Lead minerals associated with sulfides accounted for 20.29% of losses, while liberated lead loss was relatively low at 6.10%. Assay and analysis clarified the locked association of gold minerals in the sample. Detailed results (Table 18) show that gold was primarily encapsulated in metal sulfides (55.67%), followed by congenial gold (30.87%), liberated gold (9.24%), and gold encapsulated by gangue and metal oxides (4.22%) [37].

3.4.3. Multi-Element Analysis of Products

The multi-element analysis results for balland and flotation tailings are presented in Table 19 and Table 20. As shown in Table 19, the grades of Pb, Au, and Ag in the balland were 40.38%, 512.10 g/t, and 1632.8 g/t, respectively, with the S content at 25.69%. Other main metals included Zn and Fe, while the harmful impurity As was present at 2.31%. Table 20 shows that the grades of Pb, Au, and Ag in the flotation tailings were 0.99%, 15.69 g/t, and 43.37 g/t, respectively. The S content was 38.15%, with Fe, Si, and As as the other main elements.

4. Conclusions

(1)
Process mineralogical analysis indicated a diverse and complex mineral composition in the rougher concentrate sample. Metal sulfides constituted 82.14% of the mineral content, with pyrite being predominant at 54.09%. Gangue minerals made up 16.49%, mainly quartz at 10.67%. Average grades for gold, silver, and lead were 50.50 g/t, 154.80 g/t, and 3.74%, respectively.
(2)
Lead minerals were primarily galena, constituting 3.43% of the mineral content. Most galena particles were smaller than 0.037 mm, accounting for 94.72%. Lead phase analysis showed a lead oxidation rate of 10.16%.
(3)
Gold minerals were primarily composed of electrum (76.18%). The particle size was mainly fine-grained (49.34%) and micronized gold (47.36%). Gold minerals were primarily liberated gold (44.38%), followed by gold encapsulated in metal sulfides (mainly arsenopyrite and pyrite) at 35.69%. Congenial gold constituted 18.62%, primarily associated with arsenopyrite at 12.52%, with a small amount in other morphologies. Gold encapsulated in gangue accounted for 1.31%.
(4)
Flotation closed-circuit testing showed that with three-stage cleaning and two-stage scavenging, the grades of gold, silver, and lead in the balland were 512.10 g/t, 1632.80 g/t, and 40.38%, with recoveries of 70.65%, 73.86%, and 75.37%, respectively.
(5)
Cyanide leaching tests on balland, with a regrind fineness of 95% at −0.045 mm, a pulp density of 33%, calcium oxide at 40 kg/t, sodium cyanide at 40 kg/t, and a 48-h leaching time, yielded a gold leaching rate of 76.27%.
(6)
An examination of gold and lead loss in flotation tailings revealed that gold minerals were primarily encapsulated in metal sulfides (55.67%), followed by congenial gold (30.87%), liberated gold (9.24%), and a smaller portion encapsulated by gangue and metal oxides (4.22%). Lead minerals were predominantly associated with gangue and metal oxides (62.72%), with 51.47% at attachment and 11.25% as inclusions. Losses of lead associated with sulfides were 20.29%, and liberated lead loss was minimal at 6.10%.

Author Contributions

Formal analysis, Z.L.; Investigation, H.Z.; Supervision, J.Z., H.Y. and H.Z.; Writing—original draft, G.C.; Writing—review & editing, G.C., J.Z. and H.Z. All authors have read and agreed to the published version of the manuscript.

Funding

This research was funded by Special project of scientific and technological research on opening bidding for selecting the best candidates in Liaoning Province [2022JH1/10400024].

Data Availability Statement

The original contributions presented in this study are included in the article. Further inquiries can be directed to the corresponding author.

Acknowledgments

The authors declare that no acknowledgements are required for this work.

Conflicts of Interest

Author Guomin Chen was employed by the company Liaoning Tianli Gold Industry Co., Ltd. Author Joe Zhou was employed by the company Joe Zhou Mineralogy Ltd. Author Zilong Liu was employed by the company China National Gold Group Co., Ltd. The remaining authors declare that the research was conducted in the absence of any commercial or financial relationships that could be construed as a potential conflict of interest.

References

  1. Xie, H.Y.; Sun, R.; Wu, J.Z.; Feng, D.X.; Gao, L.K. A Case Study of Enhanced Sulfidization Flotation of Lead Oxide Ore: Influence of Depressants. Minerals 2020, 10, 95. [Google Scholar] [CrossRef]
  2. Zhang, H.; Yu, H.; Sun, W.; Lin, S.; Zhang, C. Beneficiation of silver and silver-bearing lead-zinc ores: A review. Miner. Eng. 2024, 208, 108608. [Google Scholar] [CrossRef]
  3. Lazic, P.; Vucinic, D.; Stanojev, J.; Micovic, B. Direct selective lead, copper and zinc minerals flotation from polymetallic ore “Podvirovi”. J. Min. Sci. 2010, 46, 690–694. [Google Scholar] [CrossRef]
  4. Yang, H.M.; Hu, Y.H.; Ao, W.Q.; Qiu, G.Z.; Wang, D.Z. Ultrafine milling for the processing of gold-bearing sulphides. Rare Met. 2002, 21, 133–136. [Google Scholar]
  5. Arellano-Pina, R.; Sanchez-Ramirez, E.A.; Vazquez-Sanchez, E.E.; Perez-Garibay, R.; Rojas-Montes, J.C. Gold recovery improvements in grinding and flash flotation circuit. Miner. Eng. 2023, 199, 108130. [Google Scholar] [CrossRef]
  6. Fedotov, P.K.; Senchenko, A.E.; Fedotov, K.V.; Burdonov, A.E. Hydrometallurgical Processing of Gold-Containing Ore and its Enrichment Products. Metallurgist 2021, 65, 214–227. [Google Scholar] [CrossRef]
  7. Acarkan, N.; Bulut, G.; Gul, A.; Kangal, O.; Karakas, F.; Kokkilic, O.; Onal, G. The Effect of Collector’s Type on Gold and Silver Flotation in a Complex Ore. Sep. Sci. Technol. 2011, 46, 283–289. [Google Scholar] [CrossRef]
  8. Bas, A.D.; Koc, E.; Yazici, E.Y.; Deveci, H. Treatment of copper-rich gold ore by cyanide leaching, ammonia pretreatment and ammoniacal cyanide leaching. Trans. Nonferrous Met. Soc. China 2015, 25, 597–607. [Google Scholar] [CrossRef]
  9. Yu, A.M.; Ding, Z.; Yuan, J.Q.; Feng, Q.C.; Wen, S.M.; Bai, S.J. Process Mineralogy Characteristics and Flotation Optimization of a Low-Grade Oxidized Lead and Zinc Ore from Lanping Mine. Minerals 2023, 13, 1167. [Google Scholar] [CrossRef]
  10. Li, W.-J.; Liu, S.; Song, Y.-S.; Wen, J.-K.; Zhou, G.-Y.; Chen, Y. Comprehensive recovery of gold and base-metal sulfide minerals from a low-grade refractory ore. Int. J. Miner. Metall. Mater. 2016, 23, 1377–1386. [Google Scholar] [CrossRef]
  11. Monte, M.B.M.; Dutra, A.J.B.; Albuquerque, C.R.F.; Tondo, L.A.; Lins, F.F. The influence of the oxidation state of pyrite and arsenopyrite on the flotation of an auriferous sulphide ore. Miner. Eng. 2002, 15, 1113–1120. [Google Scholar] [CrossRef]
  12. Chen, D.X.; Xiao, J. Improving gold recovery of Pb-Zn sulfide ore by selective activation with organic acid. Rare Met. 2016, 35, 198–203. [Google Scholar] [CrossRef]
  13. Li, G.; Zhang, Z.; Wei, Q.; Jiao, F.; Yang, C.; Li, W.; Qin, W. Study on flotation recovery of typical carbon-bearing lead-zinc sulphide ore in Guizhou with pre-decarbonization. Geochemistry 2024, 84, 126096. [Google Scholar] [CrossRef]
  14. Bocharov, V.A.; Ignatkina, V.A.; Kayumov, A.A.; Makavetskas, A.R.; Fishchenko, Y.Y. Influence of Structural Features and Nature of Interaction between Minerals on the Selection of Methods for Lead-Bearing Ore Separation. J. Min. Sci. 2018, 54, 821–830. [Google Scholar] [CrossRef]
  15. Raji, F.; Kappes, R.; Peng, Y. Deleterious impacts of triethylenetetramine and sodium metabisulphite on gold flotation during pyrrhotite depression. Miner. Eng. 2024, 216, 108884. [Google Scholar] [CrossRef]
  16. Liu, G.Q.; Yen, W.T. Effects of sulfide minerals and dissolved-oxygen on the gold and silver dissolution in cyanide solution. Miner. Eng. 1995, 8, 111–123. [Google Scholar] [CrossRef]
  17. Swinkels, L.J.; Burisch, M.; Rossberg, C.M.; Oelze, M.; Gutzmer, J.; Frenzel, M. Gold and silver deportment in sulfide ores—A case study of the Freiberg epithermal Ag-Pb-Zn district, Germany. Miner. Eng. 2021, 174, 107235. [Google Scholar] [CrossRef]
  18. Chandra; Mubarok, M.Z. On the use of lignin-based biopolymer in improving gold and silver recoveries during cyanidation leaching. Miner. Eng. 2016, 89, 1–9. [Google Scholar] [CrossRef]
  19. Klein, B.; Altun, N.E.; Ghaffari, H.; McLeavy, M. A hybrid flotation-gravity circuit for improved metal recovery. Int. J. Miner. Process. 2010, 94, 159–165. [Google Scholar] [CrossRef]
  20. Azizi, A.; Olsen, C.; Larachi, F. Efficient strategies to enhance gold leaching during cyanidation of multi-sulfidic ores. Can. J. Chem. Eng. 2014, 92, 1687–1692. [Google Scholar] [CrossRef]
  21. Chang, C.; Xiao, K.Y.; Feng, G.H.; Sun, L.; Yang, J.S. Reactive transport numerical modeling of intermediate sulfidation epithermal deposit: A case study of Haopinggou Ag-Au-Pb-Zn deposit, Henan province, China. J. Geochem. Explor. 2024, 263, 107500. [Google Scholar] [CrossRef]
  22. Song, B.X.; Dong, X.R.; Qiu, X.Y.; Hu, Z.; Wang, Y. Electronic structure and flotation behavior of Ag-bearing galena. J. Alloys Compd. 2021, 868, 159105. [Google Scholar] [CrossRef]
  23. Hu, Y.H.; Wu, M.R.; Liu, R.Q.; Sun, W. A review on the electrochemistry of galena flotation. Miner. Eng. 2020, 150, 106272. [Google Scholar] [CrossRef]
  24. Aydin, S.B.; Gül, A. Kinetic modelling and optimization of flotation process of electrum. Physicochem. Probl. Miner. Process. 2021, 57, 80–94. [Google Scholar] [CrossRef]
  25. Liu, X.Q.; Fang, Y.; Jiang, H.; Xiao, Y.; Li, L.G. Study on the Integrative Utilization of Cyanide Tailings of Polymetallic Sulfide Ore of gold and silver. In Proceedings of the International Conference on Materials for Environmental Protection and Energy Application (MEPEA 2011), Kuala Lumpur, Malaysia, 27–28 September 2011; pp. 43–55. [Google Scholar]
  26. Cui, W.Y.; Chen, J.H. Insight into mineral flotation fundamentals through the DFT method. Int. J. Min. Sci. Technol. 2021, 31, 983–994. [Google Scholar] [CrossRef]
  27. Klimpel, R.R. Industrial experiences in the evaluation of various flotation reagent schemes for the recovery of gold. Miner. Metall. Process. 1999, 16, 1–11. [Google Scholar]
  28. Luo, X.; Feng, B.; Wong, C.; Miao, J.; Ma, B.; Zhou, H. The critical importance of pulp concentration on the flotation of galena from a low grade lead-zinc ore. J. Mater. Res. Technol. 2016, 5, 131–135. [Google Scholar] [CrossRef]
  29. Özçelik, S.; Ekmekçi, Z. Surface Chemistry and Flotation of Gold-Bearing Pyrite. Minerals 2024, 14, 914. [Google Scholar] [CrossRef]
  30. Bidari, E.; Aghazadeh, V. Pyrite from Zarshuran Carlin-type gold deposit: Characterization, alkaline oxidation pretreatment, and cyanidation. Hydrometallurgy 2018, 179, 222–231. [Google Scholar] [CrossRef]
  31. Chen, T.T.; Cabri, L.J.; Dutrizac, J.E. Characterizing gold in refractory sulfide gold ores and residues. Jom J. Miner. Met. Mater. Soc. 2002, 54, 20–22. [Google Scholar] [CrossRef]
  32. Ran, J.; Qiu, X.; Hu, Z.; Liu, Q.; Song, B.; Yao, Y. Effects of particle size on flotation performance in the separation of copper, gold and lead. Powder Technol. 2019, 344, 654–664. [Google Scholar] [CrossRef]
  33. Sen, S.; Ipekoglu, U.; Cilingir, Y. Flotation of Fine Gold Particles by the Assistance of Coal-Oil Agglomerates. Sep. Sci. Technol. 2010, 45, 610–618. [Google Scholar] [CrossRef]
  34. Lan, Z.Y.; Lai, Z.N.; Zheng, Y.X.; Lv, J.F.; Pang, J.; Ning, J.L. Recovery of Zn, Pb, Fe and Si from a low-grade mining ore by sulfidation roasting-beneficiation-leaching processes. J. Cent. South Univ. 2020, 27, 37–51. [Google Scholar] [CrossRef]
  35. Mütevellioglu, N.A.; Yekeler, M. Beneficiation of Oxidized Lead-Zinc Ores by Flotation Using Different Chemicals and Test Conditions. J. Min. Sci. 2019, 55, 327–332. [Google Scholar] [CrossRef]
  36. Seksenova, N.; Bykov, R.; Mamyachenkov, S.; Daumova, G.; Kozhakanova, M. Optimization of Conditions for Processing of Lead-Zinc Ores Enrichment Tailings of East Kazakhstan. Metals 2021, 11, 1802. [Google Scholar] [CrossRef]
  37. Lv, C.C.; Ding, J.; Qian, P.; Li, Q.C.; Ye, S.F.; Chen, Y.F. Comprehensive recovery of metals from cyanidation tailing. Miner. Eng. 2015, 70, 141–147. [Google Scholar] [CrossRef]
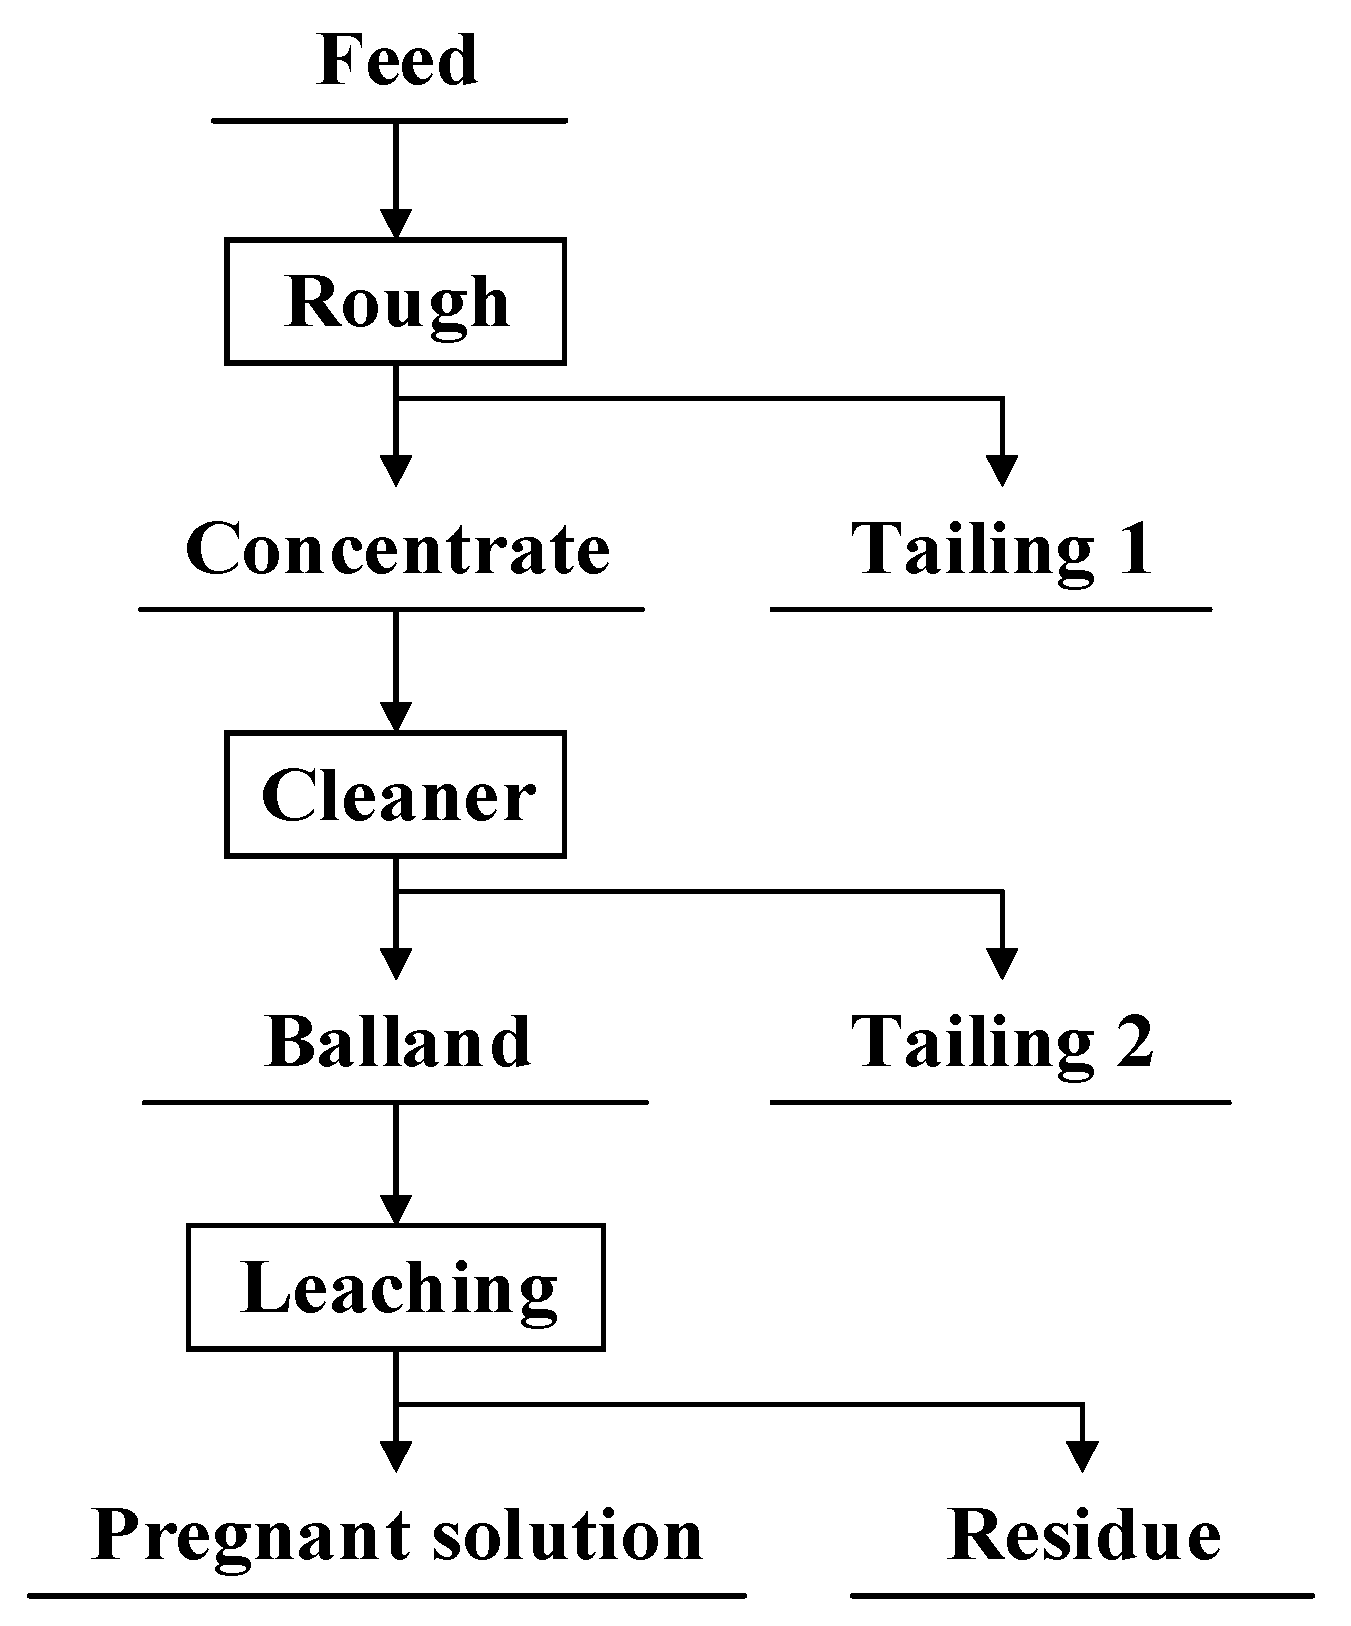
Figure 1. Process flow chart.
Minerals 15 00967 g001
Figure 2. Association characteristics. (ac) PY, (df) Apy, (gk) Gn, (ln) Po, (o,p) SEM of (n). (1. Py: pyrite, 2. Ccp: Chalcopyrite, 3. Gn: Galena, 4. PF: Phenolic plastics, 5. Apy: Arsenopyrite, 6. Po: Chalcopyrite 7. Cer: Cerussite, 8. Elt: Electrum, 9. Cc: Chalcocite, 10. Fb: Freibergite 11. Sp: Sphalerite, 12. LM: Limonite 13. Cv: Covellite).
Minerals 15 00967 g002aMinerals 15 00967 g002b
Figure 3. (ac) Photomicrographs of gold particles. (1. Elt: Electrum, 2. Kustelite).
Minerals 15 00967 g003
Figure 4. (ac) The photomicrographs of associated gold minerals. (1. Py: Pyrite, 2. Elt: Electrum 3. Gn: Galena, 4. PF: Phenolic plastics, 5. Apy: Arsenopyrite).
Minerals 15 00967 g004
Figure 5. (a,b) Photomicrographs of associated silver minerals.
Minerals 15 00967 g005
Figure 6. Flowsheet for lead flotation conditional test. (a) Grinding fitness; (b) Flotation reagent; (c) C dosage; (d) Na2CO3 dosage; (e) CaO dosage; (f) Depressing reagent; (g) Flotation collector; (h) Ammonium dibutyl dithiophosphate (ADD) dosage.
Minerals 15 00967 g006
Figure 7. Effect of main factors on lead flotation. (a) Grinding fitness; (b) Reagent removal agent; (c) C dosage (d) Na2CO3 dosage; (e) CaO dosage (f) Depressing reagent; (g) Flotation collector (R1 SN9, R2 ADD, R3 Dianilinodithiophosphoric acid (DA), R4 Sodium ethyl xanthate, R5 Isopropyl xanthate, R6 CG1325, R7 Butyl xanthate 40 + ADD 20, R8 Butyl xanthate 80 + ADD 40); (h) ADD dosage.
Minerals 15 00967 g007
Figure 8. Influence of various factors on lead flotation indexes: (1) Grinding fitness; (2) Reagent removal agent; (3) activated carbon dosage; (4) Regulator dosage; (5) Depressing reagent; (6) Flotation collector; (7) ADD dosage.
Minerals 15 00967 g008
Figure 9. The flowsheet and condition of the comprehensive test.
Minerals 15 00967 g009
Figure 10. Flotation flowchart process and conditions.
Minerals 15 00967 g010
Figure 11. Leaching process and conditions.
Minerals 15 00967 g011
Figure 12. Leaching test results.
Minerals 15 00967 g012
Table 1. Quantitative analysis of minerals.
ElementsAu (g/t *)Ag (g/t)S (%)Fe (%)As (%)SiO2 (%)Pb (%)Zn (%)
Concentration50.50154.8035.8934.1910.6111.063.741.59
ElementsAl2O3 (%)C (%)CaO (%)MgO (%)Cu (%)Sb (%)Cr (%)Cd (%)
Concentration1.020.480.470.310.110.0540.0430.035
* “g/t” (grams per ton) is equivalent to parts per million (ppm) for solid samples.
Table 2. Phase analysis of lead minerals.
PhasePb/SulfidePb/OxidePb/Total
Concentration (%)3.360.383.74
Relative content (%)89.8410.16100.00
Table 3. Mineral composition and content.
MineralContent (%)MineralContent (%)
Pyrite 54.09Quartz 10.67
Arsenopyrite21.21Feldspar 2.12
Galena, Boulangerite4.03Pyroxenes1.57
Sphalerite2.39Calcite, Carbonates1.38
Chalcopyrite, Chalcocite, covellite0.41Micas0.51
Tetrahedrite, Freibergite0.01Wollastonite, Kaolinite, graphite0.24
Lead oxide0.43
Limonite, Hematite, Magnetite0.94
Total83.51Total16.49
Table 4. Particle size distribution of metallic minerals (%).
Size (mm)
+0.100−0.100~
+0.074
−0.074~
+0.053
−0.053~
+0.037
−0.037~
+0.010
−0.010Total
Minerals
Pyrite10.2418.4725.7425.4714.115.97100.00
Arsenopyrite7.0420.5323.0725.2916.597.48100.00
Chalcopyrite1.7811.5272.6214.08100.00
Galena5.2874.0120.71100.00
Table 5. Association characteristics of pyrite, arsenopyrite, and galena (%).
Locked
LiberatedSulfide-linked *Sulfide-Coated *Associated with ChalcopyriteLocked in ChalcopyriteTotal
Minerals
Pyrite 79.7610.724.383.062.08100.00
Arsenopyrite 74.2013.026.054.751.98100.00
Galena 64.0216.838.368.212.58100.00
* “Sulfide-linked” indicates that the mineral is associated with sulfide minerals, but not entirely surrounded or wrapped by them. “Sulfide-coated” means that a mineral has a layer or coating of sulfide minerals on its surface.
Table 6. Minerals and fineness of gold minerals.
Gold MineralsNative GoldElectrumTotal (%)
Relative content (%)23.8276.18100.00
Fineness (‰)938.9634.9
Gold content (%)48.3722.3770.74
Distribution rate (%)31.6268.38100.00
Table 7. Size distribution of gold minerals.
Size (mm)+0.074−0.074~
+0.053
−0.053~
+0.037
−0.037~
+0.01
−0.010Total
Content (%)0.360.812.1349.3447.36100.00
Table 8. The morphology of gold minerals.
MorphologySlab-FlakyElongated Angular GranularAngular GranularShape Angular GranularTotal
Content (%)47.3821.6719.8211.13100.00
Table 9. Locked association of gold minerals.
Locked AssociationGoldLockedEnclosed in Metallic SulfidesEnclosed in GangueTotal
Arsenopyrite Pyrite Gangue
Relative content (%)44.3812.524.951.1535.691.31100.00
Table 10. Content and distribution of silver minerals.
Silver MineralsRelative Content (%)Ag (%)Metal VolumeDistribution (%)
Tetrahedrite containing silver0.00134.8863.4440.98
Freibergite0.000416.7967.1643.38
Silver gold0.000050529.2714.789.55
Others99.99824959.42 × 10−69.426.09
Total100.00154.80100.00
Table 11. Association characteristics of silver minerals.
Locked AssociationLeachableEnclosed in Metallic SulfidesEnclosed in Metallic Oxide and GangueTotal
Content (%)60.0321.2318.74100.00
Table 12. The result of the comprehensive test.
MineralsYield/%Pb Grade /%Pb Recovery/%
Balland3.5255.5152.18
Cleaner tailings 31.5320.938.55
Cleaner tailings 23.259.858.55
Cleaner tailings 16.876.5211.96
Middlings 18.752.716.33
Middlings 23.362.151.93
Tailing72.720.5410.49
Rougher concentrate100.003.74100.00
Table 13. Flotation flowchart results.
MineralsYield
(%)
GradeRecovery (%)
Au (g/t)Ag (g/t)Pb (%)AuAgPb
Balland6.98512.101632.8040.3870.6573.8675.37
Tailing93.0215.9643.370.9929.3526.1424.63
Feed100.0050.59154.313.74100.00100.00100.00
Table 14. Flotation flowchart results (grinding fineness: −0.074 mm 71.02%).
MineralsYield
(%)
GradeRecovery (%)
Au (g/t)Ag (g/t)Pb (%)AuAgPb
Balland7.31468.801543.7037.4767.7773.0373.05
Tailing92.6917.5844.961.0932.2326.9726.95
Feed100.0050.56154.523.75100.00100.00100.00
Table 15. Liberation and locking association of galena in balland.
Locked AssociationLiberatedSulfide-LinkedSulfide-CoatedHyphenated with Gangues and Metal OxidesCoated by Gangues and Metal OxidesTotal
Content (%)80.667.853.843.903.75100.00
Table 16. Liberation and locking association of gold minerals in balland.
Locked AssociationLiberatedArsenopyriteSulfide-CoatedCoated by Gangues and Metal OxidesTotal
Content (%)61.8810.3726.521.23100.00
Table 17. Analysis of lead minerals in flotation tailings.
MorphologyLiberatedSulfide-LinkedSulfide-CoatedHyphenated with Gangues and Metal OxidesCoated by Gangues and Metal OxidesTotal
Content (%)6.1020.2910.8951.4711.25100.00
Table 18. Analysis of gold minerals in flotation tailings.
MorphologyLiberatedIntergrowthEnveloped by Metal SulfidesCoated by Gangues and Metal OxidesTotal
Content (%)9.2430.8755.674.22100.00
Table 19. Multi-element analysis of balland.
ElementAu (g/t)Ag (g/t)PbSFeZnSiO2As
Content (%)512.101632.8040.3825.6913.747.263.402.31
ElementCCuAl2O3MgOCaOSbCdCr
Content (%)1.410.920.620.310.300.260.140.019
Table 20. Multi-element analysis of flotation tailing.
ElementAu (g/t)Ag (g/t)CuPbZnFeSCr
Content (%)15.6943.370.080.990.8736.3838.150.042
ElementAsCAl2O3MgOSiO2CaOSbCd
Content (%)11.460.410.970.278.800.490.0330.023
Disclaimer/Publisher’s Note: The statements, opinions and data contained in all publications are solely those of the individual author(s) and contributor(s) and not of MDPI and/or the editor(s). MDPI and/or the editor(s) disclaim responsibility for any injury to people or property resulting from any ideas, methods, instructions or products referred to in the content.