Article

Assessing Jarosite Kinetic Dissolution Rates at Acidic Conditions and Different Temperatures

Universite de Pau et des Pays de l’Adour, LaTEP, 64075 Pau, France
*
Author to whom correspondence should be addressed.
Minerals 2025, 15(9), 965; https://doi.org/10.3390/min15090965
Submission received: 26 July 2025 / Revised: 2 September 2025 / Accepted: 5 September 2025 / Published: 11 September 2025
(This article belongs to the Section Environmental Mineralogy and Biogeochemistry)

Abstract

K-jarosite (KFe3(SO4)2(OH)6), the most common jarosite-type mineral in natural and industrial settings, has been widely studied to understand its dissolution behavior in both environmental and industrial contexts. However, reported kinetic data remain inconsistent due to the combined influence of kinetic factors, despite the importance of such data for optimizing system conditions and improving process control and environmental management. The present work aims to help elucidate K-jarosite dissolution by carrying out new experiments in sulfuric acid medium (pH 1 and 2) at different temperatures (296, 323 and 343 K) and using two initial concentrations (0.4 and 1 g of K-jarosite/kg of solution). K-jarosite was synthesized and characterized by analytical techniques (XRD, SEM and BET), and the composition was determined by induction-coupled plasma optical emission spectroscopy (ICP-OES). Derivative (DVKM), Noyes–Whitney (NWKM) and Shrinking Core (SCKM) kinetic models previously used in the literature of jarosite-type compounds were adjusted to the data obtained here and compared. The results showed that higher temperatures and lower pH led to faster dissolution rates. Smaller initial concentrations decreased the rates slightly but had less impact than the other variables. Experiments at pH 1 led to the dissolution of all jarosite solids, while at pH 2 they led to incomplete dissolution. Remarkably, at pH 2 and at higher temperatures (mainly at 343 K), there was slight reprecipitation of the iron. XRD analysis identified no peak other than K-jarosite peaks after dissolution. DVKM and NWKM represented the effect of the studied parameters well. However, only using SCKM was a kinetic equation describing the dissolution process obtained. While the behavior of the kinetic curve is well established, the model fails to correctly describe the induction period. Under extreme conditions (>323 K, pH 1), dissolution is described by a chemical reaction controlling stage and it changes to mass transport in mild conditions. As theoretically expected, the results obtained in this work give important information about the prediction of the behavior of jarosite dissolution in terrestrial environments (acid mine and acid rock drainages) and hydrometallurgical process in mild acidic conditions and high temperatures.

1. Introduction

Jarosite-type compounds represent a class of hydrous sulfate minerals belonging to the jarosite-alunite group, exhibiting an ideal chemical formula of AB3(CO4)2(OH)6. In terrestrial environments, the most prevalent compound among them is K-jarosite (KFe3(SO4)2(OH)6), although the structural mineral sites (A, B and C) within these minerals can also be occupied by a variety of other elements [1].
Jarosite-type compounds are commonly found in terrestrial ecosystems as ferric sulfate salts, often forming in acidic and oxidizing environments enriched in sulfate such as acidic rock and mining drainage [2,3], and even in Mars soil, as evidenced by data from the Mars exploration rover [4,5,6]. Moreover, the hydrometallurgical industry, which uses the jarosite process to immobilize iron as a jarosite precipitate, has also increased interest in these minerals. During precipitation, hazardous elements or high-value-added metals can be immobilized. Consequently, new efforts have been made by geochemists and engineers to conduct dissolution experiments aiming to understand and predict the behavior of jarosite compounds in aqueous solutions. In order to enhance this comprehension, extensive research has been conducted on the thermodynamics and kinetics of jarosite compounds [7].
In the geochemistry field, Baron and Palmer (1996) [8] pioneered the study of jarosite dissolution kinetics. They were followed by Gasharova et al., 2005 [9] who studied the surface behavior of jarosite dissolution using Atomic Force Microscopy (AFM) to observe the morphological changes on the jarosite surfaces. Smith et al., 2006 [10] investigated the dissolution rates of K-jarosite under conditions similar to ARD/AMD sites, at pH 2 and 8, while Welch et al., 2008 [11] used pH at 3 and 4 to simulate ARD conditions in Australia using natural samples. Elwood Madden et al., 2012, Pritchett et al., 2012, Zahrai et al., 2013 and Legett et al., 2018 [12,13,14,15] explored Mars conditions, varying pH, temperature and salinity for K-jarosite and Na-jarosite. Kendall et al., 2013 [16] used the same conditions as Smith et al., 2006 [10] but including a third scenario where a sudden influx of fresh water (ultrapure water) was possible and also using arsenojarosite to compare with K-jarosite.
As well as Baron and Palmer, the majority of the above rate dissolution studies have utilized batch reactors, overlooking mass transport which is fundamental in environmental geochemistry [17]. In this way, recent research has shifted towards investigating dissolution in continuous flow reactors. Dixon and colleagues studied jarosite dissolution rates in flow-through reactors showing that dissolution rates are not affected by flowrate, although they did not explore the correlation with varying pH [18]. Qian et al., 2019 [19] used quiescent-solution conditions in unstirred batch reactors and column leaching experiments in order to study the dissolution of natural jarosite. Slower rates were documented compared to those witnessed through stirred batch dissolution. Nevertheless, while offering greater realism, gravity-driven column leaching trials lacked control over mass transport conditions within the column. Noticing this lack of information, in 2020, Trueman et al., 2020 [20] studied the dissolution chemistry of jarosite in a flow-through reactor under constant flowrate and varying pH.
Given the increasing focus on reclaiming valuable metals from jarosite industrial residues containing Zn, alongside other metals like Pb, Cu, Ag, Cd and Co [21,22], various leaching agents have been investigated as promising alternatives for the recovery process. Thus, the kinetic analysis of the dissolution in alkaline media has been widely investigated for different jarosite type-compounds such as Ag, Rb, As, Cr, Hg and Tl [23,24,25,26,27,28]. However, more recently, acidic dissolution has also attracted attention. In 2017, Reyes et al., 2017 [22] also studied the kinetics dissolution of jarosite-type compounds with replacement in sites A and C (Na-As, K-As and NH4-As jarosites) in sulfuric acid media to determine the factors that affect the recovery of metal values varying pH, temperature, particle size and type of substituent in the A and C positions. Previously, these authors also used hydrochloric acid to study the dissolution [25].
The abundance of data on jarosite dissolution reflects the considerable interest in this reaction, offering valuable insights under diverse conditions such as pH, temperature and salinity. Despite this, the literature exhibits widespread dispersion of data, resulting in discrepancies in thermodynamic data as noted by Baron and Palmer, but also in kinetic data [7]. This dispersion can be attributed to several factors: (i) structural vacancies at sites A and B, along with additional water in the form of hydronium, as represented by Equation (1) [2,10,29,30,31]; (ii) incorporation of other ions into the structure; (iii) transformations undergone by jarosite during dissolution, leading to the formation of various secondary minerals such as schwertmannite, ferrihydrite, hematite, lepidocrocite, maghemite and goethite [12]; (iv) variability in experimental conditions; (v) utilization of different models for data analysis; (vi) time required to achieve equilibrium.
H 3 O 1 x K x F e 3 y [ ( O H ) 6 3 y ( H 2 O ) 3 y ( S O 4 ) 2 ]
In order to address these challenges, our study focused on elucidating the mechanisms of K-jarosite dissolution under specific conditions, particularly aiming to fill gaps in understanding its behavior under acidic conditions (using H2SO4) and room temperature (296 K). These investigations aimed to obtain data that can improve predictions of hazardous element release during jarosite dissolution and enhance the recovery of valuable metals from wastes generated in hydrometallurgical processes, as well as to better understand contaminant mobility in natural environments.
In this work, stirred batch dissolution experiments of K-jarosite were conducted under mild acidic conditions (pH 2 and 1), varying temperature conditions (296, 323 and 343 K) and different initial concentrations (0.4 and 1 g of jarosite/kg solution) to assess the effects of the experimental variables. Additionally, three distinct kinetic models (Derivative, Noyes–Whitney and Shrinking Core) were employed to analyze the data, determine the effect of variables on the kinetic parameters and select the most suitable model for describing the experimental results, thereby shedding new light on perspectives for future research.

2. Materials and Methods

2.1. Reagents and Solvents

Iron (III) sulfate hydrate [Fe2(SO4)3·nH2O, 97% purity] and potassium hydroxide (KOH, ≥85%, purity) were purchased from Sigma-Aldrich (Sigma-Aldrich, L’Isle-d’Abeau, France) and used to synthesize K-jarosite. Sulfuric acid (95%, purity) used as an acidic dissolution medium was purchased from VWR Chemicals (VWR, Rosny Sous Bois, France). All dissolution experiments were carried out using ultrapure deionized water (18.2 MΩ·cm). The standard solutions of Fe3+ and K+ used to make the calibration curve were purchased from PlasmaCAL SCP Science (SCP Science, Baie-D’Urfé, QC, Canada). Hydrochloric acid at 37% used to digest the solid in elemental analysis was purchased from Acros Organics (Acros Organics, Geel, Belgium), while the nitric acid at 30% used to dilute solutions in ICP analyses was purchased from Chem-Lab (Chem-Lab, Zedelgem, Belgium).

2.2. Synthesis and Characterization of K-Jarosite

K-jarosite was synthesized using Driscoll and Leinze’s method [32], which was previously developed by Baron and Palmer. This precipitation method was used due to its simplicity and frequent use in the literature. During the synthesis, 200 g of ultrapure water was heated to 368 K in a 0.25 L flask at atmospheric pressure. Ferric sulfate hydrate (34.4 g) and potassium hydroxide (11.2 g), corrected considering the purity, were then added to the solution. The mixture was stirred continuously using a magnetic stir bar and held at 368 K for 4 h. After this period, the solution was decanted and filtered, and the resulting solids were rinsed with ultrapure water. The residual solids were then dried at 383 K for 24 h, until constant mass. The precipitates with particle size smaller than 100 µm were then selected using Tyler sieves (WS Tyler, Mentor, OH, USA).
The synthetic sample was analyzed on a Thermo Scientific ARL Equinox 100 X-Ray Diffractometer (Thermo Fisher Scientific, Waltham, MA, USA) to verify jarosite formation. The diffractometer used a copper Kα X-ray source operating at 30 kV and 10 mA with radiation Cu Kα (λ = 1.5406 Å). Scans were collected from 5 to 90 degrees, with a step size of 0.02 degrees, 0.2 s dwell time, 133 mm2 irradiated area and sample rotation of 30 rpm. Mineral identification and pattern manipulation were conducted using the software Match!® Version 3.15. The solid surface morphology was examined by scanning electron microscopy (SEM) on a HIROX SH-3000 (HIROX, Oradell, NJ, USA) operating at 25.0 kV. The samples were coated with 1 mm of Au, using 30 mA during 60 s. In order to assess the surface of the synthesized solid, the BET method with N2 gas adsorption was used [33]. Prior to BET analysis, the samples were outgassed under vacuum at 303 K for 24 h.
The chemical composition of the K-jarosite synthesized was determined by induction-coupled plasma optical emission spectroscopy (ICP-OES) on a Thermo Scientific ICP-OES Analyzer iCAP 6500 duo (Thermo Fisher Scientific, Waltham, MA, USA). In order to determine bulk chemical composition by wet chemistry, a triplicate of 0.1 g of synthetic K-jarosite was added to 5 g of HCl 37% to totally dissolve the solid. Then 0.3 g of dissolved jarosite was added to 40 g of a 2% HNO3 to dilute before passing in the ICP-OES. The K-jarosite chemical formula was obtained subsequently using the general formula Equation (1).

2.3. Dissolution Apparatus

Far-from-equilibrium dissolution experiments were conducted under different conditions to determine jarosite dissolution rates using Fe3+, and K+ initially, as the elements followed over time. A double-envelope reactor in borosilicate glass (Figure 1) with a volume of 1 L developed by Pignat (Pignat, Genas, France) was used.
The materials in contact with the reagents and products are made of PTFE to ensure adequate chemical compatibility and avoid any corrosion effects. The internal temperature of the reactor is controlled automatically through a Julabo DYNEO DD-BC6 thermostatic bath (Julabo, Seelbach, Germany) connected to the double jacket. The choice of such a large-capacity reactor was motivated by the large quantity of samples over time during dissolution as well as the need to recover the remaining solid at the end of experiments. A second thermostatic bath, Julabo F250 (Julabo, Seelbach, Germany), was used to control the temperature of the reactor condenser, and a Heidolph mechanical agitator was used to ensure proper mixing.

2.4. Dissolution Experiments

The approach used to conduct the experiments takes into account the detailed precautions outlined by Königsberger [34]. Experiments were performed at room temperature (296 K) at pH 1 and 2, using concentrations of 0.07 and 0.006 mol/kg of H2SO4, respectively. The pH was measured using a Mettler Toledo pH meter (Mettler Toledo, Zürich, Switzerland) (±0.01) at the beginning and end of each experiment, as the pH was left uncontrolled throughout the dissolution experiment. The temperature was maintained constant at 296 ± 1 K throughout using the thermostatic bath connected to the double jacket during the experiment, and the solution was stirred at 600 rpm.
For each room temperature experiment, two different initial concentrations of jarosite in the solution, giving different solid-to-liquid ratios (1 and 0.4 g of jarosite/kg of solution), were studied to understand how much this parameter could influence the kinetics of dissolution. The initial concentrations were chosen based on preliminary experiments, aiming to minimize the amount of solid used for each experiment and to maintain an excess of solid at pH 2. The same amount of initial solid concentration was chosen to facilitate comparisons with experiments at pH 1.
Higher-temperature (323 and 343 K) experiments were also performed to determine the dependence of temperature in dissolution reactions for both pH 1 and 2. However, for these experiments, the initial concentration (0.4 g of jarosite/Kg of solution) was maintained as constant.
Once agitation of the acidic solution was underway and the desired temperature for the study was reached, a first control sample was taken and considered as the reference blank. Then, K-jarosite was added, respecting the chosen initial concentration ratio. The sampling frequency was chosen based on the rate behavior of each experiment. After the start of dissolution, aliquots (7 mL) were initially taken at 30 min intervals of reaction, followed by sampling every 1 or 2 h. Samples were then taken at increasing time intervals until reaching equilibrium.
The recovered K-jarosite suspension samples were immediately filtered using Fisherbrand 0.2 μm PTFE syringe filters (Thermo Fisher Scientific, Waltham, MA, USA) to separate solid residues. Once filtered, 5 g of sample was added to 5 g of 2% HNO3 to dilute and stop any reaction that may occur before analysis by ICP-OES. The concentrations reported in this article represent the average of triplicate analyses performed by ICP-OES and are expressed in mg/kg of solvent. Standard deviation is below 1% for all measurements. Each experimental condition at different temperatures was replicated twice, and the reported standard deviation of the kinetic rate indicates good reproducibility of the experiments.
Concentrations did not need to be adjusted after sampling since the reaction medium was continuously mixed, and K-jarosite was always in suspension in the solution. Therefore, the K-jarosite/water ratio in the reactor remained unchanged throughout the experiment. During preliminary tests, three samples were taken from the same location in the reactor, and three samples were taken from different points in the reactor to confirm, respectively, the repeatability of the concentration found in the reactor for the same instant of the reaction and the homogeneity of the concentration in the whole reactor volume. After achieving equilibrium, the remaining solid was decantated at room temperature, then dried at 110 °C in an oven for 24 h.

2.5. Kinetic Modelling

In order to evaluate the impact of acidity on dissolution rates, a plot is constructed correlating the logarithm of acidity with the logarithm of the rate, while to assess the effect of temperature, the Arrhenius equation Equation (2) can be employed to determine the activation energy of the reaction.
k = k 0 × e E a R T
where k0 is the preexponential factor, Ea is the apparent activation energy in J/mol, R is the ideal gas constant (8.31 J/mol·K) and T is the temperature in K.

2.5.1. Derivative Kinetic Model (DVKM)

The derivative kinetic model (DVKM) offers a straightforward means of interpreting kinetic data obtained from dissolution processes. Highly used by geochemists, this model facilitates comparison of process conditions effects. The DVKM consists in fitting the dissolution kinetic curves with a second-order polynomial. This approach is favored due to the typical concentration profiles that generally display the characteristics of parabolic curves: an initial rapid release of constituent ions followed by an ever-decreasing rate of dissolution until a quasi-steady state is attained. The initial dissolution rate is obtained by the slope of the fitted second-order polynomial curve at the initial time point. The derivative of the polynomial provides a first-order expression, and its evaluation at time zero yields a constant value that represents the initial rate of change. This value is taken as the dissolution rate constant and aligns with methodologies employed in previous studies [18,35].

2.5.2. Noyes–Whitney Kinetic Model (NWKM)

In the Noyes–Whitney kinetic model, reaction orders and rate coefficients can be calculated by integrating the rate law depicted in Equation (3) with respect to the concentration of an element [36].
d C d t = k × ( C e q C )
where C is the concentration in the liquid phase of an element at a given time, k is the kinetic constant and Ceq in the liquid phase is the concentration at the end of the dissolution.
The equation is based on Fick’s law, where the difference between the concentration of the solid and the liquid phase acts as the driving force. This concentration gradient decreases when the concentration of the compound increases in the solvent. The NYKM was applied to study K-jarosite dissolution by Baron and Palmer [8].

2.5.3. Shrinking Core Kinetic Model (SCKM)

In the Shrinking Core kinetic model, the progress of jarosite dissolution, as the radius of the sphere decreases, can be represented by the mass fraction of reacted jarosite (X). This fraction is obtained by the ratio of the concentration of an element at time t and the concentration of this element after reaching the steady state (t = tf), as described by Equation (4):
X   = C F e , K C F e , K t   =   t f
The plot of the conversion over time can be divided in three distinct zones: the induction period, the progressive period and the equilibrium period. During the first period (induction period, tind), the adsorption of reactive ions on the solid surface occurs, and since the surface bonds of the particles are stronger than within the particle, the reaction rate is slower. Consequently, the concentrations of aqueous products are low during this period. The second period is characterized by a significant increase in aqueous product concentrations. This progressive stage is the longest-lasting during the dissolution process and constitutes the focal point of interest of the SCKM. In the stabilization period, the third and final stage, the ion concentration in the solution does not vary with time because complete dissolution of the solids has been achieved, and the concentration of aqueous products is nearly constant. Therefore, this stage is not considered, and the estimated dissolution time is given by Equation (5), which sums up the induction and progressive periods.
ti = tind + tpro
The conversion period, being the longest period, is the most important to model kinetic rate. This stage can be characterized by three different control mechanism: mass transfer in the fluid layer that surrounds the particle, Equation (6), when there is no formation of an ash halo; chemical reaction on the surface of the particle, Equation (7); and mass transfer in the layer of solid product when the diffusion through the ash halo is slow, Equation (8). The three mechanisms are mathematically represented by the following expressions:
1 1 X i 2 / 3 = k × t
1 1 X i 1 / 3 = k × t
1 3 1 X i 2 / 3 + 2 1 X i = k × t
where Xi is the conversion of component i that has reacted, k is the experimental constant in min−1 and t is the time in minutes.
A linear plot is obtained with these equations when adjusting the conversion experimental data with time, and the resulting slope corresponds to the experimental rate constant of the progressive period k. The duration of the induction period (stage I) is calculated semi-empirically from the intersection of the straight line obtained from the linear regression with the time axis of the progressive conversion stage. The intersection point represents the induction period duration (tind) and the inverse of the induction period represents its rate constant (tind−1).

3. Results and Discussion

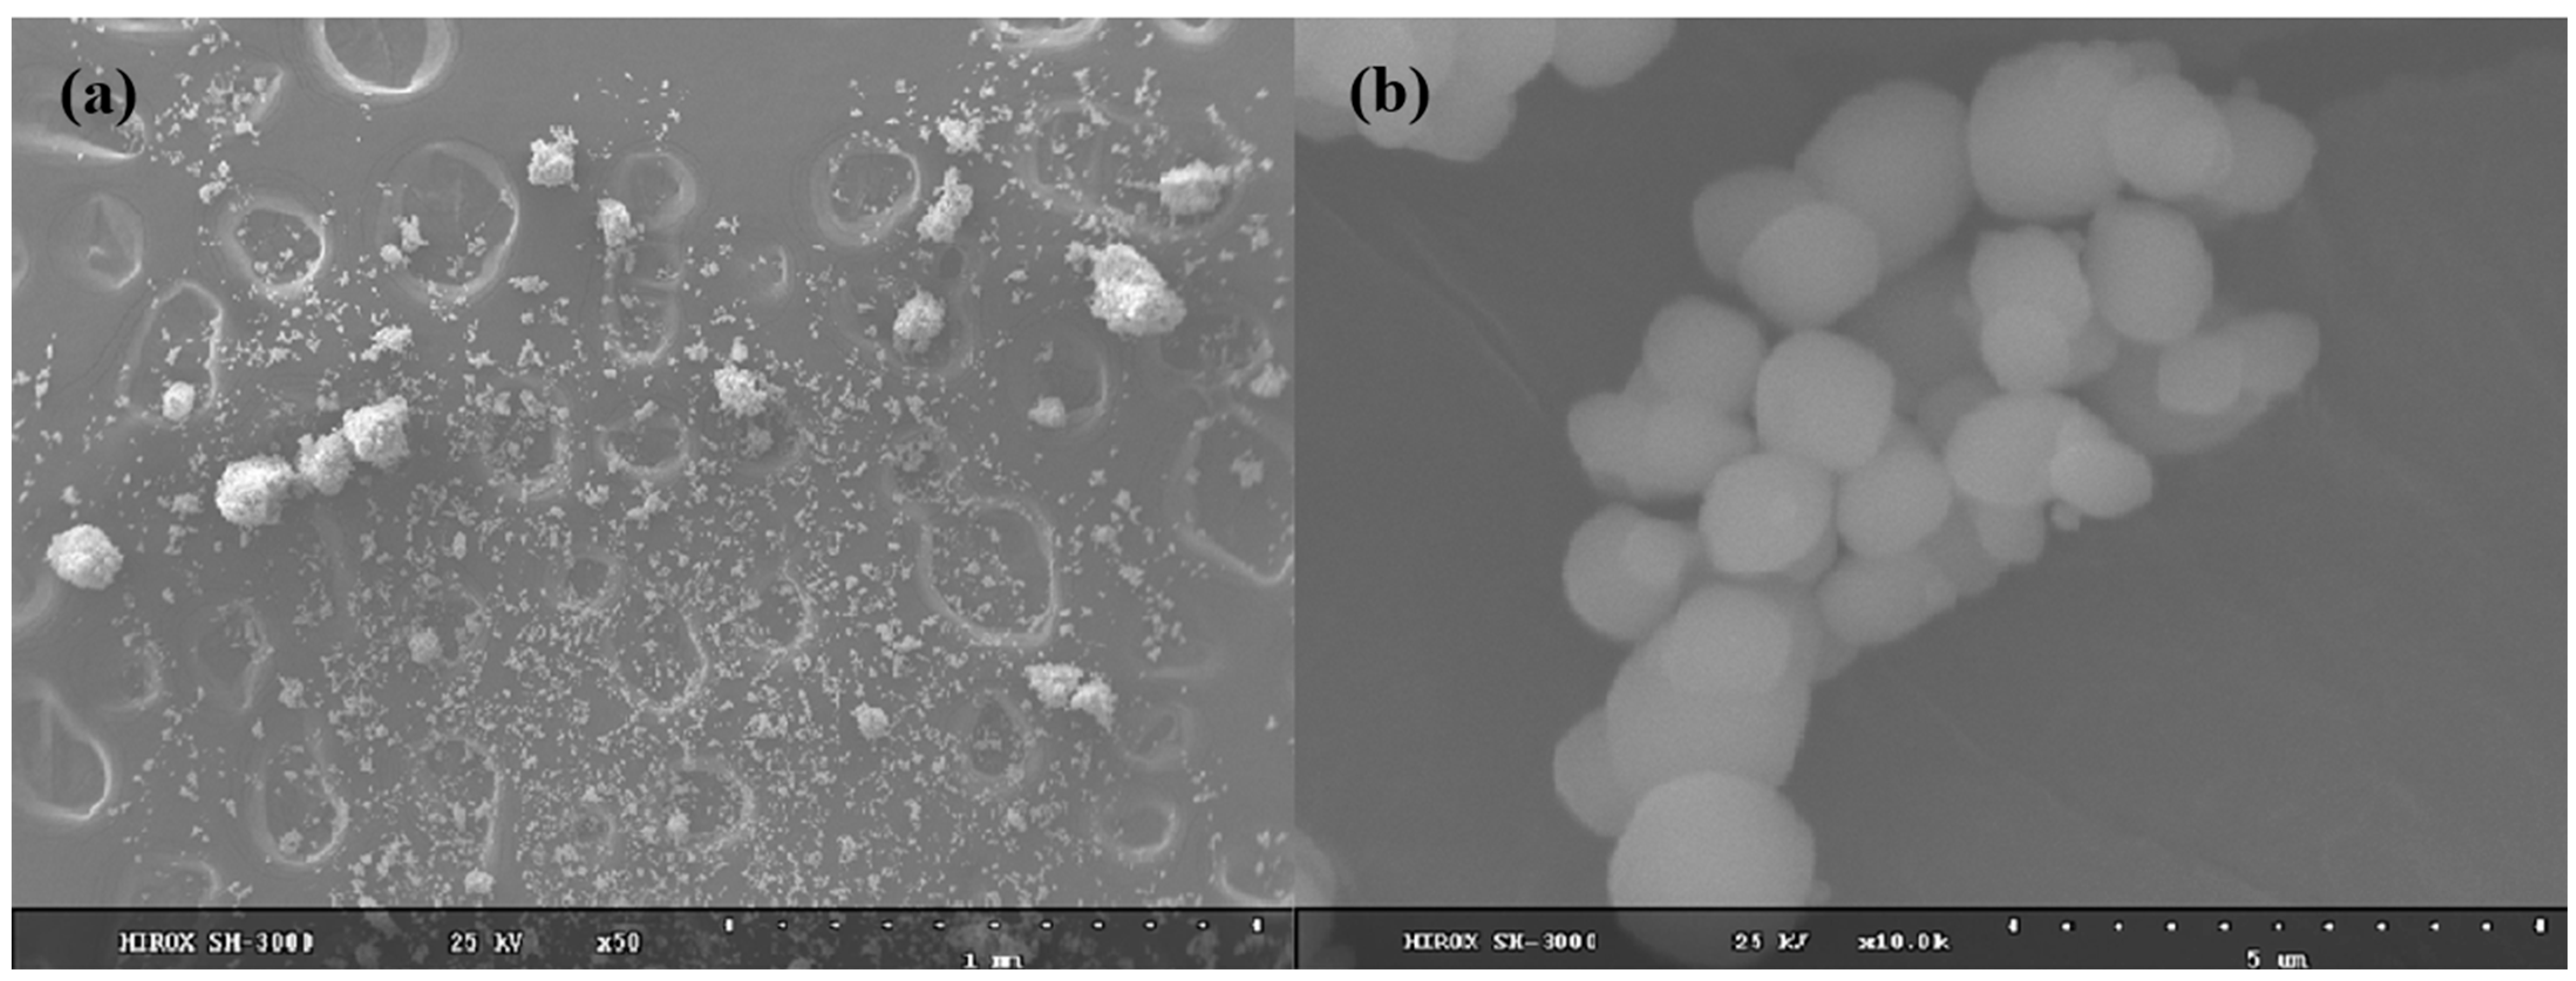
The K-jarosite synthesized solids were typically yellow-brown in color, as expected. The obtained SEM images (Figure 2) show that the particles have an irregular and spherical nature (anhedral shape). The majority of the grain sizes range from 1 to 3 µm (Figure 2b), with agglomerates on the order of 10–20 µm (Figure 2a). The spherical shape of the particles with compact structure, as observed in the morphological study, is suitable for monitoring the dissolution. Similarly, spherical shaped particles were observed in the literature by Smith et al., 2006 [10].
On the other hand, Welch et al., 2008 [11], using a natural sample, observed a relatively euhedral shape for jarosite with grain sizes ranging from 0.5 to 5 µm. The euhedral crystal shape is associated with high crystallinity, as observed in the studies by Gasharova et al., 2005 [9] and Qian et al., 2019 [19]. Other systems, such as silicates, have shown that the decreased crystallinity of a solid may increase the dissolution rate [37,38].
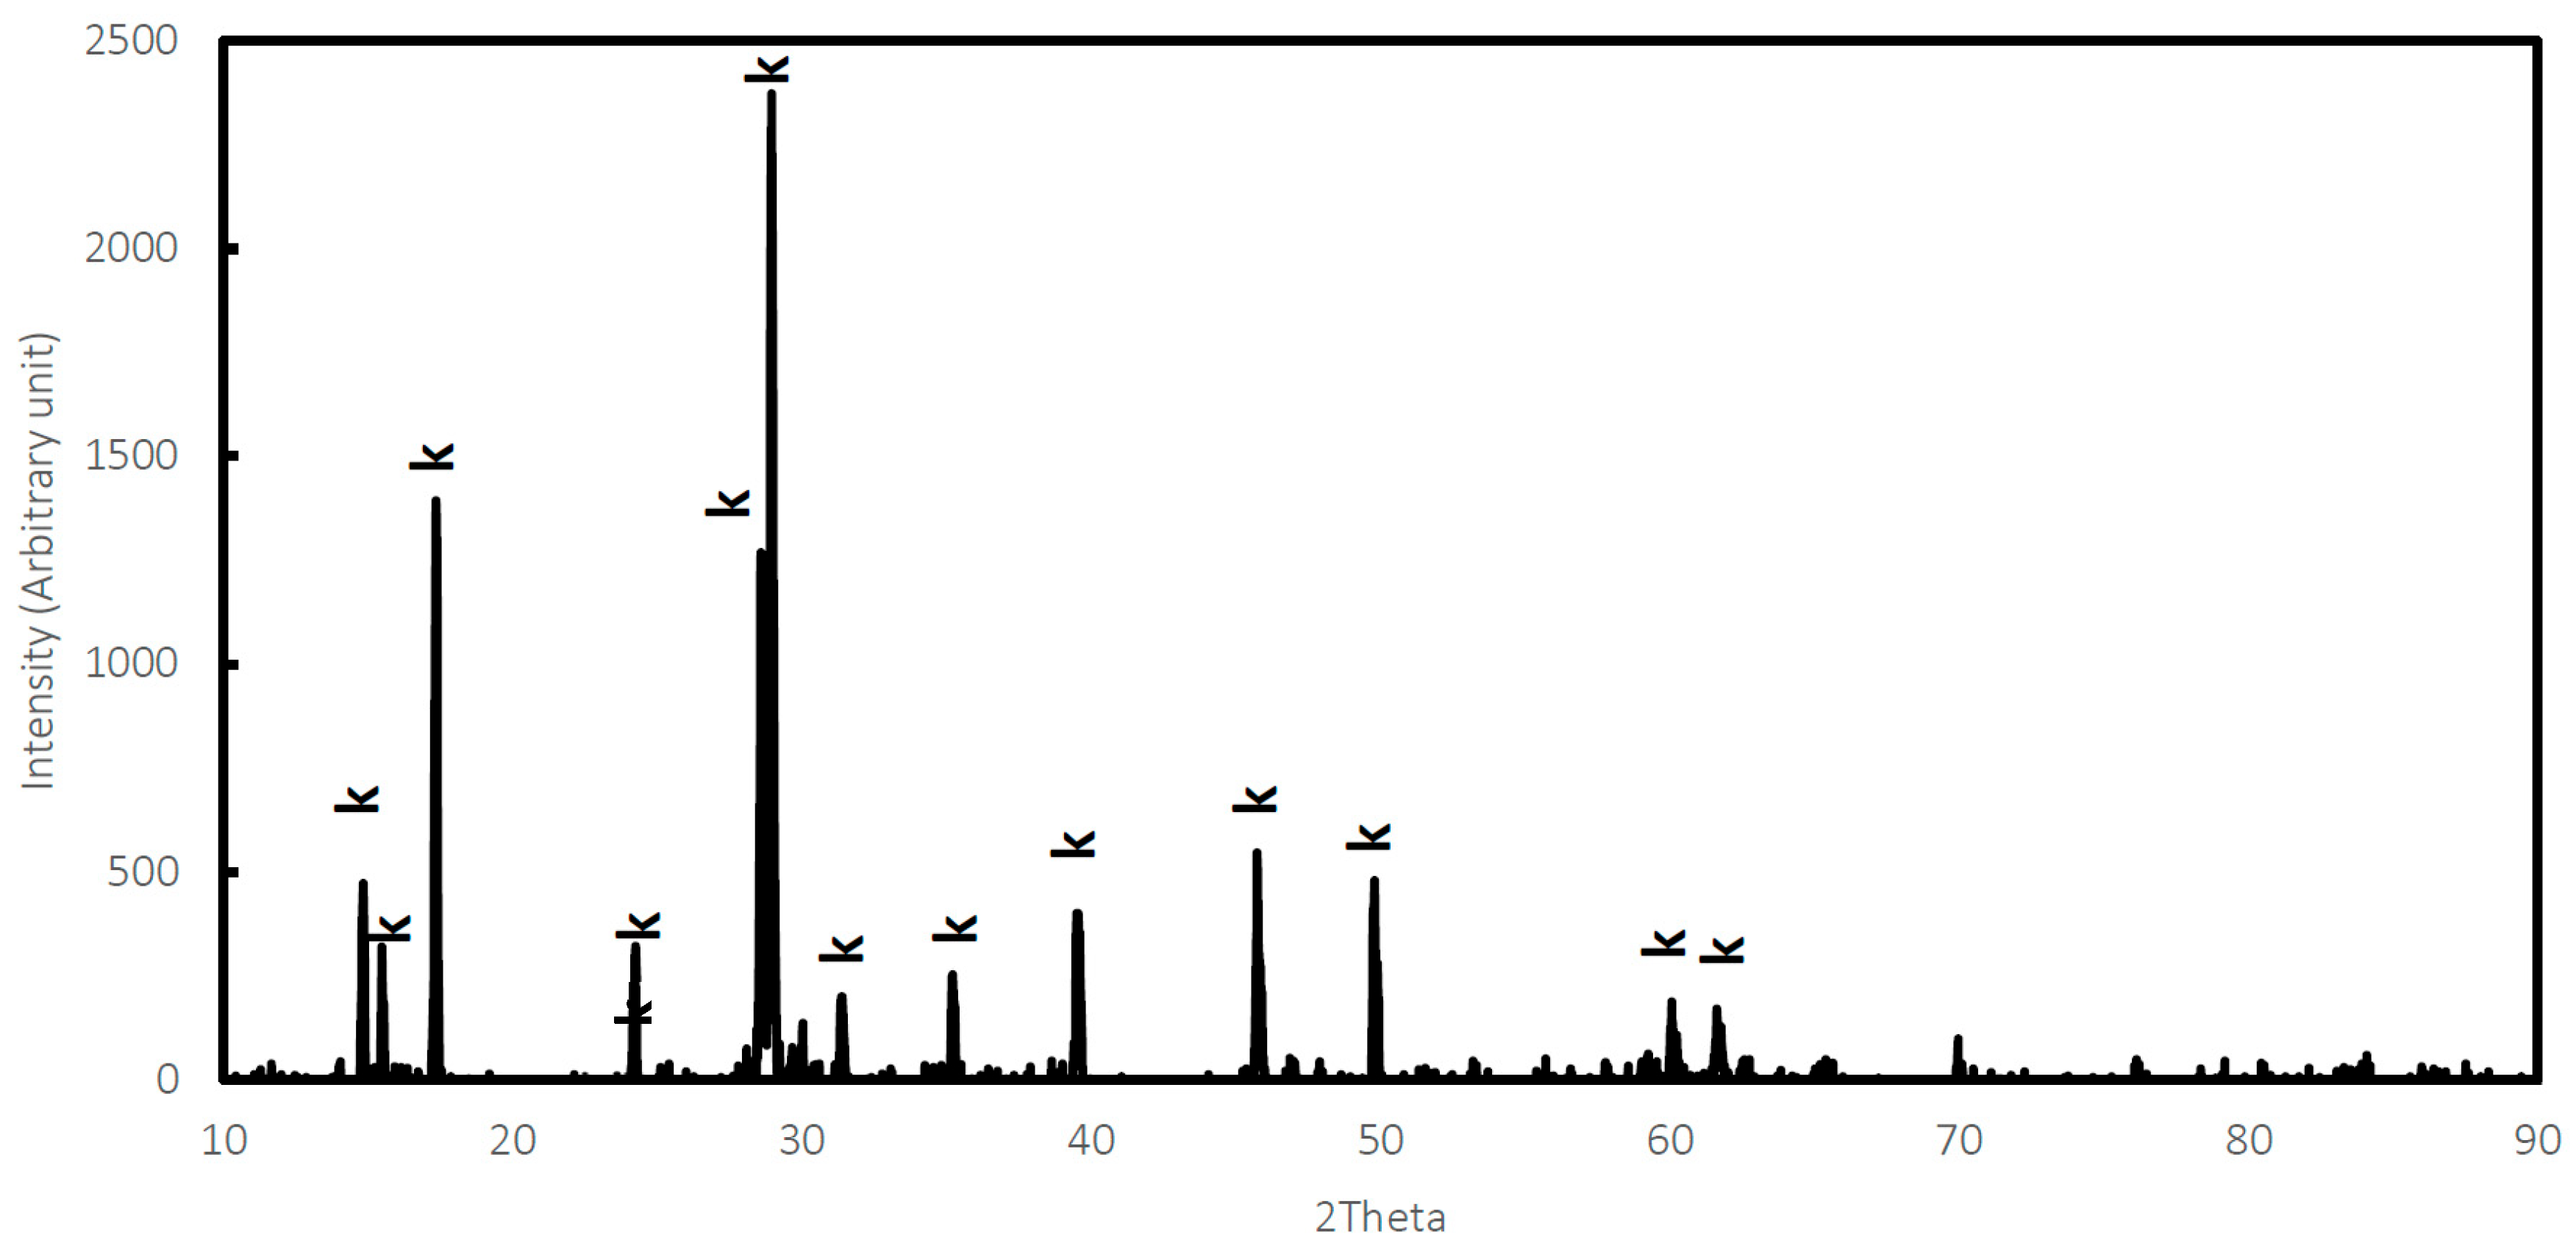
X-ray diffraction patterns for synthesized K-jarosite were compared to the Powder Diffraction file from Match® (Figure 3). Prior to analysis, the XRD diffractograms were corrected by manual background subtraction to improve peak resolution and enable more accurate comparison between samples. The background was estimated by fitting a smooth baseline beneath the diffraction pattern, taking care to avoid distortion of peak shapes and intensities. Peaks arising from additional mineral phases were not observed, indicating that the jarosite is a pure phase. However, the diffraction pattern corresponded more closely to a jarosite with a certain degree of hydronium substitution in site A. BET analysis yielded a surface area of 2.0 m2/g.
The estimated chemical composition of the K-jarosite particles is displayed in Table 1. The chemical formula was determined using the formula provided by Kubisz [29], which recommends normalizing the formula based on complete occupancy of SO4 at site C, equal to 2. Any remaining imbalanced charges are compensated by additional OH. The synthetic K-jarosite precipitate showed less than full iron occupancy within site B. A sharing occupancy between H3O+ and K+ occurs in site A, where K + H3O = 1, as expected due to the diffraction pattern obtained in Figure 3. Despite this, the Fe/K ratio in our synthetized mineral was close to the ideal composition (3:1) of K-jarosite.

3.1. Dissolution Behavior at Room Temperature

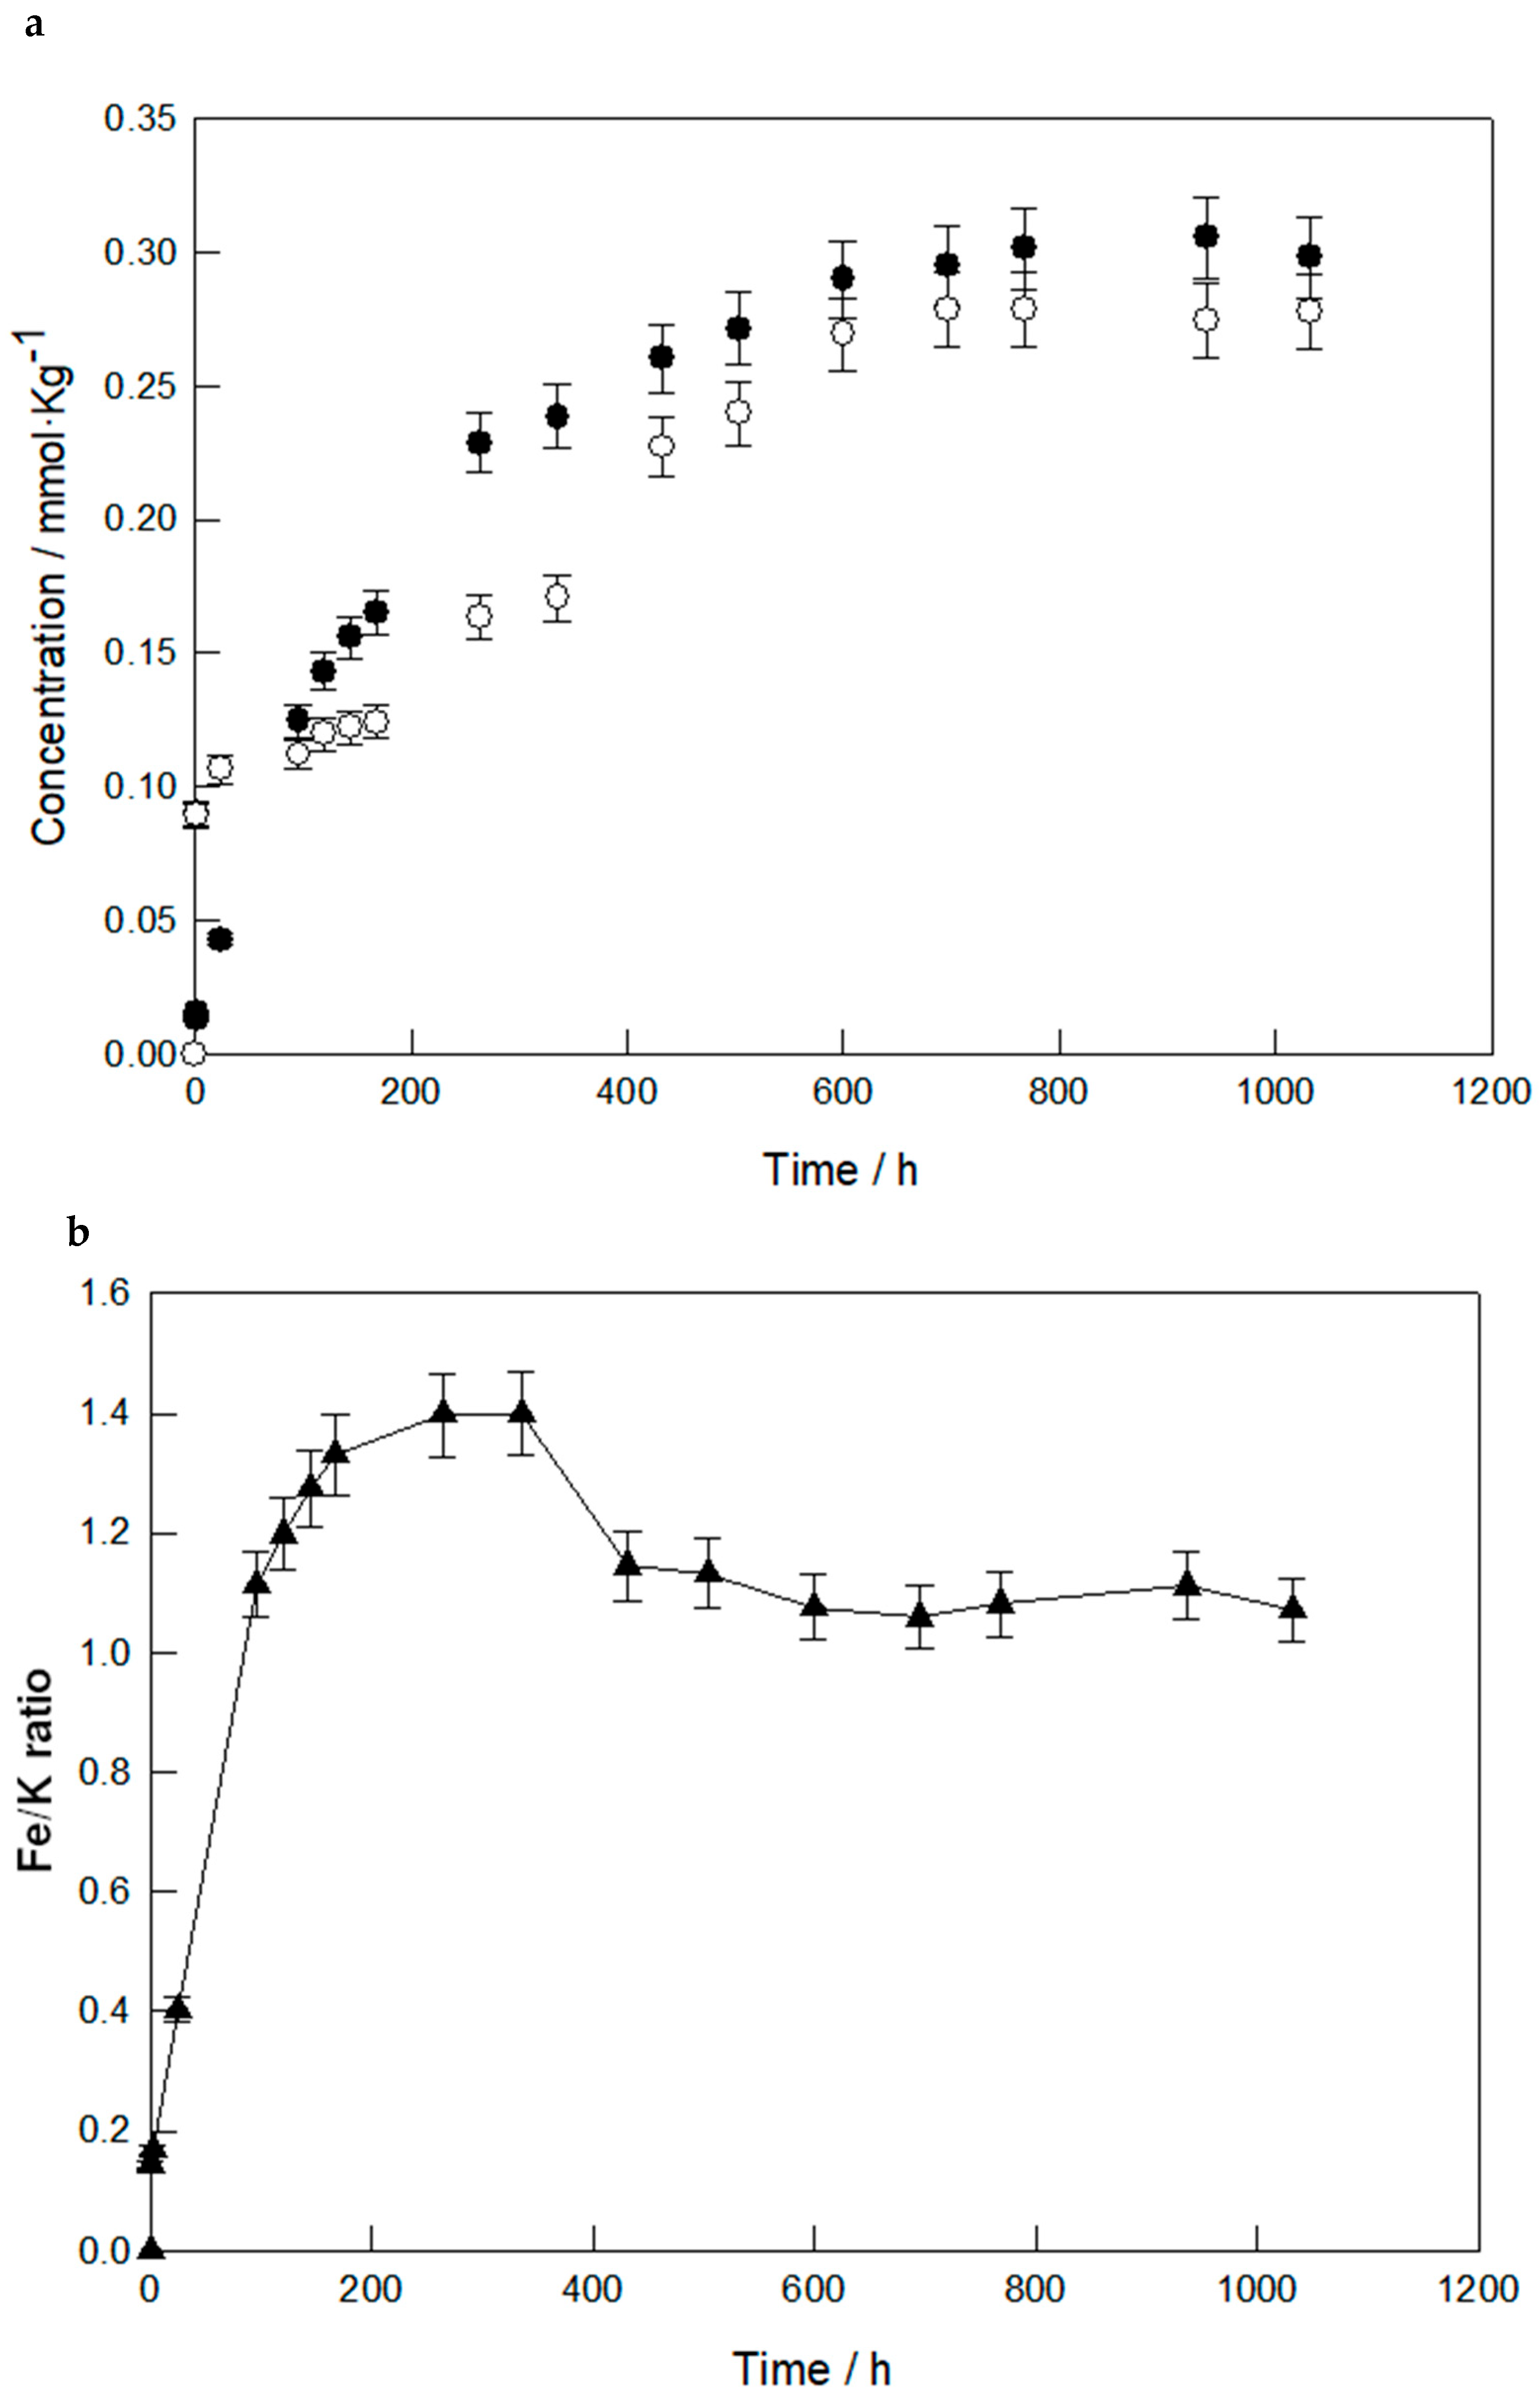
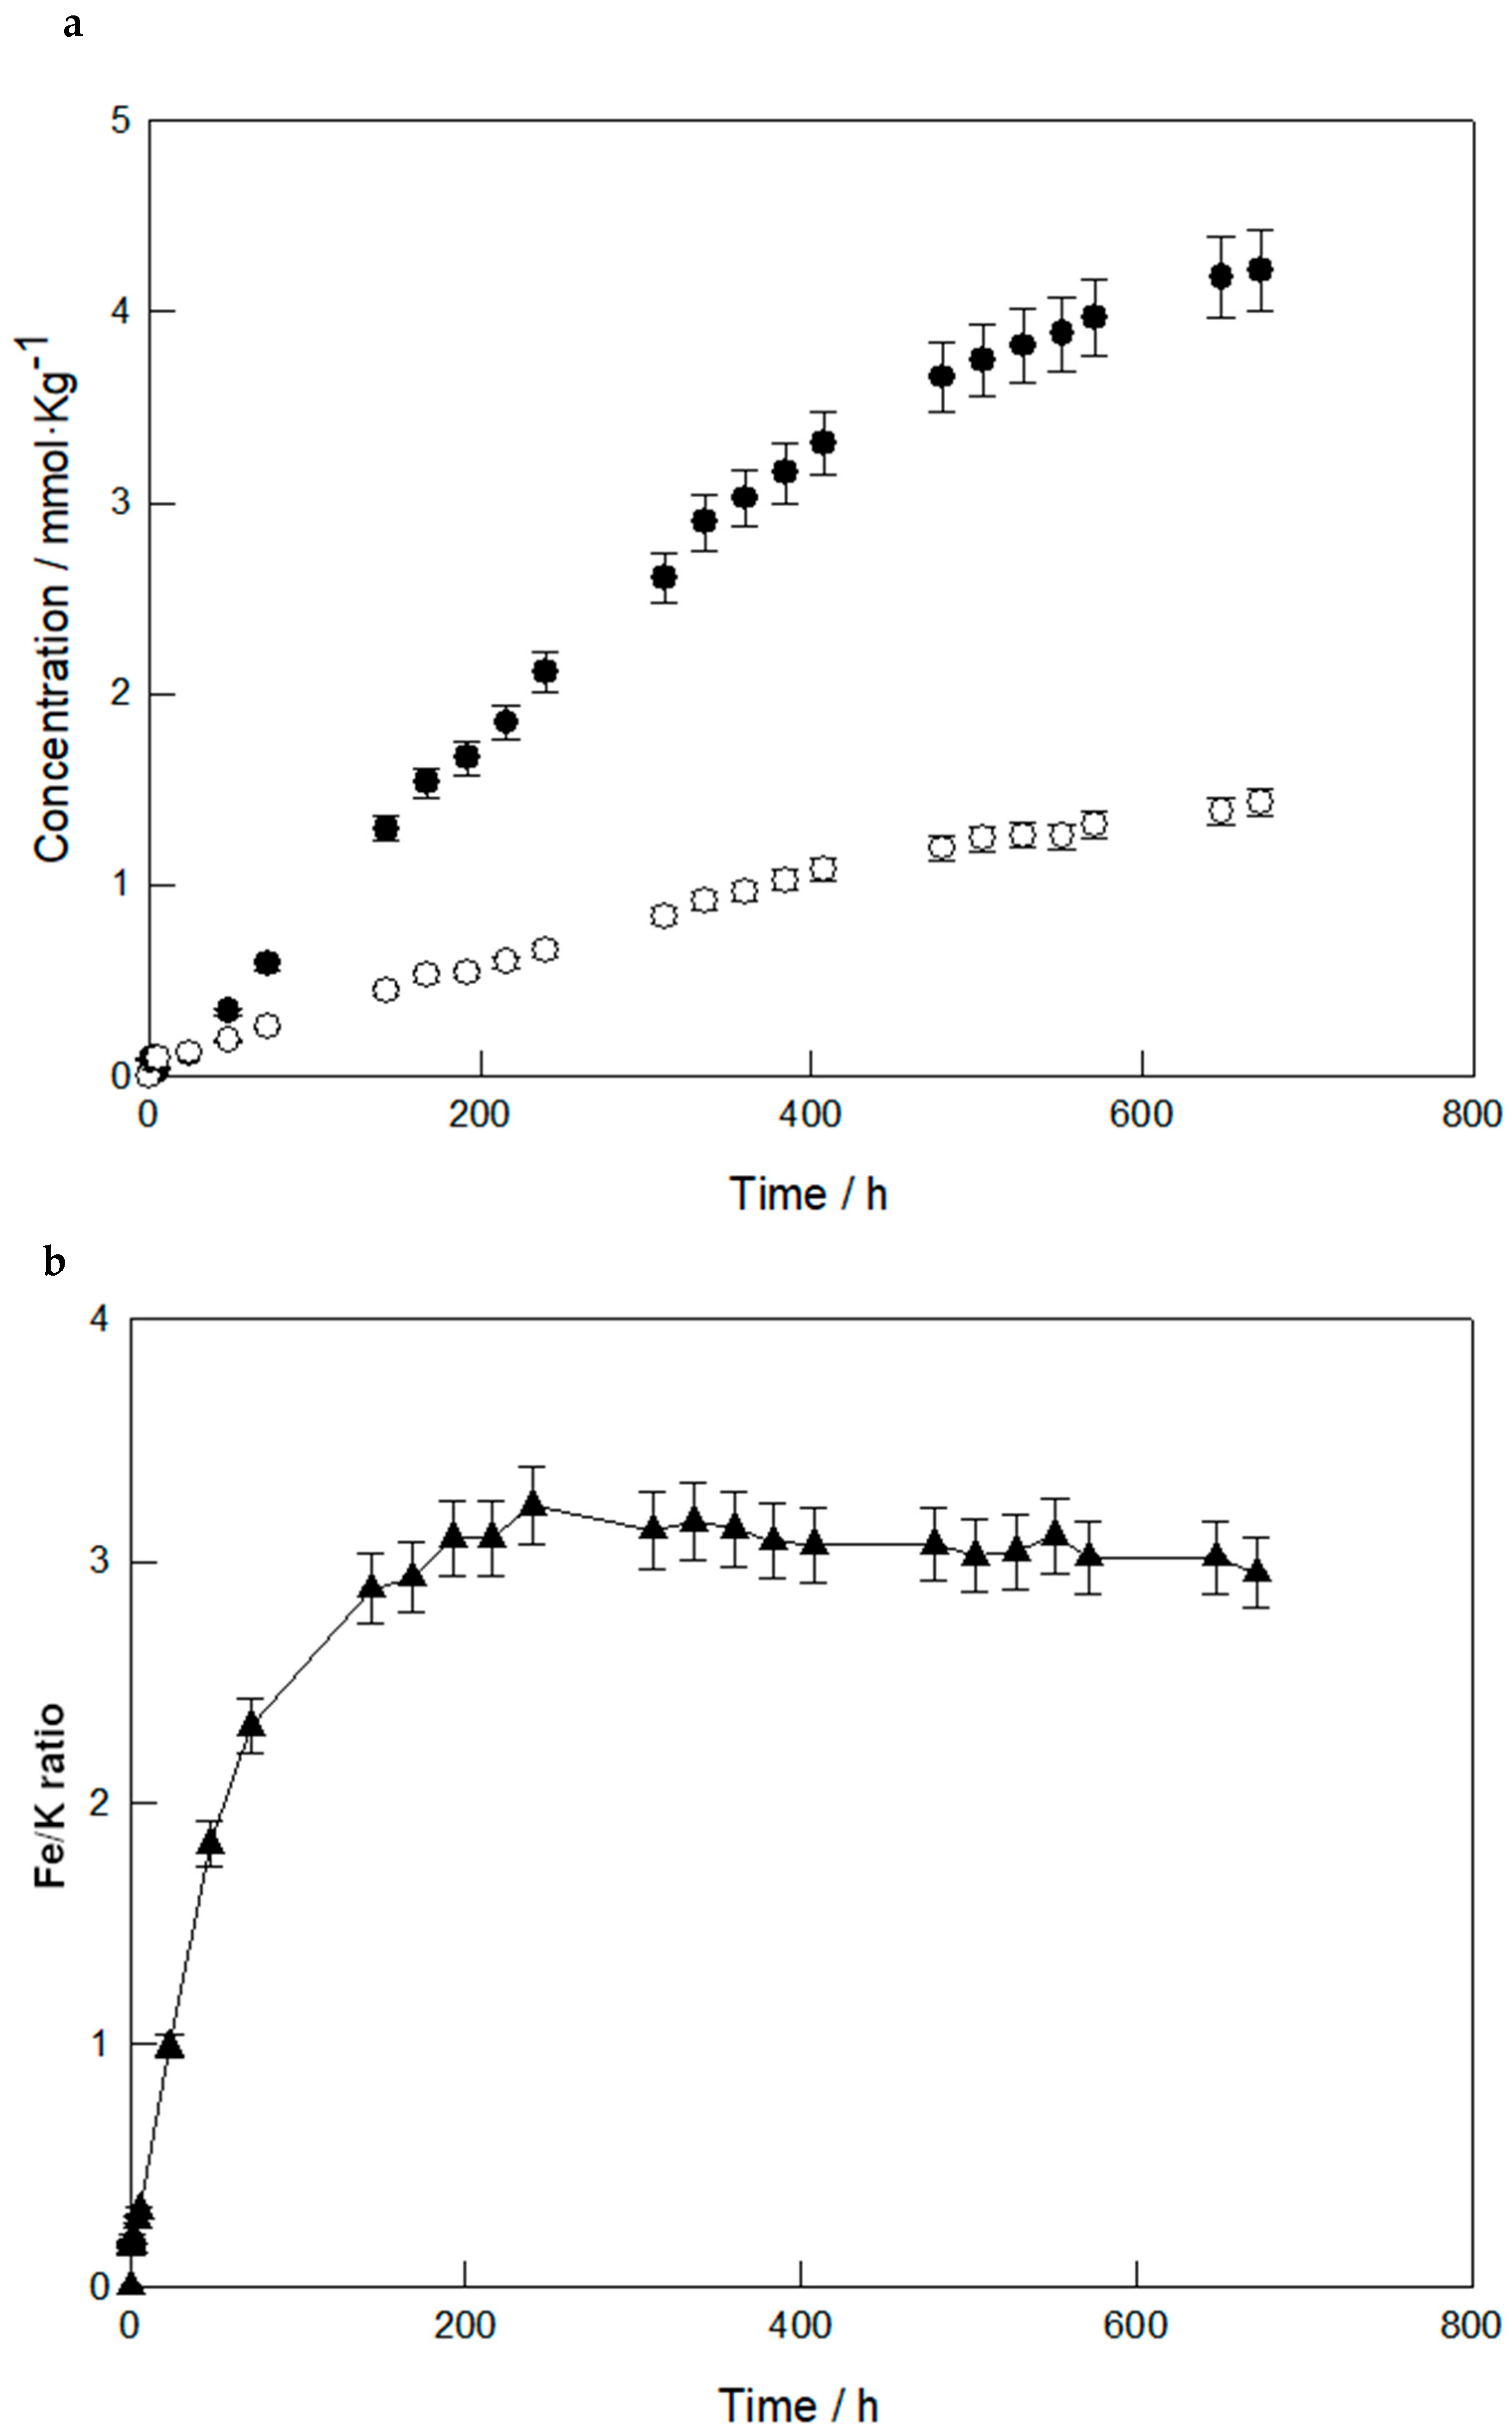
All experiments conducted at pH 2 and at room temperature showed similar trends. The concentration of all aqueous components rapidly increased during the first few days of dissolution, followed by a decrease in the release rates over time. At the beginning of each experiment, there was a sudden increase in K+ in the first hours, while the concentration of Fe3+ increased slowly (Figure 4a). This can be explained by the fact that iron exhibits strong chemical bonds with oxygen (Kendall et al., 2013) [16]. Potassium, on the other hand, is trapped within the structure of K-jarosite and adsorbed onto the outermost part of the grains. In the following days, the release of Fe3+ accelerated while the release of K+ slowed down. Nearly constant concentrations were reached after approximately 45 days. In the same sense, the evolution of the molar ratio of elements (Fe/K) over time (Figure 4b) indicates that dissolution at pH 2 was incongruent (non-stoichiometric). Moreover, kinetic data also suggest that this molar ratio distribution evolves over time.
In Figure 4a, the final concentration of potassium and iron was 0.28 mmol/kg and 0.32 mmol/kg, respectively. These solubility results are close to those obtained by Smith and Baron and Palmer’s studies [8,10], which were approximately 0.40 mmol/L of Fe3+ and 0.20 mmol/kg of K+. The differences between the studies may be attributed to the use of different acidic media, while those authors used HCl, the present work used H2SO4, leading to slight differences in solubilities and kinetic rates. Since sulfate is produced as a result of the dissolution process and is present in the solution before the addition of the solid, it can shift the equilibrium towards the reaction of formation of K-jarosite, thus reducing the conversion rate, according to Le Chatelier’s principle and Equation (9).
K F e 3 S O 4 2 ( O H ) 6 + 6 H + K + + 3 F e 3 + + 2 S O 4 2 + 6 H 2 O
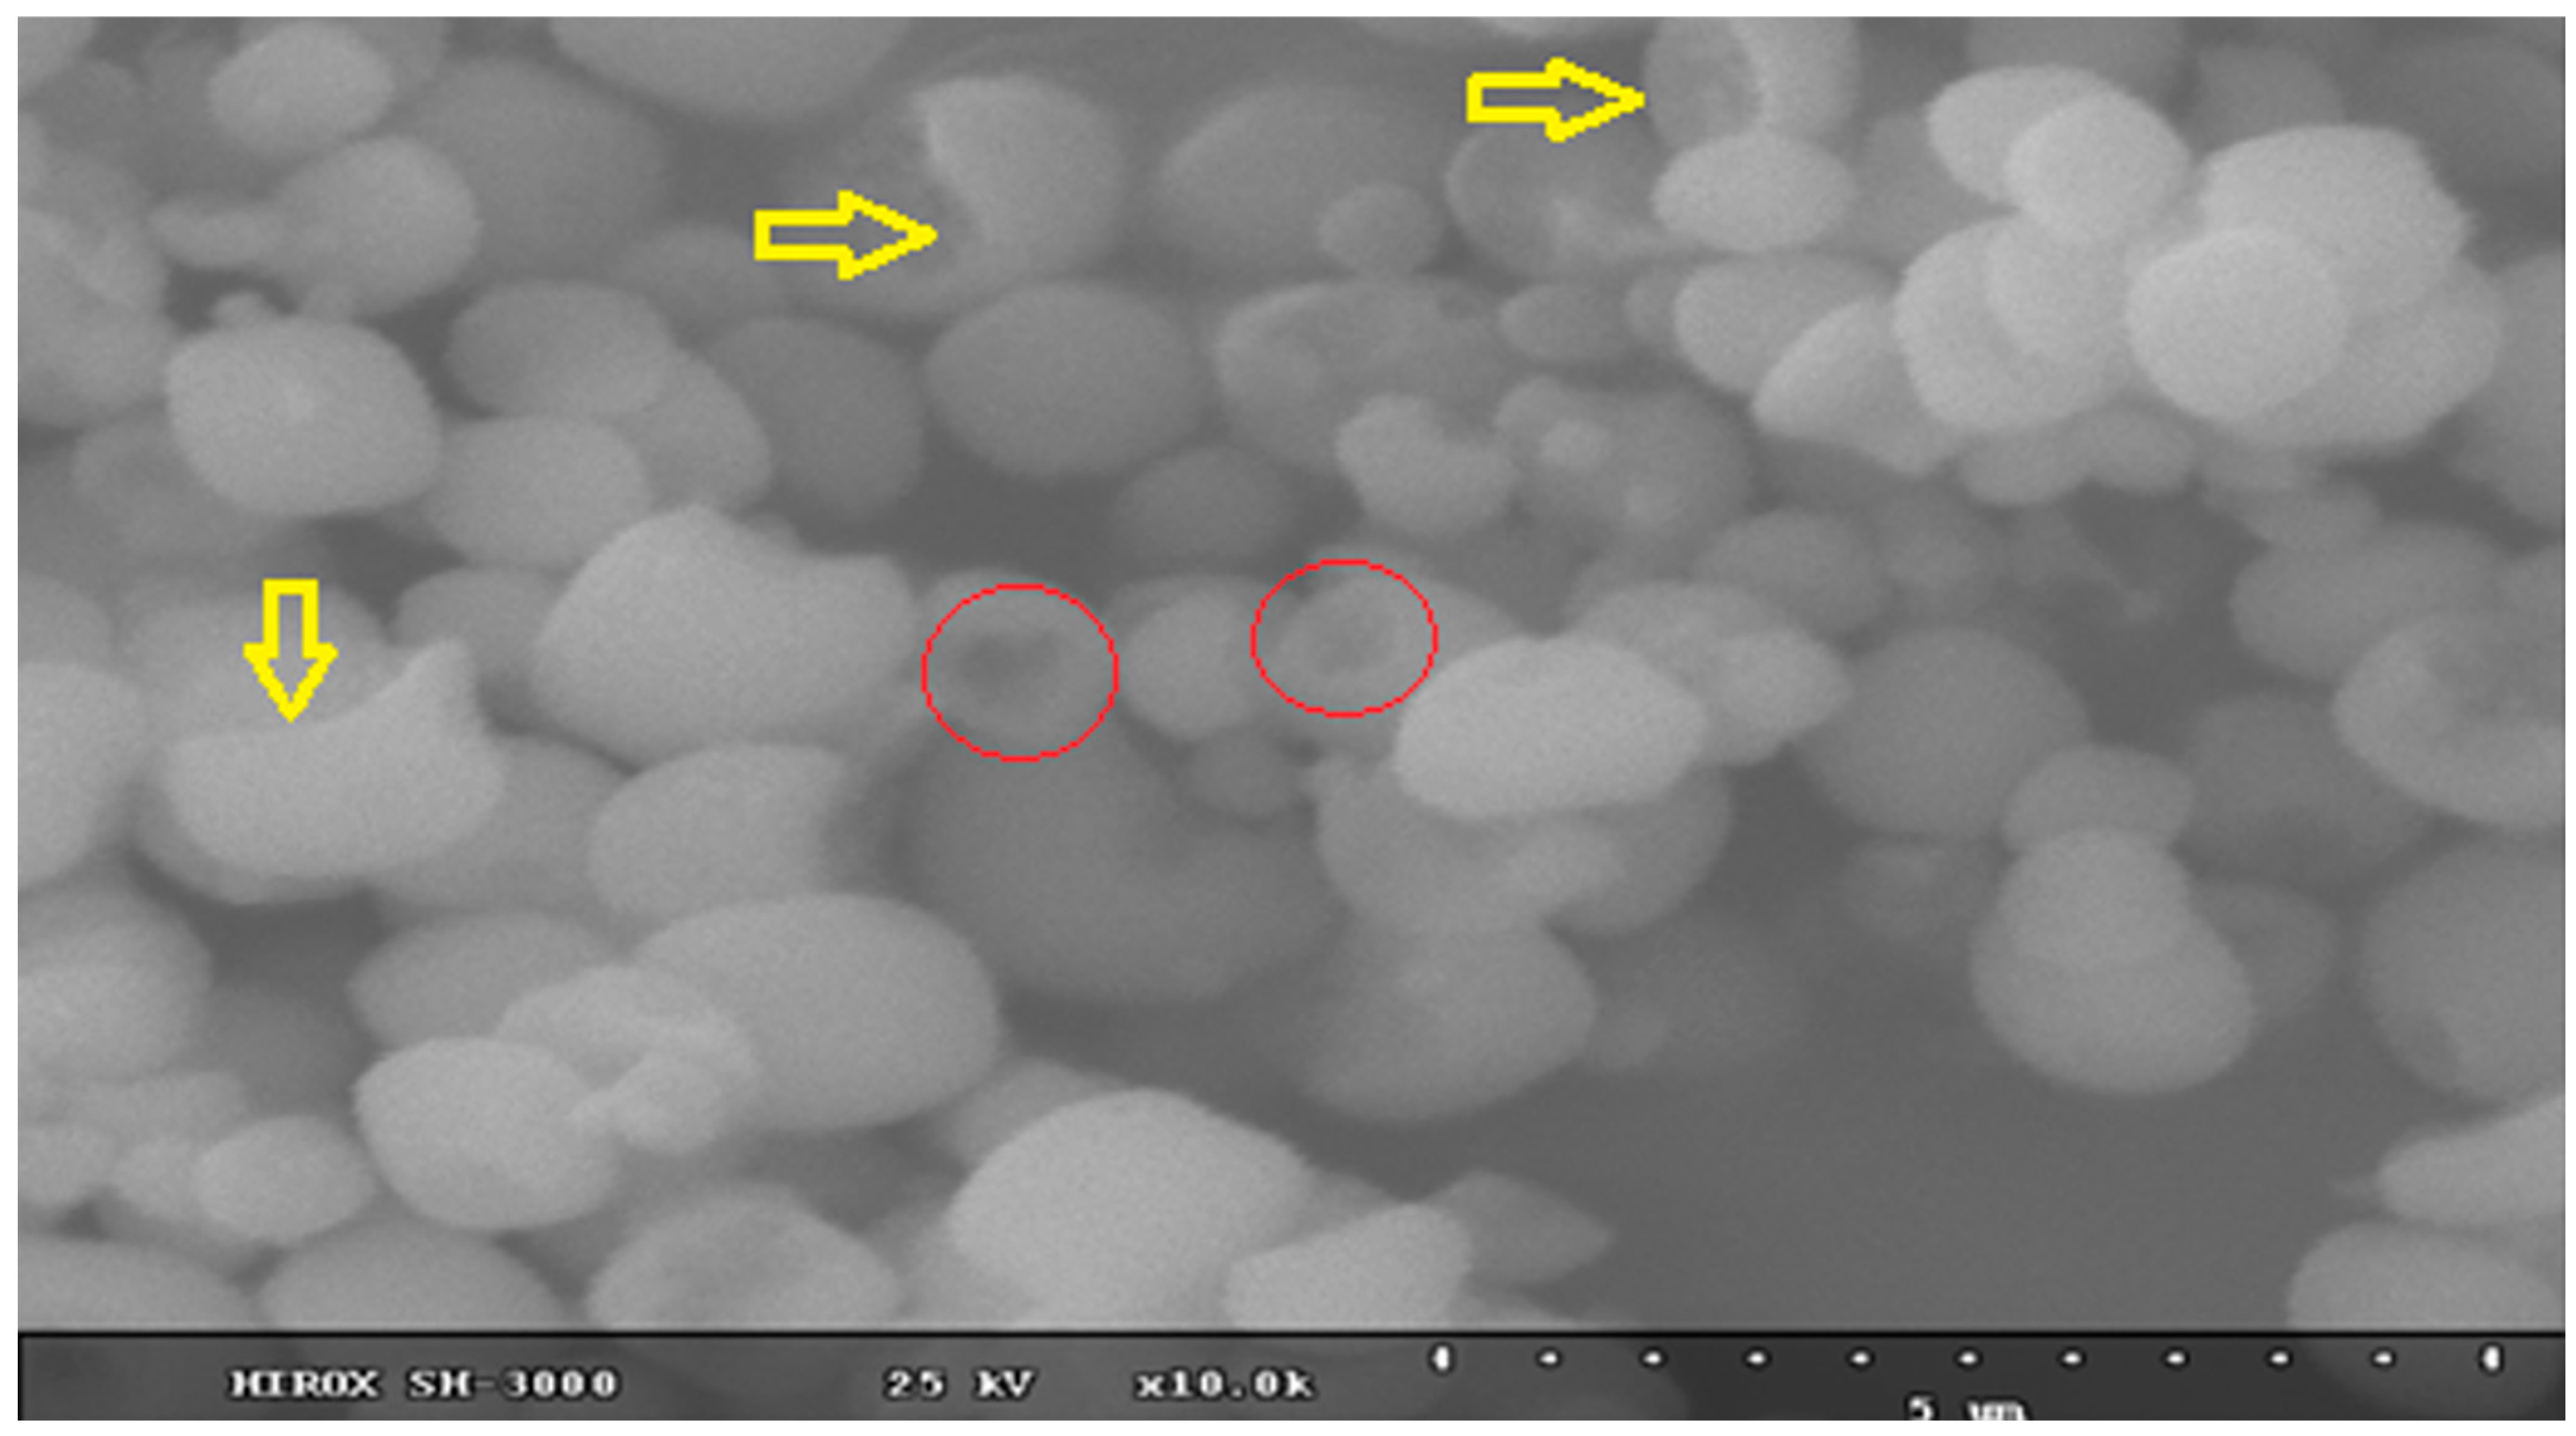
After 45 days of K-jarosite dissolution at pH 2, the solids were collected and characterized. The SEM image (Figure 5) shows no change in the general departure size of K-jarosite. However, there was a notable increase in surface roughness (yellow arrows) and extensive and deep pitting (red circles), which was also observed by Smith [10].
The results from experiments carried out varying the initial concentration (1 and 0.4 g K-jarosite/kg solution) at 296 K suggest that this variation does not significantly affect the time required to reach equilibrium. The pH values measured remained approximately 2 at the end of each experiment (≈2.03).
Then, the decrease in pH from 2 to 1 was evaluated (Figure 6). The results of the dissolution experiments at pH 1 are similar to the behavior described at pH 2. However, an increase in the concentration of Fe3+ and K+ over time was observed. Additionally, dissolution at pH 1 showed complete dissolution (no remaining solids), reaching equilibrium more quickly than at pH 2. Figure 6a indicates that the equilibrium time at pH 1 was reached after 27 days of dissolution, with a Fe/K stoichiometric ratio of approximately 3 (Figure 6b), which agrees with the stoichiometry of the synthesized solid used in the experiments.
The results reported here, similar to Smith’s [10], suggest that a transport-controlled dissolution model may be governing these dissolution experiments at higher pH [39], although this cannot be proved without further investigations into the effects of temperature, stirring rates or the use of specific fitting models such as the Shrinking Core kinetic model.

3.2. Dissolution Behavior at Higher Temperatures

The dissolution experiments were carried out at two different temperatures (323 and 343 K) and at both pH 1 and 2, with the same operational conditions used at room temperature, and on the initial concentration of 0.4 g of K-jarosite/kg of solution.
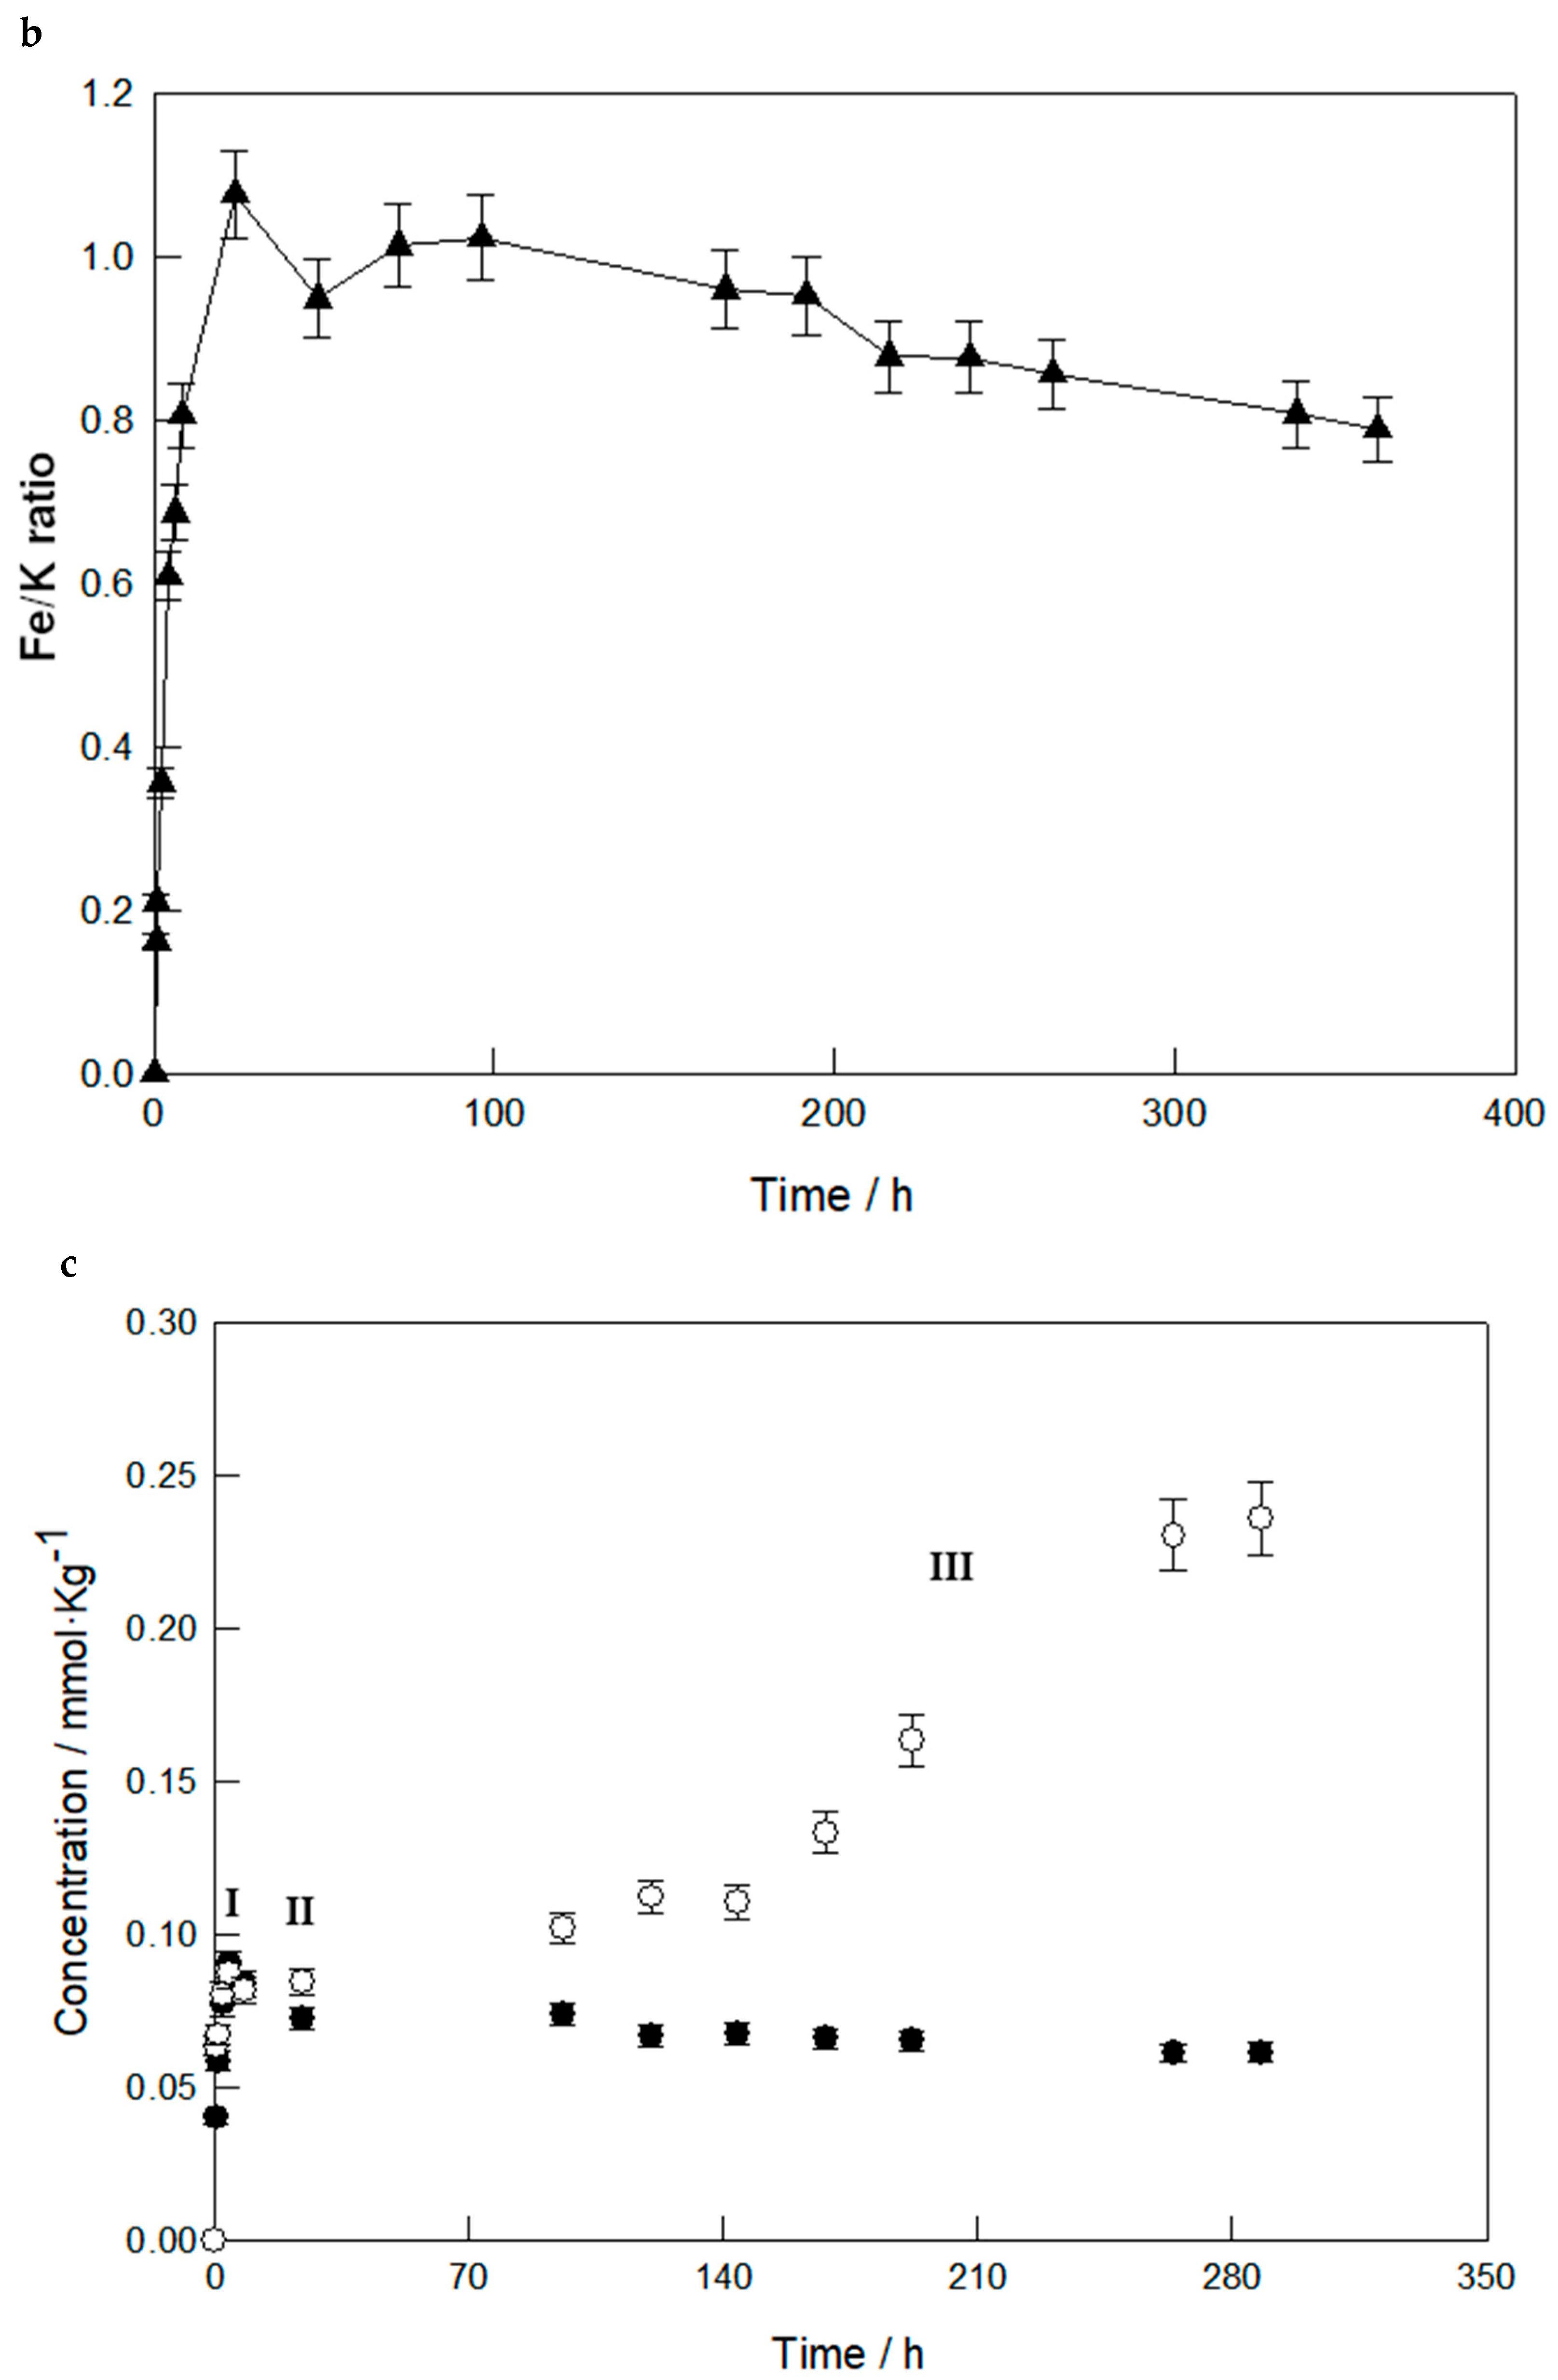
The experiments at 323 and 343 K and at pH 2 (Figure 7a,c) exhibited a higher rate than at room temperature (23 °C), although the concentrations at the end of the experiments were lower (0.15 and 0.08 mmol/kg, respectively). The curves show three stages: a faster increase in concentrations at the beginning of dissolution compared to dissolution at 296 K (I); followed by a decrease in the concentration of Fe3+ and K+ (II, most noticeable, although faster, at 343 K); and a third stage where the concentration of K+ increases again while the concentration of Fe3+ remains almost constant (III). Despite the similarity in behavior, the experiment at 343 K and pH 2 (Figure 7c) showed an even faster rate compared to the experiment at 323 K.
Additionally, the evolution over time of the Fe/K ratio (Figure 7b,d) shows a faster increase in released iron on the first day and in the first four hours, at 323 K and 343 K, respectively. This sudden increase in the Fe/K ratio is followed by a decrease in the molar ratio, as iron appears to precipitate while potassium continues to be released.
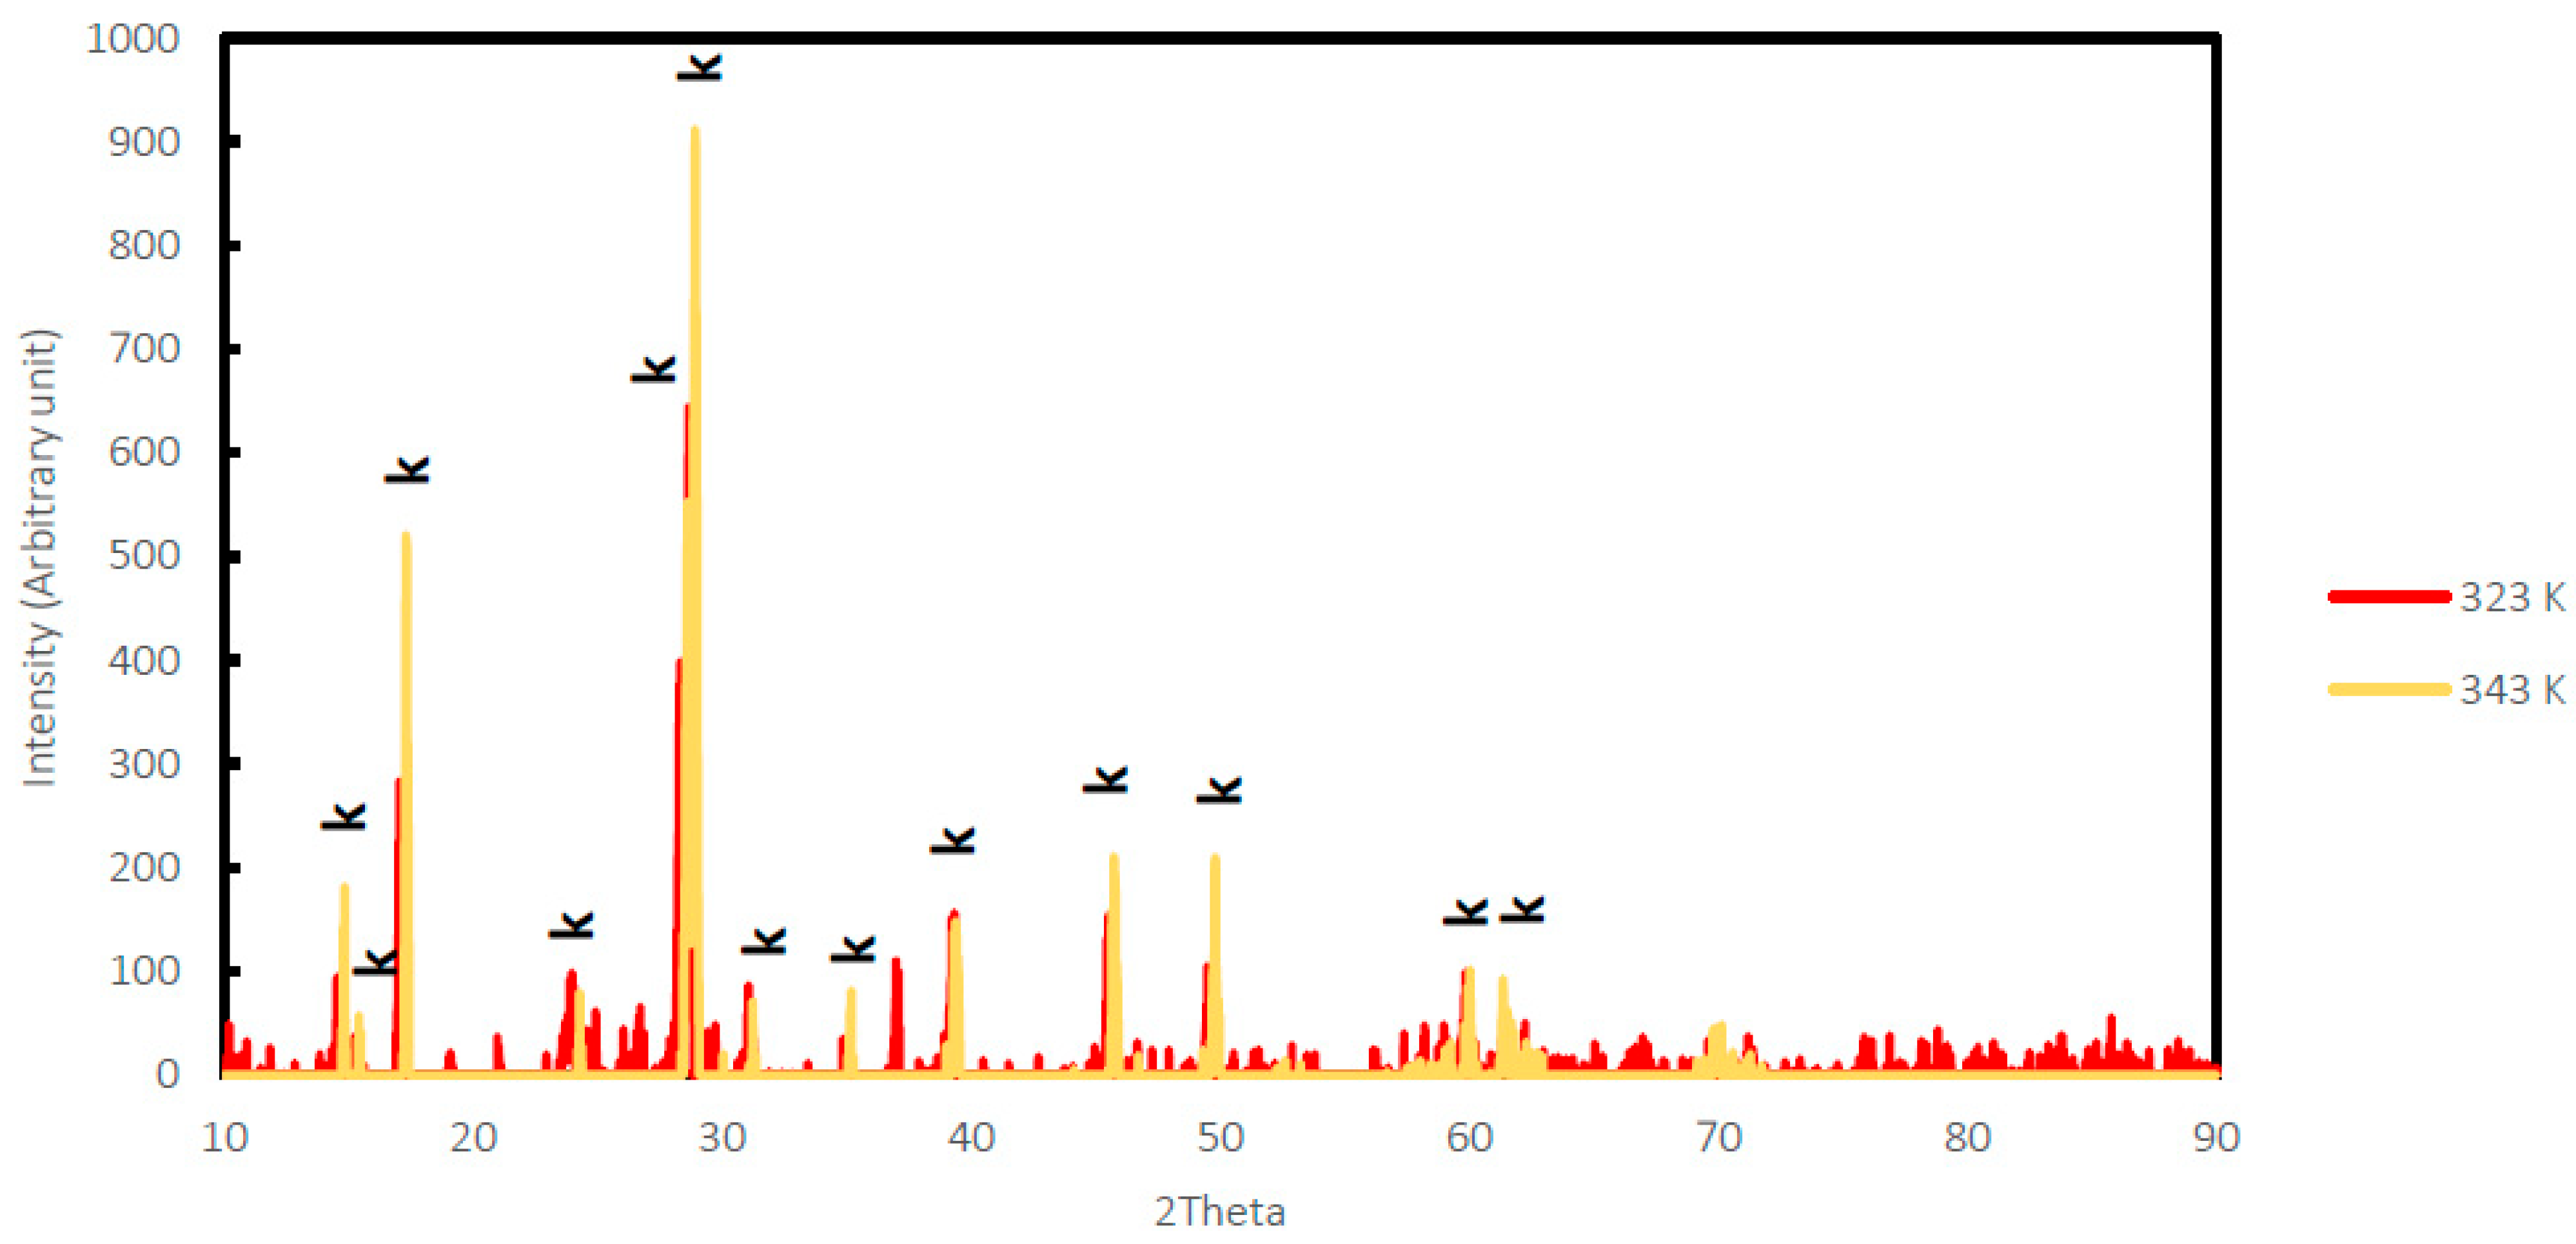
Indeed, it is highly probable that a solid phase of iron precipitates to cause this decrease in solution concentration. Casas and colleagues have reported, when studying the solubility of sodium-jarosite at 343 K, the formation of goethite (FeOOH) [40]. According to them, if the Fe3+ concentration exceeds saturation, the dominant species FeOOH is likely formed under these conditions. Despite this possibility, XRD analysis of the remaining jarosite after dissolution in the present study (Figure 8), at both temperatures studied, did not show any important additional peaks in the diffractogram. However, an increase in the background noise of the diffractograms was observed. Two possibilities can be suggested: either the reprecipitate is a solid phase of hydronium jarosite given the absence of potassium ion precipitation or another mineral phase precipitates but in such small quantities that XRD could not identify it. In addition, the XRD peaks are bigger at 323 K than at 343 K, possibly because the dissolution experiment conducted was longer at 323 K (15 days) than at 343 K (12 days).
When the experiments used a pH of 1 and temperatures of 323 and 343 K, the dissolution curves behaved similarly to the dissolution at 296 K, although the obtained results had faster dissolution rates reducing the equilibrium time to one day and four hours, respectively. Furthermore, just like in the experiment at 296 K and pH 1, dissolution was complete, with no solids remaining in the reactor at the end of the experiment.
K-jarosite completely dissolves at pH 1 without the formation of solid reaction products, allowing for a more reliable calculation of dissolution rates based on iron release. Furthermore, sulfate also complexes with iron [41], suppressing the precipitation of iron oxides. According to the literature, jarosite dissolution is likely controlled by the breaking of Fe-OH bonds, as this step represents the rate-limiting process of the dissolution reaction [16].

3.3. Modeling of Dissolution Kinetics

3.3.1. Derivative Kinetic Model (DVKM)

The kinetics of dissolution were determined using K+ and Fe3+ concentrations plotted versus reaction time until constant concentration was reached. The concentrations were divided by the K-jarosite surface (BET) to compare with other results available in the literature. Then the resulting curves were fitted with a second-order polynomial. Table 2 summarizes the results found in the literature and those found in this study. The highest dissolution rates for K-jarosite were obtained when acidity was the lowest and temperature the highest, which was consistent with prior expectations.
It has been observed, by comparing the dissolution rates of the two elements, that the dissolution rates were faster for Fe3+ in all experiments. However, the concentration values found for potassium at the beginning of the experiment increase more rapidly than for iron, as shown in Section 3.1. In kinetic analyses, the reaction control mechanism is generally associated with the slowest dissolution rate. In this case, it is possible to assert that Fe3+ would be the element controlling the dissolution process initially, while K+ takes its place after some time.
It is further noted in Table 2 that decreasing the pH from 2 to 1, at constant temperature (296 K) and initial concentration, increases the dissolution rate for both elements by an order of magnitude. At an initial concentration of 1 g of K-jarosite/kg of solution, following iron, the kinetic rate increased from −9.95 to −8.83, and following potassium, the rate increased from −10.26 to −9.39. Furthermore, the time required to reach a quasi-stable equilibrium decreased (from 45 to 27 days).
At room temperature (296 K) and pH 2 using sulfuric acid, the rates found in this study were slower than the rates reported in the literature from the dissolution of synthetic K-jarosite. Elwood Madden and Kendall reported rates almost two orders of magnitude faster for potassium ions (−8.55 and −8.42, respectively), but their values only accounted for initial concentrations during the first two hours of dissolution, whereas the present study considers the curve until quasi-equilibrium.
However, the dissolution rates of K-jarosite reported in this study were approximately an order of magnitude faster than those measured by Dixon under similar conditions (−11.18), where they tracked potassium and iron for 16 days. They emphasized that the timescale has a significant effect on the calculations of the initial rate, as we have also noticed in this work.
Furthermore, the rates reported by Baron and Palmer, and Smith, respectively, −8.51 and 8.80, were 1.5 to 2 orders of magnitude faster than our results. However, it should be noted that these authors used hydrochloric acid instead of sulfuric acid, which may explain this difference. The use of HCl should lead to faster kinetics because Fe3+ has a high ionic potential among the cations present in the mixture. Thus, Cl ions tend to better complex with Fe3+ than with K+ [13]. Ionization breaks the Fe-O bonds of K-jarosite, thereby increasing the dissolution rate.
This affirmation is supported by other arguments, such as the use of Le Chatelier’s principle, already explained with Equation (9), and the experimental results of Welch et al., 2008 [11] when comparing the use of hydrochloric and sulfuric acid at pH 3 and pH 4, finding that the dissolution rates were faster when using hydrochloric acid for both pH values. The results obtained in this study show that the slower behavior and smaller values of the kinetic rates align more consistently with the use of H2SO4 as the acidic medium. The values found here also agree more closely with the results of Dixon et al., 2015 [18] and deviate from the faster rates and higher concentrations found by Kendall et al., 2013 [16], since it contradicts evidence of faster kinetics for hydrochloric acid mediums than for sulfuric acid.
Trueman et al., 2020 [20] emphasized that the dissolution rate of jarosite-type compounds could be impacted by the solid/liquid ratio, as higher ratios may reduce the time required for the solution to saturate compared to jarosite and Fe(hydr)oxide. Thus, another valuable piece of information brought by the experiments carried out in this study concerns the effect of the initial concentration of K-jarosite in solution at the beginning of the reaction. However, in our study, when the initial solid/liquid ratio decreases at a given pH, the dissolution rate tends to slightly increase. Nevertheless, the increase is inconclusive as the rate value decreases by less than 5% for each element, which falls within the standard deviation of the experimental values. According to these observations, the reduction in the solid–liquid ratio to 0.4 g of K-jarosite/kg of solution has a relatively minor impact compared to the effects of decreasing pH or increasing temperature.
From the results of kinetic rates, it is possible to quantify the effect of experimental conditions on dissolution. In this way, the influence of H3O+ concentration in solution for both solid–liquid ratios was checked, as well as the influence of temperature on the rates by finding the activation energy of the reaction.
Firstly, the parameters of the dependence of rate constants on H3O+ concentration were calculated for both initial solid-to-liquid ratios. As illustrated in Table 3, for a larger solid/liquid ratio, the slope of the curve (n) is more pronounced, and the acidity concentration has a greater impact on the dissolution rate. Indeed, a greater amount of solid initially present in the medium requires more consumption of H3O+ ions and additional time to establish the reaction front.
When the pH values are compared for a single initial solid–liquid ratio, it is highlighted that the release rates of K+ and Fe3+ increase with the rise of H3O+ concentration, and Fe3+ ions show a stronger dependence on acidity compared to K+ ions. The correlations obtained from the linearization of the data obtained at pH 1 and 2 (0.07 mol/kg and 0.006 mol/kg, respectively) are presented in Table 3.
The linear regression based on the data in Table 3, at room temperature (296 K) and a solid/liquid ratio of 0.4 g of K-jarosite/kg of solution, yields a release rate of Fe3+ that increases as a function of H3O+ concentration, providing the rate equation: Equation (10).
r = 10 7.62 × [ H 3 O + ] 0.95
Secondly, the parameters for the dependency of the rate constants on temperature were calculated for different temperatures always using a solid/liquid ratio of 0.4 g of K-jarosite/kg of solution, and the activation energy of the reaction was then determined.
At pH 1, temperature played a crucial role in increasing dissolution rates by approximately one order of magnitude (−9.23 to −7.90 for K+ and −8.66 to −7.37 for Fe3+) between 296 and 323 K, and by more than 0.5 orders of magnitude (−7.90 to −7.06 for K+ and −7.37 to −6.62 for Fe3+) between 323 and 343 K. More importantly, it significantly reduced the time needed to reach equilibrium, decreasing from 27 days at 296 K to 1 day at 323 K and 4 h at 343 K.
In this way, the Arrhenius equation given by Equation (2) was used to plot the data and calculate the activation energy for both elements. The activation energy (the minimum energy required for a chemical reaction to occur) of K-jarosite dissolution was only determined at pH 1 since the experiments were conducted at different temperatures without reprecipitation of ferric ions. The activation energy found was 85.11 and 89.87 kJ/mol, respectively, for Fe3+ and K+. A high activation energy is associated with a strong dependence of the reaction on temperature conditions, according to Levenspiel (1998) [42].
Although the derivative method (DVKM) used in this study has several advantages, such as its ease of use and obtaining direct values to compare the effect of reaction parameters, it does not provide information on the thermodynamics and mass transfer of the systems.

3.3.2. Noyes–Whitney Kinetic Model (NWKM)

The Noyes–Whitney kinetic model (NWKM) was used by Baron and Palmer (1996) [8] to study the dissolution of K-jarosite in their attempt to find a model to describe the dissolution kinetics behavior of K-jarosite under terrestrial conditions. The studied system involved the dissolution of K-jarosite at a pH of 2 in a HCl medium at 298 K. These authors found that the dissolution kinetics could be described by a first-order model in the form of a Noyes–Whitney equation with an apparent rate coefficient of 7.9 ± 0.5 × 10⁻⁷ s−1, which can also be expressed as log r = −6.1.
The reaction orders and rate coefficients were calculated in this work by integrating the rate law described in Equation (4) with respect to the K+ and Fe3+ concentration. The generic integrated rate laws for first- and second-order reactions are presented in Table 4. When experimentally determined data are plotted according to the linear forms of the integrated rate laws, the plot closest to a straight line gives the reaction order and rate coefficient.
Similar to Baron and Palmer (1996) [8], this study reports a better kinetic fit using the first order than the second one. Additionally, the results obtained and listed in Table 5 are compared to those found by Baron and Palmer at room temperature (296 K) and pH 2, showing good agreement.
At 296 K, the rates at pH 1 (0.07 mol/kg of H2SO4) were faster than at pH 2 (0.006 mol/kg of H2SO4), despite the slight difference in the absolute value of the rate, which falls within the experimental standard deviation using NWKM. Furthermore, at pH 1, when the temperature increased, faster dissolution rates were found in accordance with the rates calculated in DVKM. Moreover, when a lower solid-to-liquid ratio was used, the dissolution rates were also slightly faster; however, they were within the experimental error margin, meaning the difference was not significant.
As with the DVKM method, the activation energy was also calculated for the dissolution of K-jarosite at pH 1 using the rates obtained with NWKM and plotting the linearization of the Arrhenius equation. The activation energy values found were 85.08 and 89.88 kJ/mol for Fe3+ and K+, respectively, which are very close to the activation energies found in DVKM.
The NWKM model presents the same advantages (ease of use and worthwhile to compare the influence of conditions) and disadvantages (lack of thermodynamic and material transfer information) as the DVKM method. However, it is noteworthy that the DVKM method more clearly reveals the influence of the conditions, particularly those related to pH, on the rates when compared to the NWKM model.

3.3.3. Shrinking Core Kinetic Model (SCKM)

The DVKM and NWKM models effectively modelized the data, thus providing an understanding of the impacts of variables on K-jarosite dissolution. However, as mentioned, these models did not offer crucial insights into the dissolution reaction mechanisms. Therefore, the Shrinking Core kinetic model was here employed to address these inquiries.
In the literature, the SCKM model for acidic jarosite dissolution has mainly been studied at elevated temperatures (≥323 K) and high sulfuric acid concentrations (≥0.3 mol/L), conditions where the dissolution rate is maximal [25,27,43]. In these cases, the kinetic model is controlled by the chemical reaction occurring at the particle surface.
In this work, the effects of lower temperature and H3O+ concentration were considered in the kinetic analysis of the SCKM model. The temperature and acidity conditions are milder than those commonly employed in hydrometallurgical processes for recovering high-value metals. These experiments are conducted to recreate conditions at pH 1 and 2, where the sulfuric acid concentration does not exceed 0.07 mol/kg, and the temperatures used are room temperature (296 K) as well as elevated temperatures (323 and 343 K), to allow comparison with existing studies.
The use of this model is divided in four parts: (i) identification of the phenomenon governing the reaction; (ii) determination of the progressive time and induction time kinetic constants from the model correlation; (iii) analysis of reaction rate dependence on acidity concentration and temperature, as well as calculation of the reaction orders and activation energies; (iv) establishment of the global equation relating total time and iron conversion.
In Section 3.1, it was observed that dissolution reactions in a low H3O+ concentration acidic environment (0.006 mol/kg H2SO4 ≈ pH 2 at T = 296 K) led to incomplete solid dissolution. Therefore, the steady-state was considered for calculating iron conversion. The residual solid was identified by XRD and SEM as K-jarosite, with no evidence of secondary phase formation. However, similar to the previous DVKM and NWKM models, experiments at pH 2 at 323 and 343 K were not addressed by this model due to iron re-precipitation, preventing reaching equilibrium or complete dissolution.
Figure 9 shows two calculated fraction profiles over time by applying Equation (4) to the studied ions. It can be observed that at pH 2 and room temperature (296 K), the increase in iron concentration, and especially potassium (Figure 9a), follows an irregular curve, indicating non-uniform dissolution behavior over time. This observation could be explained by a progressive conversion model, where there would be no uniform decrease in the particles present in the reactor, as demonstrated by the SEM image (Figure 5). This phenomenon is common in many dissolution reactions in basic environments. However, in the case of reactions occurring at extremely high H3O+ concentration, SCKM is more likely to apply [27].
The increasing conversions of Fe3+ and K+ at pH 1 (Figure 9b) have analogous profiles and exhibit similar dissolution behavior, thus illustrating that, under these conditions, there is little difference between the release of cations from sites A and B. Therefore, any ion conversion value can be used for rate constant calculations.
Other researchers have already noted that under certain conditions, primarily very acidic and depending on substitution ions, rate constants remain unchanged. Elwood Madden et al., 2012 [12] suggested that dissolution rates are controlled by Fe-O bond breaking at site B, rather than bonds at site A and site C. Their results showed that even with significant substitution by H3O+ at site A, the dissolution rate is not significantly altered. Furthermore, Reyes et al., 2017 [22] found the same. Therefore, in this study, dissolution reactions will mainly be monitored and determined based on ferric irons.
In order to identify the phenomenon governing the reaction during the progressive period, the models discussed in Section 2.5.3 were used to evaluate the conversion data (X) plotted over time. The model that best fits the experimental data is the one that controls the reaction.
Table 6 shows the results of applying this model with the step that better controls the reaction and the parameters (k and tind) calculated from it. The results showed that at pH 1, with a sulfuric acid concentration of 0.07 mol/kg and at high temperatures (323 and 343 K), the data corresponded quite well to the chemical reaction regression model with correlation coefficients R2 > 0.99 for both ions, potassium and iron. This means that in most of the dissolution experiments conducted, the chemical reaction presents the greatest resistance compared to phenomena associated with mass transfer, and there is no significant concentration gradient formation in the fluid film or in the ash halo surrounding the particle. In this case, the process is sensitive to temperature changes and independent of hydrodynamics.
At room temperature (296 K), the controlling step was mainly represented by solid-phase mass transfer at pH 2 and liquid-phase mass transfer at pH 1. In other words, diffusion in the fluid layer becomes the controlling step when pH is decreased. The fluid reactant is rapidly consumed at the solid surface, and a concentration gradient forms between the fluid layer and the unreacted core of the grain. This time, the reaction depends less on temperature and is more sensitive to stirring speed.
As shown in Table 6, the experiment at pH 2 and 296 K with a solid–liquid ratio of 1 g of K-jarosite/kg of solution showed that one of the experiments is controlled by mass transfer in the liquid phase and the other by mass transfer in the solid phase. This trend can be explained as an intermediate behavior between the two models and control steps. It may therefore not be reasonable to consider that a single step controls the rate of the overall reaction. A study in the literature showed the possibility of mixed behavior under other conditions. Reyes et al., 2016 [25], using HCl solution medium at pH 2.01 and 323 K, found that the reaction corresponded to the unreacted core model, controlled by diffusion in the solid product halo. However, they did not observe ash formation in the SEM analysis. Therefore, they considered that the assumptions on which the model is based may not fully describe the actual mechanism and that intermediate behavior would be possible.
After defining the control steps, it is possible to determine the parameters related to the kinetic constants for the progressive period and the induction time, displayed in Table 6. The slope of the resulting correlation corresponds to the experimental rate constant, k, for the progressive time. The duration of the induction period is calculated semi-empirically from the intersection of the line from linear regression with the time axis of the progressive conversion. The intersection point represents the duration of the induction period (tind), and the inverse of the induction period represents its rate constant (tind−1) in min−1. The correlation coefficients of the models, based on experimental data used to calculate the values presented in Table 6, are greater than 0.95.
The data obtained from experiments conducted at different temperatures, with constant pH 1, indicate that the duration of the induction time decreases with increasing temperature. There is a notable increase in the k values with temperature rise (Table 6); thus, the reaction rate becomes faster during the progressive conversion step.
Table 7 presents a comparison, under similar conditions, of the results of this study and those available in the literature. The results presented in this work show a slightly smaller k but with the same order of magnitude for the induction time. This may be mainly due to differences in the solid structure that may be influenced by its synthesis.
The entire dataset, Table 7, concerns reactions in sulfuric acid medium. However, previous research has studied other types of acidic dissolution media. Reyes et al., 2016 [25] used HCl for K/Cr jarosite dissolution, while H2SO4 was used for the dissolution of Na-jarosite by Reyes et al., 2017 [22] and Nolasco et al., 2022 [43]. The dissolution rate of K/Cr jarosite with HCl (k = 0.0143 min−1) was one order of magnitude higher than the dissolution rate of Na-jarosite using H2SO4 (0.0034 min−1), indicating that the dissolution rate in HCl medium induces faster dissolution at the same temperature and acid concentration. The differences in iron dissolution or behavior between HCl and H2SO4 solutions may be partly due to stronger complexation of Fe3+ by Cl, compared to SO42−. Also, according to Welch et al., 2008 [11], higher concentrations of sulfate inhibit the dissolution reaction, since sulfate is a reaction product. This corroborates the results obtained in Section 3.3.1 demonstrating that hydrochloric medium leads to faster rates than sulfuric medium.
The k and tind values take into account the acidity influence through the reaction order, as well as the temperature effect through the use of the Arrhenius equation. These data are fundamental for finding the overall equation that relates iron dissolution conversion and the required reaction time.
Therefore, aiming to quantify the influence of acidity on the parameters found in Table 6, firstly, the logarithm of the rate constants for k and tind were plotted against the concentration of hydronium ions (log k vs. log [H3O+] and log tind−1 vs. log [H3O+]) to find the pseudo-order of the reaction. From the experiments conducted at T = 296 K, with constant particle size and stirring rate, the reaction pseudo-order (n) with respect to [H3O+] was determined.
The calculated value of n for the progressive conversion and induction periods for ferric irons was, respectively, 0.25 and −1.12. The value of n for the progressive conversion period was low, indicating that the reaction is not strongly dependent on H3O+ concentration under these conditions. Nolasco et al., 2022 [43] observed the same behavior in the progressive step for [H3O+] ≤ 0.0126 mol/L (pH = 1.03) where n = 0.05. However, for [H3O+] ≥ 0.0126 mol/L (pH = 0.9), they found n = 1.2, indicating a strong dependence of the reaction on pH. This change in order could be related to the concentration gradient created between the surface of jarosite particles and fluid film due to the low concentration of H2SO4 and the high and rapid consumption of H3O+. The rate-controlling step shifts from chemical reaction to mass transfer in the fluid film.
Subsequently, the activation energy was determined by evaluating the dependence of the rate constants of the induction time and progressive step on temperature using the Arrhenius equation. However, in this case, the Arrhenius equation is applied considering that the pH varies with temperature due to the variation in the water ionization constant. This can be accounted for by substituting the ratio k/[H3O+]n for the progressive conversion period (ln k/[H3O+]n vs. 1/T).
Thus, the slope of the line is equal to −Ea/R with Ea = 76.57 and 93.20 kJ/mol for iron and potassium, respectively. The frequency factor (k0), which represents the minimum number of collisions to initiate the chemical reaction, was determined by the intersection of the line with the ln k/[H3O+]n ordinate axis, yielding k0 = 2.11 × 10⁹ for iron and 7.60 × 10¹¹ for potassium. This trend shows that the dissolution of iron is less energy dependent than the dissolution of potassium if the entire dissolution curve is considered.
The activation energy for the induction period was determined by plotting ln(tind−1/[H3O+]n) vs. 1/T. The resulting values, 114.85 kJ/mol for iron and 112.59 kJ/mol for potassium, were higher than those obtained for the progressive conversion step. This means that the induction time requires more energy to occur than the progressive conversion period. This difference could be related to stronger bonds at the particle surface, the difficulty of chemical adsorption and the subsequent establishment of the H3O+ ion reaction front on the active centers at the surface, which are highly stable. During the induction period, many more high-energy particle collisions are needed at the surface to break the bonds and reduce the energy required for the progressive reaction step [44].
In this sense, the induction period is more strongly affected by the increase in temperature, to the point that this kinetic step practically disappears at 343 K [43]. However, both steps depend heavily on temperature. Furthermore, the Arrhenius constant for decomposition in acidic medium was k0 = 1.29 × 10¹⁶ for iron and 1.43 × 10¹⁷ for potassium.
Nevertheless, for the correlation of the Arrhenius equation for the induction time, the R2 values are only acceptable (x > R2 > 0.85), showing a change in the slope of the curves. In fact, according to Levenspiel (1998) [42], this type of arrangement signifies a change in reaction mechanism during the induction period when the temperature changes.
The kinetic models obtained with the calculated kinetic parameters (n, Ea and k0), after considering the combination of individual kinetic steps (induction and progressive conversion periods), correspond to mass transfer in the liquid phase, chemical reaction and mass transfer in the solid phase as the controlling step, respectively:
t H 2 S O 4   =   1 1.29 ×   10 16 e   114.85 R T     [ H 3 O + ] 1.12   + 1 ( 1 X F e ) 2 / 3   2.11 × 10 9 e   76.57 R T [ H 3 O + ] 0.25
t H 2 S O 4 = 1 1.29 × 10 16 e 114.85 R T     [ H 3 O + ] 1.12 + 1 ( 1 X F e ) 1 / 3   2.11 × 10 9 e 76.57 R T [ H 3 O + ] 0.25
t H 2 S O 4 = 1 1.29 × 10 16 e 114.85 R T     [ H 3 O + ] 1.12 + 1 3 × ( 1 X F e ) 2 / 3 + 2 × ( 1 X F e ) 2.11 × 10 9 e 76.57 R T [ H 3 O + ] 0.25  
In Figure 10, the Shrinking Core kinetic model is applied and compared with experimental data: Equation (11) is shown in Figure 10b, Equation (12) in Figure 10c,d and Equation (13) in Figure 10a. The colors of the circles in the figures are used solely to differentiate data points from distinct experiments. Figure 10a,b present results from experiments conducted with 1 g of jarosite per kg of solution, including a replicated experiment, as well as a separate experiment using 0.4 g of jarosite per kg of solution. Similarly, Figure 10c,d include data from additional replicate experiments. The model shows a good fit at room and high temperatures at pH 1, and at room temperature at pH 2, accurately predicting the increasing conversion of ferric irons and dissolution time in sulfuric media of this element under specific pH and temperature conditions.
However, this model demonstrates certain limitations under specific conditions. One limitation is related to the use of H2SO4. Unlike HCl, this acid exhibits weaker behavior due to its second dissociation. Another limitation is that, under the studied conditions, there is a change in the dissolution control step from chemical reaction to mass transfer. Additionally, there is an evidence of more than one controlling stage. There are differences in dissolution rates observed in extreme and intermediate conditions, primarily because under intermediate conditions, mass transfer in the residual solid layer controls the process.

4. Conclusions

K-jarosite was synthesized and characterized, and the dissolution rate of K-jarosite was investigated until reaching steady state in sulfuric acid medium. The results revealed that, for pH 1 and 2 at room temperature (296 K), the initial concentration did not significantly influence K-jarosite dissolution, but rather the pH was the main factor decreasing the time to achieve equilibrium. At pH 2, the dissolution of K-jarosite was non-stoichiometric over a period of 45 days until equilibrium was reached, with selective dissolution of K compared to Fe for the first hours. However, ferric irons ultimately accelerated the increasing kinetic rate within the elapsed time. At pH 1, the dissolution was complete, stoichiometric and faster than at pH 2. These findings have implications for understanding the geochemical behavior of natural environments containing jarosite, such as acid mine drainage (AMD) and acid sulfate soil (ASS), without implying direct intervention in natural systems. In controlled or engineered systems, lowering the pH may be used to prevent the formation of K-jarosite, while maintaining higher pH and ambient temperatures can help to preserve jarosite in its solid form and limit the release of potentially harmful elements.
At room temperature and pH 2, only aqueous products are released during the dissolution. However, at higher temperatures (323 and 343 K), experiments resulted in the reprecipitation of a solid phase which was not identified in this work and did not resorb potassium ions. The reprecipitate is likely responsible for inhibiting subsequent jarosite dissolution. Further investigations are needed to understand the evolution of this precipitation over time at higher temperatures under mild acidic conditions. Another aspect requiring consideration is the potential influence of diverse precipitation methodologies and the resultant crystalline structure of synthesized solids on the dissolution kinetics across a varied range of conditions.
Furthermore, the dissolution rates were calculated using three different models. DVKM and NWKM provided good insight into the effect of variables in an easily representable manner. The results showed that the highest temperature and lowest pH gave the highest rate. The SCKM was better suited to fit data at higher temperatures and pH 1, where the chemical reaction was the controlling stage. At pH 2 or pH 1 and at room temperature, mass transfer dominated, making it more challenging to fit the data since the dissolution behavior changed and more than one controlling stage could be present during the dissolution process.
Future research in this field would benefit from a more detailed investigation of jarosite dissolution under mildly acidic conditions (pH 3–5) at ambient temperatures. These conditions are environmentally relevant but often lead to slow reaction kinetics, making it experimentally challenging. Also, the use of advanced imaging techniques that are capable of monitoring solid-phase transformations in real time are important for elucidating the mechanisms of mineral dissolution under such conditions. These approaches could provide new perspectives into the stability and reactivity of jarosites in both natural environments and industrial processes.
Moreover, trying to integrate thermodynamic and kinetic modeling through Transition State Theory (TST), which is widely used in geochemical simulations, would be of significant value. It can help to bridge the gap between experimental observations and predictive capabilities, consequently supporting better control and optimization of processes where jarosite stability is essential.

Author Contributions

M.D.S.B.: Conceptualization, Methodology, Investigation, Formal analysis, Writing—original draft, Writing—review and editing. M.P.: Investigation, Funding acquisition, Writing—review and editing. P.C.: Conceptualization, Funding acquisition, Writing—review and editing. L.C.: Conceptualization, Investigation, Validation, Funding acquisition, Writing—review and editing, Supervision. All authors have read and agreed to the published version of the manuscript.

Funding

The project leading to this publication has received funding from the Excellence Initiative of Université de Pau et des Pays de l’Adour—I-Site E2S UPPA, a French ‘‘Investissements d’Avenir’’ program and the Institut Carnot “ISIFoR”.

Data Availability Statement

Data will be made available on request.

Conflicts of Interest

The authors declare no conflicts of interest.

References

  1. Eftekhari, N.; Kargar, M.; Zamin, F.; Rastakhiz, N.; Manafi, Z. A review on various aspects of jarosite and its utilization potentials. Ann. Chim. Sci. Matériaux 2020, 44, 43–52. [Google Scholar] [CrossRef]
  2. Alpers, C.N.; Nordstrom, D.K.; Ball, J.W. Solubility of jarosite solid solutions precipitated from acid mine waters, Iron Mountain, California, USA. Sci. Géologiques Bull. 1989, 42, 281–298. [Google Scholar] [CrossRef]
  3. Bowen, B.B.; Benison, K.C. Geochemical characteristics of naturally acid and alkaline saline lakes in southern Western Australia. Appl. Geochem. 2009, 24, 268–284. [Google Scholar] [CrossRef]
  4. Elwood Madden, M.E.; Bodnar, R.J.; Rimstidt, J.D. Jarosite as an indicator of water-limited chemical weathering on Mars. Nature 2004, 431, 821–823. [Google Scholar] [CrossRef]
  5. Klingelhöfer, G.; Morris, R.V.; Bernhardt, B.; Schröder, C.; Rodionov, D.S.; De Souza, P.A.; Yen, A.; Gellert, R.; Evlanov, E.N.; Zubkov, B. Jarosite and hematite at meridiani planum from opportunity’s Mössbauer spectrometer. Science 2004, 306, 1740–1745. [Google Scholar] [CrossRef]
  6. Squyres, S.W.; Arvidson, R.E.; Bollen, D.; Bell, J.F.; Brückner, J.; Cabrol, N.A.; Calvin, W.M.; Carr, M.H.; Christensen, P.R.; Clark, B.C. Overview of the opportunity Mars exploration rover mission to meridiani planum: Eagle crater to purgatory ripple. J. Geophys. Res. Planets 2006, 111, 2006JE002771. [Google Scholar] [CrossRef]
  7. Buriti, M.S.; Cézac, P.; Casás, L. Dissolution and precipitation of jarosite-type compounds: State of the art and future perspectives. Comptes Rendus Chim. 2024, 27, 1–29. [Google Scholar] [CrossRef]
  8. Baron, D.; Palmer, C.D. Solubility of jarosite at 4–35 °C. Geochim. Cosmochim. Acta 1996, 60, 185–195. [Google Scholar] [CrossRef]
  9. Gasharova, B.; Göttlicher, J.; Becker, U. Dissolution at the surface of jarosite: An in situ AFM study. Chem. Geol. 2005, 215, 499–516. [Google Scholar] [CrossRef]
  10. Smith, A.M.L.; Hudson-Edwards, K.A.; Dubbin, W.E.; Wright, K. Dissolution of jarosite [KFe3(SO4)2(OH)6] at pH 2 and 8: Insights from batch experiments and computational modelling. Geochim. Cosmochim. Acta 2006, 70, 608–621. [Google Scholar] [CrossRef]
  11. Welch, S.A.; Kirste, D.; Christy, A.G.; Beavis, F.R.; Beavis, S.G. Jarosite dissolution II—Reaction kinetics, stoichiometry and acid flux. Chem. Geol. 2008, 254, 73–86. [Google Scholar] [CrossRef]
  12. Elwood Madden, M.E.; Madden, A.S.; Rimstidt, J.D.; Zahrai, S.; Kendall, M.R.; Miller, M.A. Jarosite dissolution rates and nanoscale mineralogy. Geochim. Cosmochim. Acta 2012, 91, 306–321. [Google Scholar] [CrossRef]
  13. Pritchett, B.N.; Elwood Madden, M.E.; Madden, A.S. Jarosite dissolution rates and maximum lifetimes in high salinity brines: Implications for Earth and Mars. Earth Planet. Sci. Lett. 2012, 357–358, 327–336. [Google Scholar] [CrossRef]
  14. Zahrai, S.K.; Elwood Madden, M.E.; Madden, A.S.; Rimstidt, J.D. Na-jarosite dissolution rates: The effect of mineral composition on jarosite lifetimes. Icarus 2013, 223, 438–443. [Google Scholar] [CrossRef]
  15. Legett, C.; Pritchett, B.N.; Elwood Madden, A.S.; Phillips-Lander, C.M.; Elwood Madden, M.E. Jarosite dissolution rates in perchlorate brine. Icarus 2018, 301, 189–195. [Google Scholar] [CrossRef]
  16. Kendall, M.R.; Madden, A.S.; Elwood Madden, M.E.; Hu, Q. Effects of arsenic incorporation on jarosite dissolution rates and reaction products. Geochim. Cosmochim. Acta 2013, 112, 192–207. [Google Scholar] [CrossRef]
  17. Steefel, C.; Depaolo, D.; Lichtner, P. Reactive transport modeling: An essential tool and a new research approach for the Earth sciences. Earth Planet. Sci. Lett. 2005, 240, 539–558. [Google Scholar] [CrossRef]
  18. Dixon, E.M.; Elwood Madden, A.S.; Hausrath, E.M.; Elwood Madden, M.E. Assessing hydrodynamic effects on jarosite dissolution rates, reaction products, and preservation on Mars. J. Geophys. Res. Planets 2015, 120, 625–642. [Google Scholar] [CrossRef]
  19. Qian, G.; Fan, R.; Short, M.D.; Schumann, R.C.; Li, J.; Li, Y.; Smart, R.S.C.; Gerson, A.R. Evaluation of the rate of dissolution of secondary sulfate minerals for effective acid and metalliferous drainage mitigation. Chem. Geol. 2019, 504, 14–27. [Google Scholar] [CrossRef]
  20. Trueman, A.M.; McLaughlin, M.J.; Mosley, L.M.; Fitzpatrick, R.W. Composition and dissolution kinetics of jarosite-rich segregations extracted from an acid sulfate soil with sulfuric material. Chem. Geol. 2020, 543, 119606. [Google Scholar] [CrossRef]
  21. Abkhoshk, E.; Jorjani, E.; Al-Harahsheh, M.S.; Rashchi, F.; Naazeri, M. Review of the hydrometallurgical processing of non-sulfide zinc ores. Hydrometallurgy 2014, 149, 153–167. [Google Scholar] [CrossRef]
  22. Reyes, I.A.; Patiño, F.; Flores, M.U.; Pandiyan, T.; Cruz, R.; Gutiérrez, E.J.; Reyes, M.; Flores, V.H. Dissolution rates of jarosite-type compounds in H2SO4 medium: A kinetic analysis and its importance on the recovery of metal values from hydrometallurgical wastes. Hydrometallurgy 2017, 167, 16–29. [Google Scholar] [CrossRef]
  23. Perez-Labra, M.; Romero-Serrano, A.; Salinas-Rodriguez, E.; Avila-Davila, E.O.; Reyes-Perez, M. Synthesis, thermodynamic, and kinetics of rubidium jarosite decomposition in calcium hydroxide solutions. Metall. Mater. Trans. 2012, 43, 773–780. [Google Scholar] [CrossRef]
  24. Méndez, I.J.E.; Flores, D.M.U.; Patiño, D.F.; Reyes, D.M.; Juárez, J.C.; Reyes, D.I.A.; Palacios, D.E.G. Synthesis and nature of the reaction of a solid solution of ammonium-potassium arsenojarosite in NaOH medium. In Proceedings of the EMC 2015–European Metallurgical Conference, Düsseldorf, Germany, 14–17 June 2015. [Google Scholar]
  25. Reyes, I.A.; Mireles, I.; Patiño, F.; Pandiyan, T.; Flores, M.U.; Palacios, E.G.; Gutiérrez, E.J.; Reyes, M. A study on the dissolution rates of K-Cr(VI)-jarosites: Kinetic analysis and implications. Geochem. Trans. 2016, 17, 3. [Google Scholar] [CrossRef] [PubMed]
  26. Ordoñez, S.; Flores, M.U.; Patiño, F.; Reyes, I.A.; Islas, H.; Reyes, M.; Méndez, E.; Palacios, E.G. Kinetic analysis of the decomposition reaction of the mercury jarosite in NaOH medium: Kinetic analysis of the decomposition reaction of the mercury jarosite. Int. J. Chem. Kinet. 2017, 49, 798–809. [Google Scholar] [CrossRef]
  27. Islas, H.; Flores, M.U.; Reyes, I.A.; Juárez, J.C.; Reyes, M.; Teja, A.M.; Palacios, E.G.; Pandiyan, T.; Aguilar-Carrillo, J. Determination of the dissolution rate of hazardous jarosites in different conditions using the shrinking core kinetic model. J. Hazard. Mater. 2020, 386, 121664. [Google Scholar] [CrossRef]
  28. Calla-Choque, D.; Lapidus, G.T. Jarosite dissolution kinetics in the presence of acidic thiourea and oxalate media. Hydrometallurgy 2021, 200, 105565. [Google Scholar] [CrossRef]
  29. Kubisz, J. Studies on synthetic alkali-hydronium jarosite. I. Synthesis of jarosite and natrojarosite. Mineral. Pol. 1970, 1, 47–59. [Google Scholar]
  30. Härtig, C.; Brand, P.; Bohmhammel, K. Fe-Al-Isomorphism and Structural Water in Crystals of Jarosite-Alunite-Type. Z. Anorg. Allg. Chem. 1984, 508, 159–164. [Google Scholar] [CrossRef]
  31. Ripmeester, J.A.; Ratcliffe, C.A.; Dutrizac, J.E.; Jambor, J.L. Hydronium in the alunite-jarosite group. Can. Mineral. 1986, 24, 773–784. [Google Scholar]
  32. Driscoll, R.; Leinze, R. Methods for Synthesis of Some Jarosites; Techniques and Methods 05-D1; USGS: Reston, VA, USA, 2005.
  33. Brunauer, S.; Emmett, P.H.; Teller, E. Adsorption of gases in multimolecular layers. J. Am. Chem. Soc. 1938, 60, 309–319. [Google Scholar] [CrossRef]
  34. Königsberger, E. Editorial: Guidelines for the measurement of solid–liquid solubility data at atmospheric pressure. J. Chem. Eng. Data 2019, 64, 381–385. [Google Scholar] [CrossRef]
  35. Buriti, M.S.; Poulain, M.; Cézac, P.; Casás, L. K-jarosite precipitation kinetics at low-moderate temperatures: Factors affecting mechanism, formation rates, solid morphology and crystallinity. Hydrometallurgy 2025, 235, 106474. [Google Scholar] [CrossRef]
  36. Noyes, A.A.; Whitney, W.R. The rate of solution of solid substances in their own solutions. J. Am. Chem. Soc. 1897, 19, 930–934. [Google Scholar] [CrossRef]
  37. Torrado, G.; Fraile, S.; Torrado, S.; Torrado, S. Process-induced crystallite size and dissolution changes elucidated by a variety of analytical methods. Int. J. Pharm. 1998, 166, 55–63. [Google Scholar] [CrossRef]
  38. Wolff-Boenisch, D.; Gislason, S.R.; Oelkers, E.H. The effect of crystallinity on dissolution rates and CO2 consumption capacity of silicates. Geochim. Cosmochim. Acta 2006, 70, 858–870. [Google Scholar] [CrossRef]
  39. Stumm, W.; Morgan, J.J. Aquatic Chemistry: Chemical Equilibria and Rates in Natural Waters, 3rd ed.; John Wiley & Sons, Inc.: New York, NY, USA, 1996. [Google Scholar]
  40. Casas, J.M.; Paipa, C.; Godoy, I.; Vargas, T. Solubility of sodium-jarosite and solution speciation in the system Fe(III)–Na–H2SO4–H2O at 70 °C. J. Geochem. Explor. 2007, 92, 111–119. [Google Scholar] [CrossRef]
  41. Sapieszko, R.S.; Patel, R.C.; Matijevic, E. Ferric hydrous oxide sols. 2. Thermodynamics of aqueous hydroxo and sulfato ferric complexes. J. Phys. Chem. 1977, 81, 1061–1068. [Google Scholar] [CrossRef]
  42. Levenspiel, O. Chemical Reaction Engineering, 3rd ed.; John Wiley & Sons, Inc.: New York, NY, USA, 1998. [Google Scholar]
  43. Nolasco, M.C.; Flores, L.F.; Gutiérrez, E.J.; Aguilar, J.; Palacios, E.G.; Flores, M.U.; Rodríguez, I.; Reyes, I.A. Acid dissolution of jarosite-type compounds: Effect of the incorporation of divalent cations into the structure on the reaction rate. Hydrometallurgy 2022, 212, 105907. [Google Scholar] [CrossRef]
  44. Hammes, G. Principles of Chemical Kinetics, 1st ed.; Academic Press: London, UK, 2012. [Google Scholar]
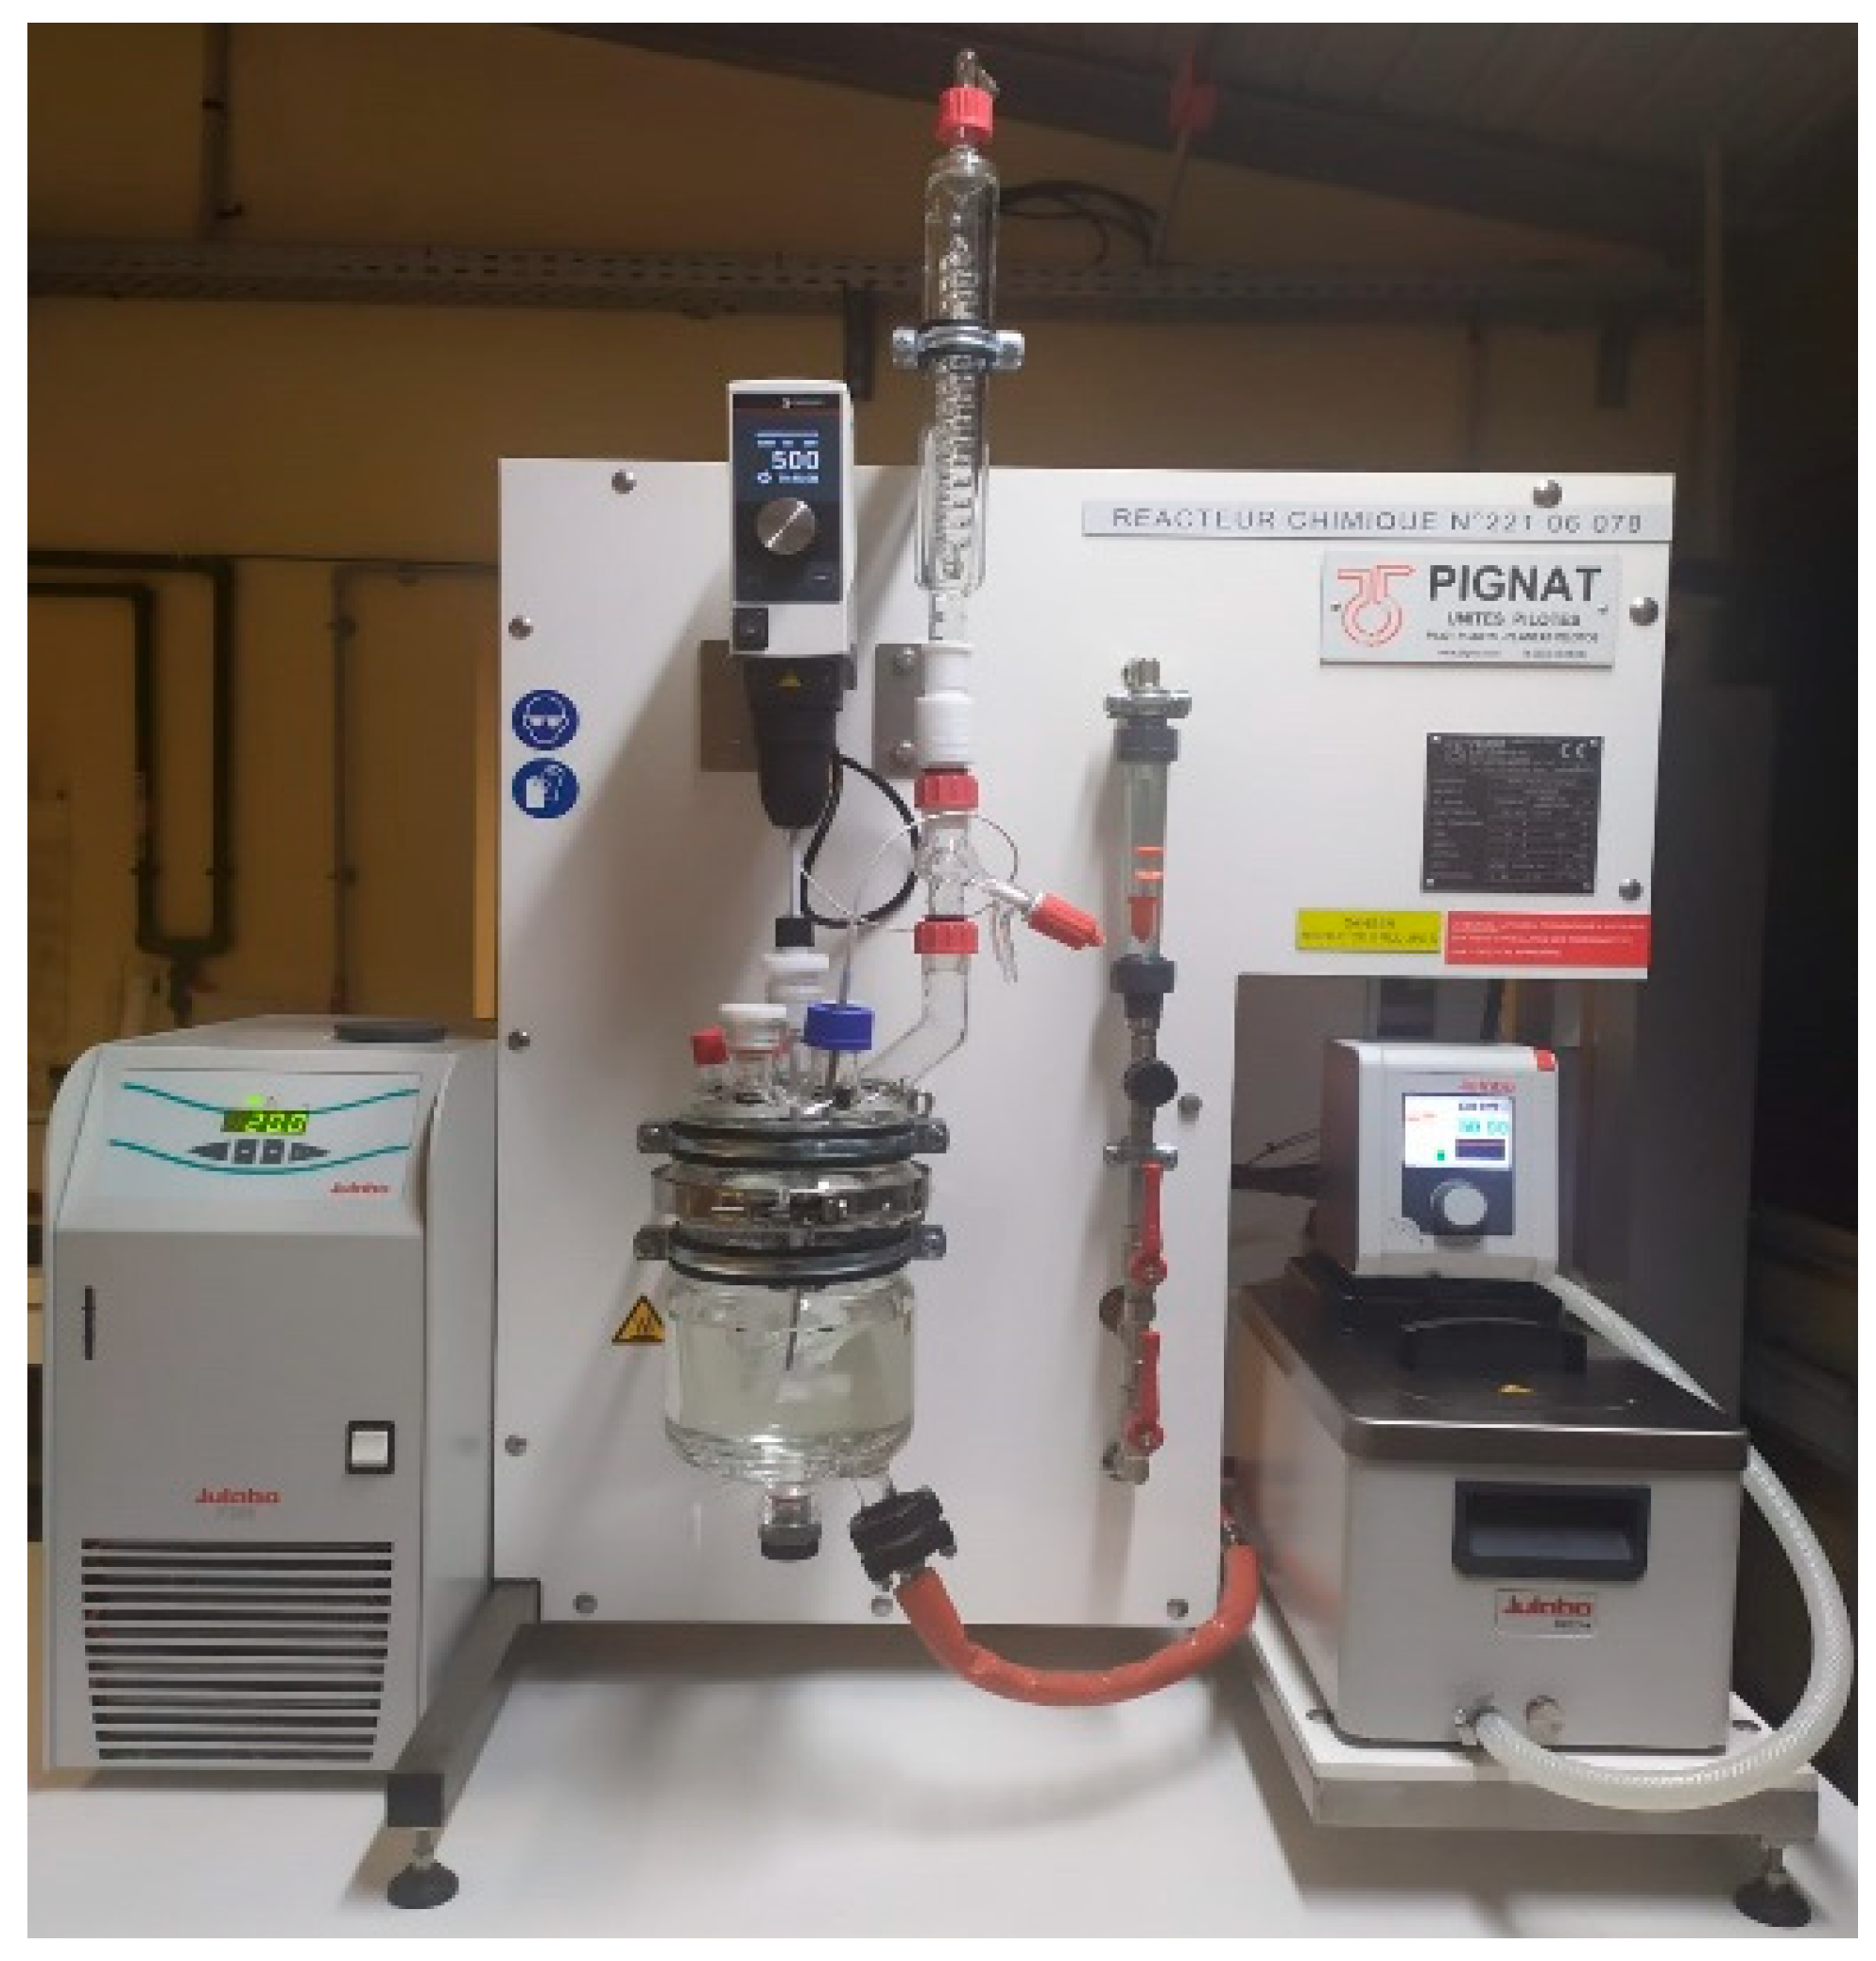
Figure 1. Experimental apparatus.
Minerals 15 00965 g001
Figure 2. SEM image showing particles of the synthetized jarosite. (a) Magnification of 1 mm. (b) Magnification of 5 µm.
Minerals 15 00965 g002
Figure 3. X-ray diffraction pattern of the synthesized jarosite (k represents K-jarosite peaks).
Minerals 15 00965 g003
Figure 4. Dissolution with initial pH 2 solution (H2SO4 = 0.006 mol/kg) at room temperature (296 K): (a) Concentrations of K+ (empty circles) and Fe3+ (full circles) during experiment with an initial solid-to-solution ratio of 1 g K-jarosite per kg of solution. (b) Time-course evolution of element molar ratio (Fe/K).
Minerals 15 00965 g004
Figure 5. SEM image after 45 days dissolution at pH 2 using sulfuric acid.
Minerals 15 00965 g005
Figure 6. Dissolution with initial pH 1 solution (H2SO4 = 0.07 mol/kg) at room temperature (296 K): (a) Concentrations of K+ (empty circles) and Fe3+ (full circles) during experiment. (b) Time-course evolution of element molar ratio (Fe/K).
Minerals 15 00965 g006
Figure 7. (a,c) Concentrations of K+ (empty circles) and Fe3+ (full circles) over time in the dissolution experiment [initial pH 2.00 solution (H2SO4 = 0.006 mol/kg)] at 323 K and 343 K. (b,d) Time-course evolution of element molar ratios (Fe/K) during dissolution at 323 and 343 K, respectively.
Minerals 15 00965 g007aMinerals 15 00965 g007bMinerals 15 00965 g007c
Figure 8. XRD patterns of solids after dissolution at 323 and 343 K (k represents K-jarosite peaks).
Minerals 15 00965 g008
Figure 9. Conversion curves for K+ (empty circles) and Fe3+ (full circles) during experiments at room temperature (296 K): (a) pH 2 and (b) pH 1.
Minerals 15 00965 g009
Figure 10. Comparison of SCKM prediction (line) and experimental data (circles, each color shows a different experiment): (a) 296 K and pH 2, (b) 296 K and pH 1, (c) 323 K and pH 1 and (d) 343 K and pH 1.
Minerals 15 00965 g010aMinerals 15 00965 g010b
Table 1. Chemical formula determined using the formula provided by Kubisz [29].
SampleFormula of Bulk Solid Based on SO4 = 2Ratio Fe/K
K-Jarosite (H3O)0.17K0.83Fe2.54(SO4)2(OH)4.62(H2O)1.38 3.06
Table 2. K-jarosite dissolution rates using DVKM (the literature and our results).
Initial Solution pHT (K)C0 (g K-Jarosite/kg Solution)Solution MediumTime Durationlog r—K (mol/m2·s)log r—Fe (mol/m2·s)Source
2.00250.2 aHCl40 days−8.51 (0.03)N. D.Baron and Palmer (1996) [8]
2.00250.2 aHCl85 days−8.80N. D.Smith et al., 2006 [10]
2.00231.0 aH2SO42 h−8.55 (0.06)N. D.Elwood Madden et al., 2012 [12]
2.00231.0 aH2SO42 h−8.42 (0.03)N. D.Kendall et al., 2013 [16]
1.97231.0 aH2SO416 days−11.18−11.19Dixon et al., 2015 [18]
2.00231.0H2SO445 days−10.26 (0.01)−9.95 (0.01)This study
2.00230.4H2SO440 days−9.89−9.54This study
0.90231.0 aH2SO42 h−7.18 (0.06)N. D.Elwood Madden et al., 2012 [12]
1.00231.0H2SO427 days−9.39−8.83This study
1.00230.4H2SO421 days−9.23−8.66This study
1.00500.4H2SO41 day−7.90 (0.03)−7.37 (0.03)This study
1.00700.4H2SO44 h−7.06 (0.01)−6.62 (0.01)This study
N. D. implies no data available. Values in brackets are the standard deviation error among replicate experiments. a Values are given in g/L.
Table 3. Dependency of rate constant parameters on acid concentration and solid–liquid ratio at 296 K.
Solid/Liquid
Ratio
IntersectionOrder (n)
K+Fe3+K+Fe3+
0.4−8.44−7.620.710.95
1−8.34−7.500.951.21
Table 4. Generic parameters for determining Noyes–Whitney kinetic rate laws with the method of integrated rates.
1st Order Dissolution2nd Order Dissolution
Integrated rate equationln [Ceq − C] = −k + ln [Ceq][1/[Ceq − C]] = k + [1/[Ceq]]
Linear data fitln [Ceq − C] versus time1/[Ceq − C] versus time
Slope of linear fitkk
Table 5. K-jarosite dissolution rates using NWKM (the literature and our results).
SourceParametersNWKM log (k)
pHT (K)Agitation (rpm)do (µm)Co (g K-Jarosite/kg Solution)FeK
Baron and Palmer (1996) [8]2.02985010–1500.2N. D.−6.01
This study2.0296600<1001.0−5.96 ± 0.10−6.06 ± 0.16
This study2.0296600<1001.0
This study1.0296600<1001.0−5.91−5.93
This study2.0296600<1000.4−5.88−6.13
This study1.0296600<1000.4−5.86−5.90
This study1.0323600<1000.4−4.42 ± 0.01−4.44 ± 0.00
This study1.0323600<1000.4
This study1.0343600<1000.4−3.84 ± 0.01−3.78 ± 0.08
This study1.0343600<1000.4
Table 6. Parameters values calculated from SCKM.
Experimental ConditionsControlling Mechanism ak (min−1)tind (min)
pHTC0 (g K-Jarosite/kg Solution)Fe
22961.0MT SP/LP2.04 × 10−51564.99
0.4MT SP2.03 × 10−536.75
11.0MT LP2.53 × 10−554.94
0.4MT LP3.43 × 10−5404.19
323CR4.42 × 10−436.60
CR
343CR2.46 × 10−30.63
CR
a MT SP—mass transfer in solid phase; MT LP—mass transfer in liquid phase; CR—chemical reaction.
Table 7. The literature and our results of Fe release rates by SCKM.
H2SO4 mol/LpHT/K[H3O+]ktindSourceJarosite-Type
0.070.913230.1230.0011478.0Reyes et al., 2017 [22](K·NH4·Na)-As-Jarosites
0.07 a1.003230.0790.0004436.6This studyK-Jarosite
0.070.903230.1260.0013040.5Nolasco et al., 2022 [43]Na/Cu-J
0.071.023030.0950.00013408.0Reyes et al., 2017 [22](K·NH4·Na)-As-Jarosites
0.07 a1.002960.0790.00003404.2This studyK-Jarosite
0.011.903230.0130.00008638.0Reyes et al., 2017 [22](K·NH4·Na)-As-Jarosites
0.011.293230.0510.00130111.0Nolasco et al., 2022 [43]Na/Cu-J
0.006 a2.002960.0090.0000236.75This studyK-Jarosite
a mol/kg.
Disclaimer/Publisher’s Note: The statements, opinions and data contained in all publications are solely those of the individual author(s) and contributor(s) and not of MDPI and/or the editor(s). MDPI and/or the editor(s) disclaim responsibility for any injury to people or property resulting from any ideas, methods, instructions or products referred to in the content.