Abstract
Beyond its renowned gemological value, diamond serves as a vital economic mineral and a unique messenger from Earth’s deep interior, preserving invaluable geological information. Since the Mengyin region is the source of China’s greatest diamond deposits, research on the diamonds there not only adds to our understanding of their origins but also offers an essential glimpse into the development of the North China Craton’s mantle lithosphere. In this article, 50 diamond samples from Mengyin were investigated using gemological microscopy, Fourier-transform infrared (FTIR) spectroscopy, Raman spectroscopy, DiamondView™, and X-ray micro-computed tomography (CT) scanning technologies. The types of Mengyin diamonds are mainly Type IaAB, Type IaB, and Type IIa, and the impurity elements are N and H. Inclusions in diamonds serve as direct indicators of mantle-derived components, providing crucial constraints on the pressure–temperature (P–T) conditions during their crystallization. Mengyin diamonds have both eclogite-type and peridotite-type inclusions. It formed at depths ranging from 147 to 176 km, which corresponds to source pressures of approximately 4.45–5.35 GPa, as determined by the Raman shifts of olivine inclusions. The discovery of coesite provides key mineralogical evidence for subduction of an ancient oceanic plate in the source region. The surface morphology of diamonds varies when they are reabsorbed by melts from the mantle, reflecting distinctive features that record subsequent geological events. Distinctive surface features observed on Mengyin diamonds include fusion pits, tile-like etch patterns, and growth steps. Specifically, regular flat-bottomed negative trigons are mainly formed during diamond resorption in kimberlite melts with a low CO2 (XCO2 < ~0.5) and high H2O content. The samples exhibit varying fluorescence under DiamondView™, displaying blue, green, and a combination of blue and green colors. This diversity indicates that the diamonds have undergone a complex process of non-uniform growth. The nitrogen content of the melt composition also varies significantly throughout the different growth stages. The N3 center is responsible for the blue fluorescence, suggesting that it originated in a long-term, hot, high-nitrogen craton, and the varied ring band structure reveals localized, episodic environmental variations. Radiation and medium-temperature annealing produce H3 centers, which depict stagnation throughout the ascent of kimberlite magma and are responsible for the green fluorescence.
1. Introduction
As the hardest natural mineral in the world, diamonds not only have distinct physical and chemical features but also high economic worth and can be used in industrial production and jewelry manufacturing. Diamonds grow in the Earth’s mantle between 150 and 200 km below the surface, under conditions of approximately 1150–1400 °C and 4.5–6.0 GPa [1]. After that, kimberlite or lamproite magmas carry them to the surface. Kimberlite magma (a volatile-rich ultramafic magma) ascends rapidly, minimizing contamination by the continental crust [2]. As deep-derived xenocrysts trapped by magmas, diamonds provide direct insights into deep Earth processes, serving as invaluable probes into mantle evolution and composition [3,4].
The majority of diamonds (>90%) transported to the surface originate from the mantle lithosphere, with the remainder derived from the sublithospheric mantle. Lithospheric diamonds formed during the Precambrian through the reduction of carbonate-rich melts or oxidation of methane-rich melts [5]. Diamonds crystallize deep within the cratonic mantle lithosphere. As a result, they may be subjected to metasomatic modification by diverse contemporaneous carbon-rich, mantle-derived melts/fluids, which can degrade the diamond quality and reduce the diamond potential of the mantle lithosphere [6]. Evidence of these metasomatic melt/fluid interactions is preserved as melt-related regrowth structures within diamonds, providing insights into the processes modifying and perhaps destabilizing the cratonic lithosphere. Additionally, the mantle itself has the ability to dissolve diamonds through metasomatic processes [7]. This dissolution process likely operates over longer timescales than the ascent of kimberlite melts, potentially initiating during the formation and evolution of the kimberlite melts themselves [8]. DiamondView™ imaging shows the reabsorption and recrystallization processes, as well as the internal growth structure of diamonds formed from lithospheres with concentric ring bands. These features are consistent with formation via precipitation from a carbon-saturated melt rather than the solid-state transformation of graphite [9].
A diamond’s surface structure records valuable information about processes such as crystal growth, plastic deformation, mantle resorption, and kimberlite ascent history [7]. Additionally, the morphology of eclogite-hosted diamonds is thoroughly characterized by X-ray computed tomography scanning, which illuminates the processes of diamond formation and resorption in the mantle lithosphere before they are transported by kimberlite magmas [10]. The N content and aggregation state constitute the basis for the classification of diamonds. Diamonds containing detectable N are designated Type I, whereas those lacking measurable N are classified as Type II, based on relevant absorption peaks in the infrared spectrum [11]. During diamond formation, mantle melts participate in complex dynamic exchanges of nitrogen and carbon [12]. Furthermore, diamonds exhibiting low N concentrations and high aggregation states form within the mantle at high temperatures, inferred to occur predominantly in the sublithospheric mantle [13].
Mineral inclusions in diamonds are direct tracers of ancient cratonic root lithologies [14]. The systematic analysis of these inclusions provides the identification of diamonds’ crystallization ages, the reconstruction of the pressure–temperature conditions during formation, and the understanding of their development settings [5,15,16,17]. For ultradeep diamonds, the paragenetic assemblage of olivine, ferropericlase, and enstatite allows for the calculation of formation pressures of ~9.1–9.6 GPa, corresponding to depths of ~290–300 km [18]. In addition, investigations of fluid and silicate inclusions in diamonds suggest that mantle metasomatism is a continuous process, evolving from differentiated silicate/carbonate melts to C-H-O fluids [19,20,21].
The Mengyin deposit is one of China’s major primary diamond sources. Nitrogen aggregation in these diamonds indicates three distinct formations at ~0.6–0.9 Ga, ~1.1–1.3 Ga, and ~1.7–1.8 Ga [22], temporally coinciding with three major extensional tectonic events in the North China Craton. Previous studies on Mengyin diamonds mainly focused on diamond crystallization ages [23,24,25], pressure–temperature conditions of their formation [26,27], internal growth structures [28,29,30], and emplacement mechanisms of diamond-bearing kimberlites [31,32,33,34]. Few works have combined diamonds’ internal and external textures to explore the process of diamond ascent. This study employs an integrated analytical approach to investigate Mengyin kimberlite diamonds through Fourier-transform infrared (FTIR) spectroscopy (Bruker, Karlsruhe, Germany), Raman spectroscopy (HORIBA, Kyoto, Japan), DiamondView™ (De Beers, London, UK), and X-ray micro-computed tomography (CT) scanning technologies (Sanying Precision Instrument Co., Ltd., Tianjin, China). FTIR spectroscopy quantify nitrogen defect concentrations and aggregation states, while Raman spectroscopy and CT scanning characterize inclusion mineralogy and spatial distribution. These datasets constrain the depths and pressure–temperature conditions at which diamonds formed. Furthermore, surface micromorphology analysis and DiamondView™ imaging reveal growth structures and ascent histories. The comprehensive research has set a foundation for the mineralization model of diamonds in Mengyin.
2. Regional Geological Setting
The southeastern margin of the North China Craton (NCC) is a significant region of strategic mineral resources such as gold, diamonds, sapphires, and rare-earth mineral deposits in China [35,36,37,38]. The Mengyin area is located in the Luxi Terrane in the southeastern part of the NCC (Figure 1a), where all discovered primary diamond deposits are distributed to the Luzhong Uplift of the Luxi Terrane [39]. Lying 60–70 km east of the Tan-Lu Fault Zone, the region is dominated by the NW-trending Jinxingtou, Caizhuang, Yizhuang, and Mengshan Faults, with a secondary NE-trending Shangwujing Fault. Three kimberlite belts—Changmazhuang, Xiyu, and Poli—situated in Mengyin (Figure 1b), display an echelon pattern with subparallel strikes and equidistant spacing along a N–S alignment. A pronounced south-to-north decline in mineralization intensity is documented across the kimberlite belts. The Changmazhuang Belt exhibits high-grade mineralization, contrasting with the medium- to low-grade mineralization in the Xiyu Belt and negligible mineralization in the Poli Belt [29]. Correspondingly, both the proportion of diamondiferous kimberlite and economically ore grades decrease progressively northward [40,41,42,43].
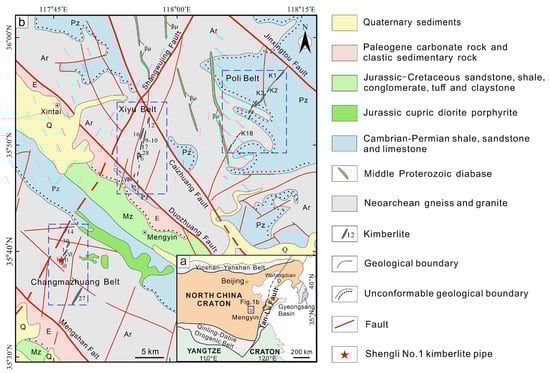
Figure 1.
(a) The location of Mengyin on the southeastern margin of the North China Craton. (b) Geological map of the Mengyin area [29].
The Changmazhuang kimberlite Belt is situated 13 km SW of Mengyin County, which contains eight kimberlite dykes and two pipes (Figure 3b) [44,45], extending ~14 km along a NW–SE trend (345°) with a width of ~2.5 km. Kimberlite dykes exhibit an echelon distribution, striking 15–35° and oriented 30–50° obliquely to the main belt. From north to south, the principal dykes include Buwa, Hongqi-XIV, Hongqi-XXX, Hongqi-I, Shengli-VI, Shengli-II, Shengli-III, and Hongqi-XVVII (Figure 2) [29]. Individual kimberlite dykes within the Changmazhuang Belt comprise multiple pinnate-arranged veinlets, extending from several hundred meters to one point five kilometers in length. These dykes predominantly strike 20–30°, with steep dips generally oriented southwestward or northwestward. Laterally separated at 1–2-km intervals, they display a progressively discontinuous distribution southward [42].
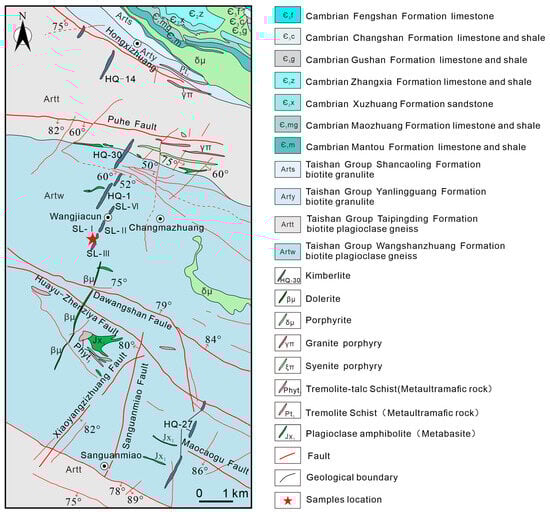
Figure 2.
Geological map of the Changmazhuang Belt in Mengyin on the southeastern margin of the North China Craton [29].
The Shengli-I kimberlite pipe within the Changmazhuang Belt crops out as a near-elliptical, funnel-shaped blow pipe (Figure 3a)—a classic volcanic vent formed by explosive magmatism. The Shengli-II kimberlite dyke flanks the northern and southern margins of the pipe and consists predominantly of macrocrystic kimberlite with elevated diamond potential (Figure 3b). The Changmazhuang kimberlite Belt mainly consists of macrocrystic garnet-bearing kimberlite, kimberlitic breccia, and fine-grained kimberlite. The Porphyritic kimberlite (Figure 3c) exhibits a dark gray color with embedded dark green macrocrysts (5–10 mm) displaying elliptical to subrounded morphologies. Petrographic analysis confirms these macrocrysts represent serpentinized peridotite xenoliths. Figure 3d shows porphyritic kimberlite containing pyrope. The kimberlite is light gray, with dark green phenocrysts that vary in size, ranging from about 3 to 10 mm. The region within the white circle is the pyrope, which is dark reddish-brown. Its shape is mostly round or oval, and the size of the pyrope is about 5 mm. A diamond in Mengyin kimberlite (Figure 3e) is 0.2–0.3 mm in particle size, pale yellow in hue, and exhibits a combination form of octahedron {111} and cube {100} habits. In Figure 3f, the particle size of a diamond is approximately 0.8–1.0 mm, with a light brown color and an octahedral crystal form.
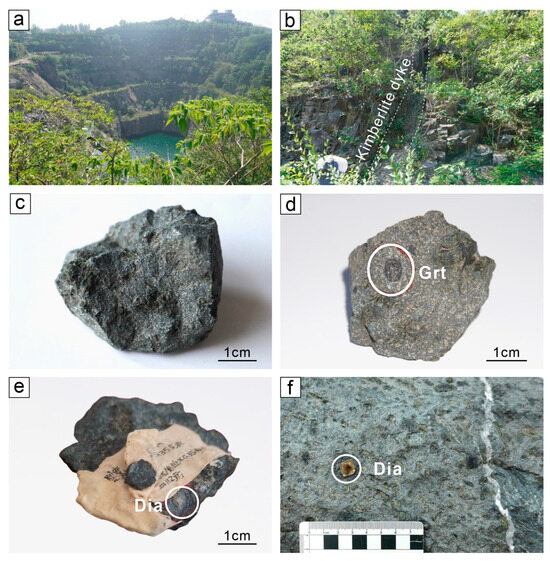
Figure 3.
(a) The Shengli I kimberlite pipe. (b) The Shengli II kimberlite dyke. (c) Porphyritic kimberlite. (d) Pyrope-bearing porphyritic kimberlite. (e) A diamond grain in the Mengyin kimberlite belonging to the 7th Institute of Geology & Mineralization of Shandong Provincial Bureau of Geology & Mineral Resources. (f) An Octahedral diamond grain from Huaxia Kimberley (Mengyin, Shandong) Mining Co., Ltd. Photo taken on a background of Mengyin kimberlite. Grt—garnet and Dia—diamond.
3. Materials and Methods
Fifty diamond samples were collected in this research, all of which were produced in the Shengli I kimberlite pipe of Changmazhuang, Mengyin area, in the southeastern margin of the North China Craton. Most diamond samples were colorless, with grain sizes around 3–6 mm, and others showed softer hues of brown and yellow.
Conventional gemological tests were carried out at the Gem Research Laboratory of the School of Gemmology, China University of Geosciences (Beijing), including 10× magnification observation, color grading, and specific gravity testing.
FTIR spectroscopy test was conducted using the Tensor27 Fourier-Transform infrared spectrometer produced by Bruker (Karlscruhe, Germany). The experimental location was the Gem Research Laboratory of the School of Gemmology, China University of Geosciences (Beijing). The power voltage is 85–265 V, the frequency is 47–65 Hz, the test temperature is 26 °C, and the humidity is less than 70%. The scanning time is 8 scans, the resolution is 1 cm−1, the grating is set to 6 mm, and the scanning times are 50–100. The test mode is the transmission method, and the range is 500–4000 cm−1.
The instrument used for the laser Raman spectroscopy is the HR-Evolution-type laser confocal microscopic Raman spectrometer produced by HORIBA Corporation of Kyoto, Japan. The experimental site was the Gem Research Laboratory of the School of Gemmology, China University of Geosciences (Beijing). The test range is 200–2000 cm−1, and the excitation light source is an Ar+ laser with a wavelength of 532 nm and a 50× eyepiece. The beam spot is 1 μm, the resolution is 2.5 cm−1, and the counting time for full-wave peak capture is 3 s. Calibration is carried out using monocrystalline silicon, with an error of ±0.5 cm−1.
The DiamondViewTM experiment was conducted at the Gem Research Laboratory of the School of Gemmology, China University of Geosciences (Beijing), and the instrument model was IIDGR DiamondView produced by De Beers (London, UK).
The X-ray micro-CT scanning experiment was conducted at Sanying Precision Instrument Co., Ltd. in Tianjin, China. The test was carried out using the NanoVOXEL-2000 CT imaging system with a voltage of 80.0 kV and a current of 120.0 μA. CT data were 3D modeled using VGStudioMAX 3.3 software.
4. Results
4.1. Conventional Gemological Features
The surface micro-morphology and internal characteristics of 50 samples were examined under 10× magnification and gemological microscopy. The diamond crystals exhibited a variety of micromorphologies, including triangular plate-like, octahedral, rhombic dodecahedral, and irregular shapes. Since the samples are not finished diamonds, we can only approximate the color description according to GIA standards and cannot accurately grade them. Among the 50 rough diamond samples analyzed, 34 are near-colorless (H–J grades), 3 exhibit faint coloration (L–M grades), 5 show very light tones (N–P grades), and 8 display light hues (S–V grades). Distinct features observed by gemological microscopy on the surfaces of these samples contained growth steps (Figure 4a), growth streaks (Figure 4b), shingled etching patterns (Figure 4c,d), triangular pits (Figure 4e,f), and erosion grooves. Notably, the samples with triangular plate-like crystal formations displayed the most pronounced erosion patterns. The development of layered structures in the diamonds is evident from the growth steps present on their surfaces. Figure 4a provides compelling evidence of the layered growth of diamonds, showing prominent triangular steps on the surface that align with the crystal orientation and symmetry characteristic of this specific crystal plane. This growth step is flatter and sharper, in contrast to the trisoctahedroid surfaces, which display curved corrosion morphologies. The specific gravity of the diamond was 3.511–3.525, tested by the hydrostatic weighing method. These values cannot reliably distinguish between different diamond types. All diamonds examined exhibit no electrical conductivity.
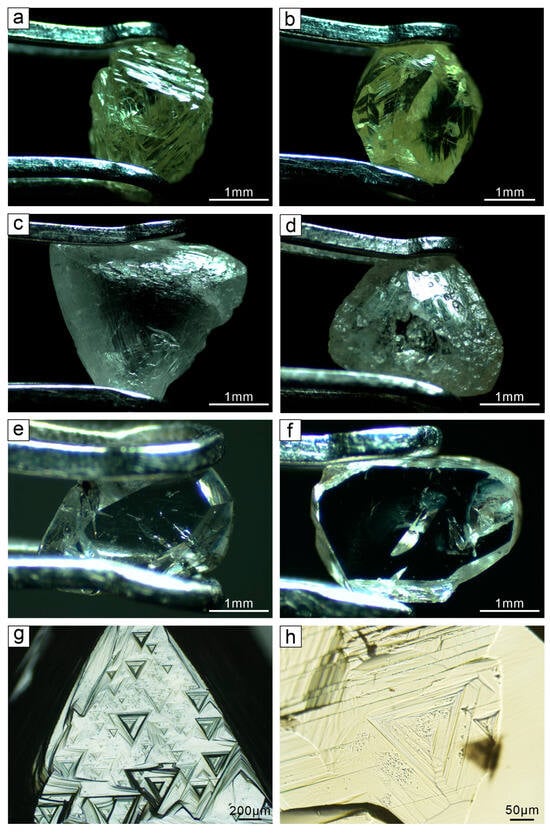
Figure 4.
(a,b) Growth steps on the surface of Mengyin diamond. (c) Tile-like erosion. (d) Disc-shaped erosion. (e,f) Pinnate and long strip-shaped cracks. (g,h) Negative trigons.
While some diamonds exhibit fewer internal cracks and relatively clean interiors with few visible imperfections, the majority of Mengyin diamonds have well-developed internal fissures. Most diamonds grade in the I1–I2 clarity range, with a minority classified as SI1–SI2. Fractures in diamonds can be classified as either pinnate (Figure 3f) or long strip-shaped (Figure 3e) based on the various forms of the internal cracks. The majority of the samples’ fractures produce open cracks that reach the crystal’s surface. The filling of secondary inclusions is made possible by the presence of open cracks. Based on their hue, the inclusions in the cracks may be divided into two categories: reddish-brown inclusions (Figure 5e,f) and grayish-black inclusions (Figure 5a,d).
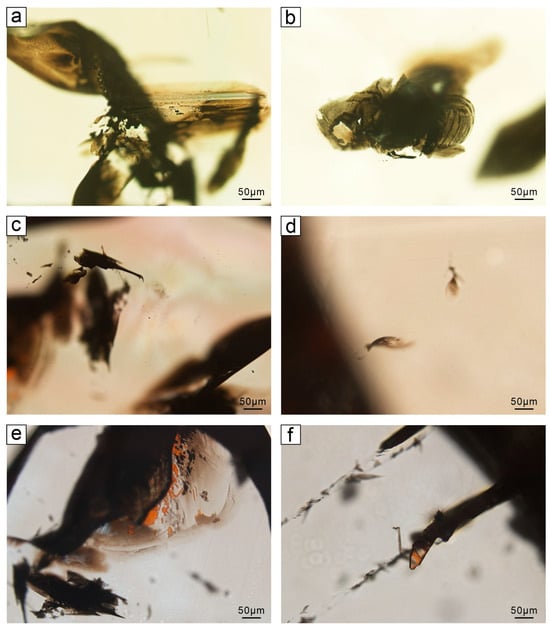
Figure 5.
(a,b) Plate-like grayish-black graphite inclusions in diamonds. (c,d) Other forms of grayish-black graphite inclusions. (e,f) Red-brown hematite inclusions.
The diamond samples in this study contained an immense volume of grayish-black graphite inclusions. Within these diamonds, a few sheets of graphite inclusions were observed (Figure 5a). The main section predominantly features dark dots and lines with the color transitioning from a grayish black at the center to lighter brown at the perimeter. This alteration suggests that the diamond experiences graphitization along the fissures due to variations in temperature and pressure after its formation. The central region is the initial site of the graphitization process, and the deeper coloration in this area indicates a relatively high degree of graphitization [46].
In addition to sheet-like graphite inclusions, clump-like graphite inclusions can also be discovered (Figure 5b). Graphite inclusions that resemble clumps are often rather uniform in color, with obvious borders and a deeper grayish-black appearance. Consequently, clump-like graphite inclusions often exhibit a higher degree of graphitization than sheet-like graphite inclusions. Furthermore, the graphite inclusions that occur along the fractures also exist in a variety of shapes due to the varied morphology of internal fractures (Figure 5c,d). With no discernible form, the reddish-brown inclusions inside the diamond mostly filling in the cracks (Figure 5e,f) are metal oxides, such as hematite, leaking into the crevices after the formation of the diamond.
4.2. Spectroscopy
4.2.1. FTIR Spectra
Due to the size of the samples and the smoothness of their surfaces, only 18 samples were subjected to FTIR spectroscopy testing. The tests showed that 11 of the 18 samples were Type IaAB diamonds, 4 were Type IaB diamonds, and 3 were Type IIa diamonds. The IaAB samples displayed the diamonds’ inherent peaks at 1975 cm−1, 2030 cm−1, 2160 cm−1, and 2350 cm−1 (Figure 6a). Furthermore, diatomic nitrogen, aggregate nitrogen, nitrogen wafers, and the {111} slip plane are the causes of the distinctive absorption peaks at 1282 cm−1, 1175 cm−1, 1365 cm−1, and 1010 cm−1 [47].
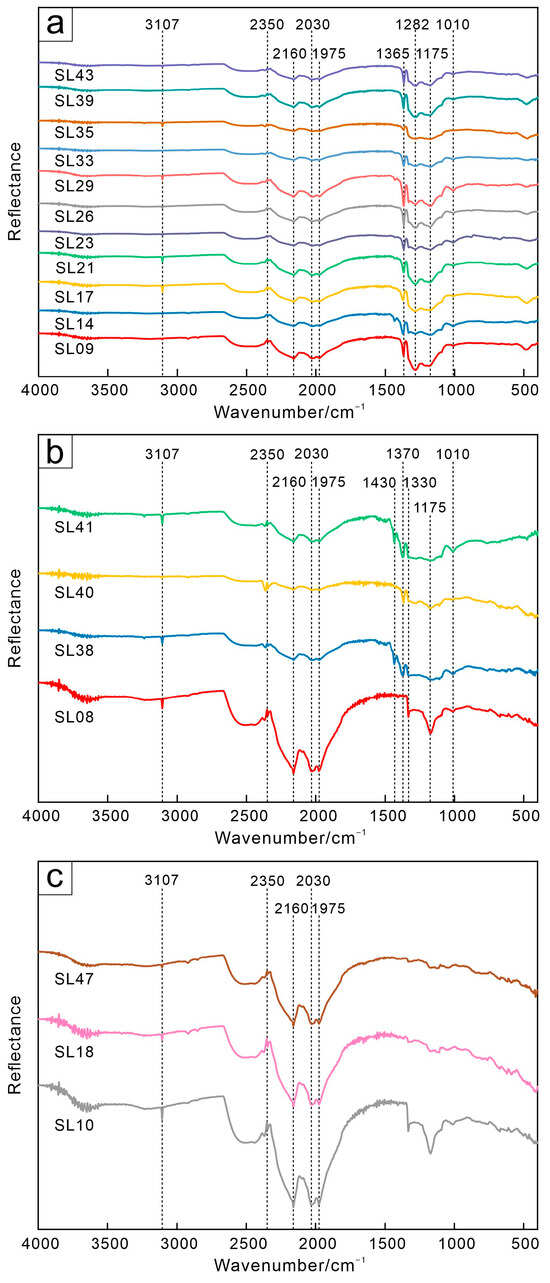
Figure 6.
Infrared reflectance spectra of (a) Type IaAB diamond; (b) Type IaB diamond; (c) Type IIa diamond.
Four samples are Type IaB diamonds, which do not have the distinctive absorption peak of 1282 cm−1 that diatomic nitrogen causes. In addition to the distinctive absorption peaks of 1370 cm−1 and 1175 cm−1 brought on by nitrogen wafers, diamond intrinsic peaks of 1975 cm−1, 2030 cm−1, 2160 cm−1, and 2350 cm−1 were detected (Figure 6b). Additionally, samples SL38 and SL41 had distinctive peaks connected to the {111} slip plane at 1430 cm−1, and four samples had typical peaks associated with the {111} slip plane at 1330 cm−1 and 1010 cm−1 [48]. The H element was present in these three diamond samples as impurities, as seen by the reasonably noticeable 3107 cm−1 absorption, except for SL40 [49,50].
Three samples are Type IIa diamonds, with peaks at 1975 cm−1, 2030 cm−1, 2160 cm−1, and 2350 cm−1 and a distinctive absorption peak associated with the C-H bond at 3107 cm−1 (Figure 6c). Nevertheless, no distinctive absorption peaks in the 1000–1400 cm−1 region, nor an absorption peak at 2800 cm−1 that is caused by B-C bonds, have been detected [51]. FTIR spectroscopy tests on Mengyin diamonds demonstrated that the characteristic absorption peak at 3107 cm−1 is widespread in Mengyin diamonds, indicating that, in addition to nitrogen, hydrogen is also the main impurity element. Furthermore, several samples had absorption peaks of 1010 cm−1 associated with the {111} slip plane, suggesting that plastic deformation is pervasive in the diamonds. This is consistent with the surface features of the samples seen under a gemstone microscope.
4.2.2. Raman Spectra
- The Raman Spectra of Mengyin Diamonds
Six samples were subjected to Raman spectroscopy testing, and each sample had distinctive absorption peaks at 1332 cm−1 [52]. Raman peaks of the remaining diamond sample shifted to various degrees at 1332 cm−1, except samples SL29 and SL10 (Figure 7).
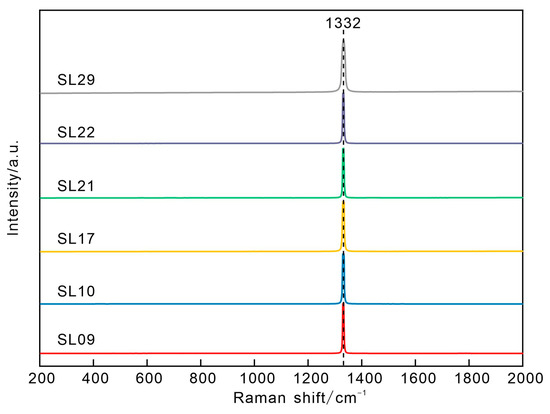
Figure 7.
Raman spectra of Mengyin diamonds on the southeastern margin of the North China Craton.
Table 1 displays the results of the calculation of the full width at half maxima (FWHM) of the absorption peak of the sample. The FWHM in this research is higher than a previous study, which was calculated by earlier researchers to be between 5.6 and 6.8 cm−1 [53]. In some samples, it is as high as 14.75 cm−1. The FWHM of the Raman intrinsic peak of diamonds gradually rises with the increase in the number and intensity of lattice defects in the crystal structures [54]. Five of the six diamond samples evaluated in this study had FWHM of the Raman intrinsic peaks ranging from 6.26 to 8.60 cm−1, demonstrating a high number of lattice defects. However, the FWHM of SL29 was as high as 14.75 cm−1, implying that either the lattice flaws or the stress they created were relatively considerable.

Table 1.
The full width at half maxima of the Mengyin diamonds on the southeastern margin of the North China Craton.
- 2.
- Raman Spectra of Inclusions in Diamonds
Olivine inclusions exhibit colorless, spherical morphologies (Figure 8b–d). The Raman absorption peaks of olivine are mainly located at 854 cm−1 and 824 cm−1. The strength and position of the distinctive peaks of olivine inclusions depend on the depth of olivine inclusions in the diamond, potential graphite spots on the inclusion surface, and the fluorescence effect of the diamond [55,56]. As a result, Raman characteristic peaks of olivine inclusions in diamonds typically drift (Figure 8a).
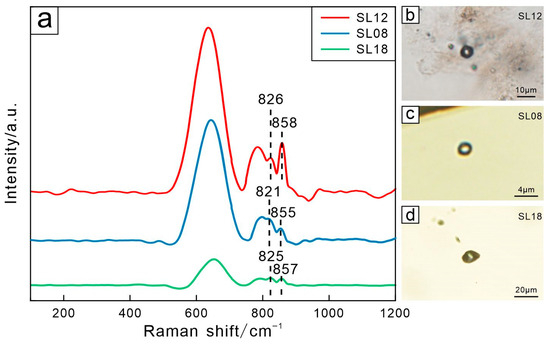
Figure 8.
Olivine inclusions (b–d) and their Raman spectra (a) in the Mengyin diamonds from the southeastern margin of the North China Craton.
Coesite is a high-pressure homogeneous multiphase of SiO2. It has been discovered in diamonds in Australia, South Africa, Venezuela, and in Shandong and Hunan Provinces of China [53,57,58,59]. Two colorless plate-like (Figure 9c) and round (Figure 9b) coesite inclusions were observed in the sample SL29. The inclusions varied in size, with the smaller one being approximately 5 μm and the larger one reaching up to 50 μm (Figure 9c). The Raman spectra show clear and typical Raman shifts of 187 cm−1, 270 cm−1, 427 cm−1, and 527 cm−1 of coesite (Figure 9a) [53]. The comparatively straight and flat edges of the coesite imply that they are primary inclusions. Its appearance indicates that the diamond sample was once under ultra-high pressure.
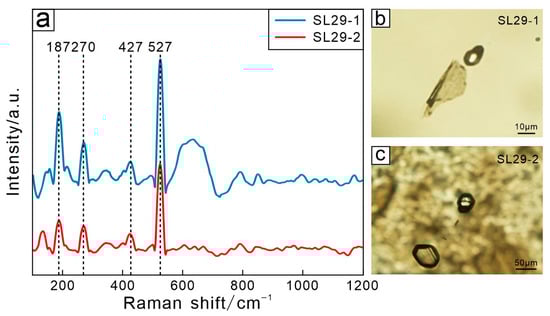
Figure 9.
Coesite inclusions (b,c) and their Raman spectra (a) in a Mengyin diamond from the southeastern margin of the North China Craton.
Garnet inclusions in diamonds mainly include pyrope, almandine, and their solid solution, among which pyrope is more common. Although pyrope and almandine exhibit similar Raman spectra, their peaks in the 400–600 cm−1 range can effectively discriminate between them [60]. Almandine exhibits Raman peaks at 500 and 556 cm−1, whereas pyrope shows a single characteristic peak at 565 cm−1 (the Raman data for almandine and pyrope are from the RRUFF standard cards R040079 and R040159). Colorless garnet inclusions have been observed in sample SL29 with sizes of approximately 3–5 μm (Figure 10b). The Raman absorption peaks at 351 cm−1, 500 cm−1, 560 cm−1, and 912 cm−1 were detected in the garnet inclusions (Figure 10a). These peaks were essentially in accordance with the typical characteristic peaks of almandine (500 cm−1 and 556 cm−1) [61].
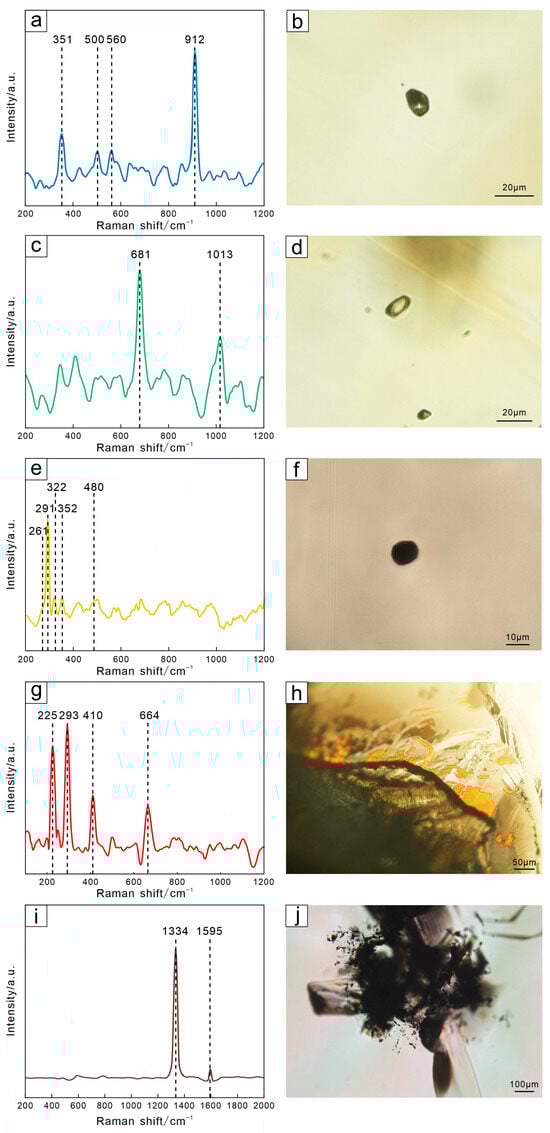
Figure 10.
The Raman spectra of different inclusions in Mengyin diamonds from the southeastern margin of the North China Craton: (a,b) almandine; (c,d) diopside; (e,f) chalcopyrite; (g,h) hematite; (i,j) graphite.
The Raman spectra of sample SL46 show relatively obvious characteristic absorption peaks of 1016 cm−1 and 679 cm−1 (Figure 10c,d), indicating that this inclusion is a diopside [53].
Sample SL12 contains sulfide inclusions exhibiting characteristic Raman peaks of chalcopyrite. The bands at 261 and 480 cm−1 are assigned to Cu-S bond vibrations, while the peaks at 291, 322, and 352 cm−1 correspond to Fe-S bond vibrations [62].
During the formation or ascending transportation of diamonds, changes in internal pressure and external environmental pressure can cause cracks inside. Alterations in temperature and pressure conditions further transform the diamond at the cracks into graphite, which exists in the form of clumps or flakes [63,64,65]. Graphite inclusions are relatively common in Mengyin diamonds, presenting as black flakes or cloud-like (Figure 10j). According to the Raman spectra, the typical peak of graphite is located at 1580 cm−1, while the characteristic peak of diamond is located at 1332 cm−1 (Figure 10i).
The diamond samples from the southeastern margin of the North China Craton have comparatively well-developed fractures, and the cracks are mostly filled with reddish-brown minerals. Sample SL12 displayed distinct typical Raman absorption peaks at 225 cm−1, 291 cm−1, 410 cm−1, and 664 cm−1 (Figure 10g). The appearance of these peaks indicates that the reddish-brown mineral is hematite (Figure 10h), which belongs to secondary inclusion.
4.3. X-Ray Micro-CT Scanning Technology
The distribution of inclusions in the Mengyin samples was analyzed by X-ray micro-CT scanning technology. In the three-dimensional map, inclusions are shown as yellow dots, and the white parts are not inclusions. The inclusions in the SL12 diamond sample are irregularly block-shaped and generally dispersed (Figure 11a), whereas those in the SL14 diamond sample are short, columnar, or spherical and are dispersed in a directional form along a straight line (Figure 11b).
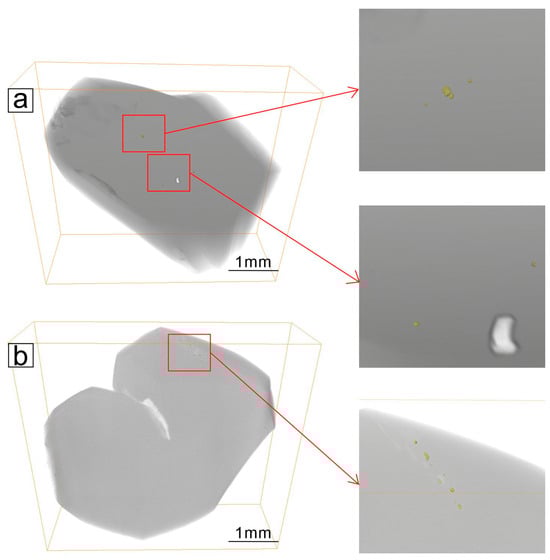
Figure 11.
The distribution of inclusions in the Mengyin diamonds SL12 (a) and SL14 (b).
Internal cracks in diamond samples were scanned in three dimensions, and red regions indicated the presence of fissures. The distribution and morphology of diamond fissures provide insights into the stress conditions and crystal structural features encountered during their formation, particularly in response to temperature variations and structural stress. These fissures are closely linked to the growth processes of diamond crystals and the subsequent geological events they experienced [66]. The internal fractures in diamond samples SL12 (Figure 12a,b) and SL14 (Figure 12c,d) have evolved to the surface and are characterized as open fractures, as shown by the three-dimensional distribution maps.
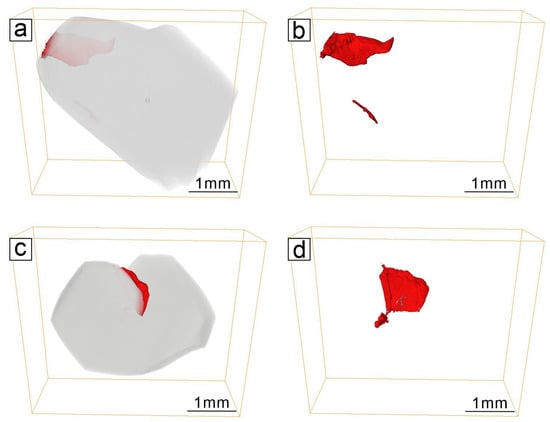
Figure 12.
The distribution characteristics of internal fractures in the Mengyin diamonds SL12 (a,b) and SL14 (c,d).
4.4. Diamond View™
4.4.1. Straight Ring Band Fluorescence Pattern
The straight ring band pattern refers to the fact that the luminescence degree within the diamond is not uniform. Under DiamondView™, the SL10 and SL46 samples exhibited blue fluorescence, revealing relatively straight rings within (Figure 13a,b). This indicated that the diamonds’ growth was a steady and continuous process and that the melt composition changed uniformly as the diamonds developed. It occurred that no fusion phenomena were brought on by a protracted pause during the whole crystallization process. Furthermore, the development of straight and flat rings indicates that the geological environment in which diamonds grow has relatively gradual temperature fluctuations rather than sharp rises or falls, which creates ideal circumstances for the steady growth of diamond crystals [31].
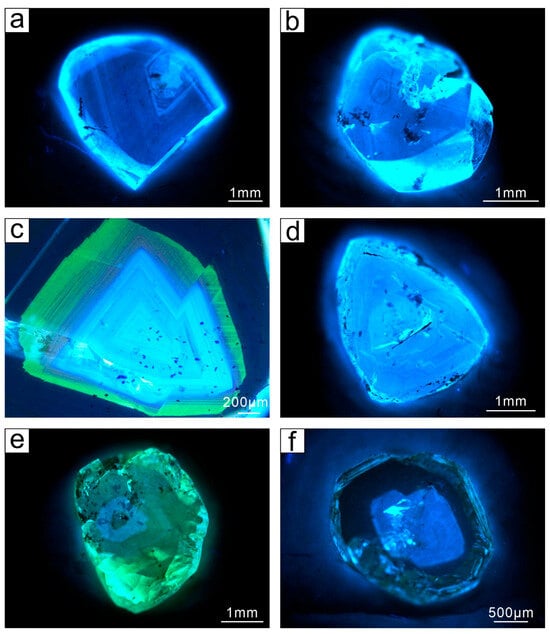
Figure 13.
Three fluorescence patterns of diamonds from the southeastern margin of the North China Craton in DiamondViewTM. (a–c) Straight ring band fluorescence pattern. (d) Curved ring band fluorescence pattern. (e,f) Patchy fluorescence pattern.
The whole SL21 sample exhibited a flat ring band fluorescence pattern (Figure 13c), with a subtriangular structure in the center portion of the ring band that gradually expands toward the edges. Sample SL21 has a clear multiphase growth structure with blue fluorescence in the central portion, green fluorescence in the transition area, and no fluorescence in the edge part, in contrast to examples SL10 and SL46, which produce fluorescence of various hues in different regions. The occurrence of this structure is attributed to the changes in geological conditions and growth environment that the diamond underwent during its growth. In the cores of SL21, the blue fluorescence is caused by three nitrogen atoms around a single hole-forming N3 center, while the green fluorescence is caused by an H3 center (two nitrogen atoms (A-centers bonded to a single hole (V)-center)) [67]. The transition from a high- to a low-nitrogen environment during the diamond crystallization is reflected in the change from blue to green fluorescence.
4.4.2. Curved Ring Band Fluorescence Pattern
The curved band fluorescence pattern means that the bands in the diamond are not straight but curved but instead, adopting a curved form while maintaining parallel alignment overall. Sample SL29 demonstrates curved ring bands of diamond, with the upper and lower right portions of the bands curved (Figure 13d). Such ring bands’ emergence during crystal formation signifies a shift in the surrounding melt’s composition.
4.4.3. Patchy Fluorescence Pattern
The patchy fluorescence pattern refers to variations in the hue and intensity of the light within the diamond. The core and rim of the SL18 sample exhibit green fluorescence, while the midway transition displays blue fluorescence (Figure 13e). Since SL18 is a Type IIa diamond with a low N content and no distinctive absorption peaks linked to N3 at 1376–1359 cm−1 in the FTIR spectrum, it is assumed that elemental B is responsible for the blue fluorescence, which is brought on by the subducted plate being dehydrated due to release fluids rich in boron.
4.4.4. Irregular Fluorescence Pattern
The SL01 sample did not show fluorescence externally, but an orange-red fluorescence can be observed internally (Figure 14a), and the appearance of the orange-red fluorescence indicates that impurity nitrogen atoms exist in the diamond lattice as a lone nitrogen. The SL19 diamond sample was not luminescent as a whole, but long strips of blue fluorescence and rounded green luminescent portions were observed on the surface (Figure 14b), and it is hypothesized that this diamond underwent fusion after the growth was completed. The SL36 sample shows mixed blue and green fluorescence (Figure 14c), illustrating that this diamond has experienced multiple radiations from radioactive particles in nature, which generates green fluorescence associated with relevant lattice defects in contrast to blue fluorescence in the main. The diamond inclusions inside the SL02 and SL35 samples exhibited fluorescence intensities different from those of the host diamonds (Figure 14d–f). Both the diamond inclusions and the host diamond in Figure 14d show green fluorescence, but the fluorescence intensity of the diamond inclusions is significantly higher than that of the host diamond. In contrast, the diamond inclusions in Figure 14e,f display stronger blue fluorescence.
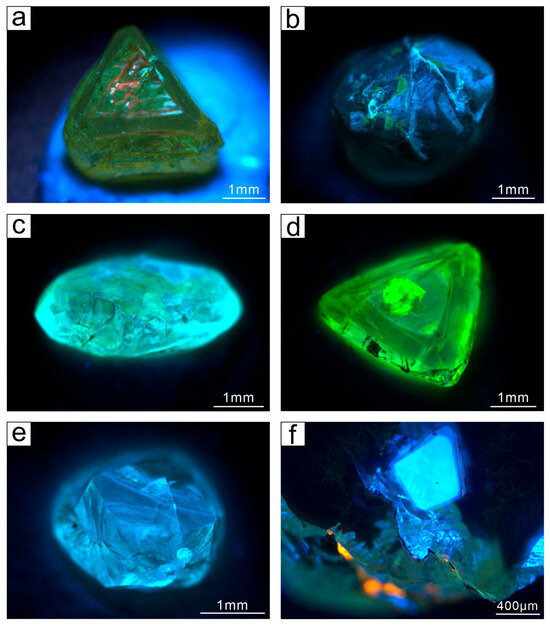
Figure 14.
Irregular fluorescence pattern of diamonds from Mengyin, the southeastern margin of the North China Craton, under DiamondViewTM. (a) Orange-red fluorescence in SL01 internal. (b) Blue fluorescence strip and round green fluorescence in SL19. (c) Blue and green mixed fluorescence in SL36. (d,e) Inclusions in SL02, SL43 exhibit different fluorescence intensities than their host diamonds. (f) Blue fluorescence is restricted to inclusions within originally non-fluorescent diamond hosts of SL35.
5. Discussion
5.1. Depth of Diamond Formation in Mengyin
Mineral inclusions in diamonds can provide details regarding the depth of diamond genesis [68]. Among these inclusions, olivine is particularly valuable, because its shape and chemical stability allow it to retain the original information effectively. Due to its hardness and resistance to alteration during diamond formation and ascent, olivine serves as a reliable recorder. By analyzing the degree of drift in the Raman characteristic peaks of olivine inclusions, the temperature and pressure conditions at which the diamonds formed can be estimated [69]. The Raman absorbtion peaks of olivine are 856 cm−1 and 826 cm−1, corresponding to a drift of 3.09 cm−1 per 1 GPa of pressure, with the associated relational equation [26,70,71]: P0 = (3.259 × 10⁻⁴Pi + 3.285 × 10⁻³) T0 + 0.9246Pi + 0.319 (T0: temperature in the diamond source region, P0: pressure in the source region, and Pi: internal pressure of olivine in the diamond). The source temperature was adopted from the average literature valuation of the growth temperature of diamonds in Mengyin, T0 = 1180 °C [69]. The Raman shift data of four olivine inclusions in three diamonds were used to calculate the source pressure of the diamonds in Mengyin, and the results obtained are shown in Table 2.
Table 2.
Raman pressure calculations of olivine inclusions in diamonds from Mengyin, the southeastern margin of the North China Craton.
The calculated depths of formation of diamond are 176.48 km, 153.12 km, 147.08 km, and 148.40 km, respectively, and the corresponding source pressures are 5.35 GPa, 4.64 GPa, 4.46 GPa, and 4.50 GPa. The calculated results are consistent with the pressure range of the diamond-forming source region in Mengyin: 4.5–9.2 GPa [22,26,29,53], which was estimated by previous studies using various mineral inclusions.
5.2. Calculation of the Nitrogen Content and Formation Environment
Nitrogen is the predominant and most significant impurity element in diamonds, and its content plays a crucial role in understanding a diamond’s origin. The nitrogen content in diamonds can vary substantially. Specifically, Type I diamonds have a nitrogen concentration of over 1000 μg·g−1, Type II diamonds have a nitrogen content of less than 10 μg·g−1, and transition diamonds have a nitrogen content ranging from 10 to 1000 μg·g−1 [23]. This classification provides valuable insights into the geological environments and processes involved in diamond formation. The intensity of the relevant absorption peaks in the infrared spectra of diamonds can be used to calculate the content of nitrogen impurities in diamonds in different forms of existence, and the prevailing international methods for calculating the nitrogen content of diamonds using infrared spectroscopy are [72]:
- (1)
- The intensities of the absorption peaks at 1282 cm−1 and 1175 cm−1 in the infrared spectrum of diamonds are μA and μB, respectively, and their ratio is m, m = μA/μB.
- (2)
- When m < 1.5, r = (2.72m − 1)/(1 − 0.41m); when m > 1.5, r = (1.88m − 1)/(10.5m).
- (3)
- The absorption coefficients of nitrogen impurity A and B cores in diamonds are UA and UB, respectively, with UA = tr/(1 + r) and UB = t/(1 + r), where t is the ratio of μA to the thickness of diamond, t = μA/d.
- (4)
- The amount of nitrogen impurities A-center and B-center in diamonds are NA and NB, respectively, and the total amount of nitrogen impurities is NT.
NA = UA/300, NB = UB/85, NT = NA + NB, and the conversion rate of B-center NB% = NB/NT.
Using the international common formula for calculating the nitrogen content to calculate the nitrogen content of Type IaAB diamond samples to obtain the results as shown in Table 3.
Table 3.
Nitrogen content in diamonds from Mengyin, the southeastern margin of the North China Craton.
The samples had a greater concentration of A-center than B-center, with nitrogen contents ranging from 7.65 to 138.68 μg·g−1 and B-center conversions ranging from 31.00% to 92.07%. The nitrogen concentration in diamonds is mostly determined by the diamond’s development rate and the nitrogen levels present in the surrounding environment [73]. The generally low nitrogen content might be attributed to their creation in a low-nitrogen mantle. Diamonds in a shallow mantle have a high nitrogen content (600–1500 μg·g−1) and a low-nitrogen aggregation state, while those formed in the lower mantle or transition zone have very low nitrogen (<50 μg·g−1) [17]. However, the formation depth of diamond calculated based on olivine inclusions in the previous section is much shallower than the lower mantle. Therefore, it is another mechanism that leads to the formation of low-nitrogen diamonds. The extent to which nitrogen in the growth medium participates in diamond crystallization determines the abundance of nitrogen in diamonds. The behavior of nitrogen in mantle fluids depends on the pH and oxygen fugacity, and nitrogen in the reducing mantle generally exists in the form of ammonia and NH4+ [74]. The characteristic absorption peak at 3107 cm−1 in the infrared spectrum is commonly observed in Mengyin diamonds (Figure 6), indicating the presence of hydrogen impurities. By accumulating as nitride hydrocarbon compounds (such as NH3) or CH3N [75], less nitrogen will be incorporated into the diamond lattice. Reducing conditions inhibit the formation of atomic nitrogen. Even if the environment is rich in nitrogen, low-nitrogen diamonds may still be produced.
5.3. Formation Process of Mengyin Diamonds
5.3.1. Growth of Diamonds
Diamond growth within the base of the lithosphere is non-uniform. It can be separated into three zones based on its characteristics: the central zone grows in a crystalline environment that is highly supersaturated, the transition zone exhibits non-homogeneous growth and crystallizes in less supersaturation, and the edge zone grows in a more stable and balanced environment [76].
DiamondViewTM’s fluorescence properties can be used to determine the diamond’s growing features. The majority of the diamonds in this paper exhibited blue fluorescence, while a small number exhibit green fluorescence or mixed blue and green fluorescence. This suggests that nearly all the diamonds were formed in a nitrogen-rich environment, where nitrogen served as the primary impurity element in the diamond lattice. Only a limited number of diamonds were formed in environments with lower nitrogen concentrations. Furthermore, the intricate growth structure indicates that diamond crystallizes from a melt rather than undergoing a sub-solidus self-reduction mechanism of formation [77].
Different fluorescence patterns also imply the variable environments in which diamonds grow. The fluorescence patterns of diamonds include the following five main types: no ring band, straight ring band, complex curved ring band, and patchy and irregular fluorescence patterns. The diamonds were produced in a highly stable environment, which allowed the elemental nitrogen that produces blue fluorescence to uniformly permeate the diamond’s lattice structure, as seen by the ring-free fluorescence pattern. The fluorescence patterns of flat and complex curved bands indicate that the diamonds were formed in an environment where there were periodic variations in the mantle melt’s chemical composition, temperature, pressure, and redox conditions. While narrow and dense bands or alternating bright and dark bands may reflect the turbulent environment of alternating rapid growth and stagnation, wide and continuous fluorescence bands represent the uniform temperature–pressure environment during the period of stable diamond growth. The change in fluorescence color indicates a shift in melt composition during diamond growth, which alters the fluorescence characteristics. Blue fluorescence is caused by N entering the lattice as a lone nitrogen during diamond generation and then aggregating to change from the A-center (diatomic nitrogen) to the B-center (three or more nitrogen atoms) and, finally, to the N3 color center (three nitrogen atoms surrounding one hole) [78]. Long-term transformations at mantle temperatures between 1000 and 1200 °C are necessary for this process. Diamond has had a lengthy temperature history deep in the more stable mantle lithosphere, revealing a very long time of storage in the deep mantle following its production, as demonstrated by the blue fluorescence produced by the N3 center.
Irregular ring band formations can occur as a result of variations in the crystal growth rate caused by changes in the melt’s composition. A curved ring band in the diamond may also be the consequence of the crystals experiencing the impacts of fusion etching during the growing process. In contrast, diamonds with patchy and irregular luminescence patterns are indicative of a more complex formation environment, with a fluctuating N content in the melt. The green fluorescence may be associated with H3 defects created by irradiation during ascent and by a prolonged annealing process at intermediate temperatures, reflecting the pause of kimberlite magmas. The H3 color center is formed through irradiation processes [79], obtaining a green fluorescence. It is predominantly observed in HPHT synthetic diamonds but is rare in natural diamonds. The SL35 sample showed blue fluorescence in the central part and weaker green fluorescence at the edges (Figure 13f), indicating that this diamond sample was grown in a high-nitrogen environment (N3 color centers) and underwent a brief irradiation (H3 color centers) with a reduced nitrogen concentration during its late ascent to the shallow surface. This variation in fluorescence can be attributed to the possibility that the diamonds and their inclusions formed in different geological environments, resulting in diversity in their internal structures or impurity content.
Investigating inclusions in diamonds is essential for comprehending the conditions under which diamonds form, as these inclusions often provide insights into the extreme environments present in the Earth’s mantle from which diamonds originate and to which they are transported during volcanic eruptions [14,80]. Raman spectroscopy revealed that the inclusions in the Mengyin diamond samples were mostly composed of graphite, olivine, coesite, pyrope, diopside, and hematite. Diamond inclusions can be categorized into peridotite-type and eclogite-type, according to their mineral composition [80]. Pyrope, olivine, and diopside are examples of peridotite-type inclusions, which are primarily formed in the mantle lithosphere, while coesite is an example of eclogite-type inclusion, which is primarily formed by the oceanic crust through subduction to the mantle and ultrahigh-pressure metamorphism [81]. The coexistence of olivine-type inclusions and garnet-type inclusions further demonstrates that diamonds in the Mengyin area were formed in a mantle lithosphere environment that was metasomatized by the oceanic crust (Figure 15). The subducted oceanic crust undergoes a low degree of partial melt decarbonization to form carbonate melts, which react with the surrounding mantle peridotites in a reduced state and can create large amounts of diamonds at the top of the mantle transition zone [82].
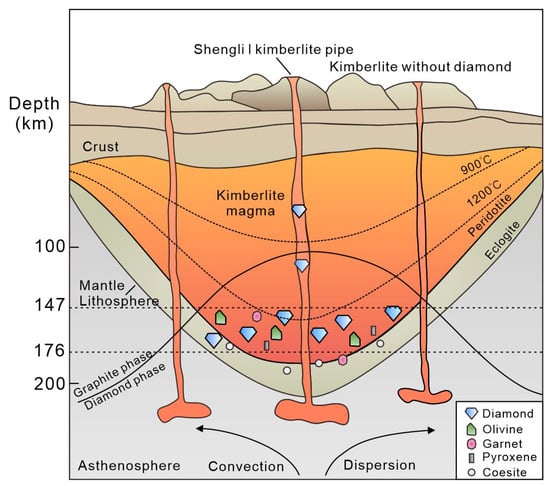
Figure 15.
Schematic diagram of diamond formation and transportation processes in the southeastern margin of the North China Craton [83].
5.3.2. Diamond Capture and Transportation
Diamond surface micromorphology describes the different geologic environments that diamonds have encountered during their growth and after formation, and the dissolution of diamonds by carbon-bearing melt fluids during transportation has a significant impact on the kimberlites diamond potential [6]. The surface morphology and topography in Mengyin diamonds include growth steps, growth veins, triangular pits, stacked tile-like etchings, disk-like etchings, fusion grooves, and “hairy glass”-like appearances. Natural diamond surface micromorphology develops at various phases of diamond growth and is caused by a mix of external and self-growth factors. Some of these factors are linked to the erosion of kimberlite magmas, while others are related to the residence of diamonds in the mantle at earlier stages of development [84].
Triangular pits are commonly observed in Mengyin diamonds, often showing several small triangular pits superimposed on larger ones. This feature suggests that the diamonds experienced multiple episodes of resorption either during the late stages of their formation or during transport. Regular flat-bottomed triangular pits (Figure 4g,h) typically form in H2O-rich kimberlite melts with XCO2 < ~0.5 [85]. In contrast, the occurrence of stacked tile-like etch features and disk-like etchings indicates that the diamonds were subjected to more intense dissolution processes.
Moreover, there are some variations in the two samples’ fracture morphologies, which imply that the stress conditions in the two samples changed substantially during the formation process (Figure 12). Due to the rapid ascent of kimberlite magma, the temperature and pressure of the surrounding environment change abruptly. The lattice atoms within the diamond struggle to accommodate these changes, resulting in the development of internal stresses. When these stresses exceed the strength of the lattice, they are released through fragmentation, forming fissures [66]. Cracks in diamonds can be categorized as either internal or open cracks. Graphite is commonly observed within internal cracks, as the changing temperature and pressure conditions during the diamond’s transport to the surface become favorable for graphite formation [63,64]. Many open cracks are filled with hematite, which is interpreted to have crystallized from fluids along the fractures during the diamond’s ascent.
6. Conclusions
The diamonds from Mengyin, located along the southeastern margin of the North China Craton, are predominantly Type IaAB, Type IaB, and Type IIa. In addition to nitrogen, hydrogen is frequently present as an impurity element. The nitrogen contents of the Mengyin diamonds range from 7.65 to 138.68 μg·g−1, with B-center aggregation rates varying between 31% and 92.07%. Based on the Raman shift measurements of olivine inclusions, the formation depths of these diamonds were determined to be 176.484 km, 153.12 km, 147.081 km, and 148.401 km, corresponding to formation pressures of 5.348 GPa, 4.64 GPa, 4.457 GPa, and 4.497 GPa, respectively.
These results suggest that Mengyin diamonds formed near the base of the lithosphere. Their heterogeneous growth patterns, including patchy and annular zoning, reflect non-uniform conditions during crystallization. Suitable temperature–pressure regimes and the strong activity of deep-source melts are key factors controlling diamond formation. Under DiamondView™ imaging, these diamonds display ring structures with blue, green, or mixed blue–green fluorescence. The transition from blue to green fluorescence indicates decreasing nitrogen concentrations in the growth environment, accompanied by natural particle irradiation.
The abundant surface microfeatures observed suggest that Mengyin diamonds experienced intense and multi-stage resorption during transport. Mineral inclusions such as olivine, pyrope, and diopside indicate that the mantle lithosphere beneath the eastern North China Craton is dominated by peridotite with minor eclogite, implying that subducted oceanic crust contributed to diamond genesis in this region.
Author Contributions
Conceptualization, L.Z.; methodology, Y.-Q.W. and L.Z.; software, Y.-Q.W. and H.-S.W.; validation, Y.-Q.W. and L.-Q.Y.; formal analysis, Y.-Q.W., Y.-M.S., and H.-S.W.; investigation, Y.-M.S., L.Z., and Z.-Y.C.; resources, L.Z. and Z.-Y.C.; data curation, Y.-M.S. and Y.-Q.W.; writing—original draft preparation, Y.-M.S. and Y.-Q.W.; writing—review and editing, L.Z.; visualization, Y.-M.S. and Y.-Q.W.; supervision, L.Z. and L.-Q.Y.; project administration, L.Z. and L.-Q.Y.; funding acquisition, L.Z. and L.-Q.Y. All authors have read and agreed to the published version of the manuscript.
Funding
This research was financially supported by the Shandong Provincial Key Research and Development Program (Grant No. 2024CXPT103), National Key Research Program of China (Grant No. 2019YFA0708603), 111 Project of the Ministry of Science and Technology, China (Grant No. BP0719021), and Open Research Project of the Shandong Mengyin Primary Diamond Deposit Field Scientific Observation and Research Station, Ministry of Natural Resources and the Key Laboratory of Diamond Mineralization Mechanism and Exploration, Shandong Provincial Bureau of Geology & Mineral Resources (Grant No. QDKF-ZD202304).
Data Availability Statement
The original contributions presented in this study are included in the article. Further inquiries can be directed to the corresponding authors.
Acknowledgments
We thank Jun Deng, Ming-Yue He, and Bo Xu of China University of Geosciences (Beijing) for their comments and suggestions for this project.
Conflicts of Interest
The authors declare no conflicts of interest.
References
- Stachel, T.; Luth, R.W. Diamond Formation—Where, When and How? Lithos 2015, 220, 200–220. [Google Scholar] [CrossRef]
- Haggerty, S.E. Diamond Genesis in a Multiply-Constrained Model. Nature 1986, 320, 34–38. [Google Scholar] [CrossRef]
- Walsh, C.; Kamber, B.S.; Tomlinson, E.L. Deep, Ultra-Hot-Melting Residues as Cradles of Mantle Diamond. Nature 2023, 615, 450–454. [Google Scholar] [CrossRef]
- Woodhead, J.; Hergt, J.; Giuliani, A.; Maas, R.; Phillips, D.; Pearson, D.G.; Nowell, G. Kimberlites Reveal 2.5-Billion-Year Evolution of a Deep, Isolated Mantle Reservoir. Nature 2019, 573, 578–581. [Google Scholar] [CrossRef] [PubMed]
- Shirey, S.B.; Richardson, S.H. Start of the Wilson Cycle at 3 Ga Shown by Diamonds from Subcontinental Mantle. Science 2011, 333, 434–436. [Google Scholar] [CrossRef]
- Giuliani, A.; Phillips, D.; Pearson, D.G.; Sarkar, S.; Müller, A.A.; Weiss, Y.; Preston, R.; Seller, M.; Spetsius, Z. Diamond Preservation in the Lithospheric Mantle Recorded by Olivine in Kimberlites. Nat. Commun. 2023, 14, 6999. [Google Scholar] [CrossRef]
- Phillips, D. Tales from Diamond Surface Features—A Tribute to Derek Robinson. Mineral. Petrol. 2025, 1, 1–16. [Google Scholar] [CrossRef]
- Khokhryakov, A.F.; Pal’yanov, Y.N. Influence of the Fluid Composition on Diamond Dissolution Forms in Carbonate Melts. Am. Mineral. 2010, 95, 1508–1514. [Google Scholar] [CrossRef]
- Shirey, S.B.; Cartigny, P.; Frost, D.J.; Keshav, S.; Nestola, F.; Nimis, P.; Pearson, D.G.; Sobolev, N.V.; Walter, M.J. Diamonds and the Geology of Mantle Carbon. Rev. Mineral. Geochem. 2013, 75, 355–421. [Google Scholar] [CrossRef]
- Howarth, G.H.; Kahle, B.; Janney, P.E.; Kahle, R.; Plessis, A.D.; Richardson, S.H.; Gurney, J.J. Caught in the Act: Diamond Growth and Destruction in the Continental Lithosphere. Geology 2023, 51, 532–536. [Google Scholar] [CrossRef]
- Allen, B.P.; Evans, T. Aggregation of Nitrogen in Diamond, Including Platelet Formation. Proc. R. Soc. Lond. A Math. Phys. Sci. 1981, 375, 93–104. [Google Scholar]
- Sun, Y.; Qiu, Z.L.; Lu, T.J.; Chen, H.; Chen, B.H.; Peng, S.Y.; Wei, R.; Li, L.F. Microscopic Infrared Spectroscopy Mapping Method to Trace the Non-uniform Growth of Nitrogen Impurities in Natural Diamonds from Three Areas in China. Spectrosc. Spectr. Anal. 2012, 32, 2070–2074. (In Chinese) [Google Scholar]
- Curtolo, A.; Novella, D.; Logvinova, A.; Sobolev, N.V.; Davies, R.M.; Day, M.C.; Pamato, M.G.; Nestola, F. Petrology and Geochemistry of Canadian Diamonds: An up-to-Date Review. Earth-Sci. Rev. 2023, 246, 104588. [Google Scholar] [CrossRef]
- Stachel, T.; Harris, J.W. The Origin of Cratonic Diamonds—Constraints from Mineral Inclusions. Ore Geol. Rev. 2008, 34, 5–32. [Google Scholar] [CrossRef]
- Richardson, S.H.; Gurney, J.J.; Erlank, A.J.; Harris, J.W. Origin of Diamonds in Old Enriched Mantle. Nature 1984, 310, 198–202. [Google Scholar] [CrossRef]
- Gao, J.; Niu, J.; Qin, S.; Wu, X. Ultradeep Diamonds Originate from Deep Subducted Sedimentary Carbonates. Sci. China Earth Sci. 2017, 60, 207–217. [Google Scholar] [CrossRef]
- Kaminsky, F.V.; Khachatryan, G.K. Characteristics of Nitrogen and Other Impurities in Diamond, as Revealed by Infrared Absorption Data. Can. Mineral. 2001, 39, 1733–1745. [Google Scholar] [CrossRef]
- Nestola, F.; Regier, M.E.; Luth, R.W.; Pearson, D.G.; Stachel, T.; McCammon, C.; Wenz, M.D.; Jacobsen, S.D.; Anzolini, C.; Bindi, L. Extreme Redox Variations in a Superdeep Diamond from a Subducted Slab. Nature 2023, 613, 85–89. [Google Scholar] [CrossRef] [PubMed]
- Burgess, S.R.; Harte, B. Tracing Lithosphere Evolution through the Analysis of Heterogeneous G9–G10 Garnets in Peridotite Xenoliths, II: REE Chemistry. J. Petrol. 2004, 45, 609–633. [Google Scholar] [CrossRef]
- Frezzotti, M.-L.; Huizenga, J.-M.; Compagnoni, R.; Selverstone, J. Diamond Formation by Carbon Saturation in C–O–H Fluids during Cold Subduction of Oceanic Lithosphere. Geochim. Cosmochim. Acta 2014, 143, 68–86. [Google Scholar] [CrossRef]
- Stachel, T.; Aulbach, S.; Brey, G.P.; Harris, J.W.; Leost, I.; Tappert, R.; Viljoen, K.S. The Trace Element Composition of Silicate Inclusions in Diamonds: A Review. Lithos 2004, 77, 1–19. [Google Scholar] [CrossRef]
- Yin, Z.W.; Lu, F.X.; Chen, M.H.; Xu, H.H. Ages and Environments of Formation of Diamonds in Mengyin County, Shandong Province. Earth Sci. Front. 2005, 4, 614–621, (In Chinese with English Abstract). [Google Scholar]
- Yang, Z.J.; Liang, L.; Zeng, X.Q.; Ge, T.Y.; Ai, Q.; Zheng, Y.L.; Peng, M.S. Study on the Micro-Infrared Spectra and Origin of Polycrystalline Diamonds from Mengyin Kimberlite Pipes. Spectrosc. Spectr. Anal. 2012, 32, 1512–1518, (In Chinese with English Abstract). [Google Scholar]
- Yang, B.; Ma, X.X.; Tang, L.L.; Luo, W.Q.; Sun, X.Z. Discussion on Forming Age of Primary Diamond Ore in Mengyin Area of Shandong Province. Shandong Land Resour. 2015, 31, 19–21, (In Chinese with English Abstract). [Google Scholar]
- Lu, F.X.; Zhao, L.; Deng, J.F.; Zheng, J.P. The Discussion on the Age of Kimberlite Magma Activity in North China Platform. Acta Petrol. Sin. 1995, 4, 365–374, (In Chinese with English Abstract). [Google Scholar]
- Yin, L.; Zhang, R.S.; Zheng, J.P. Mineral Chemistry Characters of Diamond Inclusions and the Nature of the Lithospheric Mantle beneath the Eastern North China Craton. Bull. Geol. Sci. Technol. 2008, 5, 21–28, (In Chinese with English Abstract). [Google Scholar]
- Qin, L.L.; Shi, G.H.; Zhao, X. The Source Pressure of Diamond from North China Craton—Constraints from the Olivine Inclusions. Geol. Rev. 2023, 69, 93–94, (In Chinese with English Abstract). [Google Scholar]
- Chen, M.H.; Li, Y.; Geng, J.R.; Lu, F.X.; Zheng, J.P. Agate-like Structure and Heterogeneities of Nitrogen and Hydrogen Impurities of Diamond in Mengyin, China. Acta Geol. Sin. 2006, 31, 1197–1201, (In Chinese with English Abstract). [Google Scholar]
- Lv, Q.; Liu, F.; Chu, Z.Y.; Ge, Y.J.; Liu, X.; Jiao, Y.X. Mineralogical Characteristics and Comparison of Diamonds in Three Kimberlite Belts in Mengyin, Shandong. Acta Geol. Sin. 2022, 96, 1225–1238. (In Chinese) [Google Scholar]
- Ding, Y.K.; Liang, W.Z.; Qiu, Z.L.; Deng, X.Q.; Sun, Y.; Ma, Y.; Sun, C.Y.; Lu, T.J. Morphology and Surface Features of Diamonds from Mengyin: Geological Implications for the Nature and Activity of Deep-Seated Melts and Fluids. Adv. Earth Sci. 2024, 39, 602–615, (In Chinese with English Abstract). [Google Scholar]
- Chen, H.; Qiu, Z.L.; Lu, T.J.; Stern, R.; Stachel, T.; Sun, Y.; Zhang, J.; Ke, J.; Peng, S.Y.; Qin, S.C. Carbon Isotope Composition and Differences in the Mantle of the Continental Lithosphere in the Yangtze Craton and North China Craton: Evidence from In-situ Diamond Carbon Isotope Tests. Chin. Sci. Bull. 2013, 58, 355–364. (In Chinese) [Google Scholar]
- Zhang, H.F.; Lu, F.X.; Zhao, L.; Menzies, M.A.; Mattey, D.P.; Liang, S.Y. Carbon Isotopes in China Natural Diamonds. Earth Sci. 2009, 34, 37–42, (In Chinese with English Abstract). [Google Scholar]
- Wang, Z.B.; Wang, Q.J. Analysis on Regional Geological Background and Metallogenic Predication of Diamond Mineralization in Eastern Margin of North China Plate. Shandong Land Resour. 2014, 30, 8–14, (In Chinese with English Abstract). [Google Scholar]
- Zhang, C.F.; Liu, F.; Lv, Q.; Wang, Y.; Yang, J.S. Morphological Features and Spectral Comparisons of Diamonds from Three Kimberlite Belts in Mengyin, China. Minerals 2022, 12, 1185. [Google Scholar] [CrossRef]
- Deng, J.; Yang, L.Q.; Groves, D.I.; Zhang, L.; Qiu, K.F.; Wang, Q.F. An Integrated Mineral System Model for the Gold Deposits of the Giant Jiaodong Province, Eastern China. Earth-Sci. Rev. 2020, 208, 103274. [Google Scholar] [CrossRef]
- Deng, J.; Wang, Q.F.; Zhang, L.; Xue, S.C.; Liu, X.F.; Yang, L.; Yang, L.Q.; Qiu, K.F.; Liang, Y.Y. Metallogenetic Model of Jiaodong–type Gold Deposits, Eastern China. Sci. China Earth Sci. 2023, 66, 2287–2310. [Google Scholar] [CrossRef]
- Yang, L.Q.; Deng, J.; Zhang, L.; Zhao, A.H.; Santosh, M.; Yu, X.F.; Yang, W.; Li, D.P.; Shan, W.; Xie, D.; et al. Mantle–rooted Fluid Pathways and World–class Gold Mineralization in the Giant Jiaodong Gold Province: Insights from Integrated Deep Seismic Reflection and Tectonics. Earth-Sci. Rev. 2024, 255, 104862. [Google Scholar] [CrossRef]
- Sun, Y.M.; Zhang, L.; Yang, L.Q.; Li, D.P.; Zhang, Y.; Li, Z.S.; Chen, G.D.; Sun, X.J.; Wang, H.S.; Wang, Y.Q. Mineralogical Characteristics and Genesis of Trapiche-like Sapphire in Changle, Eastern North China Craton. Minerals 2024, 14, 364. [Google Scholar] [CrossRef]
- Song, M.C.; Xu, X.S.; Song, Y.X.; Xiao, B.J.; Zhou, D.S.; Gao, C.S.; Feng, A.P. Types, Sources, and Regional Crust-Mantle Evolution Background of Diamonds in the Western Shandong Province. Acta Geol. Sin. 2020, 94, 2606–2625, (In Chinese with English Abstract). [Google Scholar]
- Zhang, C.J.; Tian, J.X.; Chen, W.T.; Zhang, Z.Q.; Du, S.X. The Magmatic Intrusive Sequence and the Metallogenic Model of Diamondiferous Kimberlite in the Mengyin area, Western Shandong. Acta Geol. Sin. 2020, 94, 2666–2675, (In Chinese with English Abstract). [Google Scholar]
- Zhang, P.Q. Origin of Kimberlitic Pipes in Shandong Province. Ph.D. Thesis, China University of Geosciences (Beijing), Beijing, China, 2006. (In Chinese with English Abstract). [Google Scholar]
- Chu, Z.Y. Study on Characteristics and Diamondiferous Significance of the Mengyin Kimberlite in Shandong Province, China. Master’s Thesis, China University of Geosciences (Beijing), Beijing, China, 2019. (In Chinese with English Abstract). [Google Scholar]
- Wang, Z.B.; Lv, Q.; Ge, Y.J.; Wang, Q.J. Study on Characteristics of “Niulan Structure” and Its Constraints on Mengyin Kimberlite Belt. Shandong Land Resour. 2013, 29, 1–5, (In Chinese with English Abstract). [Google Scholar]
- Wang, H.S.; Yang, L.Q.; Chu, Z.Y.; Zhang, L.; Li, N.; He, W.Y.; Zhang, Y.N.; Wang, Y.Q. Ancient Metasomatism in the Lithospheric Mantle, Eastern North China Craton: Insights from In-Situ Major and Trace Elements in Garnet Xenocrysts, Mengyin District. Minerals 2023, 13, 1106. [Google Scholar] [CrossRef]
- Zhao, X.F.; Chu, Z.Y. Comprehensive Prospecting Mode of Primary Diamond Deposit in Deep Changma Area in Mengyin county of Shandong Province. Shandong Land Resour. 2016, 32, 17–25, (In Chinese with English Abstract). [Google Scholar]
- Sun, C.Y.; Lu, T.J.; Song, Z.H.; He, M.Y.; Deng, Y. Analysis of Abnormal Birefringence and Graphite Inclusions in Zimbabwean Diamonds. Rock Miner. Anal. 2022, 41, 199–210, (In Chinese with English Abstract). [Google Scholar]
- Brozel, M.R.; Evans, T.; Stephenson, R. Partial Dissociation of Nitrogen Aggregates in Diamond by High Temperature-high Pressure Treatments. Proc. R. Soc. Lond. A Math. Phys. Sci. 1978, 361, 109–127. [Google Scholar]
- Wan, Z.Z.; Peng, M.S.; Meng, Y.F. Spectroscopic Studies on Irradiated Enhanced Fancy Color Diamonds. Mineral. Petrol. 2005, 3, 47–51, (In Chinese with English Abstract). [Google Scholar]
- Day, M.C.; Jollands, M.C.; Novella, D.; Nestola, F.; Dovesi, R.; Pamato, M.G. Hydrogen-related Defects in Diamond: A Comparison Between Observed and Calculated FTIR Spectra. Diam. Relat. Mater. 2024, 143, 110866. [Google Scholar] [CrossRef]
- Goss, J.P.; Briddon, P.R.; Hill, V.; Jones, R.; Rayson, M.J. Identification of Structure of the 3107 cm-1 H-related Defect in Diamond. J. Phys. Condens. Matter 2014, 26, 145801. [Google Scholar] [CrossRef]
- Gaillou, E.; Post, J.E.; Rost, D.; Butler, J.E. Boron in Natural Type IIb Blue Diamonds: Chemical and Spectroscopic Measurements. Am. Mineral. 2012, 97, 1–18. [Google Scholar] [CrossRef]
- Huong, P.V. Diamond and Diamond Simulants as Studied by Micro-Raman Spectroscopy. Mater. Sci. Eng. B 1992, 11, 235–242. [Google Scholar] [CrossRef]
- Zhang, B.L.; Chen, H.; Qiu, Z.L.; Lu, T.J. The Diamond Origin Study Under the Framework of the United Nations Kimberley Process; Geological Publishing House: Bath, UK, 2013; ISBN 978-7-116-08653-1. [Google Scholar]
- Sumiya, H.; Toda, N.; Nishibayashi, Y.; Satoh, S. Crystalline Perfection of High Purity Synthetic Diamond Crystal. J. Cryst. Growth 1997, 178, 485–494. [Google Scholar] [CrossRef]
- Shen, A.H.; Koivula, J.I.; Shigley, J.E. Identification of Extraterrestrial Peridot by Trace Elements. Gems Gemol. 2011, 47, 208–213. [Google Scholar] [CrossRef]
- Thuyet, N.T.M.; Hauzenberger, C.; Khoi, N.N.; Diep, C.T.; Lam, C.V.; Minh, N.T.; Hoang, N.; Hager, T. Peridot from the Central Highlands of Vietnam: Properties, Origin, and Formation. Gems Gemol. 2016, 52, 276–287. [Google Scholar] [CrossRef]
- Walter, M.J.; Thomson, A.R.; Smith, E.M. Geochemistry of Silicate and Oxide Inclusions in Sublithospheric Diamonds. Rev. Mineral. Geochem. 2022, 88, 393–450. [Google Scholar] [CrossRef]
- Schulze, D.J.; Harte, B.; Valley, J.W.; Brenan, J.M.; Channer, D.M.D.R. Extreme Crustal Oxygen Isotope Signatures Preserved in Coesite in Diamond. Nature 2003, 423, 68–70. [Google Scholar] [CrossRef] [PubMed]
- Wang, W. Formation of Diamond with Mineral Inclusions of “Mixed” Eclogite and Peridotite Paragenesis. Earth Planet. Sci. Lett. 1998, 160, 831–843. [Google Scholar] [CrossRef]
- Qu, M.W.; Zhong, Y.; Shen, X.T. Gemological Characteristic of Purple-Brownish Red Garnet from Zambia. J. Gems Gemmol. 2021, 23, 20–28, (In Chinese with English Abstract). [Google Scholar]
- Wang, W.; Sueno, S.; Takahashi, E.; Yurimoto, H.; Gasparik, T. Enrichment Processes at the Base of the Archean Lithospheric Mantle: Observations from Trace Element Characteristics of Pyropic Garnet Inclusions in Diamonds. Contrib. Mineral. Petrol. 2000, 139, 720–733. [Google Scholar] [CrossRef]
- White, S.N. Laser Raman Spectroscopy as a Technique for Identification of Seafloor Hydrothermal and Cold Seep Minerals. Chem. Geol. 2009, 259, 240–252. [Google Scholar] [CrossRef]
- Khokhryakov, A.F.; Nechaev, D.V.; Sokol, A.G.; Palyanov, Y.N. Formation of Various Types of Graphite Inclusions in Diamond: Experimental Data. Lithos 2009, 112, 683–689. [Google Scholar] [CrossRef]
- Nechaev, D.V.; Khokhryakov, A.F. Formation of Epigenetic Graphite Inclusions in Diamond Crystals: Experimental Data. Russ. Geol. Geophys. 2013, 54, 399–405. [Google Scholar] [CrossRef]
- Ma, Y.; Wang, Q.; Qiu, Z.L.; Lu, T.J.; Li, L.F.; Chen, H.; Deng, X.Q.; Bo, H.N. In-Situ Raman Spectroscopy Testing and Genesis of Graphite Inclusions in Alluvial Diamonds from Hunan. Spectrosc. Spectr. Anal. 2018, 38, 1753–1757, (In Chinese with English Abstract). [Google Scholar]
- Yang, M.X. Characters of Birefringence in Diamond and Their Implication. J. Gems Gemmol. 2000, 38, 68–69, (In Chinese with English Abstract). [Google Scholar]
- Chen, J.J.; Luo, Y.P. Identification of Natural Type IIa Colourless Diamond with 270 nm Absorption Peak of UV-Visible Spectrum. J. Gems Gemmol. 2020, 22, 44–48, (In Chinese with English Abstract). [Google Scholar]
- Lian, D.Y.; Yang, J.S.; Liu, F.; Wu, W.W. Diamond Classification, Compositional Characteristics, and Research Progress: A Review. Earth Sci. 2019, 44, 3409–3453, (In Chinese with English Abstract). [Google Scholar]
- Qiu, Z.L.; Wang, Q.; Qin, S.C.; Yuan, Z.; Sun, Y.; Lu, T.J.; Li, L.F.; Zhang, J. In-situ Analysis of Mineral Inclusions in Alluvial Diamonds from Hunan: Insights into the Provenance and Origin of the Diamonds. Geotecton. Metallog. 2014, 38, 590–597, (In Chinese with English Abstract). [Google Scholar]
- Izraeli, E.S.; Harris, J.W.; Navon, O. Raman Barometry of Diamond Formation. Earth Planet. Sci. Lett. 1999, 173, 351–360. [Google Scholar] [CrossRef]
- Richardson, S.H.; Harris, J.W. Antiquity of Peridotitic Diamonds from the Siberian Craton. Earth Planet. Sci. Lett. 1997, 151, 271–277. [Google Scholar] [CrossRef]
- Taylor, W.R.; Jaques, A.L.; Ridd, M. Nitrogen-Defect Aggregation Characteristics of Some Australasian Diamonds; Time-Temperature Constraints on the Source Regions of Pipe and Alluvial Diamonds. Am. Mineral. 1990, 75, 1290–1310. [Google Scholar]
- Cartigny, P.; Harris, J.W.; Javoy, M. Diamond Genesis, Mantle Fractionations and Mantle Nitrogen Content: A Study of δ13C–N Concentrations in Diamonds. Earth Planet. Sci. Lett. 2001, 185, 85–98. [Google Scholar] [CrossRef]
- Sokol, A.G.; Palyanov, Y.N.; Tomilenko, A.A.; Bul’bak, T.A.; Palyanova, G.A. Carbon and Nitrogen Speciation in Nitrogen-rich C-O-H-N Fluids at 5.5–7.8 GPa. Earth Planet. Sci. Lett. 2017, 460, 234–243. [Google Scholar] [CrossRef]
- Sokol, A.G.; Tomilenko, A.A.; Bul’bak, T.A.; Palyanova, G.A.; Sokol, I.A.; Palyanov, Y.N. Carbon and Nitrogen Speciation in N-poor C-O-H-N Fluids at 6.3 GPa and 1100–1400 °C. Sci. Rep. 2017, 7, 706. [Google Scholar] [CrossRef]
- Beskrovanov, V.V.; Zheng, J.P.; Zhang, H.F.; Wang, W.K. The Growth Process of Natural Diamond. Earth Environ. 1989, 66, 73–74, (In Chinese with English Abstract). [Google Scholar]
- Chen, M.; Shu, J.; Xie, X.; Tan, D.; Mao, H.K. Natural Diamond Formation by Self-redox of Ferromagnesian Carbonate. Proc. Natl. Acad. Sci. USA 2018, 115, 2676–2680. [Google Scholar] [CrossRef] [PubMed]
- Gurney, J.J.; Helmstaedt, H.H.; Le Roex, A.P.; Nowicki, T.E.; Westerlund, K.J.; Richardson, S.H. Diamonds: Crustal Distribution and Formation Processes in Time and Space and an Integrated Deposit Model. Centen. Celebr. Symp. Soc. Econ. Geol. 2005, 1, 143–177. [Google Scholar]
- Smith, C.P.; Bosshart, G.; Ponahlo, J.; Hammer, V.M.; Klapper, H.; Schmetzer, K. GE POL diamonds: Before and after. Gems Gemol. 2000, 36, 192–215. [Google Scholar] [CrossRef]
- Stachel, T.; Harris, J.W.; Muehlenbachs, K. Sources of Carbon in Inclusion Bearing Diamonds. Lithos 2009, 112, 625–637. [Google Scholar] [CrossRef]
- Jacob, D.E. Nature and Origin of Eclogite Xenoliths from Kimberlites. Lithos 2004, 77, 295–316. [Google Scholar] [CrossRef]
- Zhang, Y.F.; Wang, C.; Zhang, J.F.; Wu, X.; Zhu, F. The Decarbonization of Deeply Subducted Oceanic Crusts and Genesis of Super-deep Eclogitic Diamonds: Progresses and Challenges. Bull. Mineral. Petrol. Geochem. 2024, 43, 1160–1170, (In Chinese with English Abstract). [Google Scholar] [CrossRef]
- Zhao, X.F. Geological Characteristics and Genesis of Diamond Deposits at the Depth and Periphery of the Xiyu Mining Area in Mengyin, Shandong Province. East China Geol. 2019, 40, 135–142. [Google Scholar]
- Qin, L.L. Study on the Diamond and the Inclusion from North Craton Area. Master’s Thesis, China University of Geosciences (Beijing), Beijing, China, 2019. (In Chinese with English Abstract). [Google Scholar]
- Fedortchouk, Y. A New Approach to Understanding Diamond Surface Features Based on a Review of Experimental and Natural Diamond Studies. Earth-Sci. Rev. 2019, 193, 45–65. [Google Scholar] [CrossRef]
Disclaimer/Publisher’s Note: The statements, opinions and data contained in all publications are solely those of the individual author(s) and contributor(s) and not of MDPI and/or the editor(s). MDPI and/or the editor(s) disclaim responsibility for any injury to people or property resulting from any ideas, methods, instructions or products referred to in the content. |
© 2025 by the authors. Licensee MDPI, Basel, Switzerland. This article is an open access article distributed under the terms and conditions of the Creative Commons Attribution (CC BY) license (https://creativecommons.org/licenses/by/4.0/).