Article

Dependence of Bubble Size on Magnesite Flotation Recovery Using Sodium Oleate (NaOL) with Different Frothers

1
Department of Mining Engineering, Faculty of Engineering, Istanbul University Cerrahpaşa, 34500 Istanbul, Turkey
2
Institute of Chemistry and Chemical Technology, Mongolian Academy of Sciences, Peace Avenue, MAS 4th Building, Bayanzurkh District, Ulaanbaatar 13330, Mongolia
3
Department of Mining Engineering, Faculty of Engineering, Adana Alparslan Turkes Science and Technology University, 01250 Adana, Turkey
4
Department of Mineral Processing Engineering, Faculty of Mines, Istanbul Technical University, 34469 Istanbul, Turkey
*
Authors to whom correspondence should be addressed.
Minerals 2025, 15(8), 849; https://doi.org/10.3390/min15080849
Submission received: 27 June 2025 / Revised: 29 July 2025 / Accepted: 5 August 2025 / Published: 9 August 2025
(This article belongs to the Special Issue Particle–Bubble Interactions in the Flotation Process)

Abstract

Developments of new research tools in flotation studies, including bubble–particle attachment time efficiency and dynamic froth analysis, can help improve our understanding of particle–bubble interactions in flotation processes. In particular, the selection of new collectors and frothers, and their mixtures can provide a wide distribution of bubble sizes at their respective concentrations. In the literature, several studies have reported the effect of different frothers and collector mixtures on bubble characteristics like bubble size and critical coalescence concentration (CCC). The general trend obtained from these studies showed that the addition of frothers, along with collectors, which also act as frothers during flotation, resulted in finer bubbles and required lower concentrations of frothers, which in turn positively affected the flotation recoveries. In this study, an attempt was made to study fine-sized magnesite in the presence of sodium oleate (NaOL) and five different types of frothers (PPG600, PPG400, BTPG, BDPG, and MIBC). Bubble–particle attachment time with different sized capillary tubes and dynamic froth analysis values in a liquid–air system, along with flotation recoveries in a micro-flotation cell, were interpreted to show possible correlations and provide an optimum bubble/particle size ratio in the presence of different frothers.

Graphical Abstract

1. Introduction

In recent years, many investigations have been carried out to develop flotation conditions, such as reagent regimes [1,2,3,4,5] and particle-based properties [6,7,8,9,10]. In these studies, the effect of different reagents was investigated to maximize flotation recovery and, consequently, the success of the enrichment process. In this context, in addition to flotation tests, several methods like particle–bubble attachment time [11,12,13,14,15], and zeta potential measurements [16,17,18,19,20] clearly showed that inappropriate selection of parameters such as pH, water content, and type and concentration of reagents can lead to significant losses in flotation grades and recoveries of valuable minerals.
The success that initiates the formation of a bubble–particle cluster depends on the physicochemical state of the mineral and bubble surfaces. The electrical double layer on the mineral surface allows the specific adsorption of collectors, whereas other ions in the solution can adsorb on the outer layer. Knowledge of the zero point of charge (zpc/iep) on the mineral surface makes it possible to bind a collector molecule to compensate for the excess surface energy. The zeta potential value is particularly important for oxide minerals, where the adsorption of collectors is dependent on the surface charge [16]. In flotation, the collision probability in the collection zone is governed by the hydrodynamics of bubble–particle interactions [21]. In general, flotation occurs when hydrophobic mineral particles collide with bubbles, adhere to the liquid–particle interface, and form stable particle–bubble clusters that are lifted against gravity toward the foam zone [22].
Accordingly, the relationship between particle size and buoyancy is presented in detail by Gaudin et al. (1931), which shows that especially fine particles are more difficult to recover than medium-sized particles [23]. As the particle size decreases, the probability of collision becomes inversely proportional to the bubble size, which suggests that the improved recovery of fine-sized particles by flotation can be achieved by using fine-sized bubbles. Such methods have been the focus of many studies on the production of fine-sized bubbles, including dissolved air flotation [24] and pico bubbles [25]. Miettinen et al. (2010) [26] published a review on the flotation limits of fine particles, showing the importance of key parameters such as bubble size, particle aggregation, and flow conditions in fine particle flotation. In one of our recent papers, Batjargal et al. (2023) showed that more bubbles and foam are produced in the collector mixing system with this particular frother, and the foam is more stable in the presence of fine bubbles [22]. The problem of dealing with fine particles has preoccupied mineral flotation engineers for more than a century. This issue, driven by the energy and water minimization requirements and the finely disseminated nature of many ore deposits, is becoming more important today. As is also known from the literature, bubble size decreases rapidly up to a transition value called the critical coalescence concentration (CCC) [27,28]. Although bubble size does not decrease significantly at concentrations above the CCC, it leads to increased water recovery into the foam and, consequently, to increased non-selective particle entrainment [29,30,31].
Considering the importance of these parameters on the flotation recovery of fine-sized minerals, a detailed investigation is needed to show the nature of bubble–particle interactions in the presence of the gas phase for modeling their flotation responses. Thus, considering the significant role of mining in the economic development of many countries worldwide, the current economic impact of mining should be considered within the context of current trends in the industry [32].
Although there are numerous studies in the literature showing the performance of different frothers and frother–collector mixtures on the flotation recovery of industrial minerals, in this study we focused on improving magnesite flotation recovery with different frother types (to the best of our knowledge, most studies focus on known frother types) and presented a correlation between bubble size and flotation recoveries. Therefore, magnesite was particularly selected for this study due to its industrial significance in refractory materials, environmental applications, and its challenging flotation behavior. Fine particle flotation is especially important in magnesite beneficiation because the mineral often occurs in a microcrystalline, finely disseminated form (with a size below 38 µm). In this study, the effects of frother characteristics on the flotation of fine-sized magnesite particles were investigated as a function of collector concentration in the presence of different frothers. Another series of tests was conducted to find a possible correlation between bubble–particle attachment time, micro-flotation recoveries, and bubble-to-particle size ratios against foam production values in air-liquid and solid–air–liquid systems.

2. Materials and Methods

2.1. Materials

The magnesite sample used in this study was obtained from Grecian Magnesite Mining Company, Athens, Greece. The sample is one of the commercial products of the company named Kerma, which is known for its high MgCO3 content of 90.0% on average. In experimental studies, the effects of commercial frothers, namely PPG400, PPG600, BTPG, BDPG, and MIBC, obtained from BASF (Badische Anilin- und Sodafabrik, Ludwigshafen am Rhein, Germany), and sodium oleate (NaOL) as a collector supplied by Merck (Kenilworth, NJ, USA) were used for investigating the effect of collector + frother mixtures. The properties of these reagents were reported in our previous paper [33]. As is well-known, the relationship between the hydrocarbon chain, the number and position of functional groups, and the molecular weight of the foaming agent significantly influences the properties of flotation bubbles. These properties include the effect on surface tension [33], critical coalescence concentration (CCC) [33], hydrophilic–lipophilic balance (HLB) [34], adsorption kinetics and bubble size distribution (BSD) [35], dynamic foam stability (DFS), and foam decay [36,37]. As a result, we selected these commercially available frothers of low consumption dosage, namely polypropylene glycols (PPG 400 and PPG 600), tripropylene glycol (BTPG), dipropylene glycol (BDPG), and methyl isobutyl carbinol (MIBC) as reference frothers, and evaluated the flotation efficiency of magnesite in a mixed system using sodium oleate (NaOL) as the collector. The properties of frothers and collectors are presented in Table 1 and Table 2, respectively.
These frothers were purposefully selected because of their diverse molecular weights, chain structures, and polarities, which significantly influence froth stability, bubble size, and drainage behavior. As presented in Table 2, these structural differences of the frothers also affect the CCC and bubble formation properties of each frother. In our previous studies [34,35,36], the relationship between frother properties and bubble size was already established. However, the current study aimed to extend this by correlating bubble size, flotation recovery, and bubble–particle attachment time to propose a more comprehensive understanding of how frother type affects flotation performance through its control of bubble dynamics.
All the glassware was rinsed with ethylene alcohol of 99% purity (Merck) and washed with pure water, followed by steam cleaning and drying in a clean oven. All the experiments and measurements were conducted at a constant room temperature of 23 ± 1 °C. In addition, NaOH (99% purity) and HCl (37% purity) were used to adjust the pH of the suspensions during the zeta potential measurements.

2.2. Methods

2.2.1. Sample Preparation

The size of the original sample was under 38 µm; therefore, the particles under 38 µm were split into the size range of 38 × 20 µm2 by a controlled settling procedure. The details of the procedure were reported in our previous study [22]. Following that, while the particles in the size range of 38 × 20 µm2 were used for the micro-flotation and bubble–particle attachment tests, the fraction under 10 µm was used for the zeta potential measurements. The particle size distributions of the magnesite samples were determined by the laser light scattering technique (Malvern Particle Sizer 3000, Malvern Instruments, Malvern, UK).

2.2.2. Zeta Potential Measurements

In this series of measurements, two parameters, namely (i) the zeta potential–pH profile of pure fine-particle magnesite samples in distilled water and (ii) the variation in the surface charge of magnesite under different collector concentrations, were examined. Zeta potential measurements were made by an electrophoretic method using a Brookhaven Zetaplus Analyzer (Brookhaven Instrument Ltd., Holtsville, NY, USA). In this method, the particles subjected to an electric current move according to their electric charges, and the device measures the speed of the movement of the particles. The zeta potential is calculated according to the Smoluchowski equation [20].
During these measurements, a sample of 0.25 g magnesite (−10 μm in size) was mixed with 50 mL of distilled water in a 100 mL beaker using a magnetic stirrer at 500 rpm for 5 min. The desired pH values were achieved by using 0.1 mol/L HCl for the acidic medium and 0.1 mol/L NaOH (stock solutions). Next, these suspensions were mixed for 5 min, and the system was brought to equilibrium in terms of pH. Approximately 3 mL of aliquots were taken from the suspensions and transferred to the zeta potential measurement cell of 4 mL in volume, and zeta potential measurements were carried out. The pH profile of magnesite shows that the natural pH of magnesite is 9.41, which agrees with the literature [38]. Zeta potential measurements were undertaken at different pH values, starting from 4.70 up to 11.3, to obtain the iep of magnesite. The standard deviation value of the measurements was maintained at around ±2 mV.
During the second series of measurements, the dependence of collector concentration on the zeta potential of magnesite was determined using 0.25 g (−10 μm) magnesite sample in 50 mL collector solution in the range of 1 × 10⁻⁵–1 × 10⁻³ mol/L. In each measurement, the zeta potential was repeated 20 times, and the average value was recorded as the final value. All zeta potential measurements were performed at room temperature (23 °C). The standard deviation value of the measurements was kept around ±2 mV.
Meanwhile, it is a valid concern in flotation and surface chemistry studies involving the zeta potential measurements for magnesite (MgCO3) in the presence of acid (HCl) to adjust pH in magnesite flotation systems. HCl can cause a surface dissolution reaction, releasing CO2 gas and forming Mg2+ ions, potentially altering the mineral’s surface chemistry and zeta potential. As seen in the following reaction:
MgCO3(s) + 2HCl→MgCl2(aq) + CO2(g) + H2O
In our study, the acid was added gradually under constant stirring to avoid local acid concentration spikes and minimize rapid dissolution. No visible bubbling (CO2 release) or cloudiness was observed during pH adjustment, suggesting that the reaction rate was moderate. Nonetheless, we acknowledge that partial surface alteration and ion exchange may have occurred, which could influence zeta potential results. Therefore, we performed all our flotation and other experiments at magnesite’s natural pH of 9.4.

2.2.3. Bubble–Particle Attachment Measurements

The most important stage in a successful flotation process is the bubble–particle attachment step, which depends on many factors, including the surface chemistry and physical properties of particles as well as bubbles. In general, contact angle measurements are often used in flotation studies to describe the extent of wetting or the hydrophobicity of a surface. However, many studies have shown that this method cannot always predict the flotation properties of minerals [39,40,41,42]. Bubble attachment time is the time required for bubble–particle attachment to occur, and it is strongly controlled by the surface chemistry of the mineral and bubble. The bubble attachment time experiments can be carried out to measure the hydrophobicity of mineral particles either in their natural state or with surfactant addition. The device developed by Glembockij (1953) [43] has been used by many researchers, and a strong relationship was found between bubble–particle attachment time and flotation performance [39,40,41,44,45,46,47,48,49]. These results demonstrated that high flotation recovery is achieved with minimum attachment time. A comprehensive review of the studies in the literature is presented by Albijanic et al. (2010) [14].
In this measurement technique, a retained bubble formed using a microsyringe at the tip of a glass capillary is pushed down through the cell containing the particle bed and the liquid phase, and the bubble tip is kept in contact with the particle bed (~2.5 mm) for a controlled contact time from 1 to 1000 ms. The bubble is then returned to its original position together with the glass capillary. The bubble and glass capillary during this time are observed with a digital camera to determine whether the particles attached to their surface after a controlled contact time. Finally, the bubble–particle attachment time efficiency value (BPATE) was calculated using Equation (1):
B P A T E % = Number   of   observed   successful   attachments Total   number   of   observations × 100
In our case, the incentive for the bubble–particle attachment time experiments was to determine the floatability behaviour of magnesite particles in their natural state in distilled water. For this reason, the measurements were carried out in the presence of only sodium oleate (NaOL), in order to identify the contribution of NaOL alone to the hydrophobicity and bubble size distribution.
For this purpose, first, a 0.5 g pure magnesite sample and 50 mL collector solution (1% solids ratio) were conditioned for 10 min to ensure that the collector was effectively adsorbed on the mineral surface. After the conditioning process, the suspension was kept for 2 min to obtain stable conditions, and a sufficient amount of sample (following the settling of relatively coarse particles) was taken and placed in the measuring cell (4 mL). The bubble–particle attachment time experiments were performed with the BKT-100 model device by Bratton Engineering and Technical Associates, LLC (Wilmington, DE, USA). A schematic representation of the measurements is also given in Figure 1.
The bubble–particle measurements were made using three different sizes of glass capillaries (0.5 mm, 1 mm, and 2 mm). It is assumed that the sizes of the bubble and the capillary tube were the same. Our previous results indicated that the bubble–particle attachment efficiency was proportional to the capillary pressure and the size of the bubble [26,35]. A series of measurements was conducted at different concentrations, such as 1 × 10⁻⁵, 5 × 10⁻⁵, 1 × 10⁻⁴, 5 × 10⁻⁴, and 1 × 10⁻³ mol/L NaOL at 1, 10, 100, and 1000 ms contact times to determine the effect of collector concentration on attachment time. The bubble–particle attachment experiments were repeated 20 times for each concentration at different spots on the magnesite particle surfaces. This ensured high reproducibility of the results.

2.2.4. Micro-Flotation Experiments

The micro-flotation experiments were carried out with 38 × 20 µm2 magnesite particles using a 155 mL volume micro-flotation column cell (30 × 220 mm2) with a ceramic frit (pore size of 16 μm). In the experimental studies, 1 g of sample was first conditioned with the reagent solutions (frother and collector) at different concentrations for 5 min in a glass beaker with a volume of 250 mL at 480 rpm. All the experiments were carried out at a natural pH of 9.41 ± 0.10 to eliminate the effect of pH on the flotation recovery. When the conditioning was completed, the suspension was transferred to the flotation cell, and the samples were floated for 1 min using N2 gas at a flow rate of 50 cm3/min. The float and sink products of the flotation process were filtered and dried at 105 °C in an oven. The amount of magnesite particles in both float and sink products was determined by gravimetric analysis. The flotation recovery was calculated based on the weight of the floated concentrate compared to the feed. It is worth mentioning that all experiments were repeated thrice, and the flotation recoveries for each experiment were averaged.

3. Results and Discussion

3.1. Zeta Potential Measurements

The zeta potential value, which is based on the surface charge character of a mineral, is one of the most important parameters for silicate and oxide minerals in terms of explaining the adsorption of collectors. For this purpose, the zeta potential measurements were conducted to evaluate the surface charge characteristics of magnesite particles under different concentrations of NaOL. Understanding the zeta potential helps in identifying the magnitude of electrostatic interactions between mineral particles and bubbles, which influence both bubble–particle attachment efficiency and bubble coalescence behavior. These factors directly affect bubble size distribution and ultimately determine flotation recovery performance in the mixed collector–frother system. Toward this aim, first, the pH-dependent zeta potential profile of pure magnesite samples was determined, then a series of zeta potential measurements was carried out in the presence of NaOL.
Figure 2 illustrates the zeta potential profile of pure magnesite samples as a function of pH in the absence of NaOL. The measurements indicated that the iep value of magnesite was found to be 10.8. In some of the literature data, the iep/zpc values of magnesite were reported in the pH range of 6–7 [50,51,52], which varies with the purity and crystallinity of magnesite. The surface charge of magnesite was positive in a wide range of pH values lower than pH 10 and reached up to 2.8 mV at pH 10.5. In addition, at acidic pH values higher than pH 7, the surface charge of magnesite was positive, and the surface charge increased up to 26.3 mV at pH 4.5. The presence of ionic impurities in magnesite might have raised the iep value of our magnesite.
In another series of tests, the zeta potential of the magnesite sample was measured in the presence of NaOL at a natural pH of 9.41 (Figure 3). As seen in Figure 3, the positive value of zeta potential of magnesite particles in the absence of NaOL decreased with increasing NaOL concentration and eventually became negative at around 2 × 10⁻⁴ mol/L NaOL. Thus, considering the natural pH of magnesite as 9.41 and a zeta potential value of 11.30 mV at that pH value, the presence of an anionic collector, NaOL, was found to reduce the surface charge of pure magnesite to 10.66 mV at 5 × 10⁻⁵ mol/L and to −32.99 mV at 1 × 10⁻³ mol/L. This, in turn, indicated that the NaOL collector chemically adsorbed on the magnesite surface. Considering the adsorption characteristics of NaOL on magnesite surfaces, the bubble–particle attachment and flotation tests were carried out to find a relationship between bubble–particle interactions in the magnesite/NaOL system.
While the zeta potential behavior of magnesite in the presence of NaOL has been extensively studied in the literature, we performed our zeta potential measurements with our sample, considering the potential structural and compositional differences in the reagents and experimental conditions employed in earlier studies. This approach allows us to directly assess the interaction between NaOL and magnesite under our specific experimental conditions and generate system-specific data rather than relying solely on previously reported findings. These measurements not only confirmed the general behavior of the magnesite–NaOL interaction, but also allowed us to determine the optimal NaOL concentration range (5 × 10⁻⁵–1 × 10⁻⁴ mol/L) for subsequent flotation experiments.

3.2. Bubble–Particle Attachment Interactions

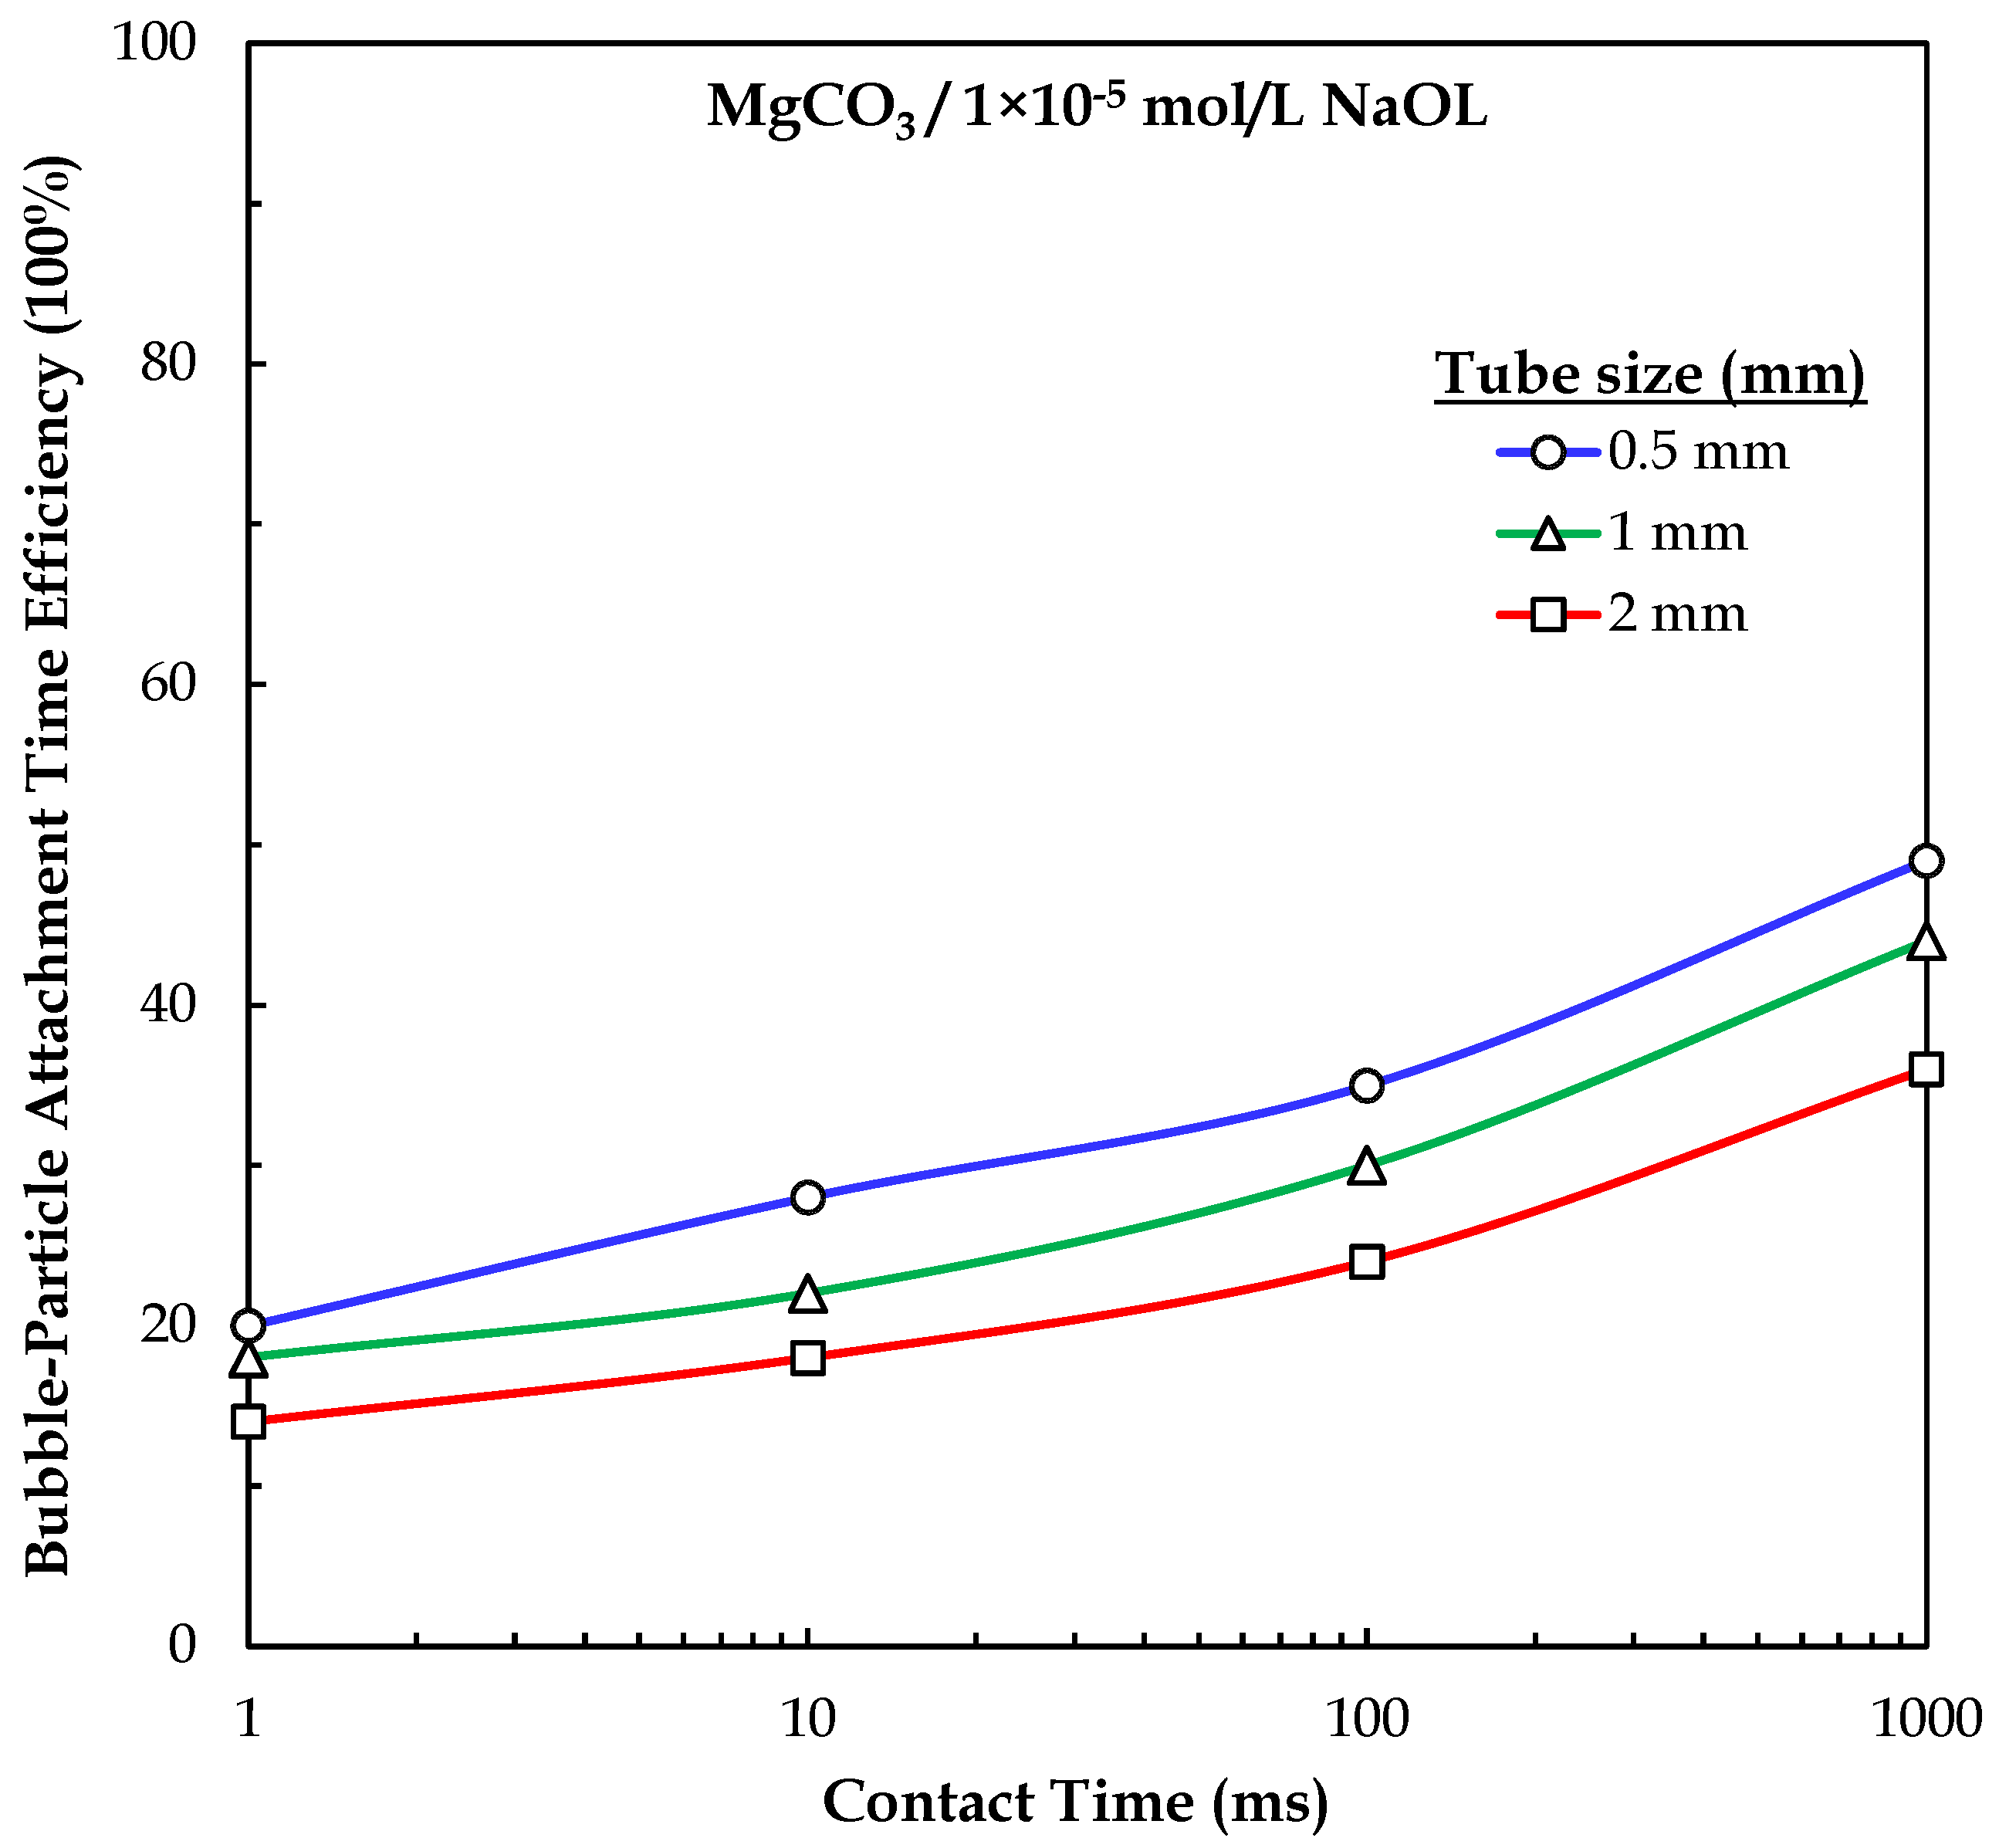
A series of tests was carried out with 38 × 20 µm2-sized magnesite particles to determine the effect of different collectors and frothers on bubble–particle interactions. As reported in the previous section, the results of the bubble–particle attachment time measurements made with three tubes of different diameters using only NaOL (1 × 10⁻⁵ mol/L) are shown in Figure 4.
As seen from Figure 4, in the presence of magnesite (38 × 20 µm2), using 1 × 10⁻⁵ mol/L NaOL in three different tubes (0.5 mm, 1 mm, and 2 mm in diameter), the bubble–particle attachment exhibited the highest efficiency for the 0.5 mm tube diameter and the lowest for the 2 mm tube diameter. For example, it was observed that the bubble–particle attachment increased by 18% in 10 ms for the 2 mm tube, 22% for the 1 mm tube, and 28% for the 0.5 mm tube. This clearly reveals that magnesite is hydrophilic, and the 1 × 10⁻⁵ mol/L concentration of NaOL is not enough to form sufficiently hydrophobic magnesite surfaces. This trend can be attributed to the better interaction of particles with finer bubbles, which agrees with previous literature reports [15].
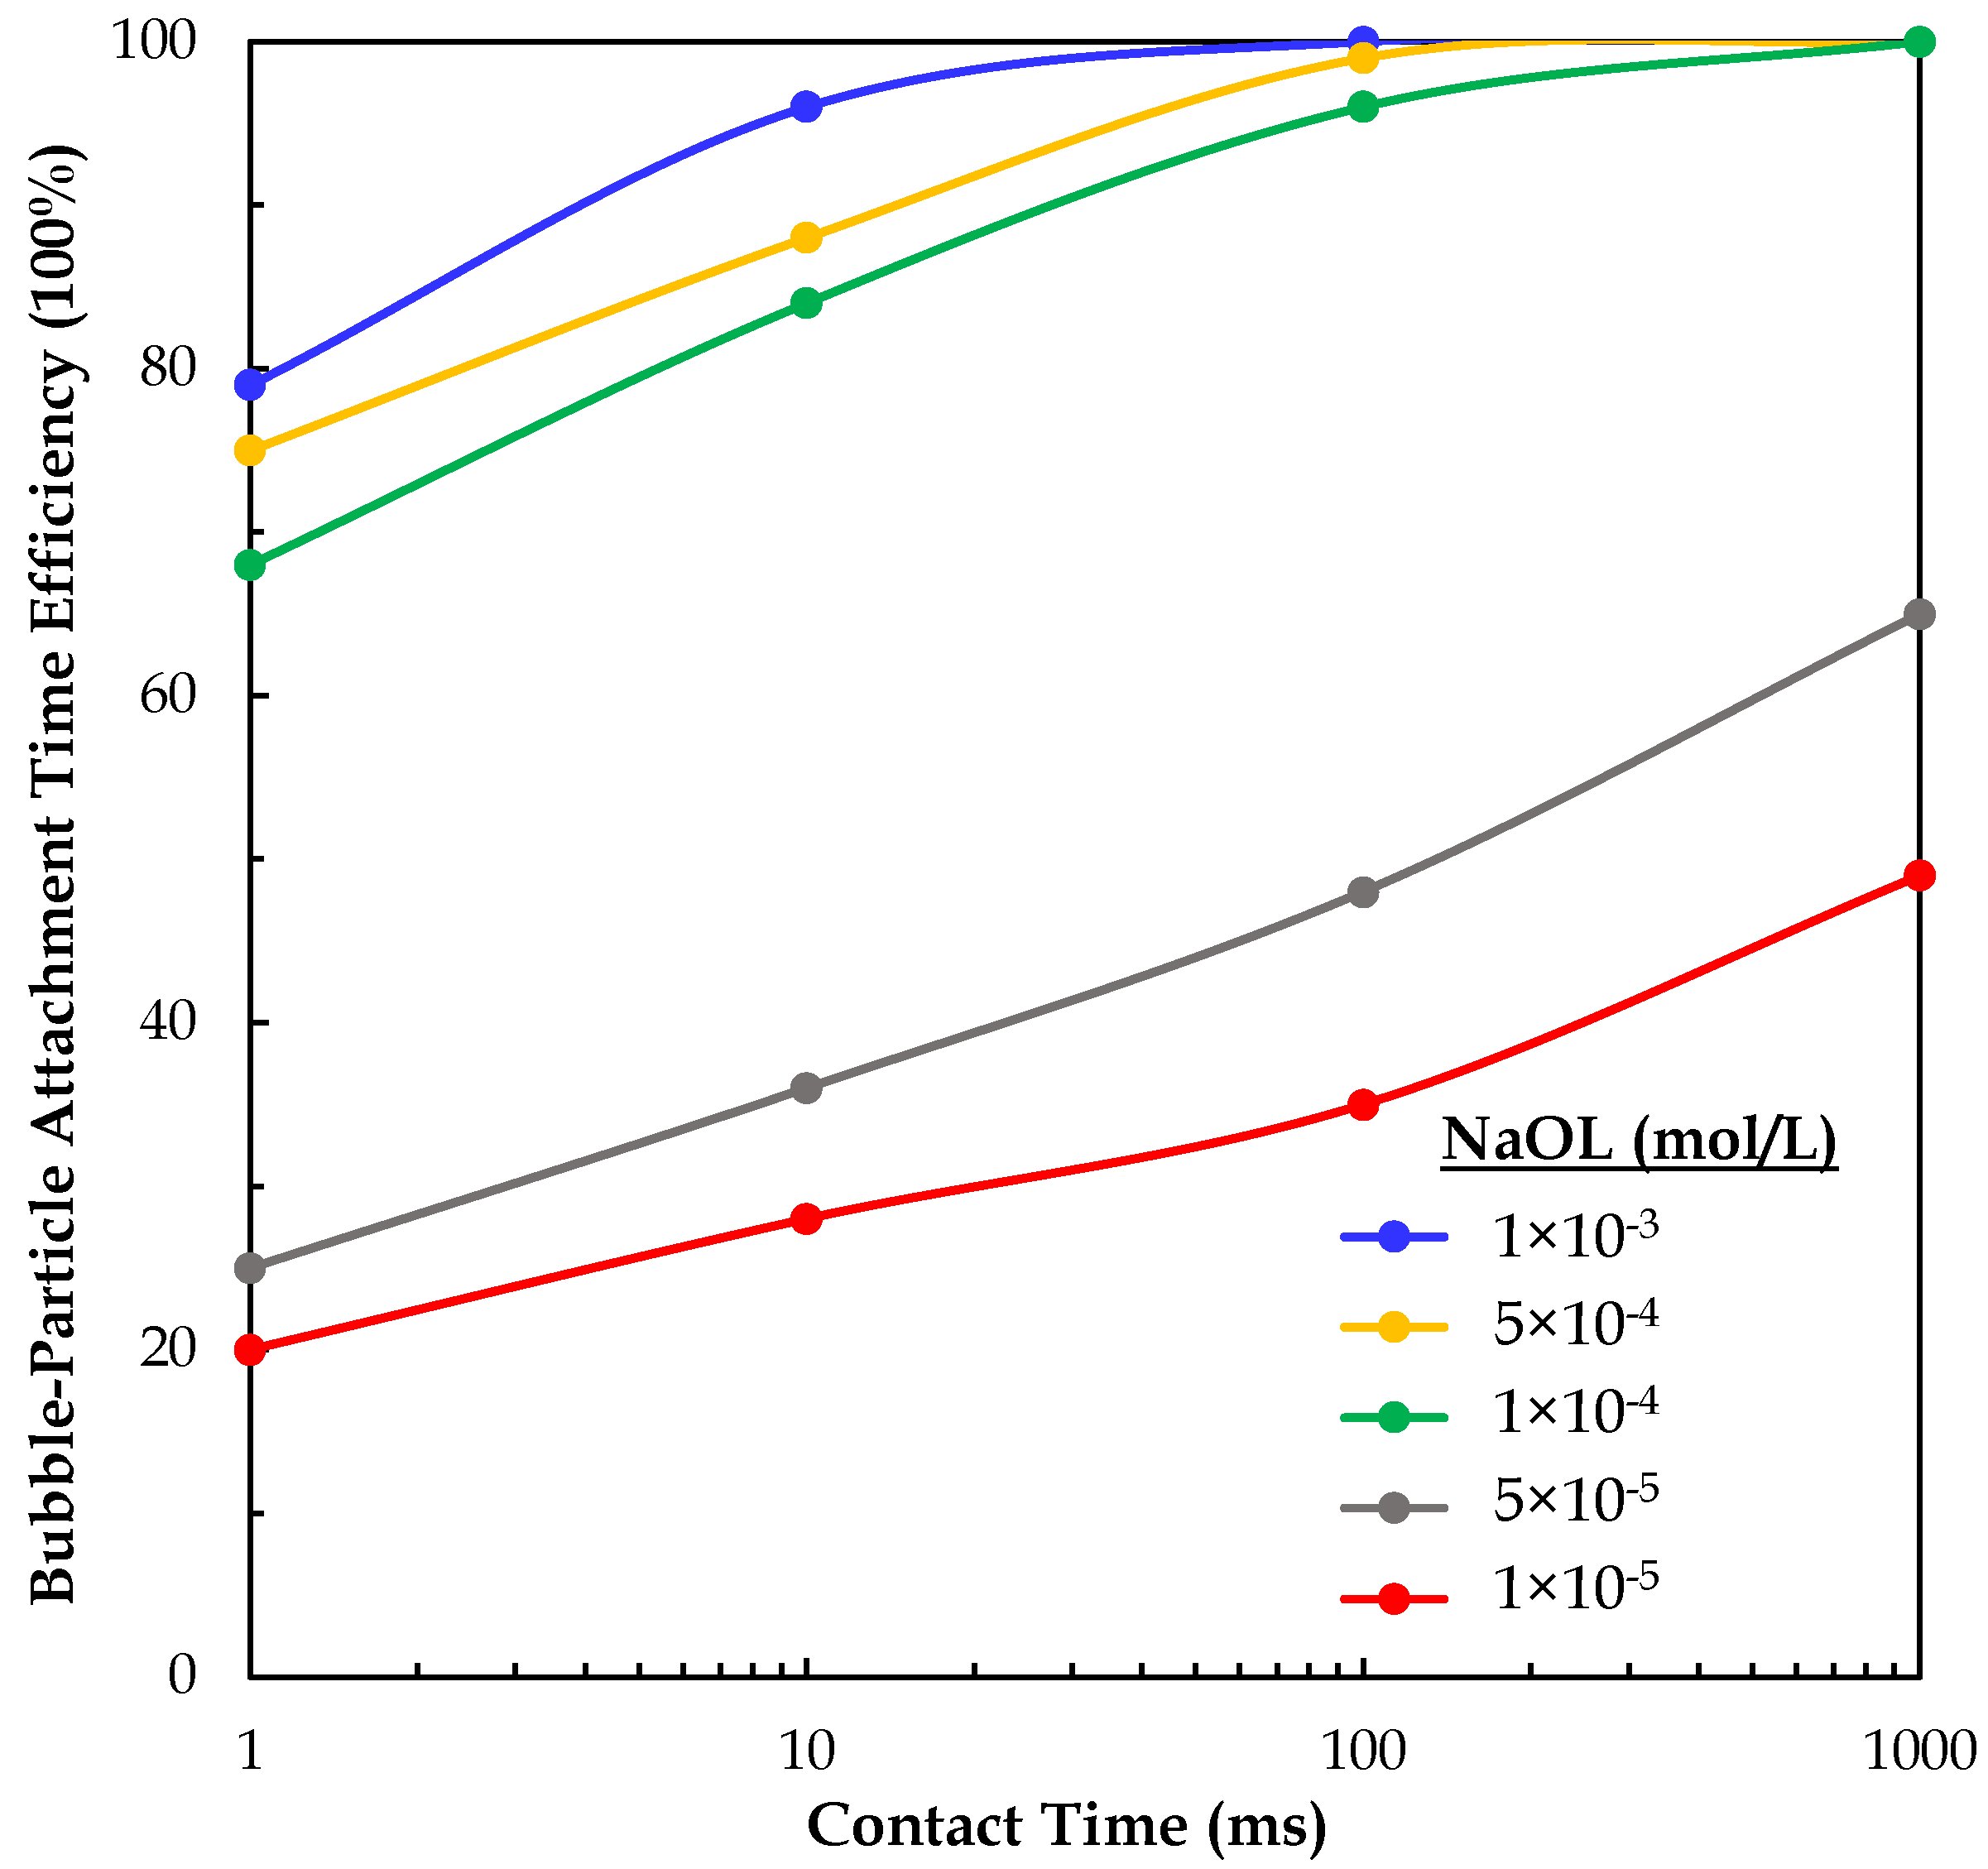
In this case, it is shown that magnesite should be made hydrophobic by increasing the concentration of NaOL for better floatability. Thus, the results of bubble–particle attachment of NaOL using magnesite within 38 × 20 µm2 as a function of collector concentration are shown in Figure 5.
As seen in Figure 5, bubble–particle attachment time efficiency increases with increasing concentration of NaOL and also increases with an increase in the contact time from 1 to 1000 ms. The twofold sharp increase in efficiency from 5 × 10⁻⁵ mol/L to 1 × 10⁻⁴ mol/L NaOL is particularly noticeable; the 5 × 10⁻⁵ mol/L NaOL concentration roughly corresponds to the hemimicelle concentration. Above 1 × 10⁻⁴ mol/L NaOL concentration, no significant increase in bubble–particle attachment is shown after 100 ms contact time. This feature of NaOL has been described previously [22]. The images taken during these measurements with magnesite and NaOL (Figure 6) clearly support the values shown in Figure 4 and Figure 5. As seen in Figure 6, NaOL showed fewer magnesite particle attachments at low concentrations.

3.3. Micro-Flotation Experiments

As mentioned in the previous sections, the zeta potential and bubble–particle attachment time characteristics of magnesite in the presence of different concentrations of NaOL clearly showed that collector concentration is the key parameter in the success of attachment. Sodium oleate (NaOL) significantly enhances magnesite flotation by adsorbing onto the mineral surface and forming a hydrophobic layer, which promotes bubble–particle attachment. The improved hydrophobicity reduces attachment time and increases recovery, particularly under alkaline conditions where collector adsorption is more favorable. 1. NaOL dissociates in water to form oleate ions (R–COO). 2. These oleate ions adsorb onto positively charged sites on the magnesite surface via electrostatic attraction and chemical bonding (e.g., complexation with surface Mg2+). 3. Adsorption is pH-dependent and more favorable in alkaline conditions (our ore natural pH > 9.4), where magnesite remains slightly positive or weakly negative but still reactive with oleate.
Mg(surface)2+ + R-COO−→Mg(R-COO)(surface)+
For this aim, the effect of different frothers on floatability was investigated with NaOL concentrations as in the previous tests. Prior to these tests, the effect of oleate concentration in the absence of magnesite was investigated along with foam production values with and without the presence of different frothers in the system, which was previously reported in the literature [22]. The Bickerman unit of foaminess involves the foaminess and foam decay curves and is defined as the ratio between the height of the stationary froth column and the superficial gas flow given through the porous bottom (Equation (2)):
Σ = h f o a m U g a s
where hfoam is the stationary height of the foam, while Ugas is the gas flow rate, and it is 0.2 L/min. The foam production is the ratio between the Bickerman unit of foaminess and the initial speed of froth decay after stopping the gas flow (Equation (3)):
F P = Σ d h d t   i n i t i a l
where dh/dt initial is the initial linear foam decay rate. The foam height and lifetime of a bubble that represent the dynamic stability of froth are quantitative parameters in the DFA technique. The foam rises in a column, and the height is measured as a function of time. The maximum height can be well correlated with foamability [22]. The flotation process used in ore preparation depends on the formation of a carefully controlled and stable foam. It also controls the amount of water recovered and thus the amount of mechanical transport. In flotation, the foam must be dynamically stable to bubble coalescence.
As shown in Figure 7, while the flotation recovery at 5 × 10⁻⁵ mol/L NaOL concentration in the absence of any frother was around 25.1%, it increased to 29.8% in the presence of 3 ppm CCC of PPG600. Similarly, the flotation recoveries of other frothers in the presence of 5 × 10⁻⁵ mol/L NaOL followed the order of BTPG < BDPG < PPG400 < MIBC < PPG600, corresponding to their CCC values. The CCC values of these frothers in the absence of NaOL were found to follow the order of PPG600 (3 ppm) < PPG400 (4 ppm) < BTPG (5 ppm) < MIBC (10 ppm) < BDPG (17 ppm), as reported in our previous publication [33]. On the other hand, while the foam production value was 0.70 s2/mm with 5 × 10⁻⁵ mol/L NaOL alone, it increased to 3.8 s2/mm with PPG400 and to 2.8 s2/mm with PPG600. At 5 × 10⁻⁵ mol/L NaOL concentration and within the CCC values, the foam production remained quite low, below 4 s2/mm. However, as shown in Figure 8, the foam production values above 5 × 10⁻⁵ mol/L NaOL concentration sharply increased and reached several hundred s2/mm levels below 1 × 10⁻³ mol/L NaOL concentration. Interestingly, upon plotting the air/liquid system and the foam production in the same system against NaOL concentration, both in the absence and presence of 3 ppm PPG600 illustrated a nice correlation. Moreover, the flotation recovery curve has also been introduced into the graph to compare the solid-(magnesite)–liquid–air system. It is shown that there is a reasonably good correlation between foam production and flotation recoveries as far as the inflection point is concerned; all three curves in Figure 8 coincided quite well at about 5 × 10⁻⁵ to 6 × 10⁻⁵ mol/L NaOL concentration; above this breakpoint, both flotation recoveries and foam production rate sharply increased. At about 5 × 10⁻⁴ mol/L NaOL concentration, while foam production reached a plateau, flotation recoveries still continued. It is interesting to note that a minimum of 1 s2/mm of foam production is required to pass the critical foam value, which corresponds to the hemimicelle concentration in oxide silicate systems [53], whereas plateau flotation recoveries require several hundred s2/mm in foaminess. This trend can be ascribed to the average bubble size (Sauter mean diameter; SMD) and the bubble size distribution in the liquid/gas phase and bubble-to-particle size ratio in the solid–liquid–air system.
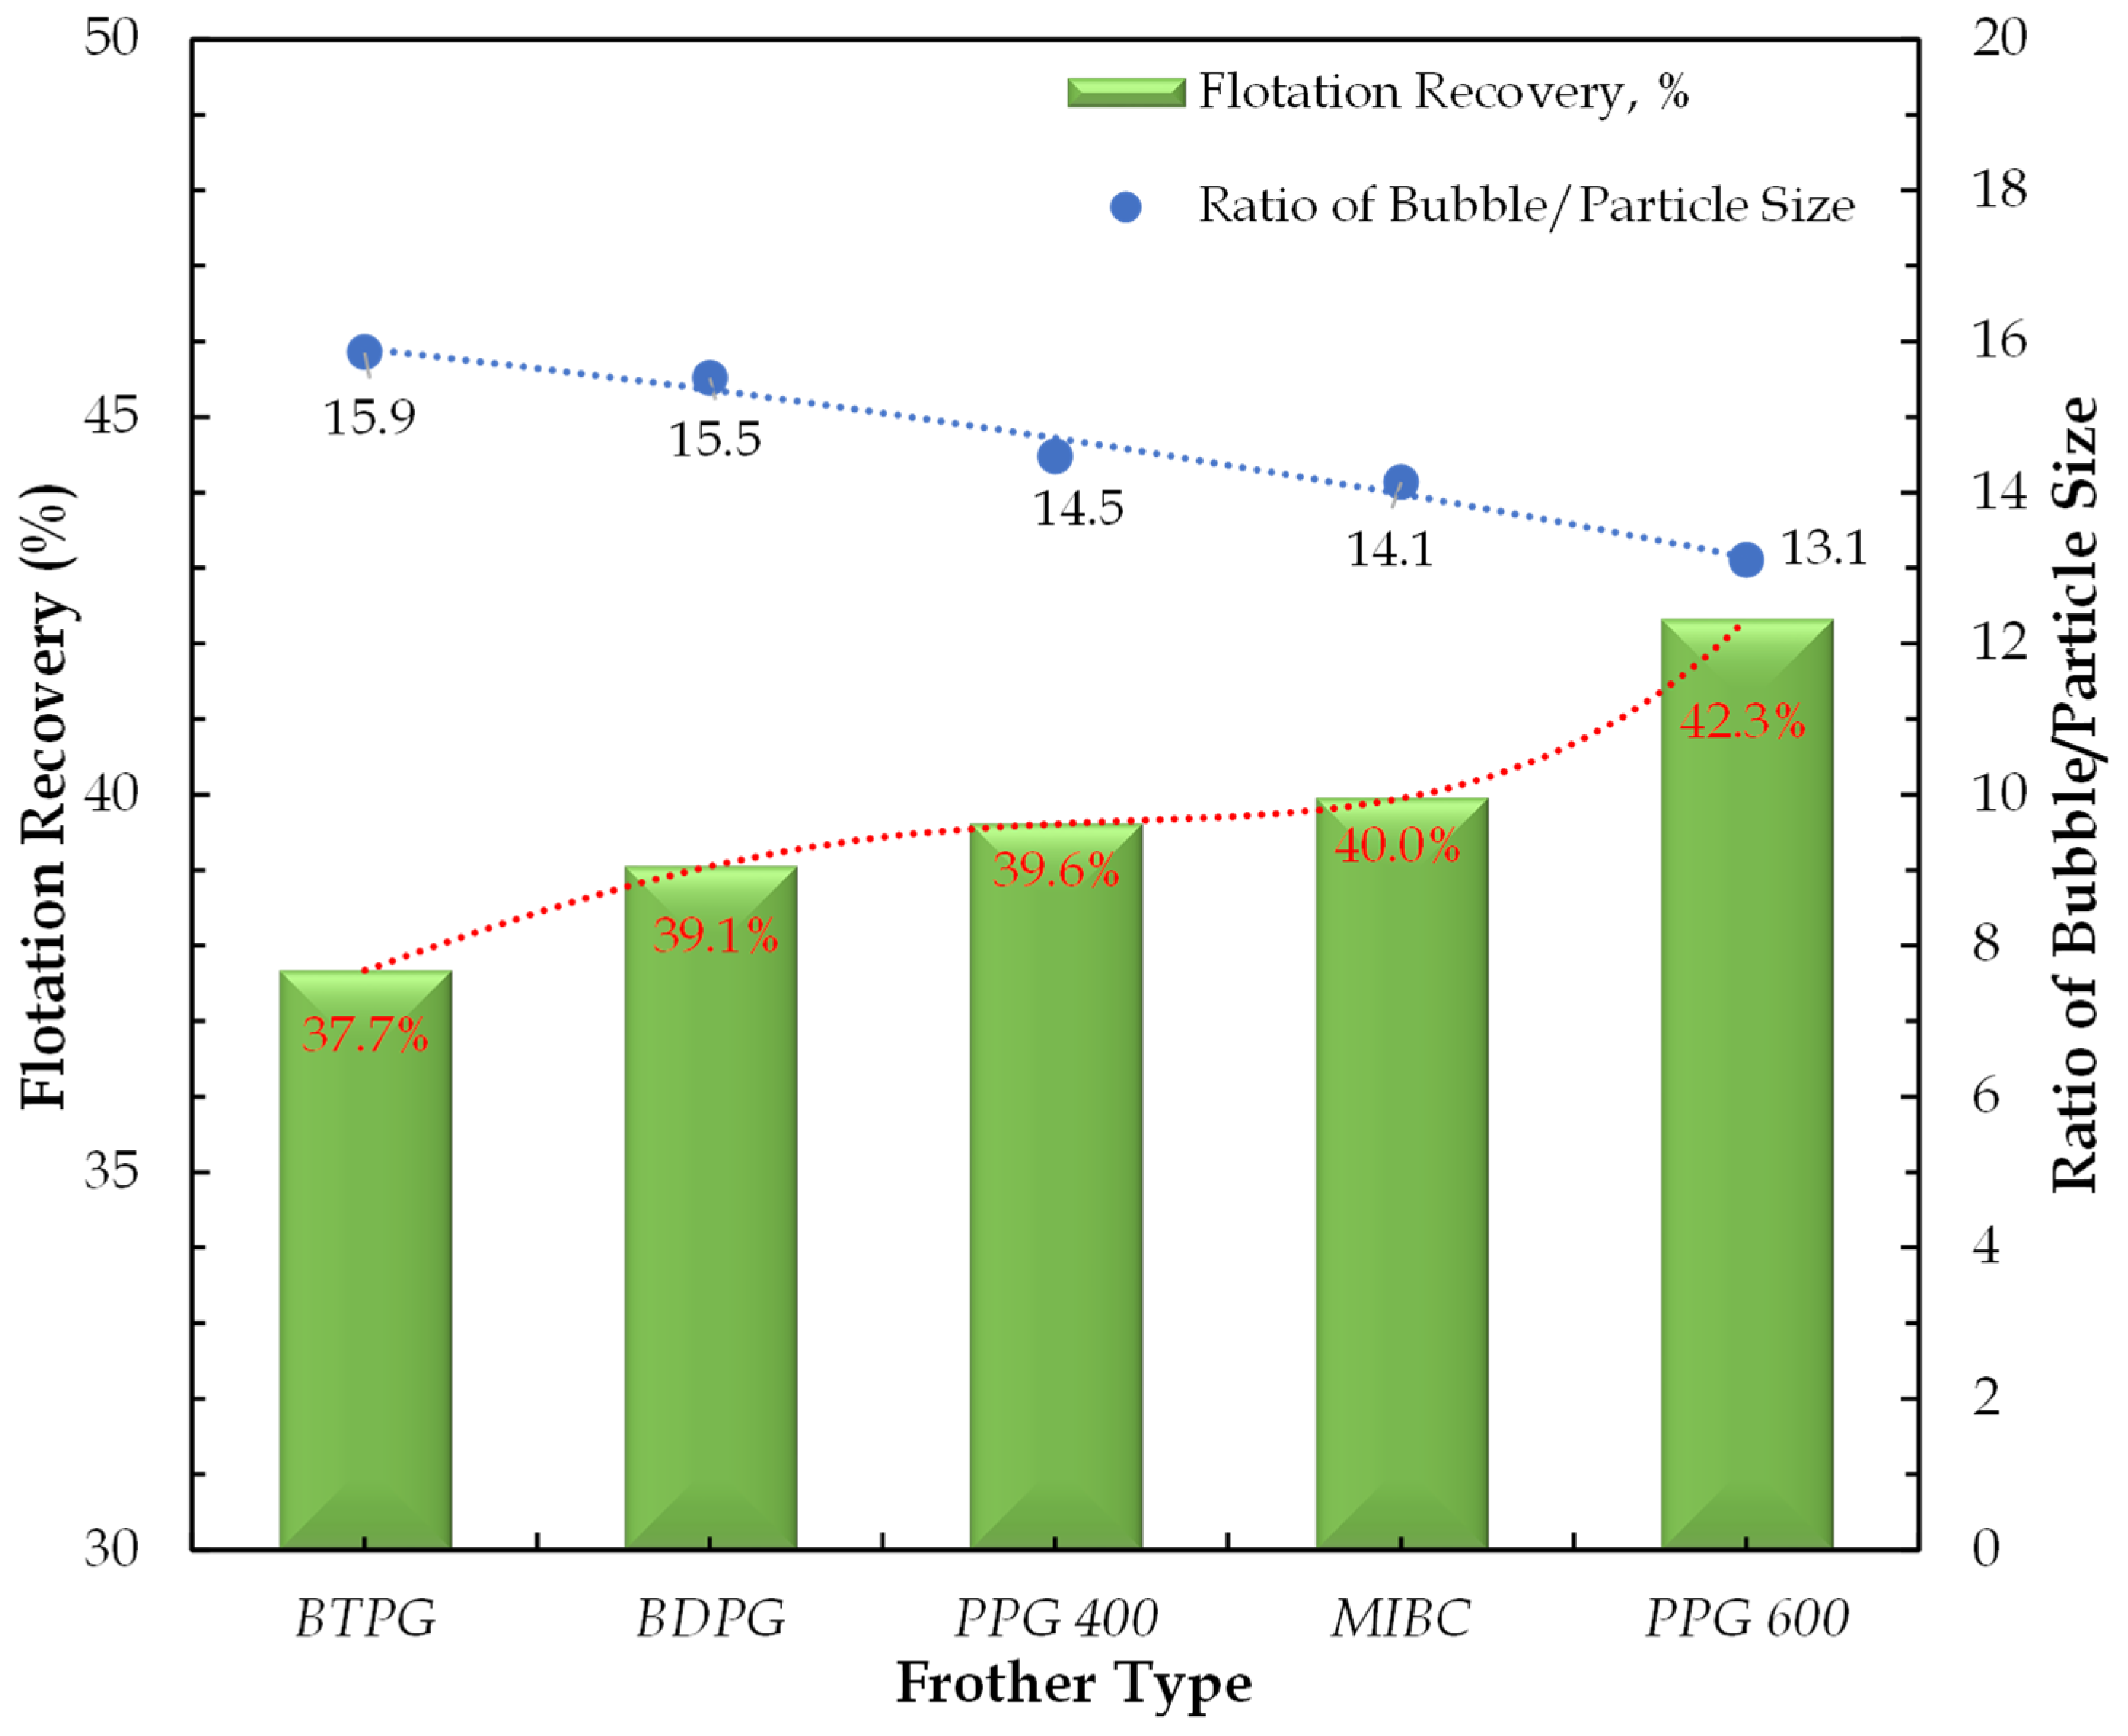
Figure 9 demonstrates flotation recoveries with a 1 × 10⁻⁴ mol/L NaOL concentration in the presence of different frothers at their CCC. While the flotation recovery was around 38% in the presence of BTPG, which has a CCC value of around 5 ppm, a negligible increase to around 40% was obtained for the other three frothers, namely BDPG, MIBC, and PPG400, all of which have different molecular weights and CCC values, as reported previously. However, the recoveries increased to 42% with PPG600, which has the lowest CCC point at 3 ppm and the highest molecular weight among the frother types. At this point, it is clear that the bubble size (380 µm), which was reported in one of our previous studies [26], may be considered a decisive factor for explaining these differences in flotation rates, though complementary studies are needed. Thus, by adapting the bubble sizes at the CCC points of frothers from our earlier studies [33], an interesting trend between the bubble-to-particle size ratio (the average size was taken as 29 µm) was obtained.
Our previous study showed that while the lowest Sauter Mean Diameter (SMD) value of 0.3098 mm was found for PPG 600, the highest SMD value of 0.6438 mm was found for BTEG (0.3656 mm for PPG400, 0.3895 for BTPG, 0.3974 mm for MIBC) [35]. The SMD of other frother types also followed an order based on their molecular weights and their surface tension values.
The size ratios followed the order of BTPG > BDPG > PPG400 > MIBC > PPG600 in line with their flotation recoveries, the highest (15.9) being for BTPG and the lowest (13.1) being for PPG600. This value is close to the theoretical value of “20”, as proposed in the literature [35]. The implications of this correlation in flotation systems still require more investigations; however, they are in line with previous findings in the literature for other types of minerals like quartz [54], coal [55], zircon [56], and apatite [57]. The general trend indicates that decreasing the bubble size, even at marginal levels, would affect the recovery rate of fine particles due to their larger surface area, but may require extended flotation times depending on the shape, specific gravity [57], and the level of hydrophobicity of the particles. On the other hand, as seen in Figure 9, considering the average particle size of 29 µm and the bubble size range of 0.40–0.45 mm found for different frothers at their CCC values in our previous paper [33], the flotation recoveries remain around 40% (38%–42%), confirming the well-known hypothesis of the need for finer bubbles to capture the finer particles.
Additionally, the significant results obtained from experimental studies and the key findings are summarized as follows.
Considering the well-known role of NaOL in flotation systems and based on our earlier findings, such as bubble–particle attachment time and zeta potential measurements, a series of micro-flotation experiments was conducted to validate and extend the interpretations derived from these preliminary characterizations. These flotation experiments aimed not only to confirm previous results, but also to investigate potential correlations between flotation performance and bubble–particle interaction mechanisms under realistic operating conditions. Notably, flotation, particularly of fine particles, remains a persistent challenge in mineral processing, and conventional methods often yield low recovery [58,59]. Although strategies such as increasing apparent particle size [60] or decreasing bubble size [56,61] have been proposed.
Generally, particle wettability is assessed by contact angle measurements; however, in this study, bubble–particle attachment time was included as a more representative measure under flotation-like conditions [40]. As described in this study, shorter bubble–particle attachment times indicate stronger bubble–particle interactions, which can be interpreted as higher surface hydrophobicity. While bubble–particle attachment efficiency directly reflects the initial interaction between particle and bubble, and this interaction is primarily governed by surface hydrophobicity, micro-flotation experiments are conventionally used to evaluate froth characteristics (stability, bubble size distribution, and drainage behavior) that cannot be obtained by attachment time or efficiency measurements [15,33]. By combining these complementary approaches, the aim was to obtain a more complete understanding of both particle–bubble interaction mechanisms and the macroscopic flotation response. Considering similar experimental conditions, these results were found to correlate well with micro-flotation recoveries, thus supporting the validity of our approach.
The results also indicated that PPG600 at low dosage provides the best balance of these factors, while BTPG and BDPG suffer from either incompatibility with NaOL or over-stabilized froth. And, based on the results from this study, the following conclusions can be drawn:
PPG600 (best): At low dosage, it optimizes the froth phase: stable, small bubbles, good drainage, and strong collector–frother synergy promote effective particle attachment.
MIBC (baseline performance): Widely used, predictable behavior, but less adaptable to fine-tuning the flotation microenvironment. Bubble size and froth quality are not ideal for maximizing NaOL performance.
PPG400: Froth may be too stable or over-expanded at 4 ppm, disrupting selective flotation.
Still better than BDPG and BTPG, but inferior to PPG600 due to drainage or film issues.
BDPG (overdosed): High dosage creates a viscous, entraining froth. Likely to interfere with surface chemistry, leading to poor selectivity and recovery.
BTPG (lowest): Likely suffers from poor bubble size control, coalescence, and minimal interaction with NaOL. It could destabilize NaOL film or lead to rapid bubble rupture.
While the advantage of smaller bubbles for improving fine particle flotation is well established, the size ratio of bubble-to-particle remains a myth because the definition of particle is vague, i.e., whether the particles coagulate in the pulp before adhering to the bubble and then stick to the bubble, or whether coagulation occurs on the bubble itself [53]. The size ratio of bubble-to-particle of 13.1–15.9 given in Figure 9 is a preliminary attempt in this regard. Figure 10 amplifies the above correlation between flotation recovery and bubble-to-particle size ratios.

4. Conclusions

In this study, the effect of several commercial frothers on the flotation recovery of magnesite in the NaOL–frother–magnesite flotation system was investigated. Foam production values, as represented by air/liquid measurements, and bubble–particle attachment times and flotation recoveries, as represented by the magnesite/NaOL in the absence and presence of different frothers at their CCC values, exhibited a satisfactory correlation. More importantly, flotation recoveries indicated a good match with the bubble-to-particle size ratio of 13.1–15.9 in the presence of different frothers. More complementary data are needed to confirm the bubble-to-particle size ratio and the implications of foam production values in flotation.

Author Contributions

Conceptualization, O.O. and F.B.; methodology, K.B., O.G. and O.O.; validation, F.B.; investigation, K.B., O.G. and O.O.; resources, O.G., O.O., F.B. and M.S.Ç.; writing—original draft preparation, K.B., O.G. and O.O.; writing—review and editing, O.G., O.O., F.B. and M.S.Ç.; visualization, O.G. and K.B.; supervision, O.G. and O.O.; project administration, M.S.Ç.; funding acquisition, M.S.Ç. All authors have read and agreed to the published version of the manuscript.

Funding

This project has received funding from the European Union’s Horizon 2020 research and innovation program Fine Future under Grant Agreement No. 821265.

Data Availability Statement

The original contributions presented in the study are included in the article.

Conflicts of Interest

The authors declare no conflicts of interest.

References

  1. Abkarian, M.; Subramaniam, A.B.; Kim, S.H.; Larsen, R.J.; Yang, S.M.; Stone, H.A. Dissolution arrest and stability of particle-covered bubbles. Phys. Rev. Lett. 2007, 99, 188301. [Google Scholar] [CrossRef]
  2. George, P.; Nguyen, A.V.; Jameson, G.J. Assessment of true flotation and entrainment in the flotation of submicron particles by fine bubbles. Miner. Eng. 2004, 17, 847–853. [Google Scholar] [CrossRef]
  3. Neethling, S.J.; Brito-Parada, P.R. Predicting flotation behaviour: The interaction between froth stability and performance. Miner. Eng. 2018, 120, 60–65. [Google Scholar] [CrossRef]
  4. Leja, J. Surface Chemistry of Froth Flotation; Plenum Press: New York, NY, USA, 1982. [Google Scholar]
  5. Fosu, S.; Skinner, W.; Zanin, M. Detachment of coarse composite sphalerite particles from bubbles in flotation: Influence of xanthate collector type and concentration. Miner. Eng. 2015, 71, 73–84. [Google Scholar] [CrossRef]
  6. Ulusoy, U.; Yekeler, M.; Hiçyilmaz, C. Determination of the shape, morphological and wettability properties of quartz and their correlations. Miner. Eng. 2003, 16, 951–964. [Google Scholar] [CrossRef]
  7. Koh, P.T.L.; Hao, F.P.; Smith, L.K.; Chau, T.T.; Bruckard, W.J. The effect of particle shape and hydrophobicity in flotation. Int. J. Miner. Process. 2009, 93, 128–134. [Google Scholar] [CrossRef]
  8. Guven, O.; Çelik, M.S. Interplay of particle shape and surface roughness to reach maximum flotation efficiencies depending on collector concentration. Miner. Process. Extr. Metall. Rev. 2016, 37, 412–417. [Google Scholar] [CrossRef]
  9. Rezai, B.; Rahim, M.; Aslani, M.R.; Eslamian, A.; Dehghani, F. Relationship between surface roughness of minerals and their flotation kinetics. In Proceedings of the XI International Mineral Processing and Technology Congress, Brisbane, Australia, 6–10 September 2010; pp. 232–238. [Google Scholar]
  10. Little, L.; Mainza, A.N.; Becker, M.; Wiese, J.G. Using mineralogical and particle shape analysis to investigate enhanced mineral liberation through phase boundary fracture. Powder Technol. 2016, 301, 794–804. [Google Scholar] [CrossRef]
  11. Hewitt, D.; Fornasiero, D.; Ralston, J. Bubble–particle attachment. J. Chem. Soc. Faraday Trans. 1995, 91, 1997–2001. [Google Scholar] [CrossRef]
  12. Güngören, C.; Baktarhan, Y.; Şahbaz, O.; Ünver, İ.K.; Özkan, Ş.G.; Özdemir, O. Effect of chloride salt ions onto coal flotation based on contact angle and bubble-particle attachment time. Dokuz Eylül Üniversitesi Mühendislik Fakültesi Fen Ve Mühendislik Derg. 2022, 24, 553–562. [Google Scholar] [CrossRef]
  13. Albijanic, B.; Amini, E.; Wightman, E.; Ozdemir, O.; Nguyen, A.V.; Bradshaw, D.J. A relationship between the bubble-particle attachment time and the mineralogy of a copper-sulphide ore. Miner. Eng. 2011, 24, 1335–1339. [Google Scholar] [CrossRef]
  14. Albijanic, B.; Ozdemir, O.; Nguyen, A.V.; Bradshaw, D. A Review of induction and attachment times of wetting thin films between air bubbles and particles and its relevance in flotation separation of particles. Adv. Colloid Interface Sci. 2010, 159, 1–21. [Google Scholar] [CrossRef] [PubMed]
  15. Batjargal, K.; Güven, O.; Ozdemir, O.; Boylu, F.; Pural, Y.E.; Çelik, M.S. Correlation of flotation recoveries and bubble–particle attachment time for dodecyl ammonium hydrochloride/frother/quartz flotation system. Minerals 2023, 13, 1305. [Google Scholar] [CrossRef]
  16. Fuerstenau, D.W.; Pradip. Zeta potentials in the flotation of oxide and silicate minerals. Adv. Colloid Interface Sci. 2005, 114–115, 9–26. [Google Scholar] [CrossRef] [PubMed]
  17. Ignatkina, V.A.; Bocharov, V.A.; Aksenova, D.D.; Kayumov, A.A. Zeta potential of the surface of ultrafine sulfides and floatability of minerals. Russ. J. Non-Ferr. Met. 2017, 58, 95–100. [Google Scholar] [CrossRef]
  18. Muhammadi-Jam, S.; Waters, E.K.; Greenwood, R.W. A review of zeta potential measurements using electroacoustics. Adv. Colloid Interface Sci. 2022, 309, 102778. [Google Scholar] [CrossRef]
  19. Elmahdy, A.M.; Mirnezami, M.; Finch, J.A. Zeta potential of air bubbles in presence of frothers. Int. J. Miner. Process. 2008, 89, 40–43. [Google Scholar] [CrossRef]
  20. Sze, A.; Erickson, D.; Ren, L.; Li, D. Zeta-potential measurements using the Smoluchowski equation and the slope of the current-time relationship in electrostatic flow. J. Colloid Interface Sci. 2003, 261, 402–410. [Google Scholar] [CrossRef]
  21. Yoon, R.-H. The role of hydrodynamic and surface forces in bubble–particle interaction. Int. J. Miner. Process. 2000, 58, 129–143. [Google Scholar] [CrossRef]
  22. Batjargal, K.; Guven, O.; Ozdemir, O.; Karakashev, S.I.; Grozev, N.A.; Boylu, F.; Çelik, M.S. Frothing Performance of Frother-Collector Mixtures as Determined by Dynamic Foam Analyzer and Its Implications in Flotation. Minerals 2023, 13, 242. [Google Scholar] [CrossRef]
  23. Gaudin, A.M.; Groh, J.O.; Henderson, H.B. Effect of particle size on flotation. AIME Tech. Publ. 1931, 414, 3–23. [Google Scholar]
  24. Yalcin, T.; Byers, A. Dissolved gas flotation in mineral processing. Miner. Process. Extr. Metall. Rev. 2006, 27, 87–97. [Google Scholar] [CrossRef]
  25. Tao, Y.J.; Liu, J.T.; Yu, S.; Tao, D. Picobubble enhanced fine coal flotation. Sep. Sci. Technol. 2006, 41, 3597–3607. [Google Scholar] [CrossRef]
  26. Miettinen, T.; Ralston, J.; Fornasiero, D. The limits of fine particle flotation. Miner. Eng. 2010, 23, 420–437. [Google Scholar] [CrossRef]
  27. Cho, Y.S.; Laskowski, J.S. Effect of flotation frothers on bubble size and foam stability. Int. J. Miner. Process. 2002, 64, 69–80. [Google Scholar] [CrossRef]
  28. Nesset, J.E.; Finch, J.A.; Gomez, C.O. Operating variables affecting the bubble size in forced-air mechanical flotation machines. In Proceedings of the 9th Mill Operators’ Conference 2007, Fremantle, WA, Australia, 19–21 March 2007; pp. 55–65. [Google Scholar]
  29. Zhang, W.; Nesset, J.E.; Finch, J.A. Water recovery and bubble surface area flux in flotation. Can. Metall. Q. 2010, 49, 353–362. [Google Scholar] [CrossRef]
  30. Welsby, S.D.D. Pilot-scale froth testing at highland valley Copper. In Proceedings of the 46th Annual Meeting of the Canadian Mineral Processors Conference, Ottawa, ON, Canada, 21–23 January 2014; pp. 301–314. [Google Scholar]
  31. Zangooi, A.; Gomez, C.O.; Finch, J.A. Mapping frother distribution in industrial flotation circuits. Miner. Eng. 2017, 113, 36–40. [Google Scholar] [CrossRef]
  32. Walser, G. Economic Impact of World Mining; World Bank Group Mining Department: Washington, DC, USA, 2017; pp. 263–264. [Google Scholar]
  33. Guven, O.; Batjargal, K.; Ozdemir, O.; Karakashev, S.I.; Grozev, N.A.; Boylu, F.; Çelik, M.S. Experimental procedure for the determination of the critical coalescence concentration (CCC) of simple frothers. Minerals 2020, 10, 617. [Google Scholar] [CrossRef]
  34. Karakashev, S.I.; Grozev, N.A.; Batjargal, K.; Guven, O.; Özdemir, O.; Boylu, F.; Çelik, M.S. Correlations for easy calculation of the critical coalescence concentration (CCC) of simple frothers. Coatings 2020, 10, 612. [Google Scholar] [CrossRef]
  35. Batjargal, K.; Guven, O.; Ozdemir, O.; Karakashev, I.S.; Grozev, A.N.; Boylu, F.; Celik, S.M. Adsorption Kinetics of Various Frothers on Rising Bubbles of Different Sizes under Flotation Conditions. Minerals 2021, 11, 304. [Google Scholar] [CrossRef]
  36. Karakashev, S.I.; Grozev, N.A.; Ozdemir, O.; Batjargal, K.; Guven, O.; Ata, S.; Bournival, G.; Boylu, F.; Çelik, M.S. On the frother’s strength and its performance. Miner. Eng. 2021, 171, 107093. [Google Scholar] [CrossRef]
  37. Batjargal, K.; Guven, O.; Ozdemir, O.; Karakashev, S.; Grozev, N.A.; Boylu, F.; Çelik, M.S. Bubbling properties of frothers and collectors mix system. Physicochem. Probl. Miner. Process. 2022, 58, 152890. [Google Scholar] [CrossRef]
  38. Chen, G.; Tao, D. Effect of solution chemistry on floatability of magnesite and dolomite. Int. J. Miner. Process. 2004, 74, 343–357. [Google Scholar] [CrossRef]
  39. Ye, Y.; Miller, J.D. Bubble/particle contact time in the analysis of coal flotation. Coal Prep. 1988, 5, 147–166. [Google Scholar] [CrossRef]
  40. Ye, Y.; Khandrika, S.M.; Miller, J.D. Induction-time measurements at a particle bed. Int. J. Miner. Process. 1989, 25, 221–240. [Google Scholar] [CrossRef]
  41. Yoon, R.H.; Yordan, J.L. Induction time measurements for the quartz-amine flotation system. J. Colloid Interface Sci. 1991, 141, 374–383. [Google Scholar] [CrossRef]
  42. Su, L.; Xu, Z.; Masliyah, J. Role of oily bubbles in enhancing bitumen flotation. Miner. Eng. 2006, 19, 641–650. [Google Scholar] [CrossRef]
  43. Glembockij, V.A. The time of attachment of air bubbles to mineral particles in flotation and its measurement. Izv. Akad. Nauk SSSR (OTN) 1953, 11, 1524–1531. [Google Scholar]
  44. Peng, F.F. Surface energy and induction time of fine coals treated with various levels of dispersed collector and their correlation to flotation responses. Energy Fuel 1996, 10, 1202–1207. [Google Scholar] [CrossRef]
  45. Gu, G.; Xu, Z.; Nandakumar, K.; Masliyah, J. Effects of physical environment on induction time of air–bitumen attachment. Int. J. Miner. Process 2003, 69, 235–250. [Google Scholar] [CrossRef]
  46. Wang, W.; Zhou, Z.; Nandakumar, K.; Masliyah, J.H.; Xu, Z. An induction time model for the attachment of an air bubble to a hydrophobic sphere in aqueous solutions. Int. J. Miner. Process. 2005, 75, 69–82. [Google Scholar] [CrossRef]
  47. Ozdemir, O.; Karaguzel, C.; Nguyen, A.V.; Celik, M.S.; Miller, J.D. Contact angle and bubble attachment studies in the flotation of trona and other soluble carbonate salts. Miner. Eng. 2009, 22, 168–175. [Google Scholar] [CrossRef]
  48. Ozdemir, O.; Taran, E.; Hampton, M.A.; Karakashev, S.I.; Nguyen, A.V. Surface chemistry aspects of coal flotation in bore water. Int. J. Miner. Process. 2009, 92, 177–183. [Google Scholar] [CrossRef]
  49. Albijanic, B.; Nguyen, A.V.; Ozdemir, O.; García-Figueroa, A.A. Induction time of wetting films between air bubbles and hydrophobic particles in the presence of dodecyl amine hydrochloride: First principles model analysis and experimental validation. Molecules 2025, 30, 695. [Google Scholar] [CrossRef]
  50. Tang, M.; Niu, X.; Wen, S. Influences of magnesium ions in water on gelatinization characteristics of starch and its flocculation behaviors on particles. Physicochem. Probl. Miner. Process. 2024, 60, 178149. [Google Scholar] [CrossRef]
  51. Hwang, E.T.; Chae, M. Magnesium carbonate for physical control of poultry red mites. Surf. Interfaces 2025, 64, 106335. [Google Scholar] [CrossRef]
  52. Wonyen, D.G.; Kromah, V.; Gibson, B.; Nah, S.; Chelgani, S.C. A review of flotation separation of Mg carbonates (dolomite and magnesite). Minerals 2018, 8, 354. [Google Scholar] [CrossRef]
  53. Çelik, M.S.; Guven, O.; Karaağaçlıoğlu, İ.E.; Özdemir, O. Does hemimicelle concentration (HMC) coincide with critical aggregation concentration (CAC) in flotation? Miner. Eng. 2024, 215, 108812. [Google Scholar] [CrossRef]
  54. Farrokhpay, S.; Filippova, I.; Filippov, L.; Picarra, A.; Rulyov, N.; Fornasiero, D. Flotation of fine particles in the presence of combined microbubbles and conventional bubbles. Miner. Eng. 2020, 155, 106439. [Google Scholar] [CrossRef]
  55. Yoon, R.N.; Lutrell, G. The Effect of bubble size on fine particle flotation. Miner. Process. Extr. Metall. Rev. 1989, 5, 101–122. [Google Scholar] [CrossRef]
  56. Ahmed, N.; Jameson, G. The effect of bubble size on the rate of flotation of fine particles. Int. J. Miner. Process. 1985, 14, 195–215. [Google Scholar] [CrossRef]
  57. Reis, A.; Reis Filho, A.M.; Demuner, L.R.; Barrozo, M.A.S. Effect of bubble size on the performance flotation of fine particles of a low-grade Brazilian apatite ore. Powder Technol. 2019, 356, 884–891. [Google Scholar] [CrossRef]
  58. Sivamohan, R. The problem of recovering very fine particles in mineral processing. A Review. Int. J. Miner. Process. 1990, 28, 247–288. [Google Scholar] [CrossRef]
  59. Rulyov, N.N. Turbulent microflotation: Theory and experiment. Colloids Surf. A Physicochem. Eng. Asp. 2001, 192, 73–91. [Google Scholar] [CrossRef]
  60. Rubio, J.; Capponi, F.; Matiolo, E.; Nunes, G.N. Advances in flotation of mineral fines. In Proceedings of the XXII International Mineral Processing Congress, Cape Town, South Africa, 29 September–3 October 2003; pp. 1014–1022. [Google Scholar]
  61. Dai, Z.; Fornasiero, D.; Ralston, J. Particle-bubble collision models—A review. Adv. Colloid Interface Sci. 2000, 85, 231–256. [Google Scholar] [CrossRef]
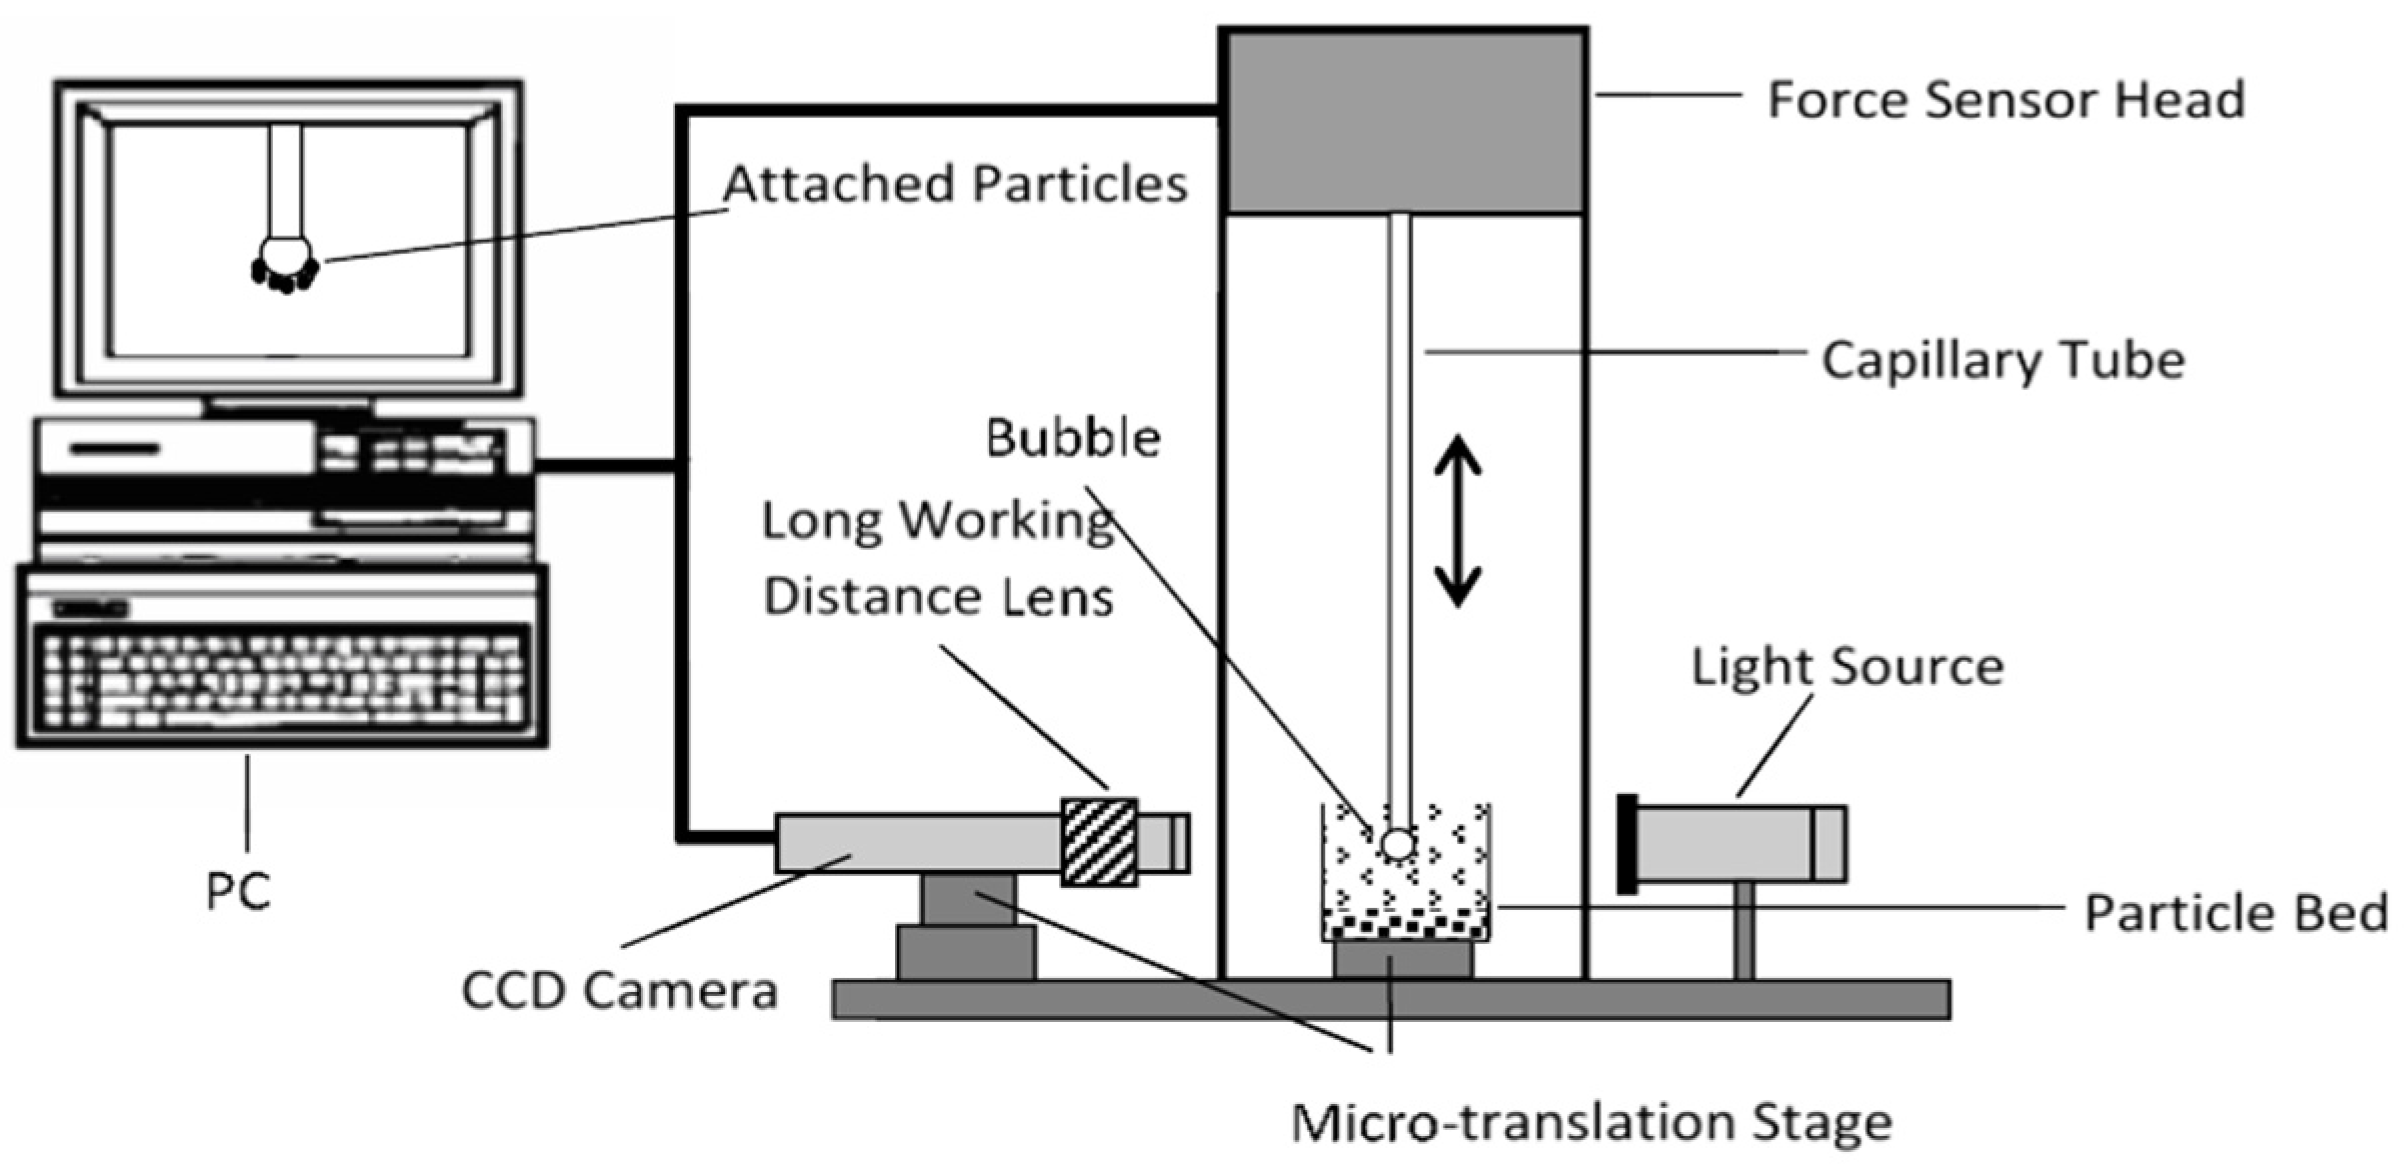
Figure 1. Schematic representation of the bubble–particle attachment time measurement setup adapted from [48].
Minerals 15 00849 g001
Figure 2. Zeta potentials of magnesite as a function of pH.
Minerals 15 00849 g002
Figure 3. Zeta potentials of magnesite as a function of NaOL concentration.
Minerals 15 00849 g003
Figure 4. Results for bubble–particle attachment time measurements in different capillary tubes at 1 × 10⁻⁵ mol/L NaOL.
Minerals 15 00849 g004
Figure 5. Bubble–particle attachment efficiency as a function of contact time at different NaOL concentrations.
Minerals 15 00849 g005
Figure 6. Concentration-dependent bubble–particle attachment images of NaOL.
Minerals 15 00849 g006
Figure 7. Foam production values and magnesite flotation recoveries at a 5 × 10⁻⁵ mol/L NaOL concentration with different frothers at their respective CCC values.
Minerals 15 00849 g007
Figure 8. Comparison of foam production by NaOL in the absence and presence of 3 ppm PPG600, and magnesite flotation recoveries with NaOL.
Minerals 15 00849 g008
Figure 9. Flotation of magnesite particles (38 × 20 µm2) at a constant NaOL concentration (1 × 10⁻⁴ mol/L) in the presence of different frothers (at their CCC concentrations) and the ratio of bubble-to-particle radius (mm/mm).
Minerals 15 00849 g009
Figure 10. Correlation between bubble-to-particle size ratio and froth product recovery.
Minerals 15 00849 g010
Table 1. Physical and chemical properties of sodium oleate.
ChemicalPurity
(%)
FormulaMolecular Weight
(g/mol)
CMC
(mol/L)
Molecular
Structure
Sodium oleate
(NaOL)
≥97C18H33NaO2304.43 × 10−3Minerals 15 00849 i001
Table 2. Physical and chemical properties of frothers.
FrothersFormulaMolecular Weight
(g/mol)
CCC
(ppm)
Molecular Structure
PPG-400
n = 6.5
0H(C3H6O)nH360~4404Minerals 15 00849 i002
PPG-600
n = 10
0H(C3H6O)nH540~6603Minerals 15 00849 i003
BTPG
n = 3
C13H28O4248.365Minerals 15 00849 i004
BDPG
n = 2
C10H22O3~25017Minerals 15 00849 i005
MIBCC6H14O102.1710Minerals 15 00849 i006
Disclaimer/Publisher’s Note: The statements, opinions and data contained in all publications are solely those of the individual author(s) and contributor(s) and not of MDPI and/or the editor(s). MDPI and/or the editor(s) disclaim responsibility for any injury to people or property resulting from any ideas, methods, instructions or products referred to in the content.