Article

Evaluation of Pore Structure Characteristics and Permeability of In Situ-Blasted Leachable Ore in Stopes Under Varying Particle-Size Gradations

College of Mining Engineering, North China University of Science and Technology, Tangshan 063210, China
*
Author to whom correspondence should be addressed.
Minerals 2025, 15(8), 848; https://doi.org/10.3390/min15080848 (registering DOI)
Submission received: 14 July 2025 / Revised: 27 July 2025 / Accepted: 8 August 2025 / Published: 9 August 2025
(This article belongs to the Section Mineral Processing and Extractive Metallurgy)

Abstract

In recent years, in situ blasting–leaching, in the stope has emerged as an economically viable and environmentally sustainable mining technique for low-grade ore deposits. While the leaching efficiency is influenced by factors such as ore type, solution composition, and spraying speed, the most significant factor is the effect of post-blasting crushed-stone particle size and gradation on the pore structure, which subsequently influences seepage and leaching performance. To investigate how particle size and gradation affect the pore structure of granular media, physical models of ore particles with varying sizes and gradations were constructed. These models were scanned and three-dimensionally reconstructed using CT scanning technology and Avizo software (Avizo, Version 2023.1; Thermo Fisher Scientific: Waltham, MA, USA, 2023) enabling quantitative analysis of pore structure parameters. The results indicate that the coefficient of uniformity (Cu) is approximately negatively correlated with porosity, while the vertical absolute permeability (kz) follows an attenuated exponential trend. When the fine-particle content (L8 > L3 > L1) increases by 1.5-fold and 9-fold, the number of pore throats increases by 8.71% and 30.91%, respectively, the average pore size decreases by 75.1% and 64.4%, the average throat size decreases by 66.3% and 60%, and the connectivity rate decreases by 92% and 77.8%. This study further evaluates permeability based on the aforementioned pore structure parameters. Multiple regression analysis reveals that the connectivity rate and throat size have the most significant influence on permeability. Accordingly, permeability analysis and prediction are conducted using the improved Purcell formula, which demonstrates a strong correlation with the experimentally measured results.

1. Introduction

In situ blasting leaching within stopes represents an innovative and environmentally sustainable mining approach that integrates the processes of ore extraction, beneficiation, and metallurgy. This method involves directly fragmenting the ore body underground into smaller rock fragments, with approximately 70%–80% of the ore remaining in situ. Subsequently, leaching solutions are applied via spraying systems to the retained ore mass, and the resulting liquid containing dissolved valuable metals is collected and processed for metal recovery [1,2,3]. This technique effectively addresses the ground-pressure control challenges associated with conventional mining methods while significantly reducing the transportation costs related to surface processing. It is particularly applicable to the development of low-grade ore deposits. In countries such as the United States and Canada, heap leaching and in situ blasting leaching are predominantly employed for the recovery of metals from copper ores with grades ranging from 0.15% to 0.45%, oxidized copper ores exceeding a 2% grade, and uranium ores with concentrations between 0.02% and 0.1% [4,5,6]. The efficiency and effectiveness of the stope leaching technology primarily depend on the leaching rate and overall leaching performance. Key factors influencing the leaching rate include ore characteristics, the selection of leaching reagents, fluid dynamics, and environmental conditions [7,8,9,10]. Among these, solution flow behavior plays a critical role, as it governs both the chemical reaction kinetics within the ore and the transport of fine particles—both of which are fundamental to the leaching process. The leaching solution is typically introduced at the upper portion of the ore deposit through a network of spray pipes and percolates downward under gravitational forces. The pore structure within the ore body serves as the primary conduit for this fluid movement [11,12]. Consequently, the characteristics of the pore structure exert a significant influence on both fluid flow and leaching efficiency.
Pores within the ore body originate from the accumulation of fragmented ore particles generated by blasting operations. Ore constitutes the foundational element of the leaching system. Blasting produces particles of varying shapes and size distributions, which collectively form a granular skeleton. The interstitial voids between these particles provide the necessary space for fluid migration and chemical interactions between the solution and the ore matrix [13,14,15]. However, due to their irregular sizes and geometries, these pores exhibit heterogeneous structural features. Pore structure parameters such as porosity, pore-size distribution, and connectivity directly affect seepage velocity and efficiency, thereby playing a decisive role in determining leaching outcomes [16,17,18]. Therefore, variations in pore structure characteristics represent the underlying mechanism governing leaching performance.
Several factors contribute to the formation and evolution of pore structures, including particle size, shape, gradation, and contact configurations, all of which collectively define the spatial distribution of pores [19,20,21]. Of particular significance are the particle size and gradation of the blasted ore. The ore to be leached typically consists of a mixture of coarse, medium, and fine particles. The gradation of these particles primarily determines the compaction degree of the ore pile and the spatial arrangement of primary pores, which, in turn, influences the seepage behavior of the leaching solution. When the proportion of fine particles is minimal, the ore pile exhibits high permeability; however, the pore distribution may become highly uneven, potentially leading to preferential flow paths. Conversely, when coarse particles dominate, although chemical reactions between the ore and the solution may proceed more efficiently, the resulting pore structure tends to be finer and less porous, thereby restricting fluid flow rates [22,23,24,25]. Numerous studies have focused on experimental and numerical investigations of the effects of particle size and gradation on leaching performance. Researchers such as Ilankoon [26], Liu [27], Hao [28], and Prasomsri [29] have conducted seepage experiments using particle models with different size distributions, analyzing how gradation affects porosity and seepage characteristics. Additionally, Karlsons [30], Stewart [31], and Su [32] have performed numerical simulations to model single-phase fluid flow in various ore types, predict permeability tensors under saturated conditions, and assess seepage behavior and its controlling mechanisms in earth structures. Currently, most studies adopt a macroscopic perspective in analyzing seepage phenomena, which are essentially manifestations of micro-scale changes in pore structure. As a result, the intrinsic influence of pore structure characteristics formed under different particle sizes and gradations on seepage and leaching remains largely overlooked.
Therefore, this study focuses on investigating the impact of particle size and gradation on pore structure parameters from a microscopic viewpoint. CT scanning is employed to acquire two-dimensional images of physical models with varying particle sizes and gradations. These images are then reconstructed into three-dimensional representations using Avizo software, enabling the quantitative extraction of pore structural parameters. The influence of particle size and gradation on meso-scale pore characteristics is analyzed in detail. Furthermore, permeability is evaluated based on the pore structure, and the relative influence of individual pore parameters on permeability is assessed to provide a theoretical foundation for understanding the fluid flow behavior and optimizing the metal leaching efficiency. Multiple regression analysis reveals that porosity and throat size are dominant factors affecting permeability. Based on these findings, an improved Purcell model is developed for permeability prediction.

2. Materials and Methods

2.1. Ore Materials

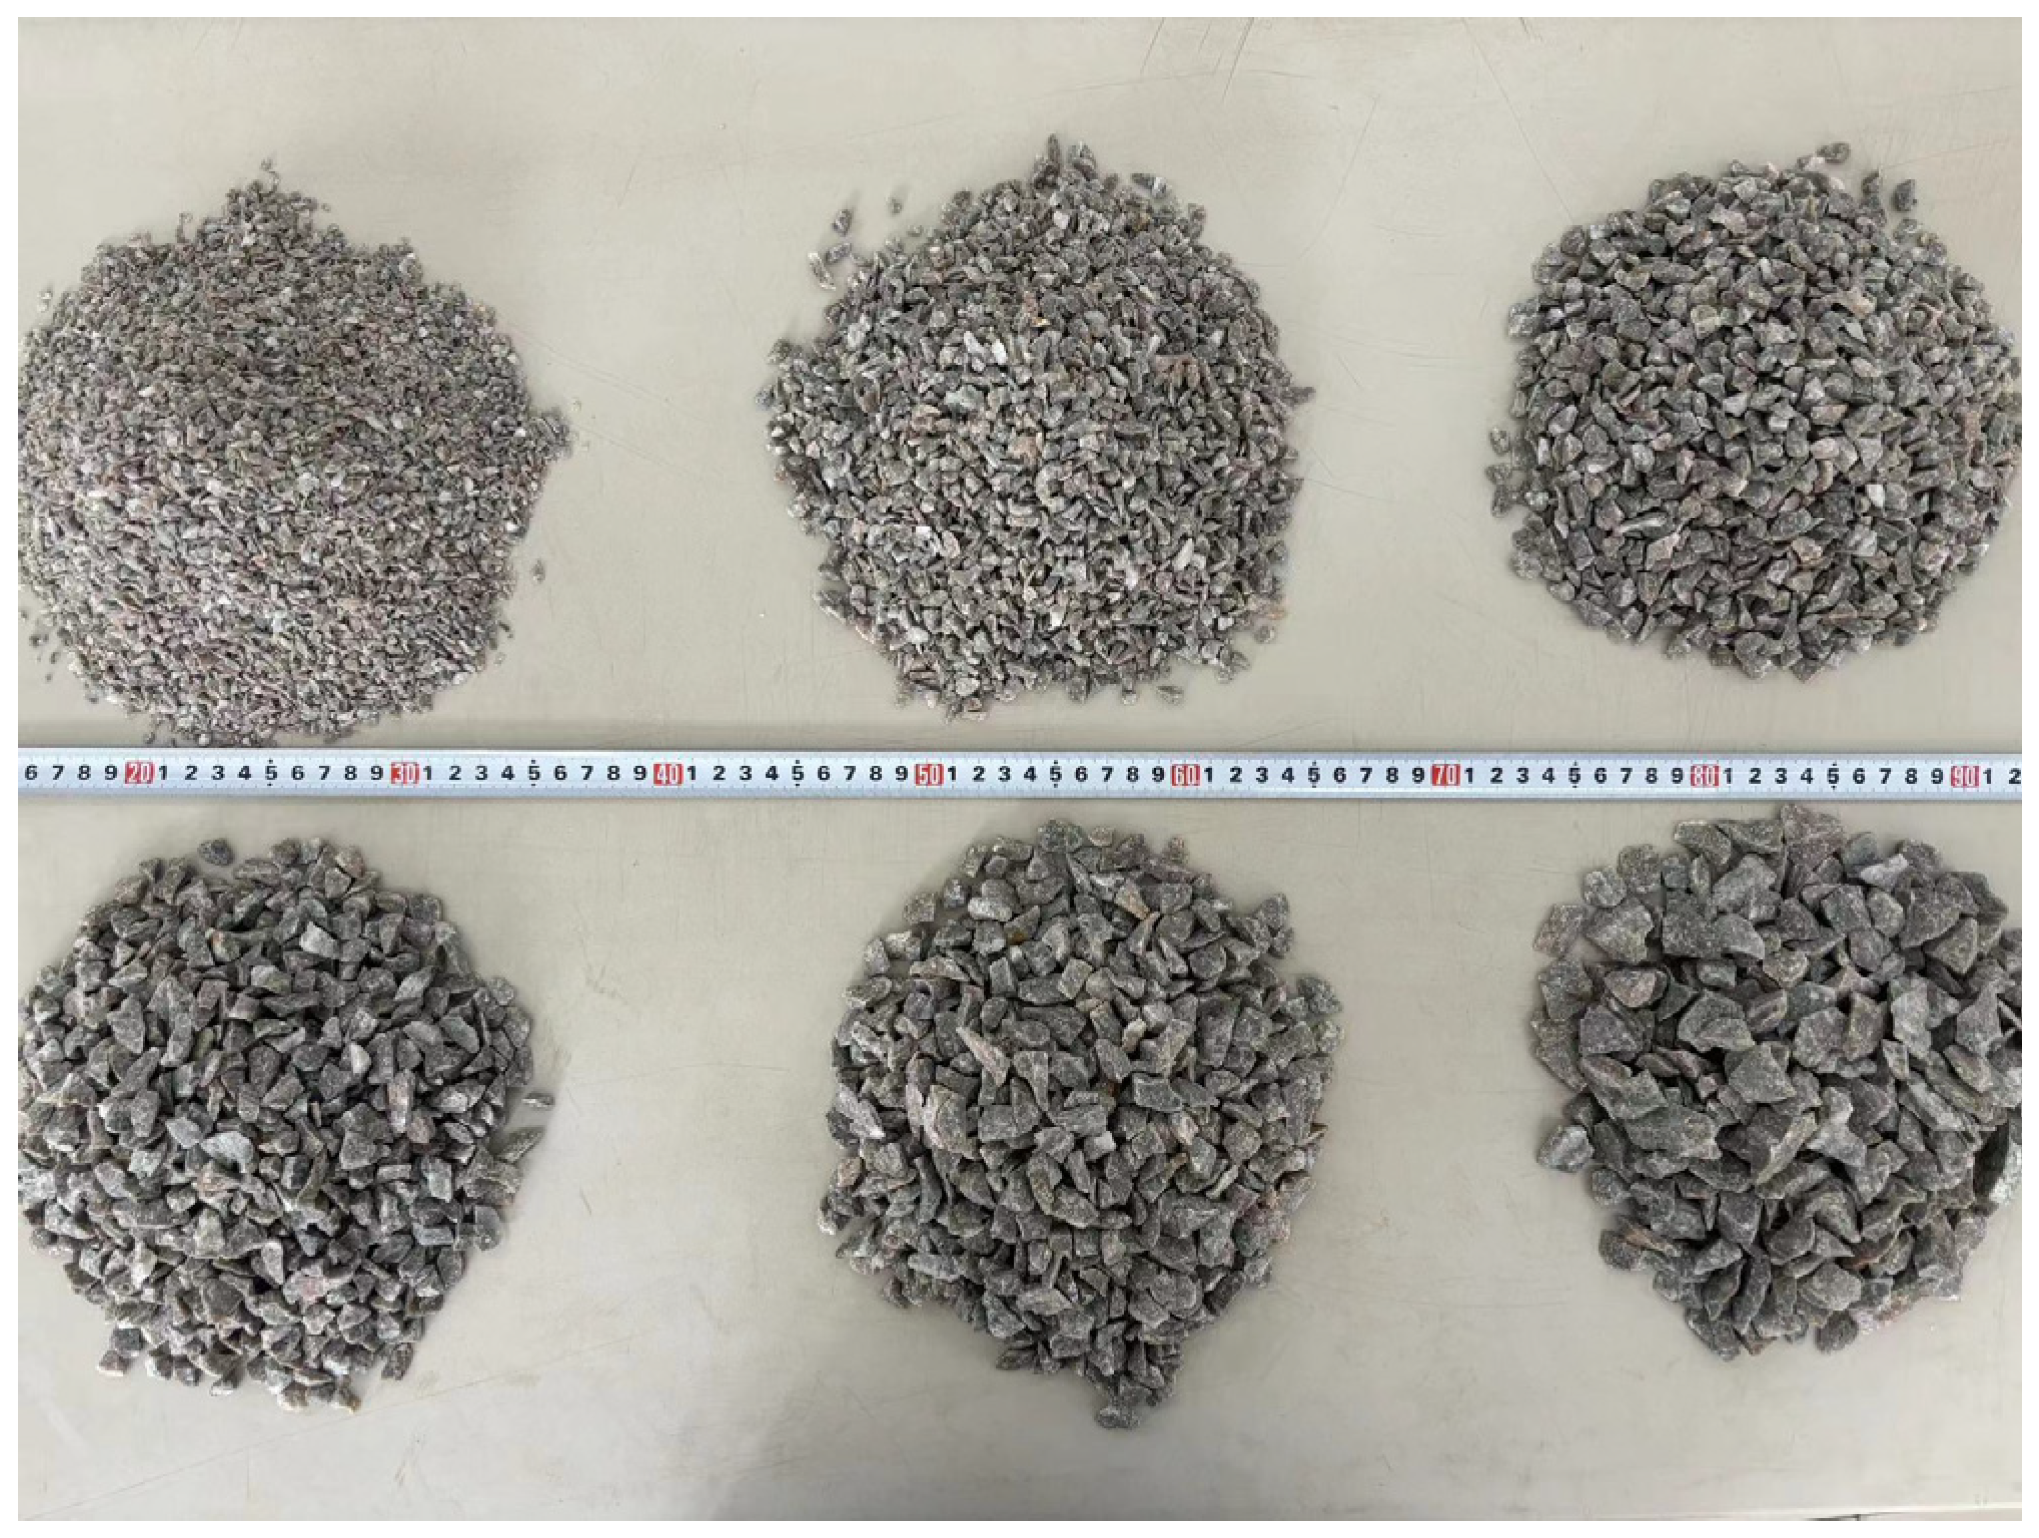
The low-grade copper ore utilized in this study was sourced from a copper mine located in Hubei Province, China. The average grade of the ore sample was 0.49%. Elemental composition analysis was performed using X-ray fluorescence (XRF, Axios, PANalytical, Almelo, The Netherlands), with the results summarized in Table 1. To investigate the effects of particle size and gradation on the pore structure of the ore bulk, single-size copper ore particles and particles with varying gradations were employed for comparative analysis. This study specifically examined the influence of particle size and gradation on the internal pore structure characteristics of the fill material. The copper ore particles were prepared through crushing, screening, washing, and air-drying processes. Subsequently, the particles were classified by size using a sieve analysis technique. Representative samples of the copper ore particles are presented in Figure 1.

2.2. Experimental Scheme

Ore particle models with different particle sizes and gradations were scanned using an X-ray CT machine to acquire two-dimensional cross-sectional images. Subsequently, Avizo software was employed for three-dimensional reconstruction and pore parameter extraction of the scanned two-dimensional images. The experiments were divided into two groups: single-grade particles and graded particles.
  • Single-grade ore particles
To investigate the influence of particle size on the pore structure of ore bulk materials, single-grade copper ore particles were utilized for a comparative analysis of the effects of particle size on the internal pore structure characteristics of the filling body. The ore particles were multi-angular and irregular in shape, resulting in diverse inter-particle contacts within the filling samples. The particle sizes of each sample are presented in Table 2. G1–G6 represent the sample numbers of the ore models classified by particle size.
  • Graded ore
Low-grade copper ore was also used for the graded ore particles. Based on the six particle sizes (G1–G6) of the single-grade ore particles, these sizes served as six factors for test analysis. A uniform design method was adopted to conduct tests at eight levels (L1–L8). Each gradation was combined according to the mass fraction of the ore particles to ensure consistent total sample mass. The percentage content of each particle size at each level is shown in Table 3. In the L1–L8 models, the content of fine particles gradually increased while the proportion of coarse particles changed, forming different gradation combinations. Specifically, L1–L4 and L5–L8 constituted two major control groups, where the content of fine particles progressively increased and the content of coarse particles progressively decreased. Furthermore, the odd-numbered group (L1/L3/L5/L7) and the even-numbered group (L2/L4/L6/L8) formed additional control groups, with the odd-numbered group containing a higher proportion of coarse particles compared with the even-numbered group (L1 > L2/L3 > L4/L5 > L6/L7 > L8).

2.3. Experimental Setup

The experimental setup involved a transparent organic glass column, used for filling the ore, that measured 120 mm in height and 100 mm in inner diameter. The experiment was divided into two major groups for the CT scanning tests. Each ore sample was homogenized thoroughly, and specimens of identical mass were selected for the tests. The first group consisted of single-grade ore bulk, with samples used to fill the glass column in ascending order of particle size. The second group comprised graded ore bulk, with sieved ore samples of each gradation used to fill the glass column according to their respective numbers. Each sample had an approximate length of 100 mm. In both groups of experiments, the maximum particle size was less than one-fifth of the inner diameter of the leaching column to minimize edge effects.
The CT machine used for scanning was an industrial X-ray CT machine, model Phoenix v|tome|x c (Waygate Technologies, Winstow, Germany). This CT machine is capable of scanning large-sized samples with diameters of up to 500 mm and lengths of up to 1000 mm and weighing up to 50 kg. It is equipped with a 450 kV X-ray tube for high-density samples requiring high power penetration and a high-performance linear array detector to reduce image artifacts caused by fan-beam CT scattering radiation. In this experiment, the scanning method was consistent across all samples. The CT machine collected two layers of images per second, with a voxel size of 139 μm, a slice thickness of 139 μm, and a resolution of 794 × 794 pixels. The CT scanner was set to a voltage of 420 KV and a current of 1400 μA. Upon completion of the scanning process, the raw data were reconstructed into a three-dimensional solid model using the system’s built-in software. The alignment between the 3D model and the physical sample was visually assessed to validate the accuracy of the scanning results. Scanning was repeated until consistent and reliable results were obtained. For subsequent quantitative analysis based on three-dimensional reconstruction, the validated scan data were preserved. The image results were saved in the horizontal cross-sectional direction. Each sample yielded 720 grayscale images with a resolution of 794 × 794 pixels.

3. Results and Analysis

3.1. The Influence of Particle Size on Pore Structure

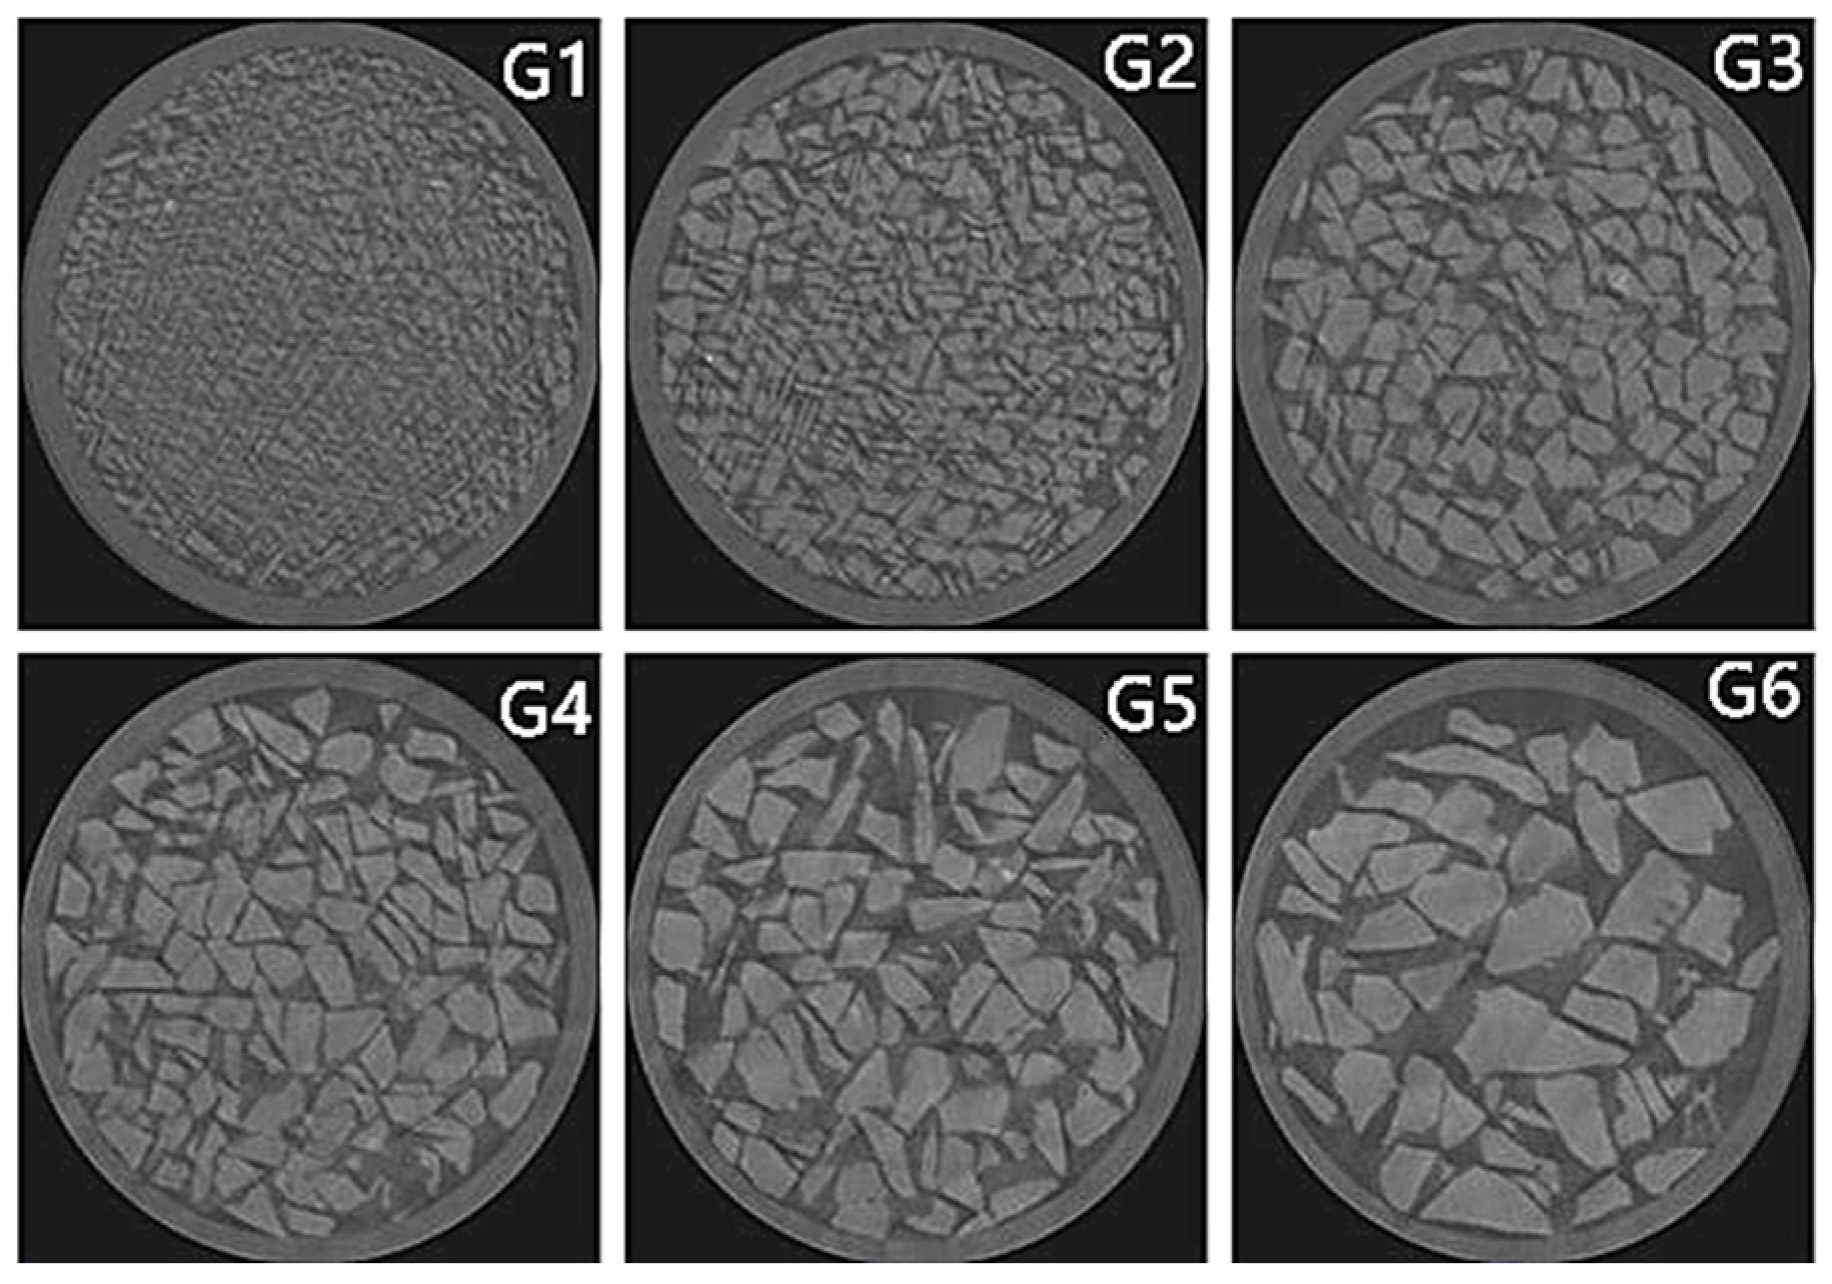
The CT scan results of single-grade ore particles with different particle sizes were compared to analyze the influence of ore particle size on pore structure. A total of six particle sizes (G1–G6) were used for filling and scanning the samples, and the corresponding scan results for different particle sizes are shown in Figure 2.

3.1.1. Porosity and Permeability

For the quantitative analysis of pore-space distribution characteristics in ore granular materials, face porosity was employed as an indicator. Face porosity is defined as the ratio of pore area in the cross-section to the total cross-sectional area:
ϕ = S s S z S s × 100 % ,
where ϕ represents the face porosity (%), Ss is the total cross-sectional area (m2), and Sz is the area of ore particles in the cross-section (m2).
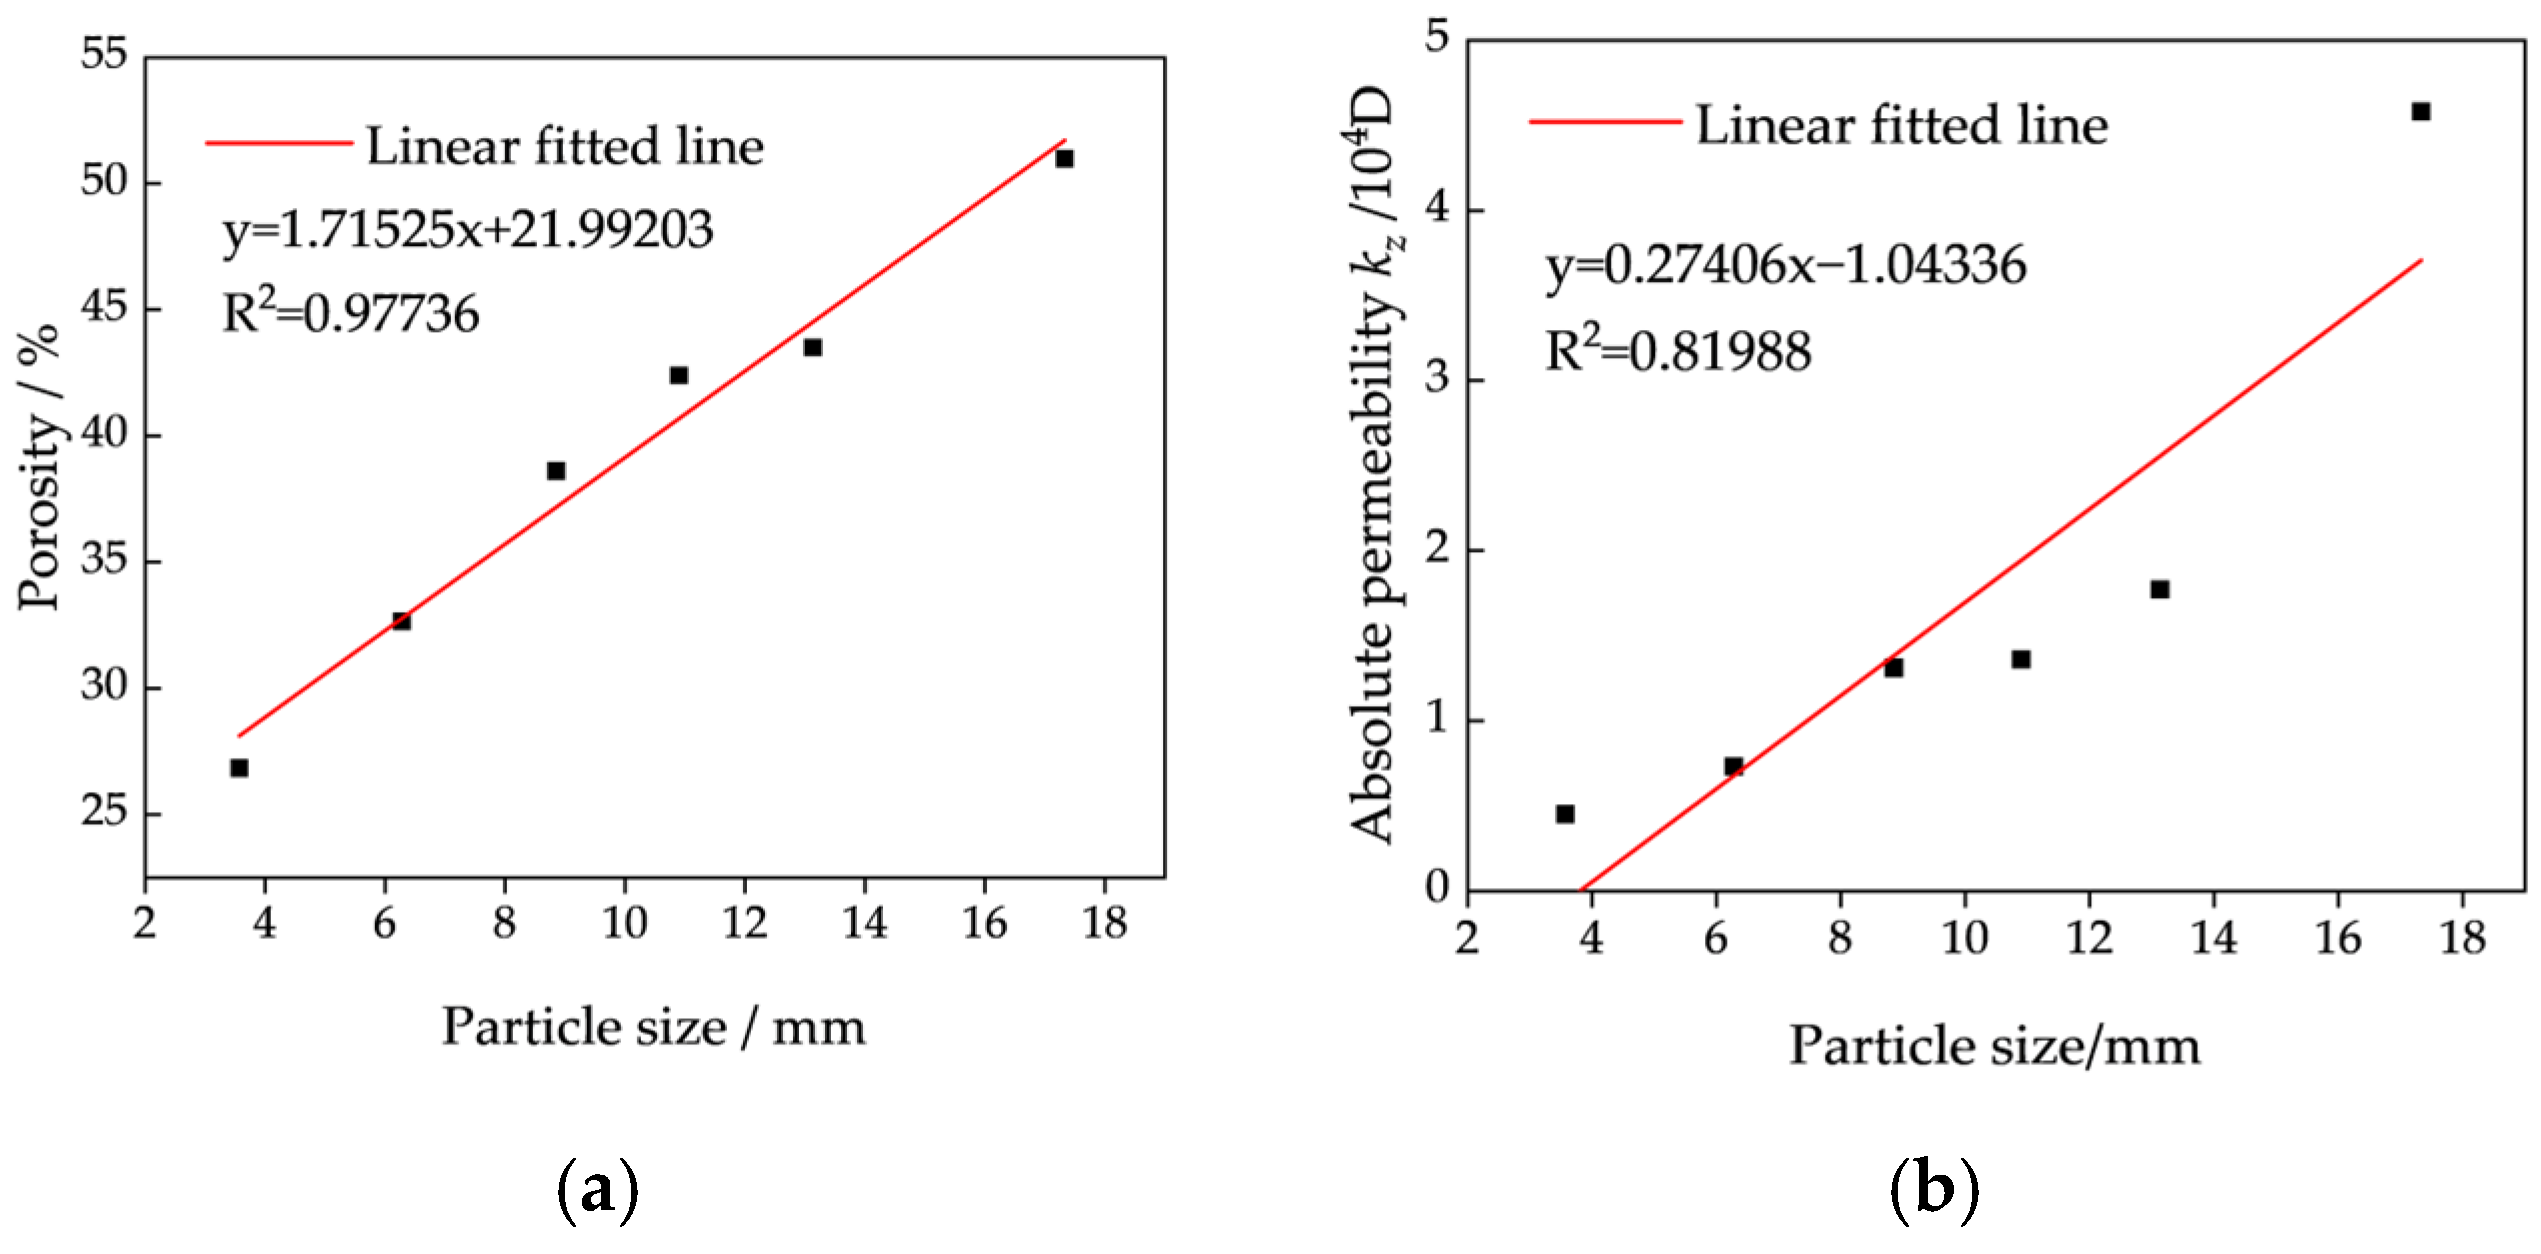
The average face porosity of each image was calculated to determine the porosity of the six single-grade granular samples in the experiment. Each sample consisted of approximately 720 images. To ensure calculation accuracy, images at the bottom and top of the glass column were excluded, and 400 images per sample were selected for porosity analysis. The average value was taken as the porosity of each sample. Additionally, to analyze the relationship between pore structure and seepage performance, absolute permeability (k) was calculated using Avizo software. Since the solution primarily flows downward due to gravity, the z-directional absolute permeability tensor (kz) was analyzed. The results are summarized in Table 4. Based on this table, the relationship between porosity and particle size for single-grade granular materials was plotted and linearly regressed, as shown in Figure 3. From the figure and table, it can be observed that within a certain scale range, the porosity of single-grade granular materials is positively and linearly correlated with particle size, with the porosity increasing as particle size increases. The correlation coefficient of the regression equation reached 0.97. The absolute permeability demonstrates a positive correlation with particle size; as particle size increases, permeability also increases. The correlation coefficient R2 of the regression equation is 0.82.

3.1.2. Connected Pore Network Model

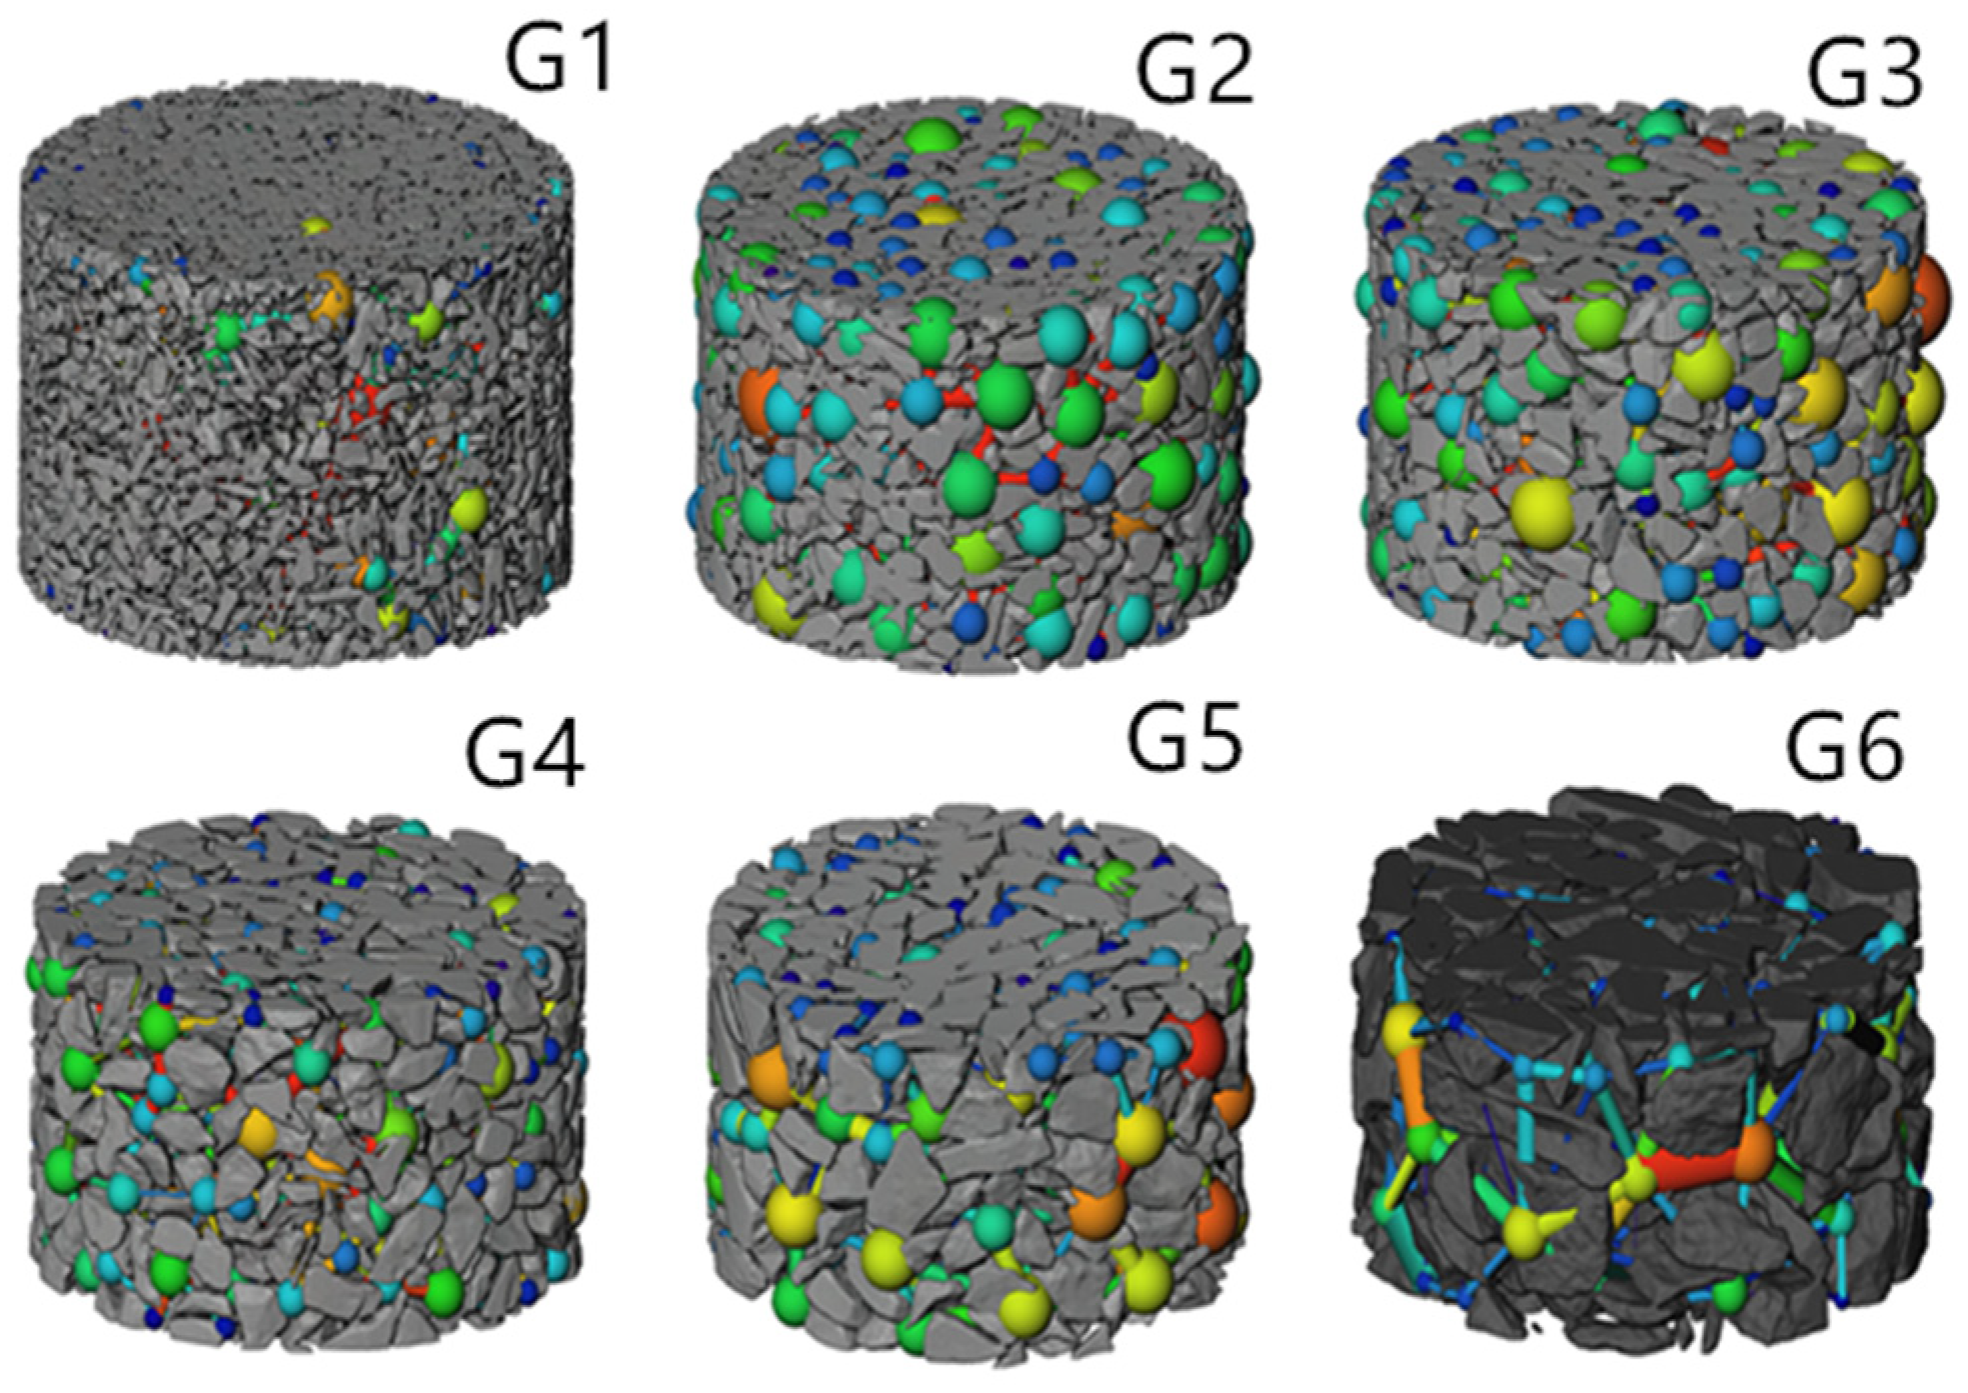
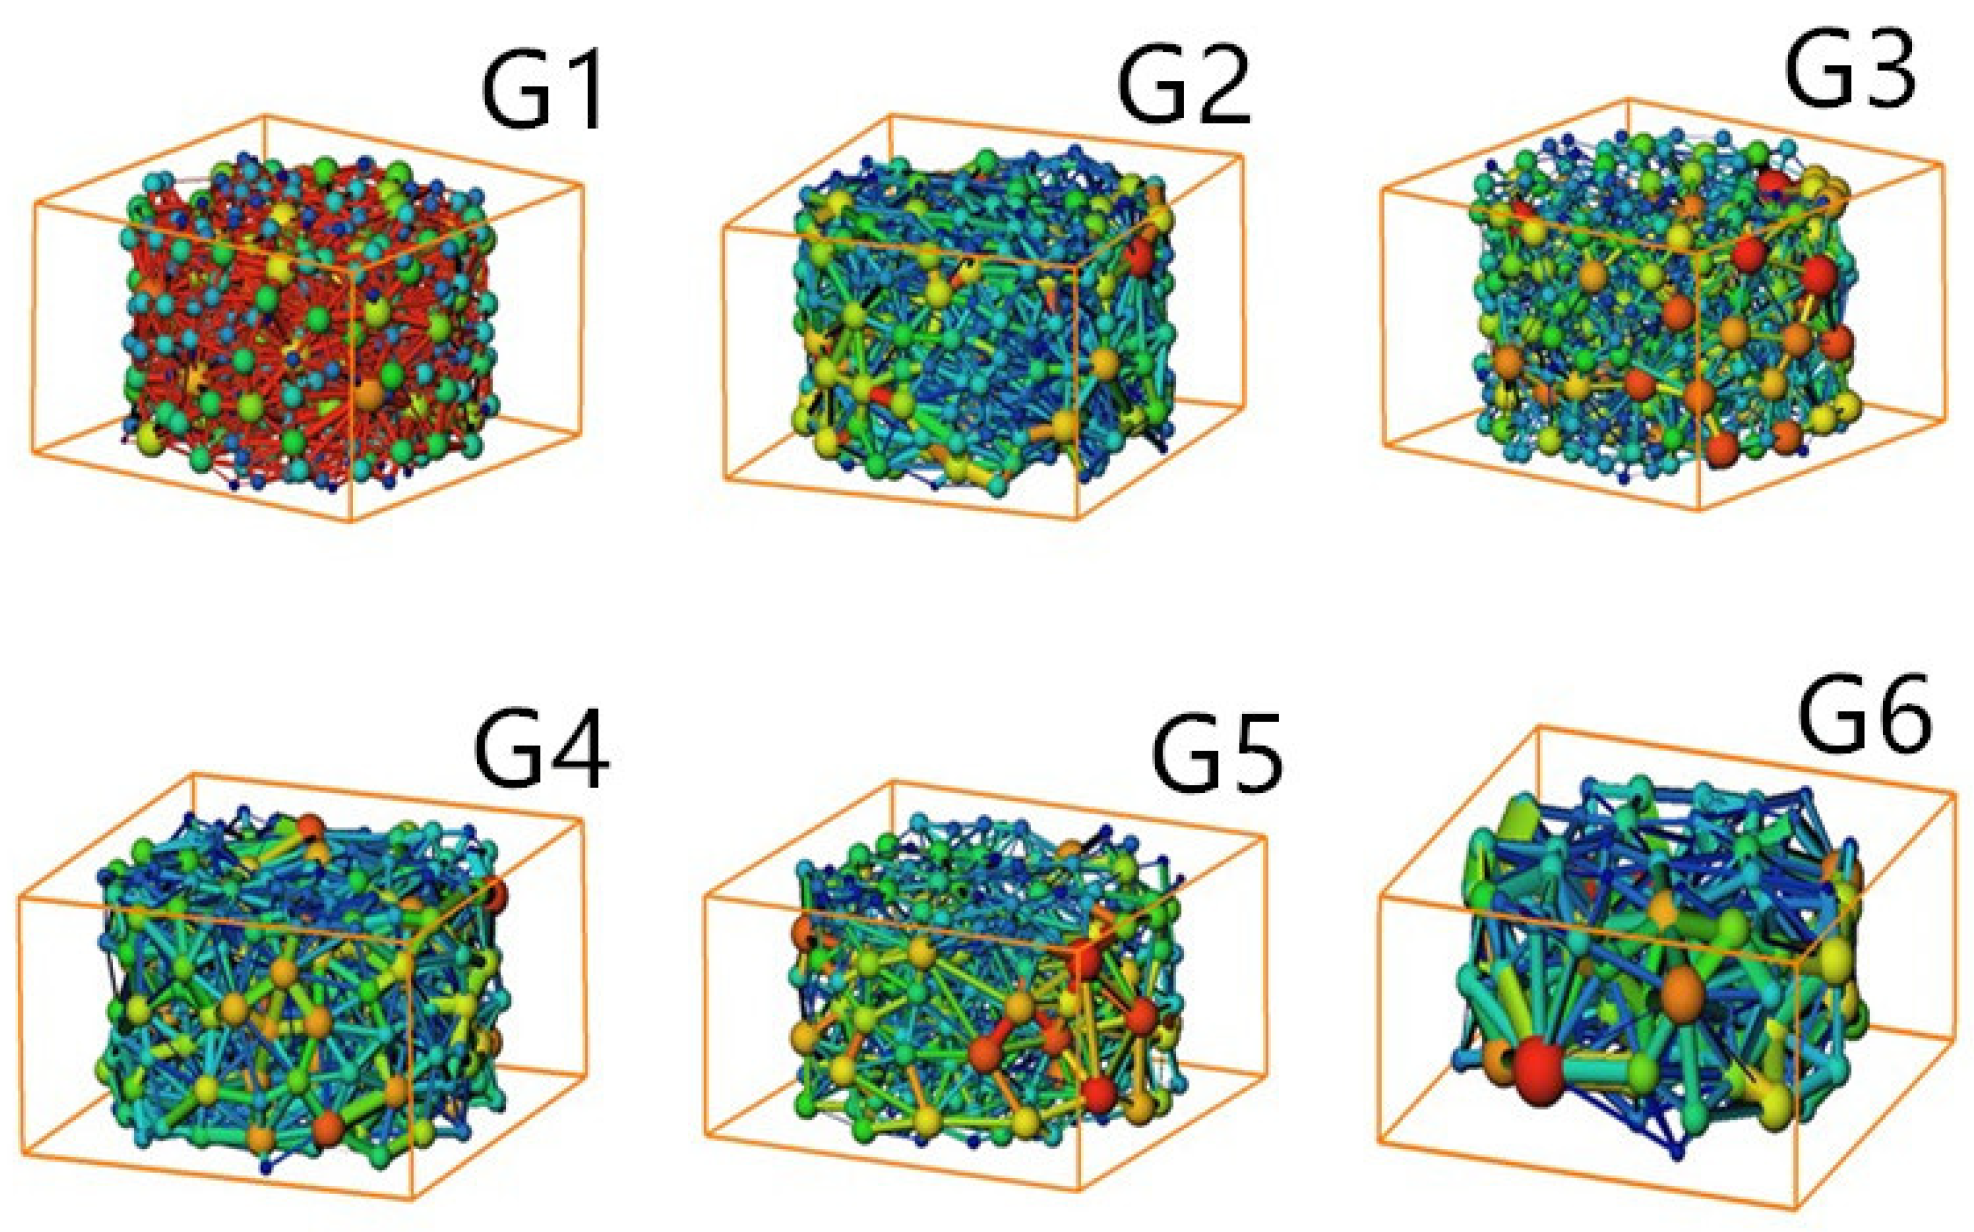
For the quantitative analysis of pores in the stope, it is necessary to further clarify the connectivity between pores in addition to understand their distribution characteristics. The calculation results indicate that the connectivity of the six particle-size models exceeds 97%, demonstrating that most pores in these models maintain good connectivity, with only a small number of isolated pore forms. Figure 4 illustrates the pore network model after removing isolated pores, where spheres represent pores (larger spheres indicate larger pores), and rods between spheres represent connection channels between pores (longer and thinner rods indicate longer and narrower channels).
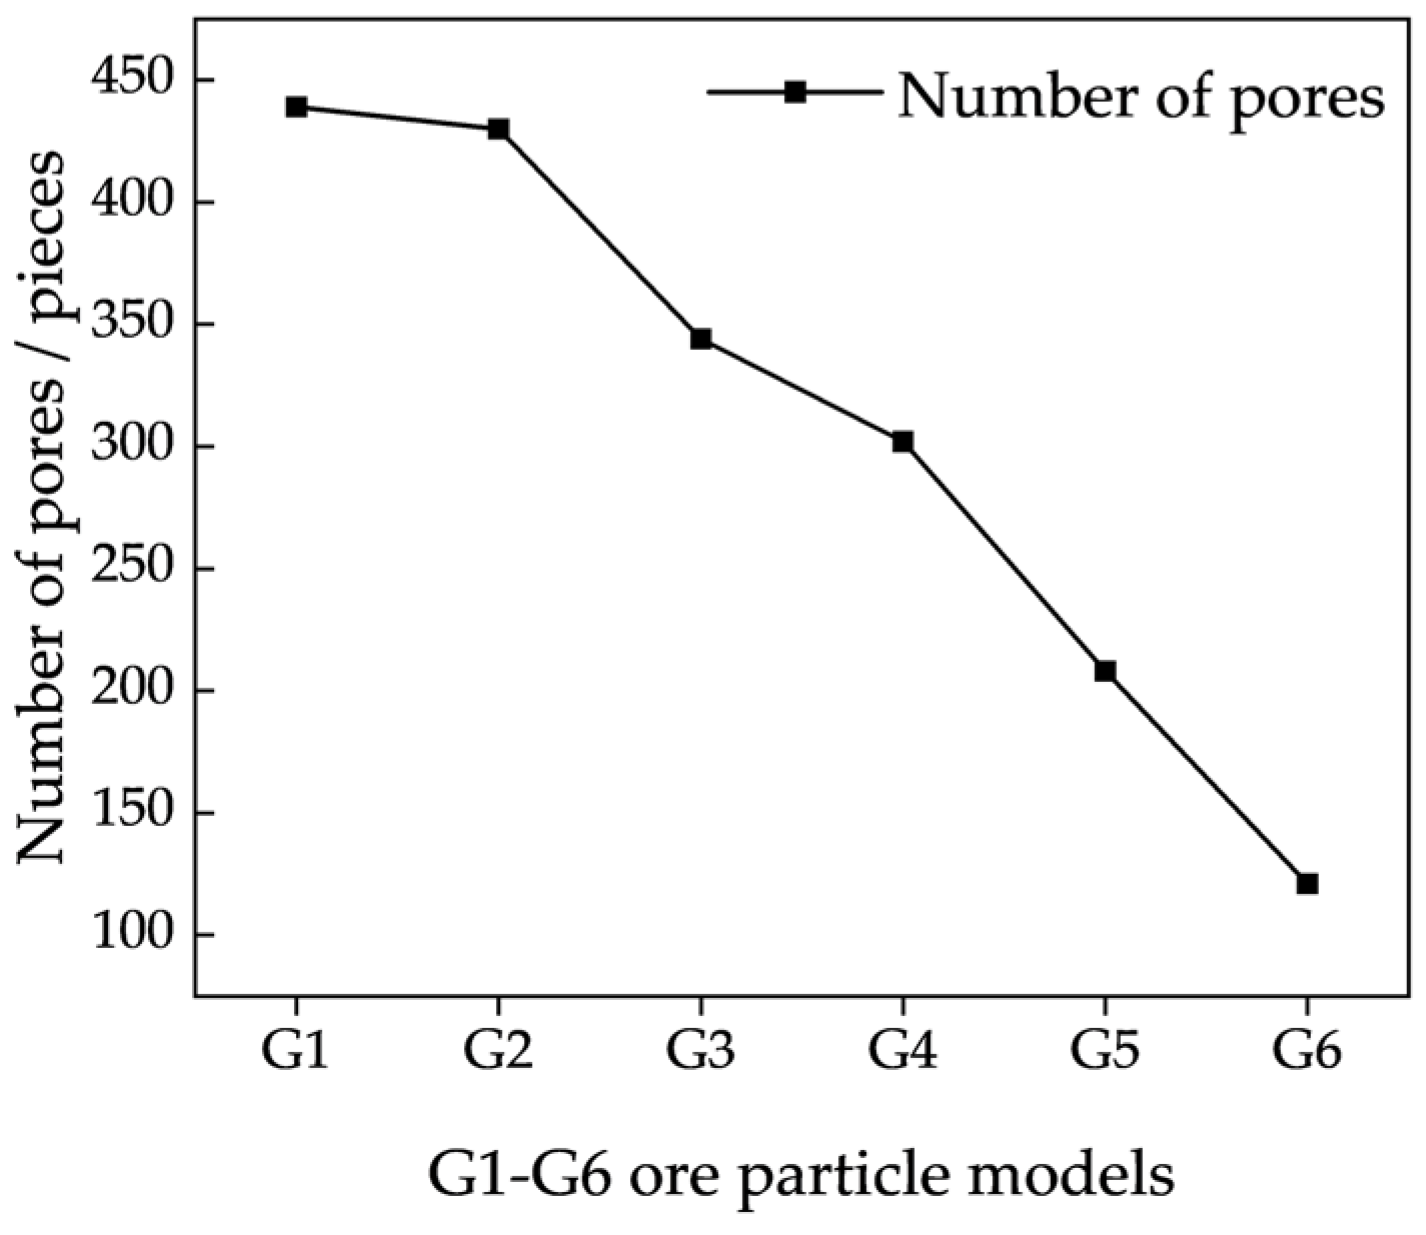
As illustrated in Figure 5 and Figure 6, within the G1–G6 three-dimensional models, the number of spheres exhibits a significant and gradual decrease. The volume of the spheres increases as the particle size of the granular material enlarges. Additionally, the internal pores (represented by spheres) in the model increase with the increase in particle size, while the throats (represented by rods) become correspondingly thicker. Porosity serves as a macroscopic descriptor of the pore structure. To further quantitatively characterize the distribution of pore features, detailed calculations and analyses were performed on parameters such as pore-throat dimensions, coordination numbers, and throat lengths.

3.1.3. Pore Parameter Analysis

The pore parameters of the G1–G6 models with different particle sizes are summarized in Table 5 and illustrated in Figure 7. As shown in the table, with increasing particle size, the number of pores and throats in the model continuously decreases, while the average pore-throat size increases, and the percentage of small-sized pores and short throats decreases. In the early stage, the average coordination number increases with increasing particle size; however, with continued particle-size growth, the average coordination number and its maximum value exhibit a decreasing trend. This occurs because as particle size increases, the pore size formed between particles also increases, and the throat becomes wider, reducing the number of pores connected to the same pore due to the increased size. This phenomenon can be attributed to two primary factors. First, geometric constraints in particle packing play a critical role. Larger particles tend to generate larger pores while reducing the overall contact area between particles. As a result, the number of contact points (i.e., coordination number) per particle may decrease. When large particles are packed, they are more likely to adopt simple structural arrangements, such as hexagonal or cubic packing. In contrast, smaller particles, due to their size variability and greater randomness, tend to form more complex, multi-directional contacts. Although large particles generate larger pores, the total number of pores per unit volume decreases, leading to fewer inter-pore throats. Additionally, while throat size may increase in larger particle systems, the number of throats decreases—for instance, two large pores may be connected by only a single wide throat. Second, the calculation of coordination number in Avizo 3D modeling relies on accurate throat identification. Connections smaller than the defined throat-size threshold are excluded from the analysis. It is important to note that the current conclusions are based on a limited number of experimental samples. Therefore, further validation through more refined experiments involving a larger sample size is necessary. Figure 7a shows the normal distribution fitting graph of the equivalent radius of pores. It can be observed that the peak of the pore-size distribution curve for models G1–G6 shifts to the right with increasing particle size. The distribution range of the curves for G1–G4 is relatively narrow, and the maximum percentage value gradually decreases, indicating a more concentrated size distribution. However, as particle size increases, the pore-size distribution becomes more dispersed. For example, in model G1, pores smaller than 1.5 mm account for 95.42% of the total pores, whereas in model G2, pores smaller than 1.5 mm account for only 38.93%. For models G5–G6, compared with the previous four models, the pore-size distribution range is wider, and the peak of the curve is significantly lower. The peak still shifts to the right with increasing particle size, indicating that larger particle sizes increase the number and percentage of large pores, which benefits solution seepage.
As illustrated in Table 4 and Figure 7b, the cumulative curves of models G1–G6 exhibit a rightward shift with increasing particle size. This indicates that as particle size increases, the proportion of small-sized throats decreases while the proportion of large-sized throats progressively increases. Notably, the curve for model G1 rises most steeply, followed by G2, suggesting that these models predominantly feature smaller throat sizes. The cumulative change curves of throat sizes for models G3 and G4 are similar, whereas those for models G5 and G6 differ significantly. This highlights that with increasing particle size, the variation in throat size becomes more pronounced, and larger particle sizes contribute to an increase in both the number and percentage of large throats.
As depicted in Figure 7c, the average throat length of models G1–G4 demonstrates a gradual increase with increasing particle size, whereas the average throat length of models G5 and G6 is markedly larger compared with the previous four models. The curve for model G1 rises the most steeply, followed by G2, indicating a higher prevalence of short throats in these models. The cumulative change curves for the throat sizes in models G3 and G4 are comparable. These observations suggest that as particle size increases, the number and percentage of long throats increase substantially. Throats exceeding 11 mm in length are virtually absent in models G1 and G2, while they account for approximately 5% in models G3 and G4, and exceed 20% in models G5 and G6. Long throats tend to prolong the flow time of solutions within them, which may hinder solution penetration. However, a comprehensive evaluation should consider throat size in conjunction with pore size.

3.2. The Influence of Particle Gradation on Pore Structure

Based on the gradation models G1–G6 with their varying particle sizes, the experimental results are analyzed as follows:

3.2.1. Porosity Analysis

According to the gradation curve, the content of particles smaller than a specific particle size (d10 and d60) can be calculated, which correspond to the particle sizes at which 10% and 60% of the total mass of particles are finer. Based on this, the Cu for different particle gradations can be determined as follows. The parameters of each model are shown in Table 6.
C u = d 60 / d 10
From the analysis of Figure 8, it is evident that d10 and d20 have a significant impact on porosity, while d30 has a relatively smaller effect. All three parameters exhibit a linear relationship with porosity, with correlation coefficients (R2) of 0.94, 0.93, and 0.43, respectively. As the cumulative content increases, so does the porosity. However, beyond d40, the influence on porosity diminishes, and the two no longer exhibit a linear relationship, with R2 values around 0.3. This indicates that as particle size increases, its influence on porosity decreases. From the above analysis, it can be concluded that within a certain particle-size range, the content of fine particles in graded granular materials significantly affects porosity. Specifically, the higher the proportion of fine particles, the lower the porosity.
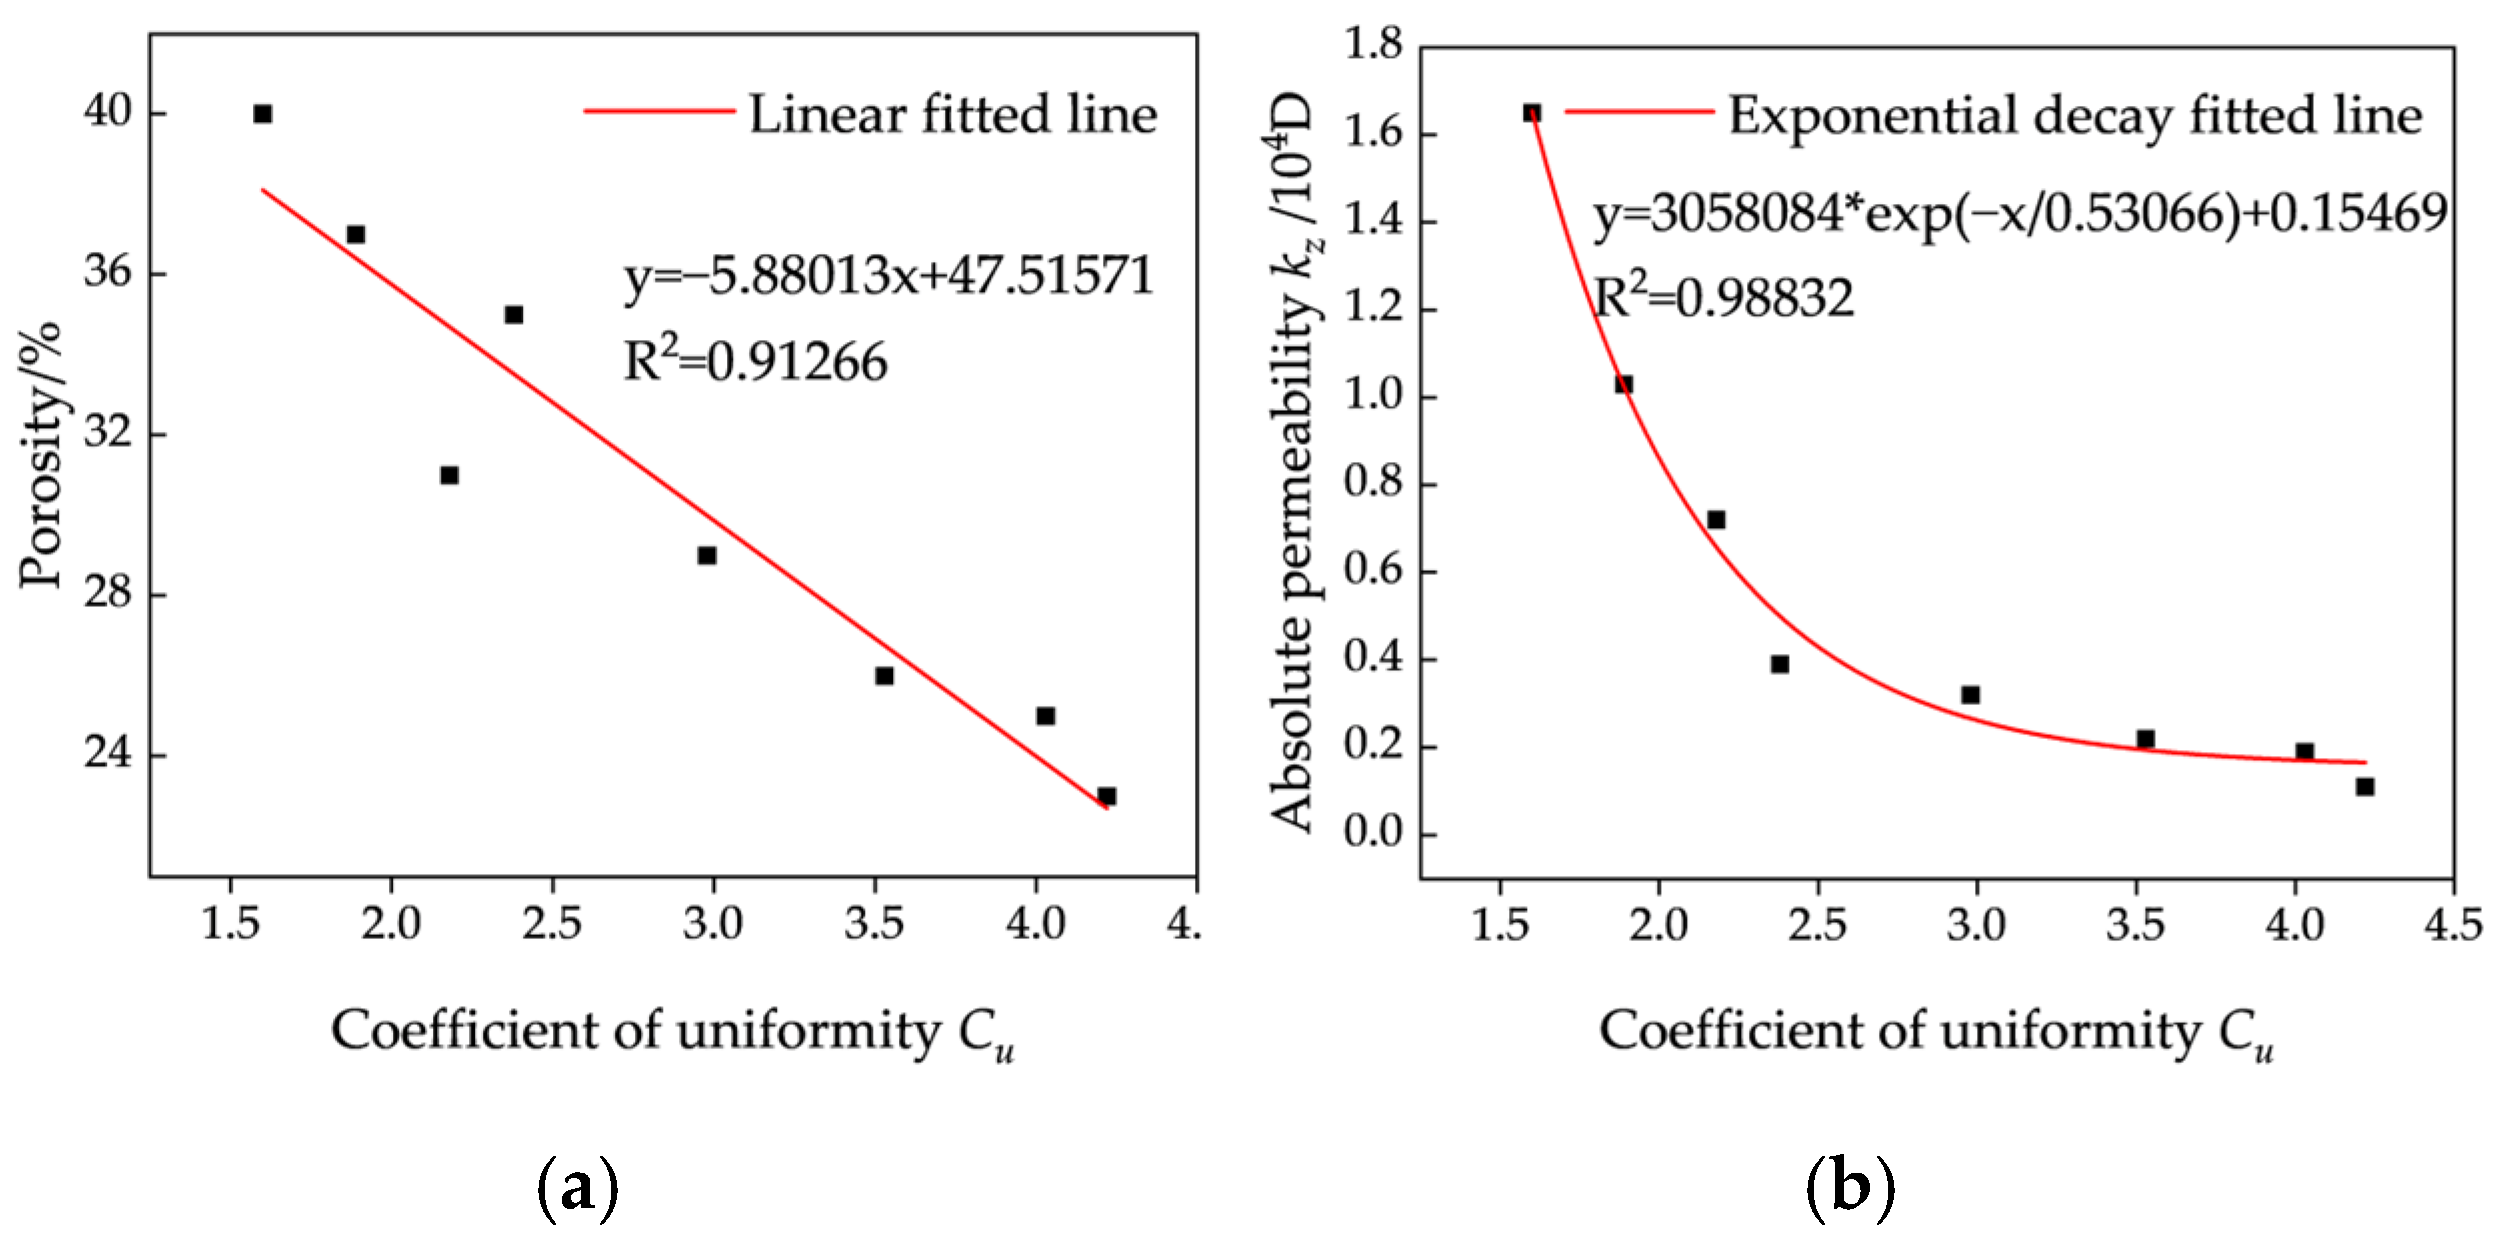
As depicted in Figure 9a, the Cu and porosity exhibit an approximate linear relationship, with a correlation coefficient (R2) of 0.91. This relationship is negative, characterized by a negative slope. Within a specific gradation range, a smaller coefficient of uniformity—indicating a more uniform particle-size distribution—corresponds to a higher porosity; conversely, a larger coefficient of uniformity results in lower porosity. As illustrated in Figure 9b, the Cu and the absolute permeability in the vertical direction (kz) demonstrate an exponential relationship with a downward trend, exhibiting a correlation coefficient (R2) of 0.99. This suggests that within a certain range, as the coefficient of uniformity increases, the absolute permeability of the ore particle model decreases, which negatively affects liquid flow during leaching and consequently reduces the leaching efficiency. When the coefficient of uniformity is less than 2.5, the absolute permeability decreases sharply with increasing non-uniformity. Conversely, when the coefficient of uniformity exceeds 2.5, the decrease in absolute permeability becomes gradual. These findings indicate that as the proportion of fine particles increases, permeability drops significantly; however, further increases in fine-particle content have a diminishing impact on permeability.

3.2.2. Connected Pore Network Model

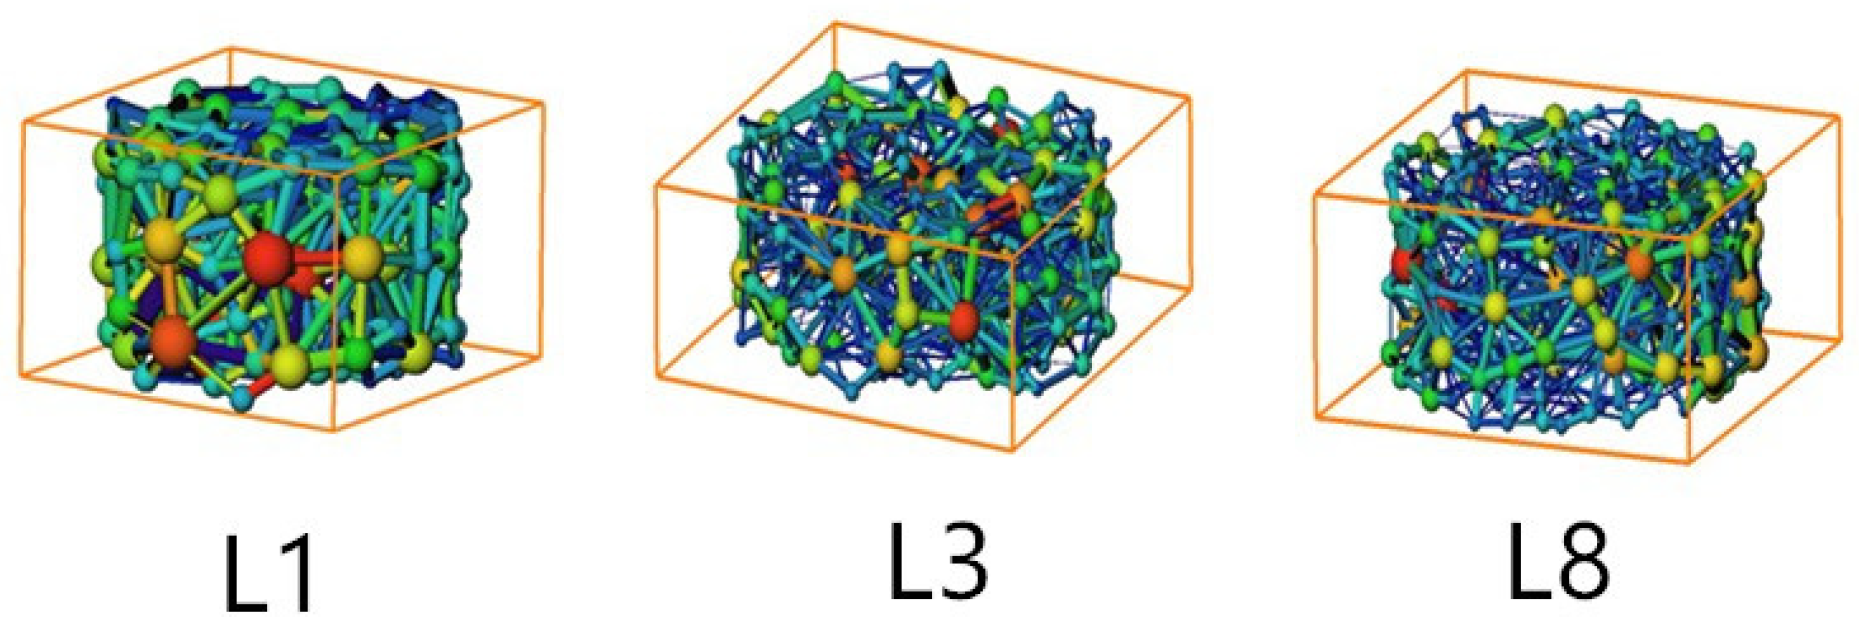
For the L1–L4 and L5–L8 models, the content of fine particles continuously increases while the content of coarse particles decreases. The calculation results indicate that as the fine-particle content in the grading increases, the number of spheres in the pore network diagram significantly increases, indicating an increase in pore quantity. However, the number of small spheres also increases significantly, suggesting that as the fine-particle content rises, fine particles fill the pores formed by coarse particles, leading to a reduction in large pores and an increase in small pores. Additionally, as the fine-particle content increases, the number of fine sticks (representing small throats) also increases significantly, indicating a decrease in fluid flow performance and an increased likelihood of blockage. Notably, the L1 model exhibits the largest and most numerous large pores due to its high coarse-particle content and low fine-particle content, resulting in more large pores formed by coarse-particle accumulation that remain largely unfilled by fine particles.
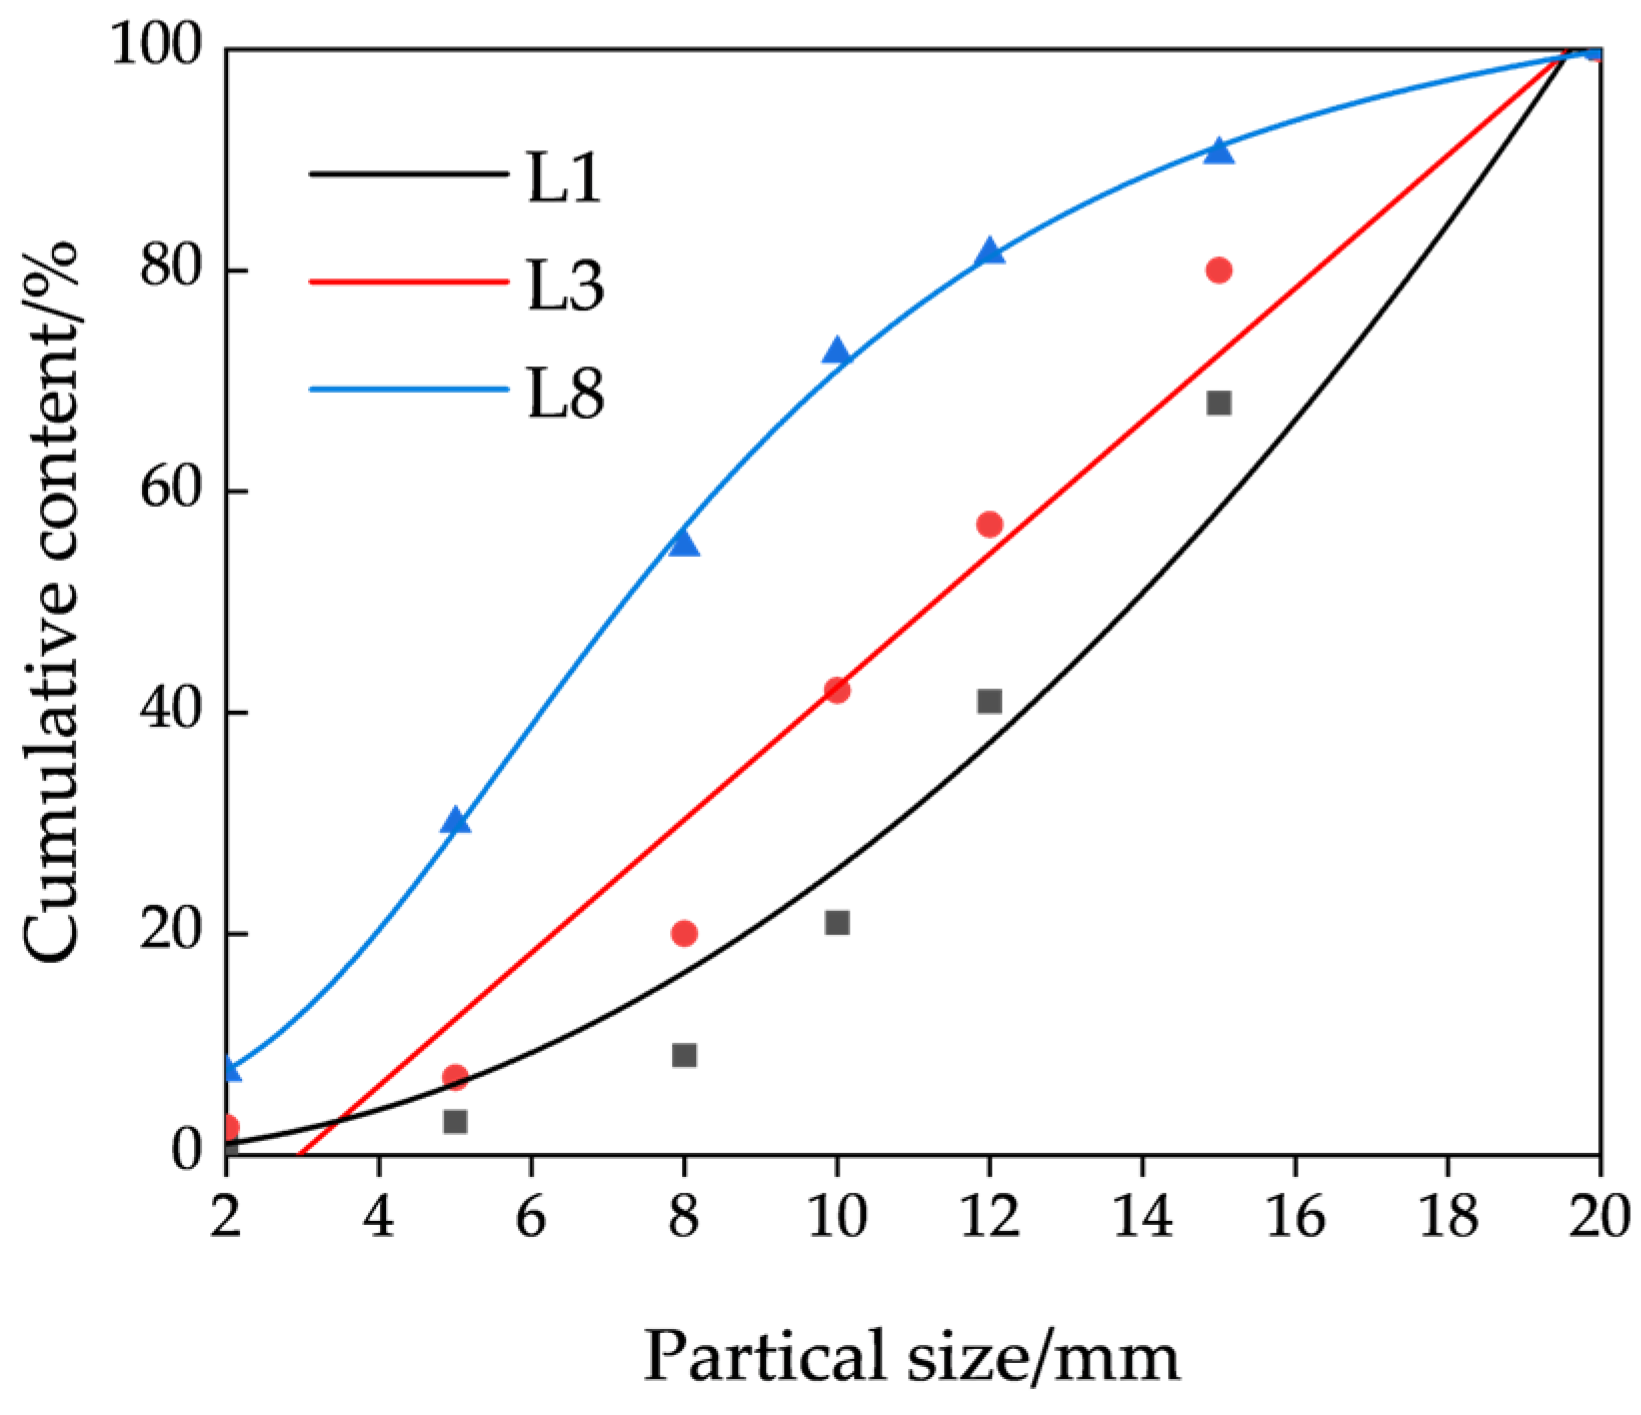
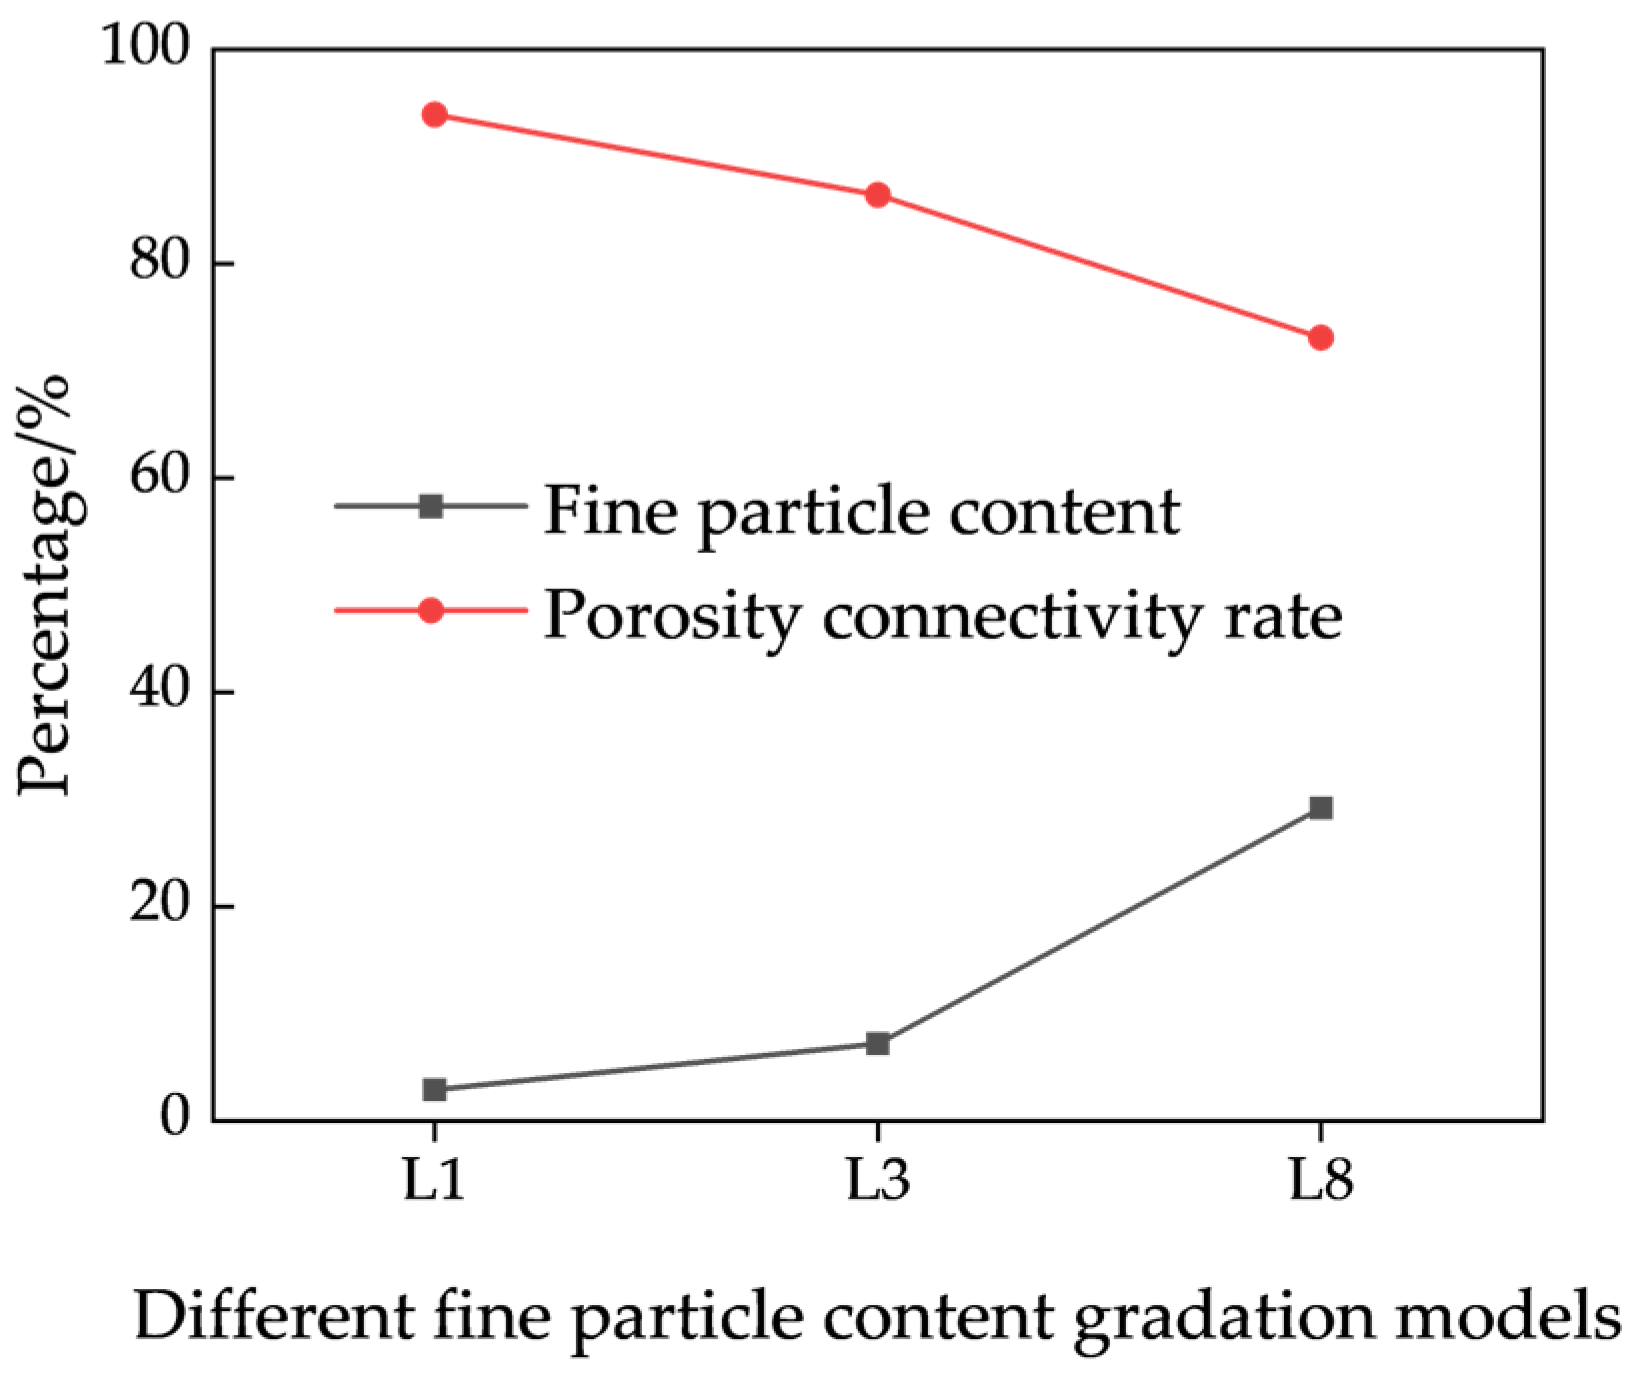
Representative L1, L3, and L8 gradation models were selected to conduct a quantitative analysis of pore structure parameters. In Figure 10, the L1 curve is concave, indicating a high coarse-particle content and a relatively stable solid skeleton formed by coarse particles, allowing fine particles to move within the pores formed by coarse particles. The L3 curve approaches a straight line, indicating a relatively uniform distribution of coarse and fine particles, making fine particles less likely to shift. The L8 curve is convex, indicating a high fine-particle content, much greater than that of the coarse-particle content, making it more difficult for fine particles to migrate. The pore network stick models of the various gradation models are presented in Figure 11. Avizo-based modeling and analysis demonstrate that the connectivity of the L1, L3, and L8 models decreases progressively, with connectivity values of 93.92%, 86.42%, and 73.10%, respectively. The total pore count and the number of isolated pores for these models are summarized in Table 7. These findings suggest that an increase in fine-particle content leads to a more compact packing structure of the ore particle models, which consequently reduces pore network connectivity. Specifically, the fine-particle content in the L3 and L8 models is 2.5 and 10 times that of the L1 model, respectively, resulting in connectivity reductions to 92% and 77.8% of the L1 model’s value. The correlation between fine-particle content and connectivity across the various models is illustrated in Figure 12.

3.2.3. Pore-Size Distribution

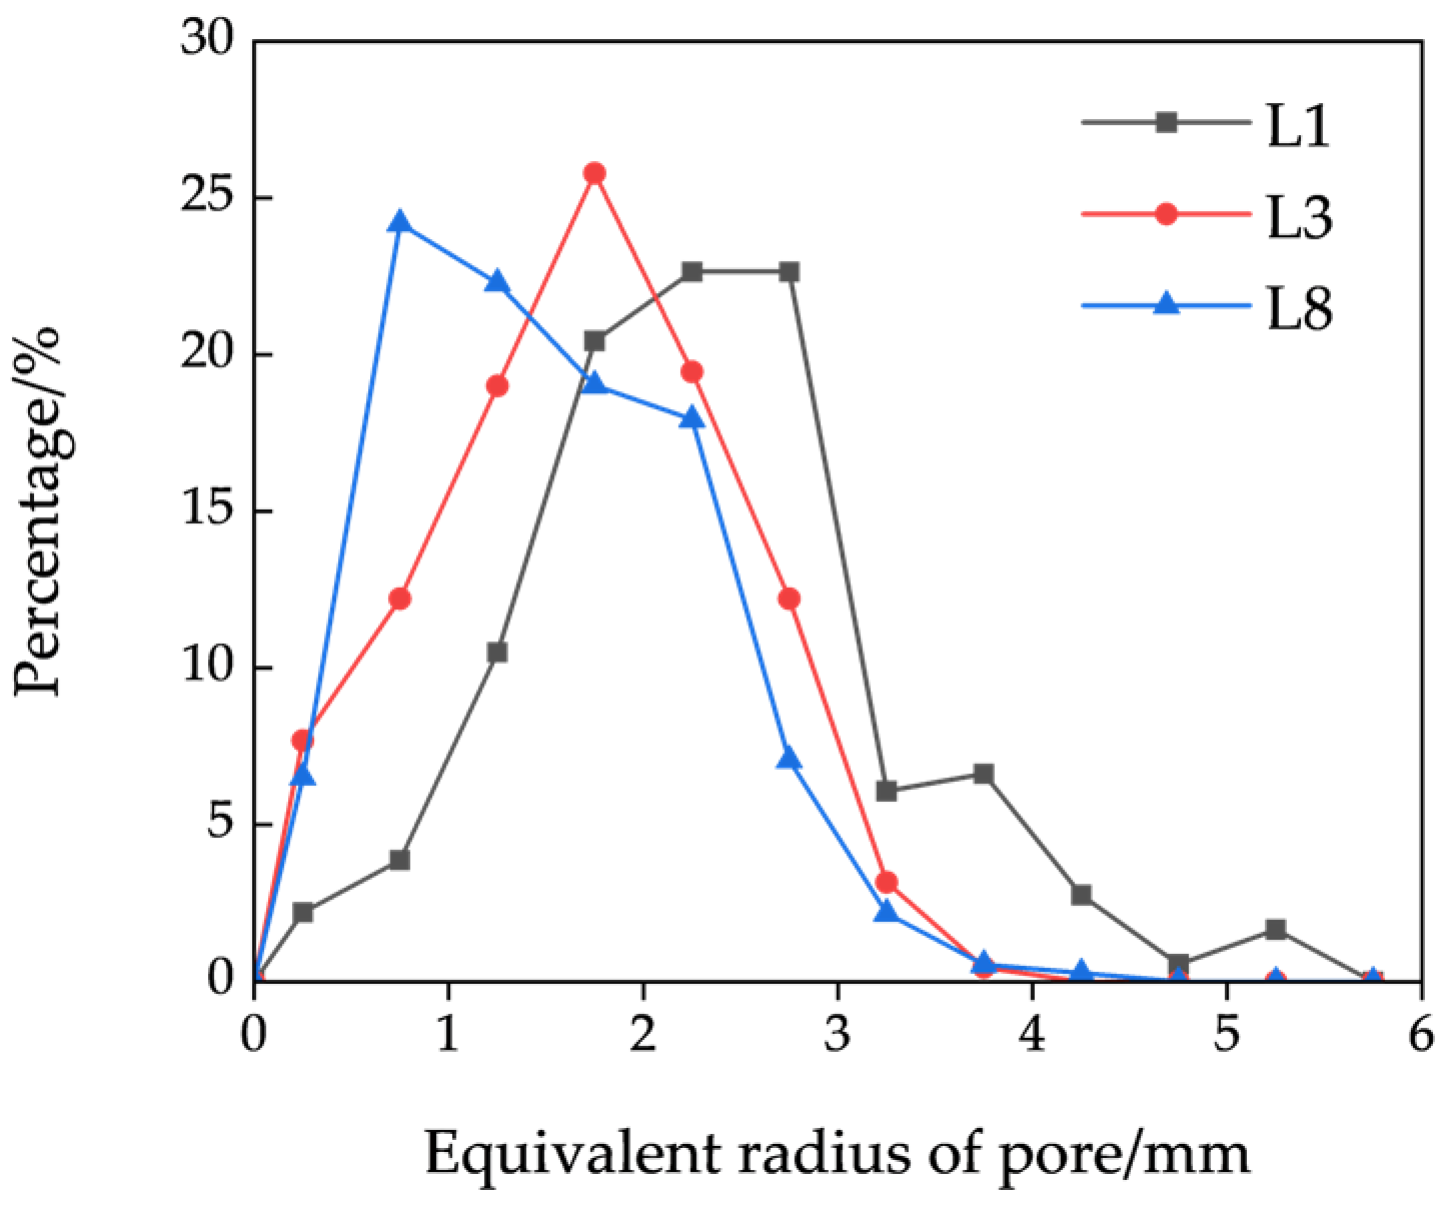
After calculation and analysis, the equivalent diameter distribution of the three-dimensional pores and pore parameters for the different gradation models are shown in Figure 13 and Table 8. It can be observed from the figure that the overall trend of pore-size distribution in the different models is similar: as pore size increases, the percentage of pores first increases and then decreases. However, the peak and average pore sizes differ significantly among the models. For models L1, L3, and L8, the peak pore sizes occur in the ranges of 2.5–3 mm, 1.5–2 mm, and 0.5–1 mm, respectively, with average pore sizes of 2.33 mm, 1.75 mm, and 1.50 mm, respectively. This indicates that as the fine-particle content increases, both the peak and average pore sizes decrease. Furthermore, as shown in Table 6, the number of pores varies significantly among the models. This is because fine particles fill the large pores formed by coarse particles, reducing the pore size while increasing the pore quantity. Model L1 contains a large number of large pores concentrated in the range of 1.5–3 mm, accounting for 65.75% of the total pore count; model L3 contains pores concentrated in the range of 1–2.5 mm, accounting for 64.25% of the total pore count; and model L8 contains a large number of small pores in the range of 0.5–1.5 mm, accounting for 46.47% of the total pore count.
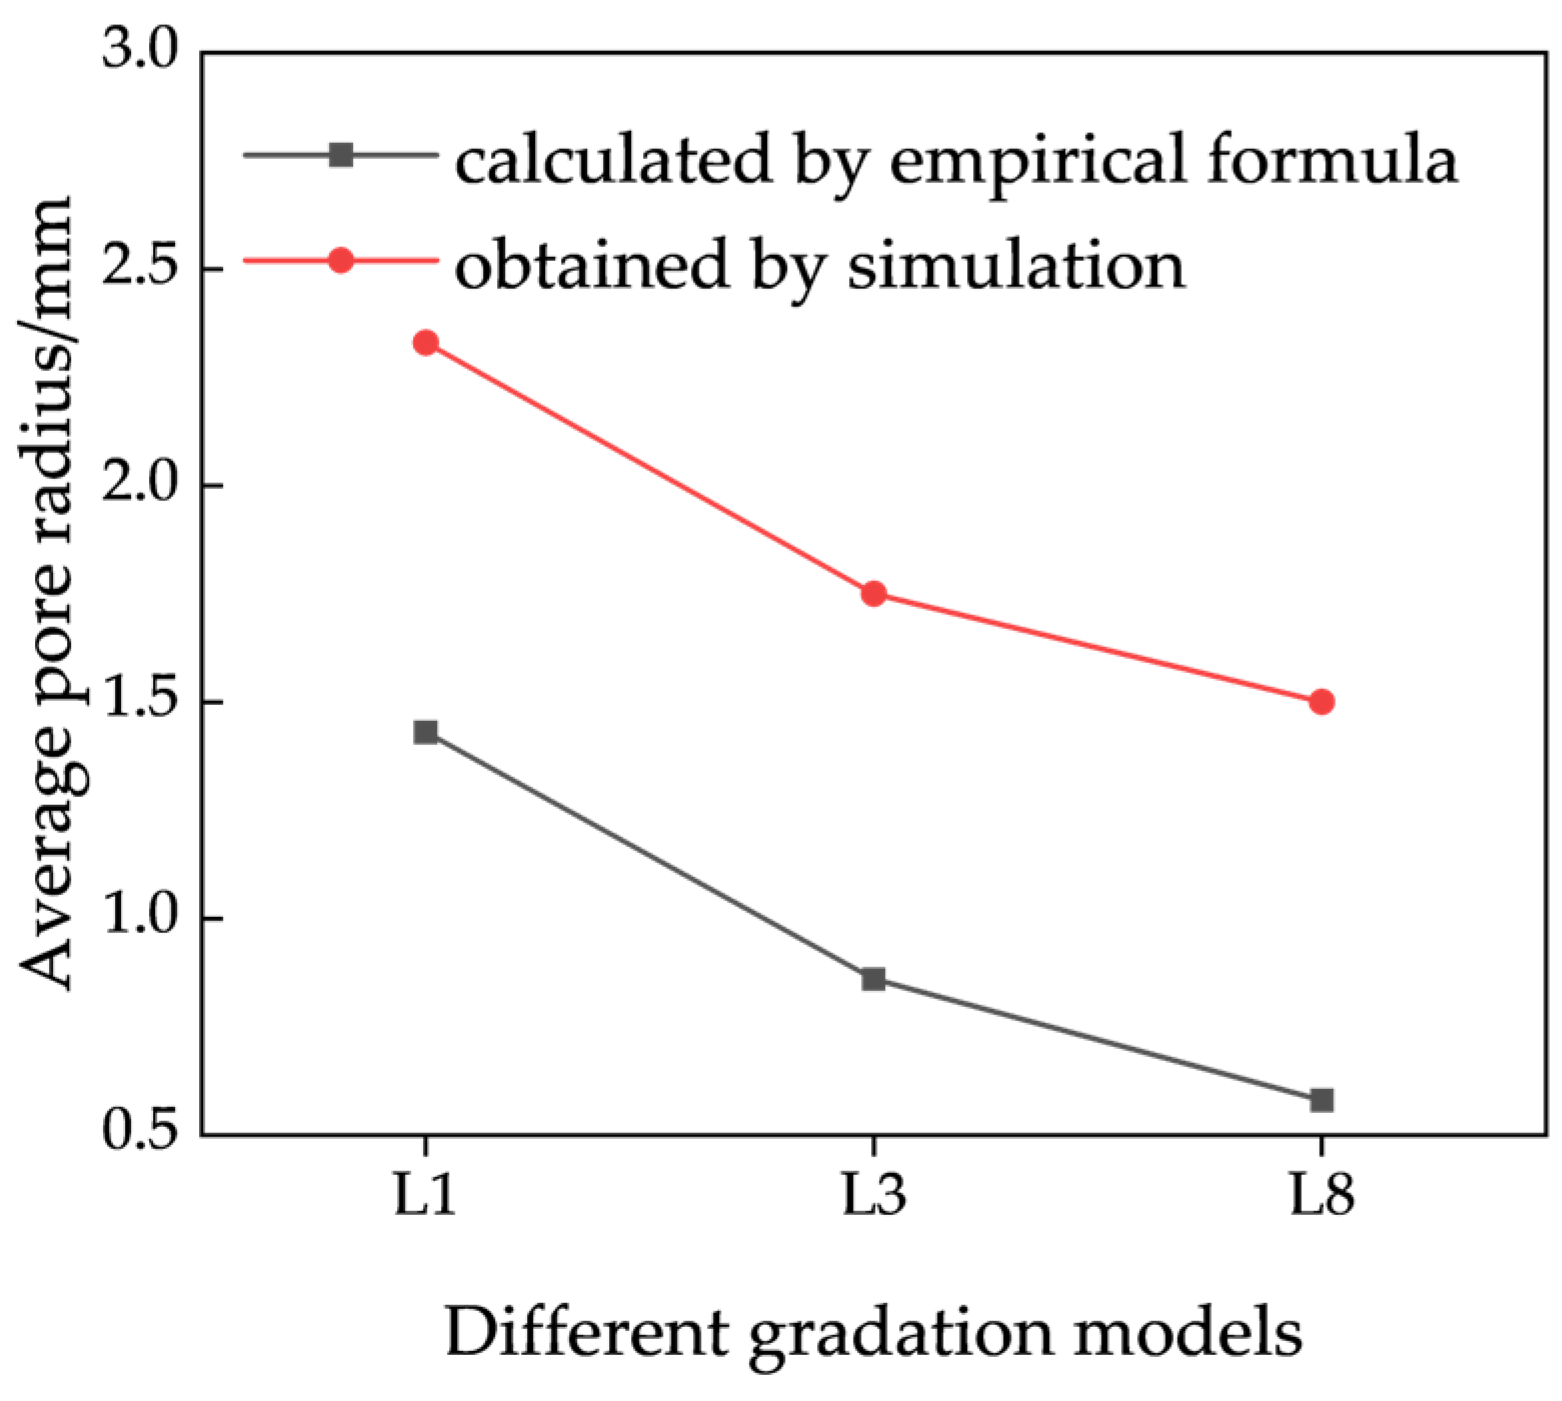
The average diameter of voids in a graded granular medium is primarily influenced by the fine-particle size and the uniformity coefficient of the gradation curve, with the fine-particle size serving as the dominant factor. Both the continuous gradation soil Formula (3) and Pavločić’s Formula (4) establish a relationship between the average equivalent diameter of voids and the fine-particle size. Using the empirical Formula (3), the equivalent diameter of voids was calculated, from which the equivalent radius was derived, as presented in Table 9. When compared with the equivalent radius obtained from the three-dimensional model, the average equivalent radius determined through image analysis was found to be larger than that calculated by the empirical formula, as shown in Figure 14. This discrepancy can be attributed to two main factors: First, the scanning resolution limits the detection of voids smaller than the resolution threshold, which are excluded from the statistical analysis, thereby increasing the average void size. Second, the empirical formula calculates the average throat diameter of the voids rather than accounting for the entire void body, resulting in a smaller computed value. These factors collectively contribute to the observed difference between the two methods.
D = 0.25 C u 1 / 8 d 20 ,
D = 0.535 C u 1 / 6 ϕ 1 ϕ d 17
where D is the average equivalent pore diameter; d17 and d20 refer to the particle sizes corresponding to cumulative contents of 17% and 20%, respectively, expressed in millimeters; ϕ represents the porosity; and Cu indicates the coefficient of uniformity.

3.2.4. Throat-Size Distribution

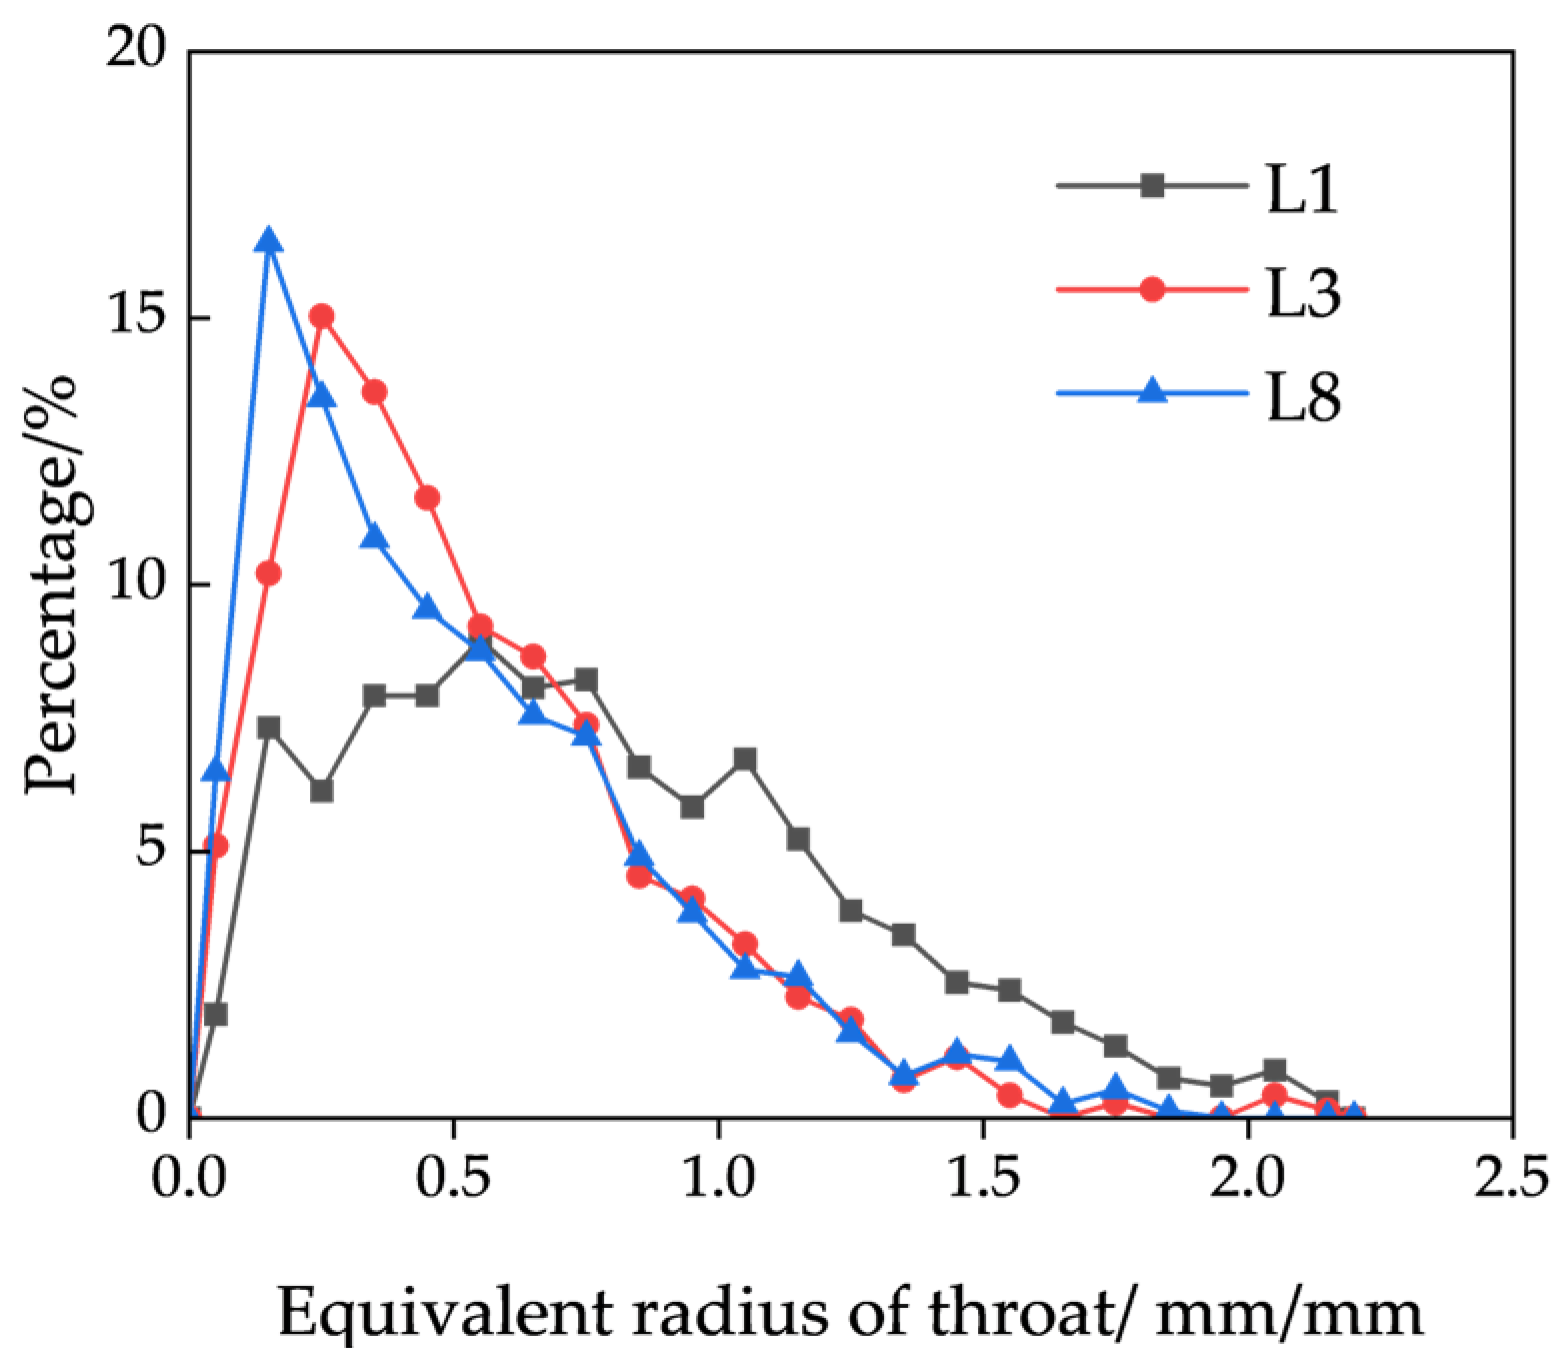
Through calculation and analysis, the equivalent diameter distribution and throat parameters of different gradation models are presented in Figure 15 and Table 10. The number of throats in models L1, L3, and L8 are 669, 703, and 745, respectively, with average throat sizes of 0.80 mm, 0.53 mm, and 0.48 mm, respectively. These results indicate that as the fine-particle content increases, the number of throats increases slightly while the throat size decreases, with a significant increase in both the number and proportion of small-sized throats. As shown in the figure, the throat-size distribution of model L1 is relatively dispersed, with a uniform distribution of throat sizes in the range of 0.1–1.3 mm and a considerable number of large-sized throats present. When the throat size is less than 0.5 mm, the proportion of throats of each size in models L3 and L8 first increases and then decreases and is consistently higher than that in model L1. The peak proportion in model L3 occurs in the 0.2–0.3 mm range, and in model L8, it occurs in the 0.1–0.2 mm range, accounting for 15.03% and 16.42% of the total number of throats, respectively. This demonstrates that an increase in fine-particle content leads to a significant increase in small-sized throats. When the throat size exceeds 0.6 mm, the proportion of throats of each size in models L3 and L8 is similar and consistently lower than that in model L1, indicating a reduction in the number of large-sized throats with increasing fine-particle content. Compared with model L1, the fine-particle content in models L3 and L8 is 2.5 and 10 times higher, respectively, and the cumulative content of large-sized throats (>0.6 mm) decreases to 58.83% and 58.36% of that in model L1. In conclusion, with the increase in fine-particle content, the total number of throats increases slightly, while the number of small-sized throats increases significantly and the number of large-sized throats decreases.

3.2.5. Throat-Length Distribution

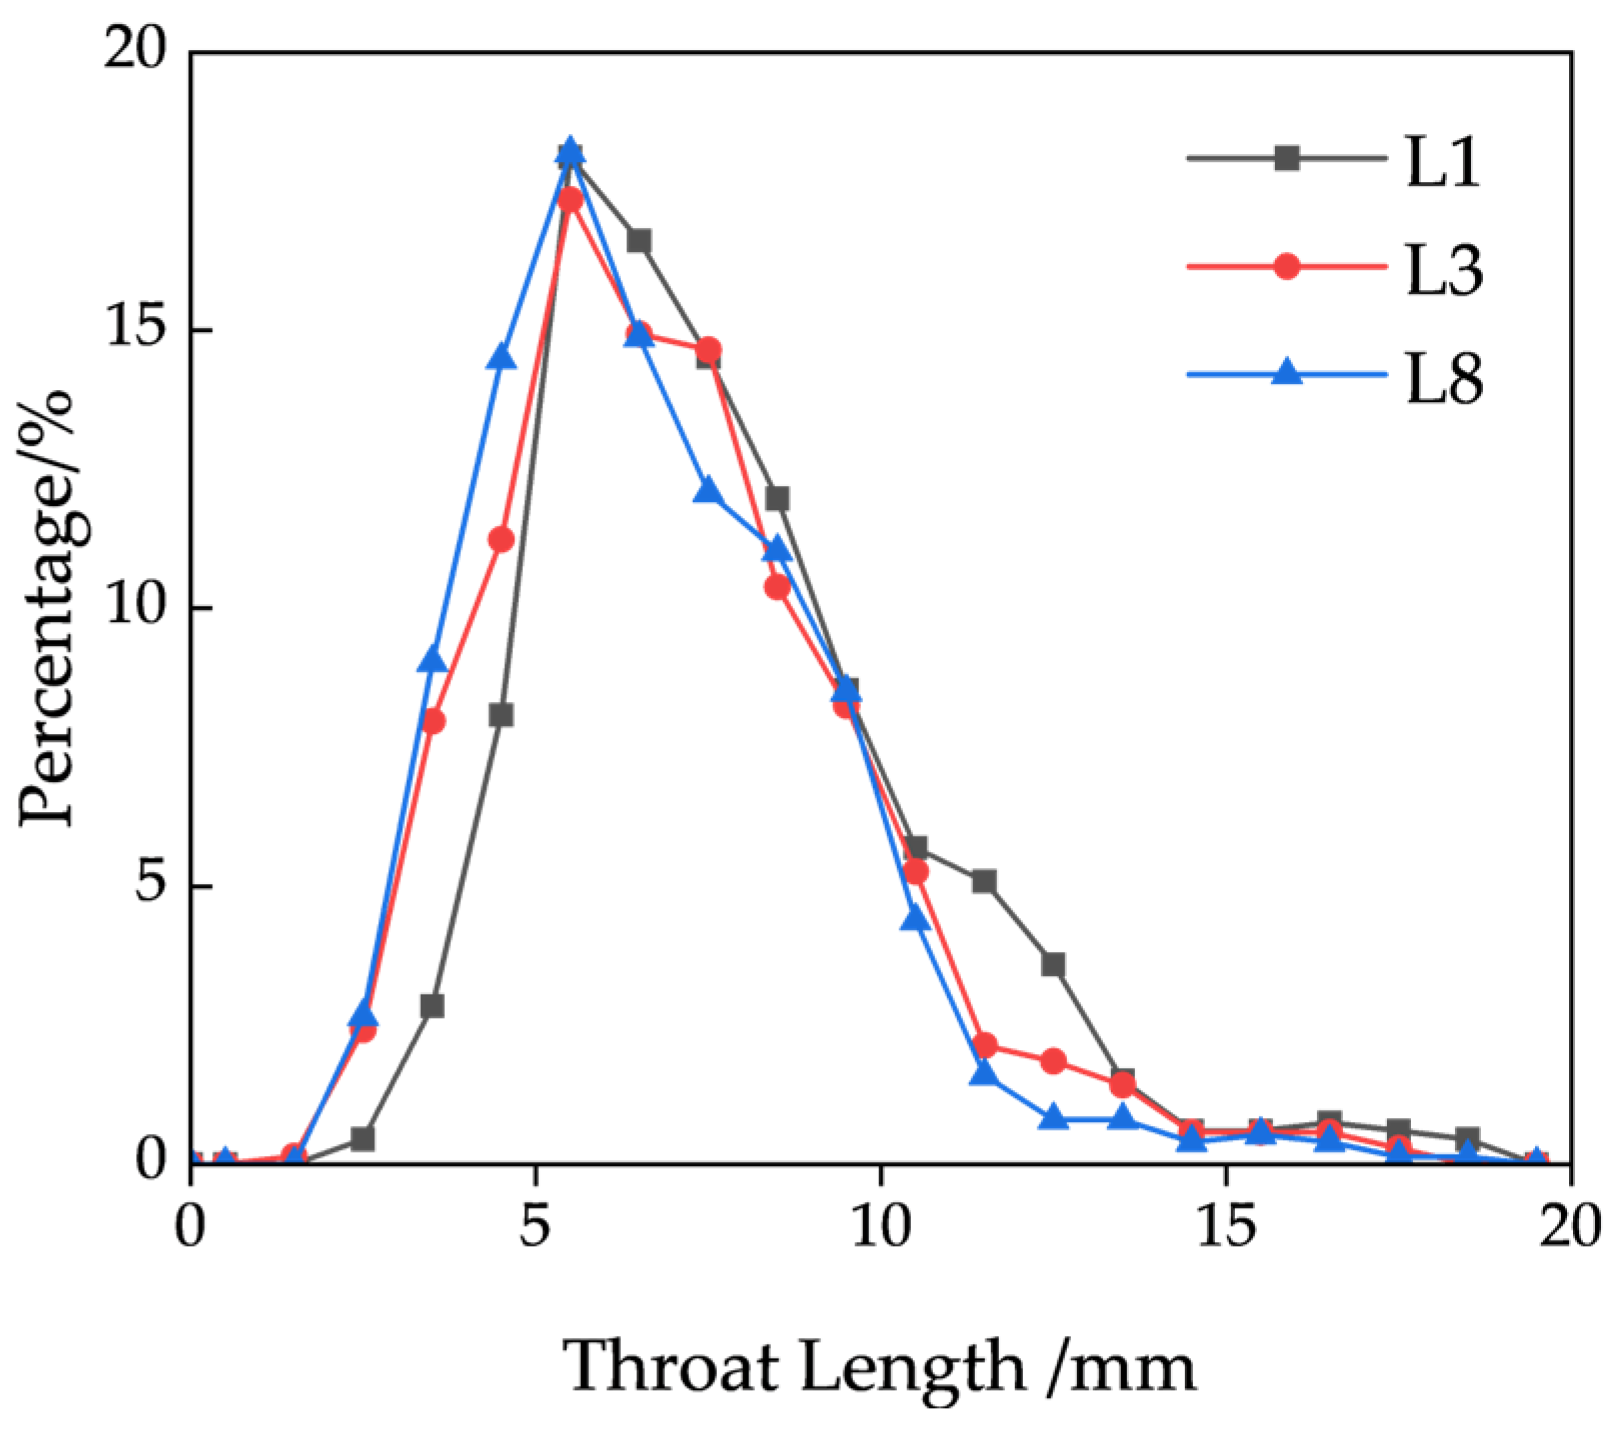
After calculation and statistical analysis, the throat-length distribution of the three models is shown in Figure 16. Throat lengths are concentrated in the range of 4–9 mm. In all three models, the number of throats first increases and then decreases as throat length increases, with peaks occurring at 5–6 mm. When throat length is less than 5 mm, the proportion of throats of each length in models L1, L3, and L8 increases continuously, indicating that the proportion of throats of each length increases with the fine-particle content. When throat length exceeds 6 mm, the overall trend of the proportion of throats of each length in models L1, L3, and L8 decreases with the fine-particle content. The L8 model exhibits a significantly higher number of short throats, with those measuring 6 mm or less accounting for 44.36%, compared with only 29.49% in the L1 model. The average throat lengths for the L1, L3, and L8 models are 7.93 mm, 7.10 mm, and 6.90 mm, respectively, with corresponding standard deviations of 2.93 mm, 2.72 mm, and 2.46 mm. These results suggest that an increase in fine-particle content leads to a higher proportion of short throats, a narrower distribution range of throat lengths, and a reduction in average throat length, which may effectively shorten the flow path of the solution. However, the overall seepage performance must be evaluated in conjunction with throat-size characteristics to obtain a comprehensive understanding.

3.2.6. Coordination Number

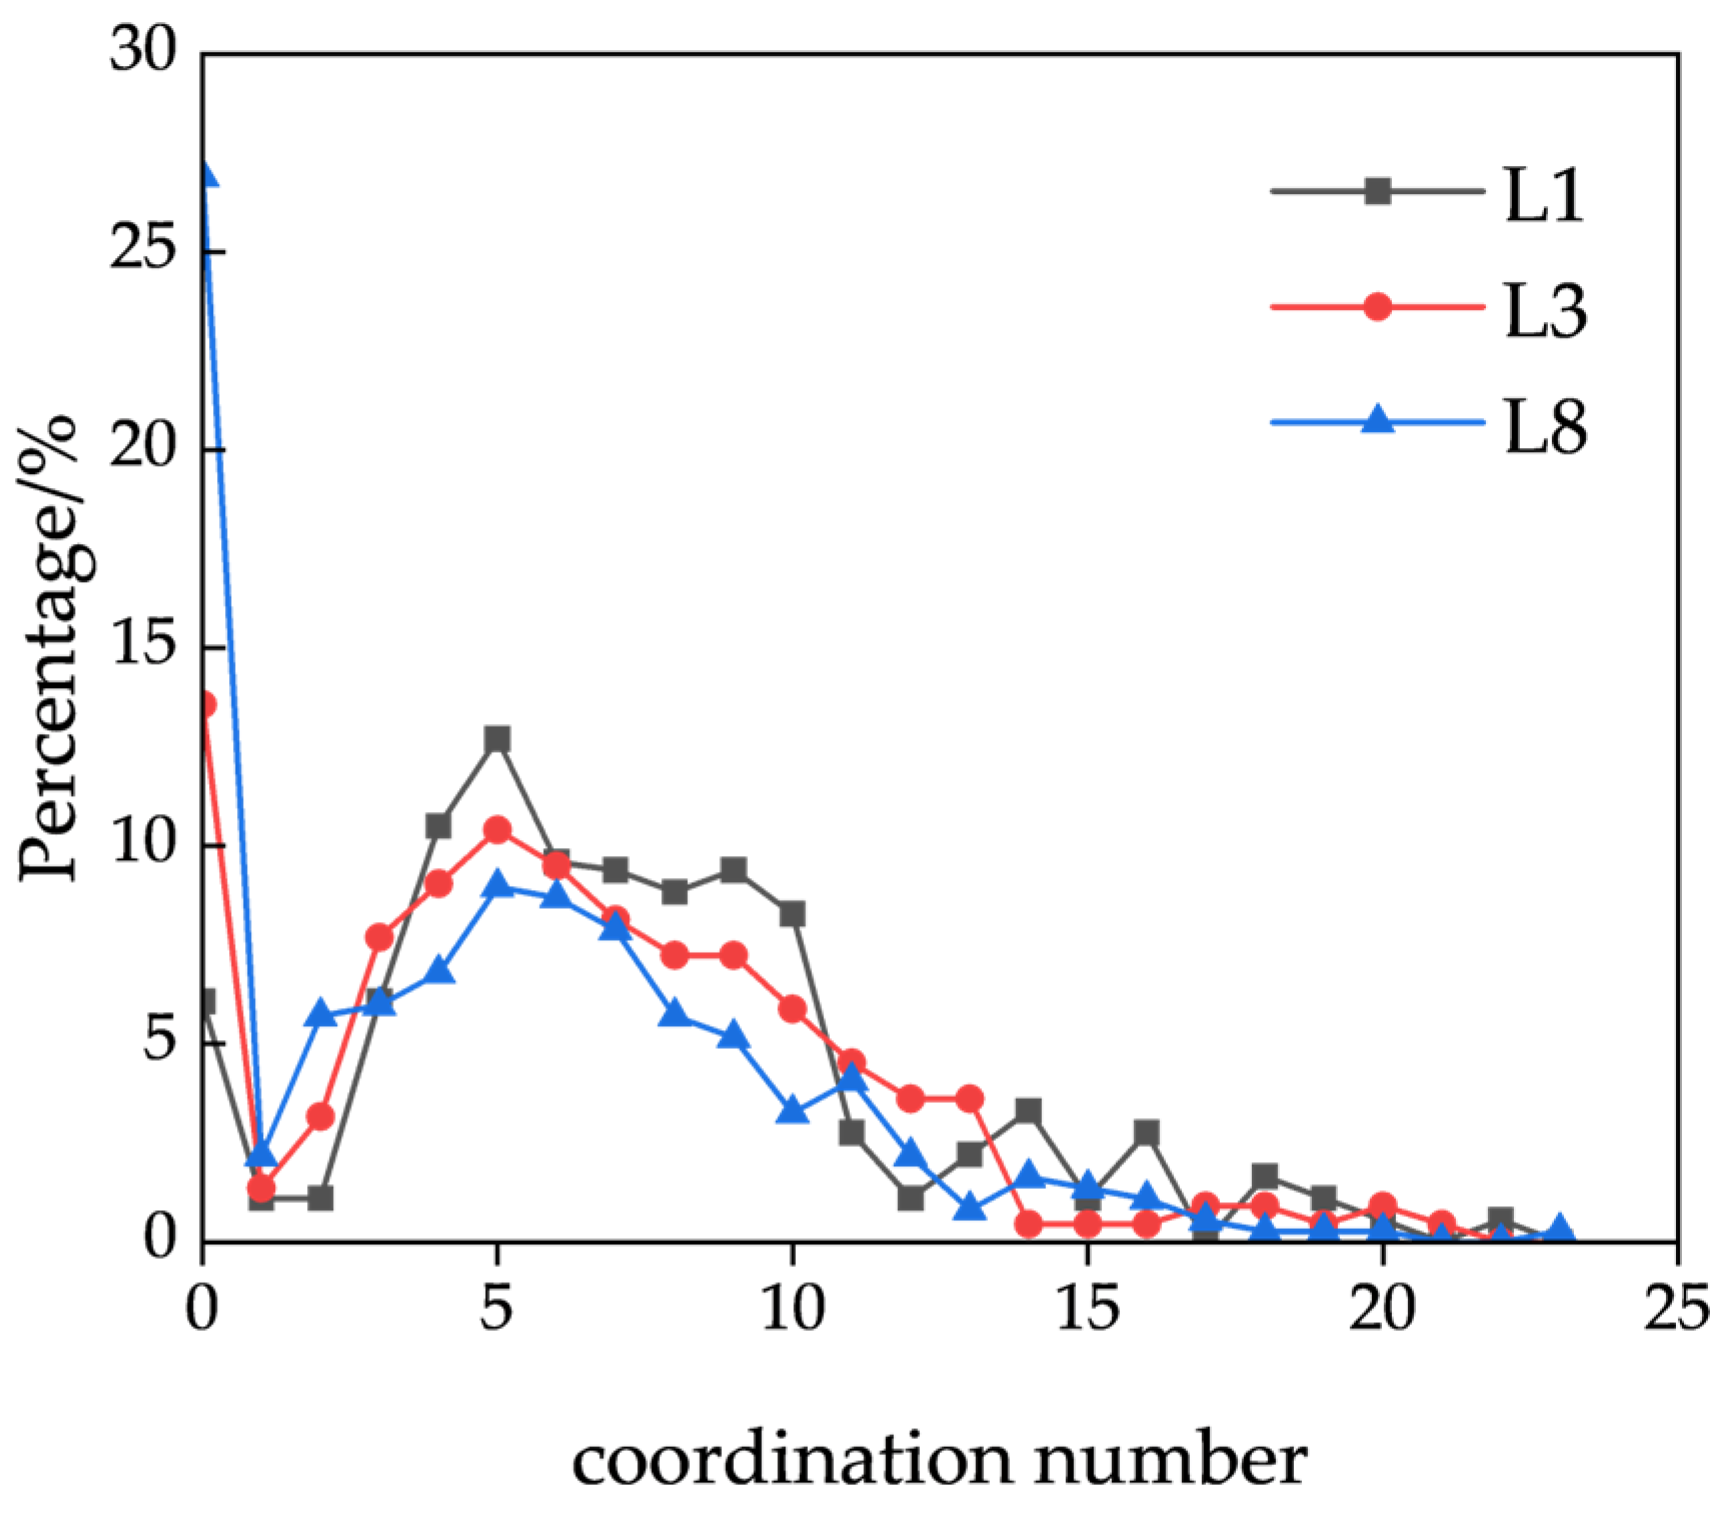
The coordination number of pores represents the connectivity of a pore with other pores and influences the overall pore connectivity and solution flow. The proportions of different pore coordination numbers are shown in Figure 17. It can be seen that the coordination numbers of the three models range from 0 to 22. The overall trend of pore coordination numbers across the different models is consistent, but the distribution of coordination numbers in the L8 model is more concentrated at low values. The proportion of pores with a coordination number of 0 is 26.90%, indicating a high prevalence of isolated pores and poor overall connectivity within the model. Excluding pores with a coordination number of 0, the peak proportion of coordination numbers for all three models occurs at a coordination number of 6. When the coordination number ranges from 4 to 11, the proportion of each coordination number follows the order L1 > L3 > L8, with cumulative contents of 72.38%, 65.61%, and 52.71%, respectively. The L8 model exhibits a higher proportion of pores with small coordination numbers (1–2), accounting for 7.88%, compared with only 2.21% in L1 and 4.52% in L3. For coordination numbers greater than 12, the cumulative contents in models L1, L3, and L8 are 13.26%, 8.60%, and 6.52%, respectively. Combined with Table 11, it can be seen that as fine-particle content increases, pore coordination numbers become more concentrated at low values, and the average coordination number decreases inversely proportional to the coefficient of uniformity. This indicates that fine-particle content reduces pore connectivity, which is unfavorable for solution flow.

4. Assessment of Permeability in Relation to Pore Structure Characteristics

Permeability represents the capacity of leachable ore to allow fluid passage and serves as a critical parameter influencing leaching efficiency. The cumulative effect of microscopic pore structure characteristics ultimately manifests macroscopically as permeability. For example, when pores are large and exhibit strong interconnectivity, fluid-flow resistance is relatively low, resulting in higher permeability at the macroscopic level. Conversely, if pores are small and poorly connected, fluid movement becomes restricted, leading to reduced permeability. Establishing an accurate evaluation model for the influence of pore structure parameters on permeability facilitates a deeper understanding of fluid seepage mechanisms within porous media and provides theoretical support and decision-making foundations for relevant engineering applications.
In this study, pore structure parameters include porosity, equivalent pore diameter, equivalent throat diameter, throat length, pore coordination number, and pore connectivity. Following three-dimensional modeling and reconstruction analysis, it was determined that the connectivity of all the models exceeds 97%. Consequently, pore connectivity was excluded from the analysis of permeability-influencing factors. Using the aforementioned five pore structure parameters as independent variables and permeability as the dependent variable, a multiple linear regression fitting was conducted. The resulting model equation is as follows:
k = 2.59456 + 9.61341 c 3.69909 ϕ + 1.73914 p r + 5.2980811 t r 0.89511 t l 0.557781 c n
where k denotes the permeability (m2), c is the connectivity, ϕ is the porosity, pr is the equivalent pore diameter (m), tr is the equivalent throat diameter (m), tl is the throat length (m), and cn is the pore coordination number.
In the multiple linear regression equation, the correlation coefficient R2 is 0.98922, indicating a strong ability to accurately reflect the influence of various factors on permeability. Analysis of the constructed regression model reveals that pore connectivity rate is the most influential factor affecting permeability, followed by throat equivalent diameter, and then porosity and pore equivalent diameter. In contrast, throat length and coordination number have a relatively minor influence on permeability. These findings suggest that for ore scheduled for leaching after blasting in the stope, pore connectivity rate should be the primary focus. A higher connectivity rate generally corresponds to increased porosity and, consequently, higher permeability. The key to enhancing both connectivity rate and porosity lies in optimizing the particle-size distribution resulting from blasting. Second, the equivalent throat diameter—i.e., throat size—also significantly influences permeability. As the narrowest connection between pores, the throat acts as a key constraint on solution flow. Five primary types of throats were identified: pore-reduced type, necked type, sheet type, tubular type, and bundle type. Among these, the pore-reduced type features large pores and wide throats, with a pore-to-throat diameter ratio close to unity, which are commonly formed between floating particles and conducive to fluid flow. The necked type exhibits large pores but narrow throats, resulting in a high pore-to-throat diameter ratio, typically caused by linear or point contacts between ore particles, potentially rendering certain pores ineffective. Other throat types generally feature smaller pores and extremely narrow throats, primarily formed through concave–convex or suture-type particle contacts. Therefore, even with large pore sizes, narrow throats may still impede fluid flow, significantly reducing permeability and consequently impairing leaching performance.
In previous studies on permeability prediction, most scholars have focused on the relationship between permeability and particle size, such as the semi-theoretical and semi-empirical Hagen and Kozeny–Carman equations [33]. In these formulations, permeability is proportional to the square of the particle size corresponding to a cumulative content of 10%–20%. A prerequisite for applying these equations is prior knowledge of the particle-size distribution, which is conventionally obtained via sieve analysis. However, for blasted ores, sieve-based determination of particle-size distribution is impractical. Thus, analyzing permeability based on pore structure parameters has become increasingly important. Porosity is primarily influenced by particle size and gradation; maintaining a consistent particle-size range and gradation ensures stable porosity in post-blast ore piles, assuming negligible segregation effects. Based on regression analysis, throat size emerges as the dominant factor influencing permeability in blasted ores intended for leaching.
This study conducts permeability analysis and prediction using an improved Purcell formula. Originally proposed by W. R. Purcell in 1949 [34], the Purcell formula is a classical rock physics model used to describe the relationship between permeability (k) and average throat radius (r). The original formulation is expressed as
k = ϕ r 2 8 τ 2
where k is the permeability (m2), ϕ is the porosity, r is the average throat radius (m), and τ is the tortuosity.
Considering the throat-radius distribution derived from three-dimensional pore network reconstruction, the single throat radius r in the original formula is replaced with a weighted average of r2:
k = ϕ 8 τ 2 0 r 2 f r d r
where f(r) denotes the probability density function of throat radius r, reflecting the relative proportion of different-sized throats.
Fitting analysis of the throat data extracted from the three-dimensional pore structure models indicates that the throat radius follows a log-normal distribution:
f r = 1 r σ 2 π exp ln r μ 2 2 σ 2
where σ is the standard deviation and μ is the mean of ln(r). Substituting Equation (8) into Equation (7) yields
k = ϕ e 2 μ + 2 σ 2 8 τ 2
Permeability k is calculated based on the permeability coefficient K obtained from constant-head permeability tests, using the following relation:
k = K μ ρ g
where k is the permeability (m2), K is the permeability coefficient (m/s), μ is the dynamic viscosity (Pa·s), ρ is the fluid density (kg/m3), and g is the gravitational acceleration (9.81 m/s2).
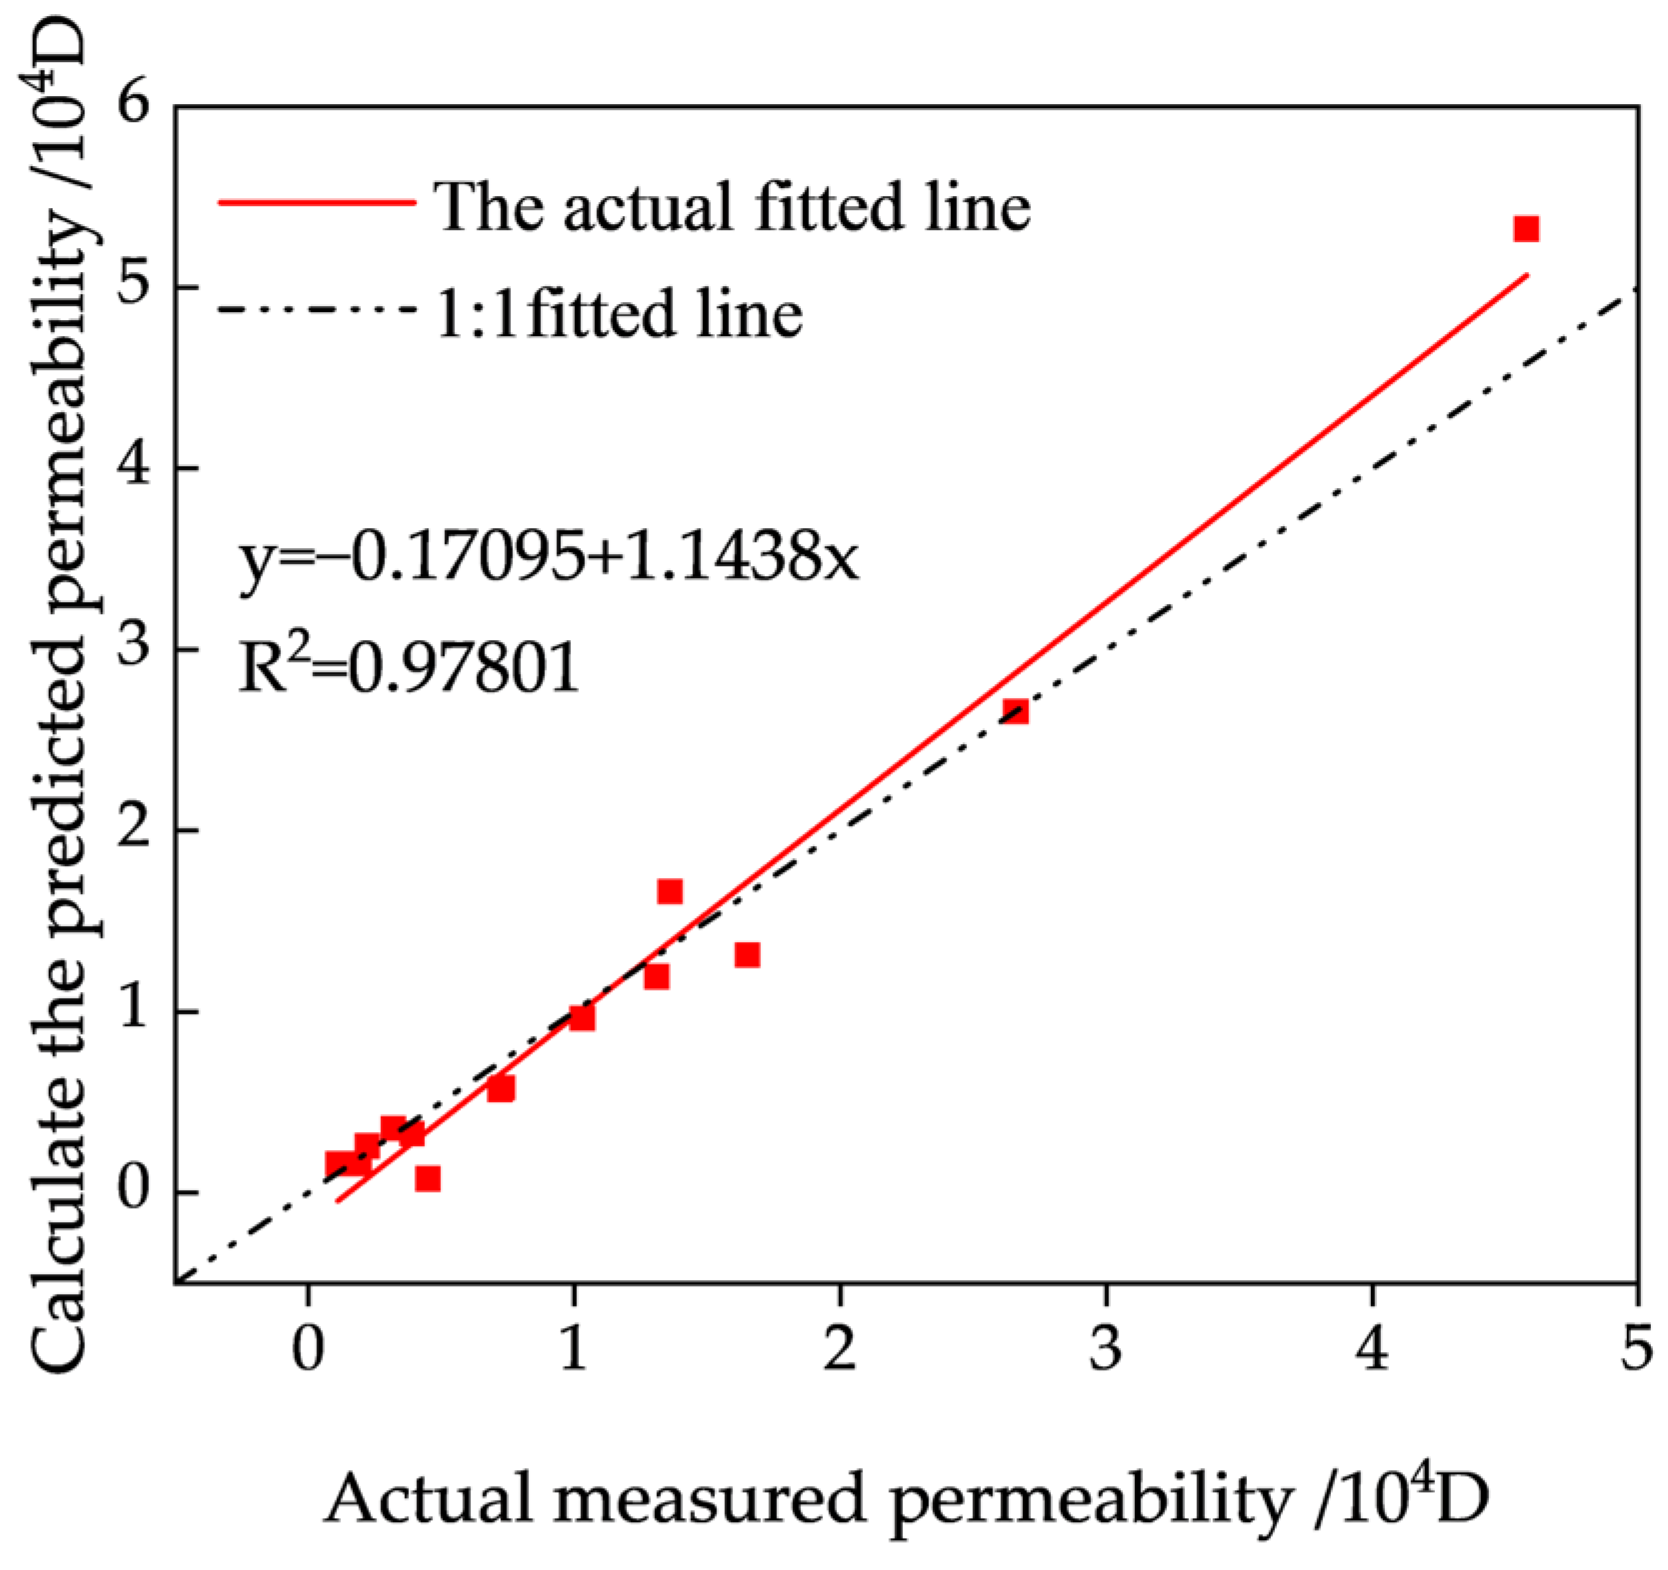
Constant-head permeability tests were performed on models with varying throat sizes. The tests were conducted using pure water at a room temperature of 20 °C, with a fluid density of 1000 kg/m3 and a dynamic viscosity of 0.001 Pa·s. A constant water head of 20 cm was applied during the experiments. Constant-head permeability tests were performed on models with varying throat sizes, as illustrated in Figure 18. The predicted permeability values using the improved Purcell formula align closely with the experimentally measured results, validating the effectiveness of the proposed permeability prediction model. Furthermore, based on the established empirical relationship, the corresponding throat radius can be inversely estimated using known values of permeability and porosity.

5. Conclusions

This study investigates irregular ore particles as samples and conducts comparative experiments on samples with varying particle sizes and gradations to analyze and discuss the influence of particle gradation on the pore structure of leachable ores. The key findings are summarized as follows:
(1)
Based on the G1–G6 models, representing different particle sizes, the quantitative impact of particle size on porosity was analyzed. For single-grade granular materials within a specific scale range, parameters such as porosity, permeability coefficient, average throat size, and average throat length increase with increasing particle size. However, the coordination number exhibits a trend of first increasing and then decreasing with increasing particle size. Furthermore, for pore parameters, the distributions within the G1–G4 models are relatively similar, whereas the distributions within the G5–G6 models differ significantly from the former four. This suggests that when the particle size is small, its influence on pore parameters is relatively weak.
(2)
Based on the L1–L8 models, representing different gradations, the influence of gradation on porosity and absolute permeability was analyzed. The Cu and porosity parameters exhibit an approximate negative correlation, and d10 and d20 have a significant impact on porosity, showing a linear relationship, with correlation coefficients (R2) of 0.85 and 0.82, respectively. For granular materials within a certain particle-size range, the content of fine particles has a substantial impact on porosity; the higher the proportion of fine particles, the lower the porosity. The Cu and vertical absolute permeability (kz) parameters demonstrate an exponential decay relationship, with a correlation coefficient (R2) of 0.99. When Cu < 2.5, kz decreases rapidly with increasing Cu; when Cu > 2.5, kz decreases slowly with increasing Cu. This indicates that as the content of fine particles increases, permeability decreases significantly, but the impact diminishes as the content continues to increase.
(3)
The influence of fine-particle content on pore-throat size was analyzed based on typical L1, L3, and L8 gradation models. With the increase in fine-particle content, the number of pore throats increased, while the peak and average pore-throat sizes decreased. The number of pore throats in the L3 and L8 models was 108.71% and 130.91% of that in the L1 model, respectively. The average pore size was 2.33 mm, 1.75 mm, and 1.50 mm, and the average throat size was 0.80 mm, 0.53 mm, and 0.48 mm, respectively. Moreover, the L1 model had more large pores, with 1.5–3 mm pores accounting for 65.75% of the total pore number, while the L8 model had more small pores, with 0.5–1.5 mm pores accounting for 46.47% of the total pore number. Compared with the L1 model, the fine-particle content in the L3 and L8 models was approximately 2.5 times and 10 times that of the L1 model, respectively. The cumulative content of large-sized throats above 0.6 mm in the L3 and L8 models decreased to 58.83% and 58.36% of that in the L1 model, respectively, indicating that fine-particle content can reduce the number of wide throats, but the number does not decrease proportionally with the increase in fine-particle content. Additionally, the distribution trends of throat length in the three models were consistent, with the peak occurring at 5–6 mm. When the throat length was less than 5 mm, the proportion of throats of each length increased with the increase in fine-particle content; when the throat length was greater than 6 mm, the opposite was true. The L8 model had more short throats, with 44.36% of the throats being less than 6 mm, while in the L1 model, this proportion was only 29.49%.
(4)
The changes in pore coordination number were analyzed based on the gradation models. The overall trend for pore coordination number changes was consistent among the different gradation models. Notably, the L8 model exhibited a significantly higher concentration of pores with small coordination numbers. Specifically, 26.90% of the pores had a coordination number of 0, indicating a high proportion of isolated pores and poor connectivity within the model. When the coordination number was less than 2, the L8 model showed a higher proportion of pores compared with the L1 and L3 models. The proportion of pores with coordination numbers of below 2 in the L8 model reached 34.78%, whereas it was only 8.29% in L1 and 18.09% in L3. After excluding pores with a coordination number of 0, the peak proportion for all three models occurred at a coordination number of 6. Furthermore, when the coordination number ranged from 4 to 11, the proportion of each coordination number followed the order L1 > L3 > L8, with cumulative percentages of 72.38%, 65.61%, and 52.71%, respectively.
(5)
The evaluation model of permeability based on pore structure was analyzed. Analysis of the constructed model reveals that connectivity rate is the most critical factor influencing permeability, followed by the equivalent diameter of throats, and then porosity and the equivalent diameter of pores. In contrast, the length of throats and the coordination number exhibit relatively minor effects on permeability. Therefore, during in situ blasting for ore extraction, greater emphasis should be placed on the inter-particle connectivity rate, porosity, and the contact configuration between pores resulting from blasting. An improved Purcell model was established based on multiple regression analysis, and the permeability was analyzed and predicted through porosity and throat size, with a high degree of fitting.

6. Discussion and Future Prospects

CT scanning combined with 3D reconstruction using Avizo software enables effective analysis of key pore structural parameters, including porosity, pore-throat-size distribution, throat length, and pore coordination number. This approach provides robust data support for understanding how ore particle gradation influences pore structure distribution characteristics and permeability evolution. However, several limitations remain. First, partial volume effects may occur during CT scanning, whereby small pores can be misclassified as solid phases due to gray-value averaging within voxels containing mixed materials. Second, edge effects can distort the statistical analysis of pore parameters, as larger pore structures may form at the interface between the sample and the acrylic model, introducing measurement bias. Additionally, the topological parameters extracted by Avizo, such as throat radius and tortuosity, are based on an idealized spherical-tube model, which may not accurately represent real pore structures with complex geometries, such as plate-like pores or fractal surfaces. Future studies should account for these factors and aim to design more refined experimental methodologies.
Although there has been some quantitative analysis of the influence of particle gradation on pore structure parameters, the interaction mechanism between particles at the microscopic level requires further in-depth research to achieve optimal particle gradation after blasting. Future studies could leverage advanced microscopic testing techniques to reveal the impact of inter-particle forces on the formation and evolution of pore structures at the atomic and molecular scales, thereby laying the foundation for establishing more accurate theoretical models. This will optimize the pore structure of ores, enhance their permeability and solubility, and, ultimately, increase the mining value of ores. Future research should focus on further elucidating the impact of solution leaching behavior on pore structure evolution. Particular attention should be given to the mechanisms underlying pore structural changes and permeability variations resulting from chemical reactions between the solution and the ore, as well as fine-particle migration induced by solution scouring. Numerical simulations and predictive modeling should be conducted using the extensive datasets collected to enhance understanding and to support the development of more accurate theoretical frameworks.
Author Contributions

K.L.—software, data curation, investigation, validation, writing—original draft; D.G.—conceptualization, formal analysis, funding acquisition, project administration, supervision, writing—review and editing; Z.X.—methodology, resources, supervision, writing—review and editing. All authors have read and agreed to the published version of the manuscript.

Funding

This research received no external funding.

Data Availability Statement

Data will be made available upon request.

Conflicts of Interest

The authors declare no conflicts of interest.

Abbreviations

The following abbreviations are used in this manuscript:
CTComputed tomography
CuCoefficient of non-uniformity
DWDry weight

References

  1. Sinclair, L.; Thompson, J. In situ leaching of copper: Challenges and future prospects. Hydrometallurgy 2015, 157, 306–324. [Google Scholar] [CrossRef]
  2. Ghorbani, Y.; Franzidis, J.P.; Petersen, J. Heap leaching technology—Current state, innovations, and future directions: A review. Miner. Process. Extr. Metall. Rev. 2016, 37, 73–119. [Google Scholar] [CrossRef]
  3. Estay, H.; Diaz-Quezada, S.; Arancibia, E.; Vargas, T. Economic Assessment of an In Situ Leaching Operation with Ore Preconditioning Using Sublevel Stoping Techniques. Min. Metall. Explor. 2023, 40, 493–504. [Google Scholar] [CrossRef]
  4. Nkuna, R.; Ijoma, G.N.; Matambo, T.S.; Chimwani, N. Accessing Metals from Low-Grade Ores and the Environmental Impact Considerations: A Review of the Perspectives of Conventional versus Bioleaching Strategies. Minerals 2022, 12, 506. [Google Scholar] [CrossRef]
  5. Haque, N.; Norgate, T. The greenhouse gas footprint of in-situ leaching of uranium, gold and copper in Australia. J. Clean. Prod. 2014, 84, 382–390. [Google Scholar] [CrossRef]
  6. Karaca, O.; Cameselle, C.; Reddy, K.R. Mine tailing disposal sites: Contamination problems, remedial options and phytocaps for sustainable remediation. Rev. Environ. Sci. Bio-Technol. 2018, 17, 205–228. [Google Scholar] [CrossRef]
  7. Yu, B.Q.; Kou, J.; Sun, C.B.; Xing, Y. Extraction of copper from copper-bearing biotite by ultrasonic-assisted leaching. Int. J. Miner. Metall. Mater. 2022, 29, 212–217. [Google Scholar] [CrossRef]
  8. Li, J.H.; Feng, J.H.; Xue, J.F.; Huang, Y.H.; Zhang, Z.M.; Li, H.N.; Chen, Y.X.; Guo, J.C.; Su, X.B.; Hua, R. The influence of surfactants on the acid leaching process of a uranium mine in Inner Mongolia. J. Radioanal. Nucl. Chem. 2024, 33, 5845–5855. [Google Scholar] [CrossRef]
  9. Yoo, K.; Kim, S.K.; Lee, J.C.; Ito, M.; Tsunekawa, M.; Hiroyoshi, N. Effect of chloride ions on leaching rate of chalcopyrite. Miner. Eng. 2010, 23, 471–477. [Google Scholar] [CrossRef]
  10. Bai, Z.X.; Zhao, X.S.; Zhang, J.; Wu, F.F.; Tang, Q. Optimisation of uranium-radium co-leaching from uranium ore. J. Radioanal. Nucl. Chem. 2023, 332, 1841–1845. [Google Scholar] [CrossRef]
  11. Robertson, S. Development of an integrated heap leach solution flow and mineral leaching model. Hydrometallurgy 2017, 169, 79–88. [Google Scholar] [CrossRef]
  12. Machaca, D.M.C.; Botelho, A.B., Jr.; Carvalho, T.C.; Tenorio, J.A.S.; Espinosa, D.C.R. Hydrometallurgical processing of chalcopyrite: A review of leaching techniques. Int. J. Miner. Metall. 2024, 31, 2537–2555. [Google Scholar] [CrossRef]
  13. Yang, B.H.; Wu, A.X.; Wang, C.L.; Niu, W.X.; Liu, J.Z. Three-dimensional simulation of pore scale fluid flow in granular ore media with realistic geometry. Transctions Nonferrous Met. Soc. China 2012, 22, 3081–3086. [Google Scholar] [CrossRef]
  14. Wang, H.; Wang, X.J.; Wang, Y.; Wang, D.H.; Hu, K.J.; Zhong, W.; Guo, Z.Q. Influence of ammonium sulfate leaching agent on engineering properties of weathered crust elution-deposited rare earth ore. Acta Geotech. 2024, 19, 2041–2062. [Google Scholar] [CrossRef]
  15. Yang, Z.; Ding, H.; Guo, L.; Lian, M.J. Superpixel image segmentation-based particle size distribution analysis of fragmented rock. IEEE Access 2021, 9, 59048–59058. [Google Scholar] [CrossRef]
  16. Xiong, X.; Wang, Z.F.; Wang, X.T.; Liu, H.; Ma, Y. Correlations between pore structure parameters and gas permeability of corundum porous materials. J. Am. Ceram. Soc. 2020, 103, 2137–2145. [Google Scholar] [CrossRef]
  17. Qin, X.J.; Cai, J.C.; Wang, G. Pore-scale modeling of pore structure properties and wettability effect on permeability of low-rank coal. Int. J. Min. Sci. Technol. 2023, 33, 573–584. [Google Scholar] [CrossRef]
  18. Lo, A.; Nosrati, A.; Addai-Mensah, J. Particle and pore dynamics under column leaching of goethitic and saprolitic nickel laterite agglomerates. Adv. Powder Technol. 2016, 27, 2370–2376. [Google Scholar] [CrossRef]
  19. Wu, A.X.; Yang, B.H.; Xi, Y.; Jiang, H.C. Pore structure of ore granular media by computerized tomography image processing. J. Cent. South Univ. Technol. 2007, 14, 220–224. [Google Scholar] [CrossRef]
  20. Sufian, A.; Russell, A.R.; Whittle, A.J.; Saadatfar, M. Pore shapes, volume distribution and orientations in monodisperse granular assemblies. Granul. Matter 2015, 17, 727–742. [Google Scholar] [CrossRef]
  21. Huang, Q.S.; Zhou, W.; Ma, G.; Mei, J.Z.; Xu, K. Investigation of the grain breakage behaviour of 2D granular materials with disordered pore distribution. Comput. Part. Mech. 2021, 8, 1033–1045. [Google Scholar] [CrossRef]
  22. Annapareddy, V.S.R.; Sufian, A.; Bore, T.; Bajodek, M.; Scheuermann, A. Computation of local permeability in gap-graded granular soils. Geotech. Lett. 2022, 12, 68–73. [Google Scholar] [CrossRef]
  23. Bi, J.F.; Luo, X.Q.; Shen, H. Modeling of Suffusion Considering the Influence of Soil Gradation. Transp. Porous Media 2021, 136, 765–790. [Google Scholar] [CrossRef]
  24. Huang, Z.; Bai, Y.C.; Xu, H.J.; Sun, J. A theoretical model to predict suffusion-induced particle movement in cohesionless soil under seepage flow. Eur. J. Soil Sci. 2021, 72, 1395–1409. [Google Scholar] [CrossRef]
  25. Zhang, X.M.; Gao, Z.Q.; Rao, Y.Z.; Shi, L.; Xu, W. Evolutionary Law of Pore Structure of Ion-Adsorbed Rare Earth Ore Leaching Process. Minerals 2023, 13, 322. [Google Scholar] [CrossRef]
  26. Ilankoon, I.M.S.K.; Neethling, S.J. Liquid spread mechanisms in packed beds and heaps. The separation of length and time scales due to particle porosity. Miner. Eng. 2016, 86, 130–139. [Google Scholar] [CrossRef]
  27. Liu, D.F.; Yan, W.X.; Zhang, Z.Y.; Chi, R. Effect of particle gradation on pore structure and seepage law of solution in weathered crust elution-deposited rare earth ores. Int. J. Min. Sci. Technol. 2023, 33, 1261–1272. [Google Scholar] [CrossRef]
  28. Hao, D.Y.; Tu, S.H.; Zhang, L.; Zhao, H.B.; Xu, S.K. Experimental study on characteristics of gas seepage in broken coal and rock. Energy Sci. Eng. 2024, 12, 4737–4752. [Google Scholar] [CrossRef]
  29. Prasomsri, J.; Takahashi, A. Experimental study on suffusion under multiple seepages and its impact on undrained mechanical responses of gap-graded soil. Soils Found. 2021, 61, 1660–1680. [Google Scholar] [CrossRef]
  30. Karlsons, K.; Kort, D.W.; Alpak, F.O.; Dietderich, J.; Freeman, J.J.; Appel, M.; Mantle, M.D.; Sederman, A.J.; Gladden, L.F. Integrating Pore-Scale Flow MRI and X-ray μCT for Validation of Numerical Flow Simulations in Porous Sedimentary Rocks. Transp. Porous Media 2022, 143, 373–396. [Google Scholar] [CrossRef]
  31. Stewart, M.L.; Ward, A.L.; Rector, D.R. A study of pore geometry effects on anisotropy in hydraulic permeability using the lattice-Boltzmann method. Adv. Water Resour. 2006, 29, 1328–1340. [Google Scholar] [CrossRef]
  32. Su, H.Z.; Li, H.; Zhang, L.H.; Wen, Z.P. Particle flow code method-based seepage behavior analysis and control effect evaluation for soil levee. Eng. Comput. 2020, 36, 97–114. [Google Scholar] [CrossRef]
  33. Koltermann, C.E.; Gorelick, S.M. Fractional packing model for hydraulic conductivity derived from sediment mixtures. Water Resour. Res. 1995, 31, 3283–3297. [Google Scholar] [CrossRef]
  34. Tiab, D.; Donaldson, E.C. Petrophysics: Theory and Practice of Measuring Reservoir Rock and Fluid Transport Properties, 4th ed.; Gulf Professional Publishing: Houston, TX, USA, 2015; pp. 237–240. [Google Scholar]
Figure 1. Low-grade copper ore particle samples.
Minerals 15 00848 g001
Figure 2. Two-dimensional CT scan images of G1–G6 models with different particle sizes.
Minerals 15 00848 g002
Figure 3. Relationship between porosity, permeability, and average particle size of single-stage ore bulk: (a) relationship between porosity and average particle size; (b) relationship between permeability and average particle size.
Minerals 15 00848 g003
Figure 4. Three-dimensional pore network models of G1–G6.
Minerals 15 00848 g004
Figure 5. Pore stick diagram of the G1–G6 models.
Minerals 15 00848 g005
Figure 6. Number of pores in the G1–G6 models.
Minerals 15 00848 g006
Figure 7. Distribution of pore structure parameters: (a) distribution of the pore equivalent radius; (b) distribution of the throat equivalent radius; (c) distribution of throat length.
Minerals 15 00848 g007
Figure 8. Relationship between porosity and grain sizes: (a) linear analysis between d10 and porosity; (b) linear analysis between d20 and porosity; (c) linear analysis between d30 and porosity.
Minerals 15 00848 g008
Figure 9. Relationship between porosity and coefficient of uniformity Cu: (a) porosity and coefficient of uniformity Cu; (b) absolute permeability kz and coefficient of uniformity Cu.
Minerals 15 00848 g009
Figure 10. Particle-size distribution of different gradation models.
Minerals 15 00848 g010
Figure 11. Stick diagrams of different gradation models.
Minerals 15 00848 g011
Figure 12. Comparison chart of fine-particle content and connectivity of different models.
Minerals 15 00848 g012
Figure 13. Pore-size distribution of different gradation models.
Minerals 15 00848 g013
Figure 14. Comparison of simulated and calculated values of pore-size distribution for different gradation models.
Minerals 15 00848 g014
Figure 15. Throat-size distribution of different gradation models.
Minerals 15 00848 g015
Figure 16. Throat-length distribution of different gradation models.
Minerals 15 00848 g016
Figure 17. Coordination number distribution in different gradation models.
Minerals 15 00848 g017
Figure 18. The relationship between the permeability predicted using the improved Purcell equation and the experimentally measured permeability.
Minerals 15 00848 g018
Table 1. XRF chemical element analysis of samples.
ElementProportion (%)
Cu0.49
Fe28.47
S14.07
Fe2O340.71
SO335.15
SiO214.95
CaO4.89
MgO2.60
Al2O30.60
Mn0.062
Cl0.023
Table 2. Particle-size distribution in the various samples.
SamplesParticle Size (mm)
G12–5
G25–8
G38–10
G410–12
G512–15
G615–20
Table 3. Experimental gradation of the graded granular materials.
SamplesG1 (wt%)G2 (wt%)G3 (wt%)G4 (wt%)G5 (wt%)G6 (wt%)
L12.896.3411.2919.8626.5633.06
L25.1710.5220.3627.6412.0724.24
L37.2013.6322.8414.2622.5419.53
L49.6816.2313.8228.8915.5215.86
L512.056.1927.3313.0616.0325.34
L614.279.526.1030.3519.6120.15
L717.3111.8214.2323.2418.3315.07
L829.1620.0922.729.279.089.68
Table 4. Porosity and permeability coefficient of single-stage granular samples.
SamplesAverage Particle Size (mm)Porosity ϕ (%)Absolute Permeability kz (×104 D)
G1 (2–5 mm)3.5726.830.45
G2 (5–8 mm)6.2832.650.73
G3 (8–10 mm)8.8538.611.31
G4 (10–12 mm)10.942.401.36
G5 (12–15 mm)13.1343.501.77
G6 (15–20 mm)17.3350.984.58
Table 5. Pore parameters of the G1–G6 models with varying particle sizes.
ModelsG1G2G3G4G5G6
The number of pores439430344302208121
Total throat count24782293179614211075521
Mean equivalent pore radius (mm)0.971.562.232.352.563.15
Standard deviation of pore equivalent radius (mm)0.310.440.610.641.131.05
Mean equivalent throat radius (mm)0.290.660.800.861.061.28
Standard deviation of the equivalent radius of the roar (mm)0.160.360.420.430.730.69
Mean throat length (mm)3.215.436.937.109.139.06
The standard deviation of the length of the roar (mm)1.051.792.112.154.292.77
Average pore coordination number10.3810.7910.9411.0610.008.42
Standard deviation of pore coordination number4.835.345.015.475.513.78
Fraction of pores with radius < 2.5 mm99.83%93.01%63.55%59.8%52.91%29.16%
Fraction of throats with radius < 1.1 mm98.74%82.77%70.79%63.69%55.9139.54
Table 6. Parameters of the gradation particle models.
Test NumberL1L2L3L4L5L6L7L8
d10 (mm)8.146.25.25.0543.42.732.13
d20 (mm)10.88.386.28.116.755.435.433.86
d30 (mm)10.759.298.678.58.6710.058.055.01
d40 (mm)11.110.2810.71109.410.569.855.92
d50 (mm)12.210.8311.3610.510.6511.5810.287.98
d60 (mm)1311.712.381111.912119
Cu1.601.892.382.182.983.534.034.22
Porosity ϕ (%)0.400.370.310.350.290.260.250.23
Absolute permeability kz (×104 D)1.651.030.390.720.320.220.190.11
Table 7. The number of pores and isolated pores in different gradation models.
SamplesTotal Number of PoresThe Number of Isolated PoresPercentage of Isolated Pores
L1181116.08%
L32213013.58%
L83689926.90%
Table 8. Parameters of pore-size distribution.
ModelsAverage Equivalent Radius of Pores (mm)Total Pore CountFraction of Pores with Radius < 2 mmStandard Deviation of Pore Equivalent Radius (mm)
L12.3318137.02%0.93
L31.7522164.71%0.68
L81.5036872.01%0.76
Table 9. Average pore diameter of graded loose materials calculated by the empirical formula.
ModelsAverage Equivalent Radius of Pores (mm)
L11.43
L30.86
L80.58
Table 10. Parameters of throat-size distribution.
ModelsAverage Equivalent Radius of Throats (mm)Total Throat CountFraction of Throats with Radius < 0.4 mmStandard Deviation of the Equivalent Radius of the Roar (mm)
L10.8066922.32%0.50
L30.5370343.97%0.35
L80.4874547.28%0.32
Table 11. Coordination number parameters of different gradation models.
ModelsCuAverage Pore Coordination NumberCoordination Number ≤ 5Coordination Number ≤ 12
L11.607.4237.57%86.74%
L32.386.3545.23%91.40%
L84.225.2356.52%93.48%
Disclaimer/Publisher’s Note: The statements, opinions and data contained in all publications are solely those of the individual author(s) and contributor(s) and not of MDPI and/or the editor(s). MDPI and/or the editor(s) disclaim responsibility for any injury to people or property resulting from any ideas, methods, instructions or products referred to in the content.