Article

Permian Longtan Shale in Guizhou, China: From Mineralogy and Geochemistry to Paleoenvironments

1
School of Energy Resources, China University of Geosciences, Beijing 100083, China
2
Guizhou Energy Group Corporation Limited, Guiyang 550081, China
3
Institute of Energy, School of Earth and Space Sciences, Peking University, Beijing 100871, China
4
Guizhou Provincial CBM and Shale Gas Engineering Research Center, Guiyang 550081, China
*
Authors to whom correspondence should be addressed.
Current address: British Geological Survey, Keyworth, Nottingham NG12 5 GG, UK.
Minerals 2025, 15(8), 850; https://doi.org/10.3390/min15080850
Submission received: 29 June 2025 / Revised: 28 July 2025 / Accepted: 8 August 2025 / Published: 10 August 2025
(This article belongs to the Special Issue Organic Petrology and Geochemistry: Exploring the Organic-Rich Facies)

Abstract

The depositional environment of the Permian Longtan shale (LS) in southwestern Guizhou Province, China, has been analyzed using mineralogical and geochemical approaches. Macroscopic observations of those studied LS samples showed that the LS is rather homogeneous and interbedded with coal strips, suggesting a relatively stable and shallow water environment. A detailed microscopic analysis demonstrated that higher land plants contributed the predominant proportion of organic matter in the LS. Inorganic geochemical analysis revealed a mixed source of materials with relatively larger proportions of basalt and andesite. Semiarid to humid and warm climates corresponding to an overall intensive weathering were deduced in the late Permian periods. The LS was deposited in a brackish-to-marine water environment with an oxic to dysoxic redox condition. Sea level rise/down coupled with changes in climate, water salinity, and redox condition jointly controlled the formation of the Longtan shale. Mineralogical composition indicates that the LS mainly comprises of argillaceous with minor siliceous facies, which will likely bring challenges for hydraulic fracturing.

1. Introduction

Shale oil and shale gas have been emerged to offset the production decline of conventional petroleum and regarded as a vital role in long-term energy security due to their enormous quantity [1,2]. China is the third country, followed USA and Canada, which have been commercially successful in shale gas production worldwide. Besides, China has been ranked as the largest holder of shale gas reserves among 41 countries based on the assessment of 137 shale formations therein [1]. Nevertheless, the success of shale gas extraction in China is still limited to some areas exclusively in the Sichuan Basin [3,4]. It is believed that there are more potential reservoirs that are undiscovered outside Sichuan Basin [5]. Therefore, exploration activities for shale gas resources have been conducted in southern China in the past decade [5].
Yangtze Platform is one of the oldest blocks and is geographically located in the southern part of China [4]. In the Upper (western part of) Yangtze Platform, gas shale studies are mainly focused on the Proterozoic and early Paleozoic formations, e.g., the Ediacaran Doushantuo Formation and Dengying Formation [4,6], the Lower Cambrian Niutitang Formation and Qiongzhusi Formation [7,8], the Ordovician Wufeng Formation, and the Lower Silurian Longmaxi Formation [4,9]. The Upper Permian Longtan Formation has attracted research interest in recent years due to its high organic matter content (~6.5% TOC), proper thermal maturity (~1.8 VRr), large area distribution, and great thickness (~200 m) [10]. Different from the intensively studied purely marine shales, the Longtan shale is characterized by a high clay content and coexists with multiple coal seams [10,11,12,13].
In our previous works on the Longtan shale, the depositional environment has been analyzed primarily based on organic petrography and organic geochemistry [4,5,10,14,15]. Overall, a paralic environment can be speculated during the deposition of the Longtan shale. However, it is noteworthy that many organic geochemical proxies are probably invalid at certain levels of thermal maturities [16]. Therefore, mineralogical and inorganic geochemical analysis on the same set of samples is merit to validate the results derived from organic petrographic and geochemical approaches. This study aims to (1) characterize the Longtan shale (and part of the coals) at Tucheng Syncline, southwestern Guizhou province, based mainly on mineralogical and inorganic geochemical approaches; (2) reveal the provenance and depositional environment for the Longtan shale in the study area; and (3) validate the interpretation regarding depositional environment based on organic petrographic and geochemical methods.

2. Geological Background

Guizhou Province geographically situated in southern China, and tectonically at the southwestern margin of the Upper Yangtze Platform (UYP) (Figure 1) [10,17]. The UYP hosts multiple sets of organic-rich source rocks, including the Ediacaran Doushantuo and Liujiapo Formations, Lower Cambrian Niutitang and Jiumenchong Formations, Upper Ordovician Wufeng-Lower Silurian Longmaxi Formations, and Upper Permian Longtan Formation [4,14]. This region’s geological framework is complicated by widespread fault systems, with Guizhou Province being subdivided into six principal tectonic units, including Dian-Qian Depression, Qianzhong Uplift, Qianxinan Depression, Qiannan Depression, Wuling Depression, and Xuefeng Uplift (Figure 1) [5,10,13].
The study area is located in southwestern Guizhou Province, tectonically belonging to the Qianxinan Depression [18]. This depression underwent a complex geotectonic evolution [5,19]. During the Late Hercynian, crustal subsidence facilitated the development of a sedimentary basin, forming a downwarped basin. Subsequent Indosinian tectonic activities maintained relatively subdued depression development. From the Late Yanshanian to Himalayan stages, the region experienced intense folding, faulting, uplift, and erosion, ultimately shaping its present structural framework. The Tucheng Syncline, situated in the northwestern sector of the Qianxinan Depression, exhibits a NW-SE axial trend with gentle NE limbs and steeper SW-dipping limbs [10,20]. This 50 km long synclinal structure displays variable widths ranging from 2 to 8 km, having been subjected to multi-phase tectonic events spanning Hercynian, Indosinian, Yanshanian, and Himalayan orogenies. The syncline is crosscut by numerous fault systems developed through polycyclic structural deformation.
The coal-bearing Upper Permian Longtan Formation in the study area exhibits diverse depositional environments and complex lithological assemblages, having developed under long-term paralic conditions [14,21,22]. The sedimentary facies include carbonate tidal flats, barrier-lagoon systems, and shallow-water deltas. These paralic successions demonstrate substantial thickness (300–450 m) with heterogeneous lithologies dominated by mudstone, shale, silty mudstone, muddy siltstone, siltstone, and multiple coal seams, locally intercalated with fine-grained sandstone beds, siderite laminae, and pyritic layers [10,23]. Vertically, repetitive alternations of “shale–mudstone–sandstone” sequences characterize the stratigraphic column, reflecting pronounced reservoir heterogeneity.

3. Samples and Methods

20 core samples were systematically collected from well SV-3 in the Tucheng Syncline, southwestern Guizhou Province, China (Figure 1). These samples covered the whole stratigraphic section of LTF, with sampling depths ranging from 655.3 to 998.9 m. The lithological assemblage comprises shale, mudstone, silty mudstone, muddy siltstone, sandstone, and coal seams. This study focuses specifically on organic-rich shale and mudstone intervals as well as a few coal samples. Therefore, 12 samples were subjected to more detailed petrological and geochemical analysis.

3.1. Petrology

Petrological characteristics were analyzed based on macroscopic core observation, and microscopic and imaging (field emission scanning electron microscopy; FE-SEM) analysis. Vitrinite reflectance (VRr) and total organic carbon (TOC) content were collected from Zhang et al. (2025) [10]. Microscopic analysis was conducted using a Zeiss Axio Scope A1 microscope under standardized laboratory conditions (22 °C, 30% relative humidity). Samples were prepared as polished blocks and measured in oil immersion mode with non-polarized monochromatic light at 546 nm ± 5 nm wavelength [14]. FE-SEM analysis was conducted using a Zeiss SIGMA 300 scanning electron microscope (Goettingen, Germany). This instrument provides a maximum spatial resolution of 1.2 nm and a magnification of up to 200,000×. Imaging was conducted under controlled laboratory conditions (24 °C and 35% relative humidity) to ensure sample stability. Shale specimens were first cut into thin slices (1 cm × 1 cm × 2 mm) and mechanically polished to obtain flat surfaces. Subsequently, fine polishing was performed using an ATAN 685.C argon ion milling system (Austin, TX, USA) to generate a uniform and smooth surface while preserving the original pore architecture. A 10 nm thick gold coating was then sputtered onto the sample surface to enhance electrical conductivity and improve imaging resolution and stability. Finally, high-resolution micrographs were acquired in raster scan mode under accelerating voltages ranging from 0.5 to 40 keV to facilitate detailed analysis of microstructural features.

3.2. The X-Ray Diffraction

The X-ray diffraction (XRD) analysis was performed using a PANalytical X’Pert Powder diffractometer (Almelo, the Netherlands). Prior to analysis, samples were pulverized to 200 mesh size and homogenized with ethanol through mechanical grinding. Soluble organic components were extracted via 400 mL chloroform treatment. The purified samples were dried to constant mass in a thermostatic oven at 60 °C. Upon achieving mass stabilization, 20 wt.% Al2O3 was incorporated as an internal standard. Diffractograms were acquired under Cu-Kα radiation (λ = 1.5406 Å) with a scanning rate of 2°/min across 2θ range of 2–45°. Mineral quantification was achieved through Rietveld refinement using HighScore Plus software 4.0, with phase identification conducted by matching experimental patterns against the ICDD PDF-4+ database. Quantitative mineralogical composition was determined based on normalized reference intensity ratios (RIR) and full-pattern fitting algorithms.

3.3. X-Ray Fluorescence

X-ray fluorescence (XRF) analysis was performed using an AXios-mAX sequential wavelength-dispersive X-ray fluorescence spectrometer (Panalytical, Almlo, the Netherland). Prior to analysis, samples were processed through crushing and pulverization to achieve homogeneous particle size distribution, followed by oven-drying at 105 °C for 12 h. Combustion of approximately 1 g aliquots in ceramic crucibles using a muffle furnace at 1000 °C for 2 h to determine loss on ignition (LOI) after cooling to 400 °C. Fusion of 0.6 g dried sample with 0.3 g oxidizing agent and 6.0 g flux in platinum crucibles at 1150 °C for 14 min to form homogeneous glass beads.

3.4. Inductively Coupled Plasma Mass Spectrometry

Inductively coupled plasma mass spectrometry (ICP-MS) analysis was conducted using a PerkinElmer NexION 350X (PerkinElmer, Inc., Waltham, MA, USA) inductively coupled plasma mass spectrometer. Samples were sieved to <100 μm particle size and oven-dried at 105 °C for 3 h to eliminate moisture. After cooling to ambient temperature, 0.5 g aliquots were digested in polytetrafluoroethylene (PTFE) vessels with 1 mL hydrofluoric acid (HF) and 0.5 mL nitric acid (HNO3) at 190 °C for 12–24 h. Residual particulates were further treated with additional HNO3 and reheated at 130 °C for 3 h. The cooled digestates were transferred to polyethylene bottles and diluted to 25 mL with 1% HNO3 matrix solution for analysis. Operational parameters included a radiofrequency power of 1500 W, nebulizer gas flow of 0.98 L/min, and dwell time of 50 ms per isotope. Quantification employed external calibration curves with Rh internal standardization, achieving a method detection limit (MDL) of 1 ppm and analytical precision of 0.01% RSD [24].

4. Results

4.1. Petrology

Macroscopic characteristics of the analyzed core materials were shown in Figure 2. Obviously, all the samples exhibit (1) a dark-colored appearance ranging from grayish-black to deep-black hues; (2) well-developed laminated structures with well-defined bedding planes; and (3) preserved fossil remains of higher land plants and coal streaks as organic matter manifestations. For samples with low TOC content (<5%), such as a (2.09%), c (2.61%), and k (4.78%), the cores exhibit light gray to gray-black coloration and relatively compact textures. Samples with moderate TOC content (5%–20%), including b (7.90%), d (6.80%), e (19.65%), and g (7.95%), show a noticeable darkening in color, and organic-rich laminae or thin coal seams are locally visible. In contrast, samples with high TOC content (>25%), such as f (60.46%), h (33.88%), i (27.95%), j (32.10%), and l (29.80%), display extremely dark coloration, resembling coal, indicating a high degree of coalification.
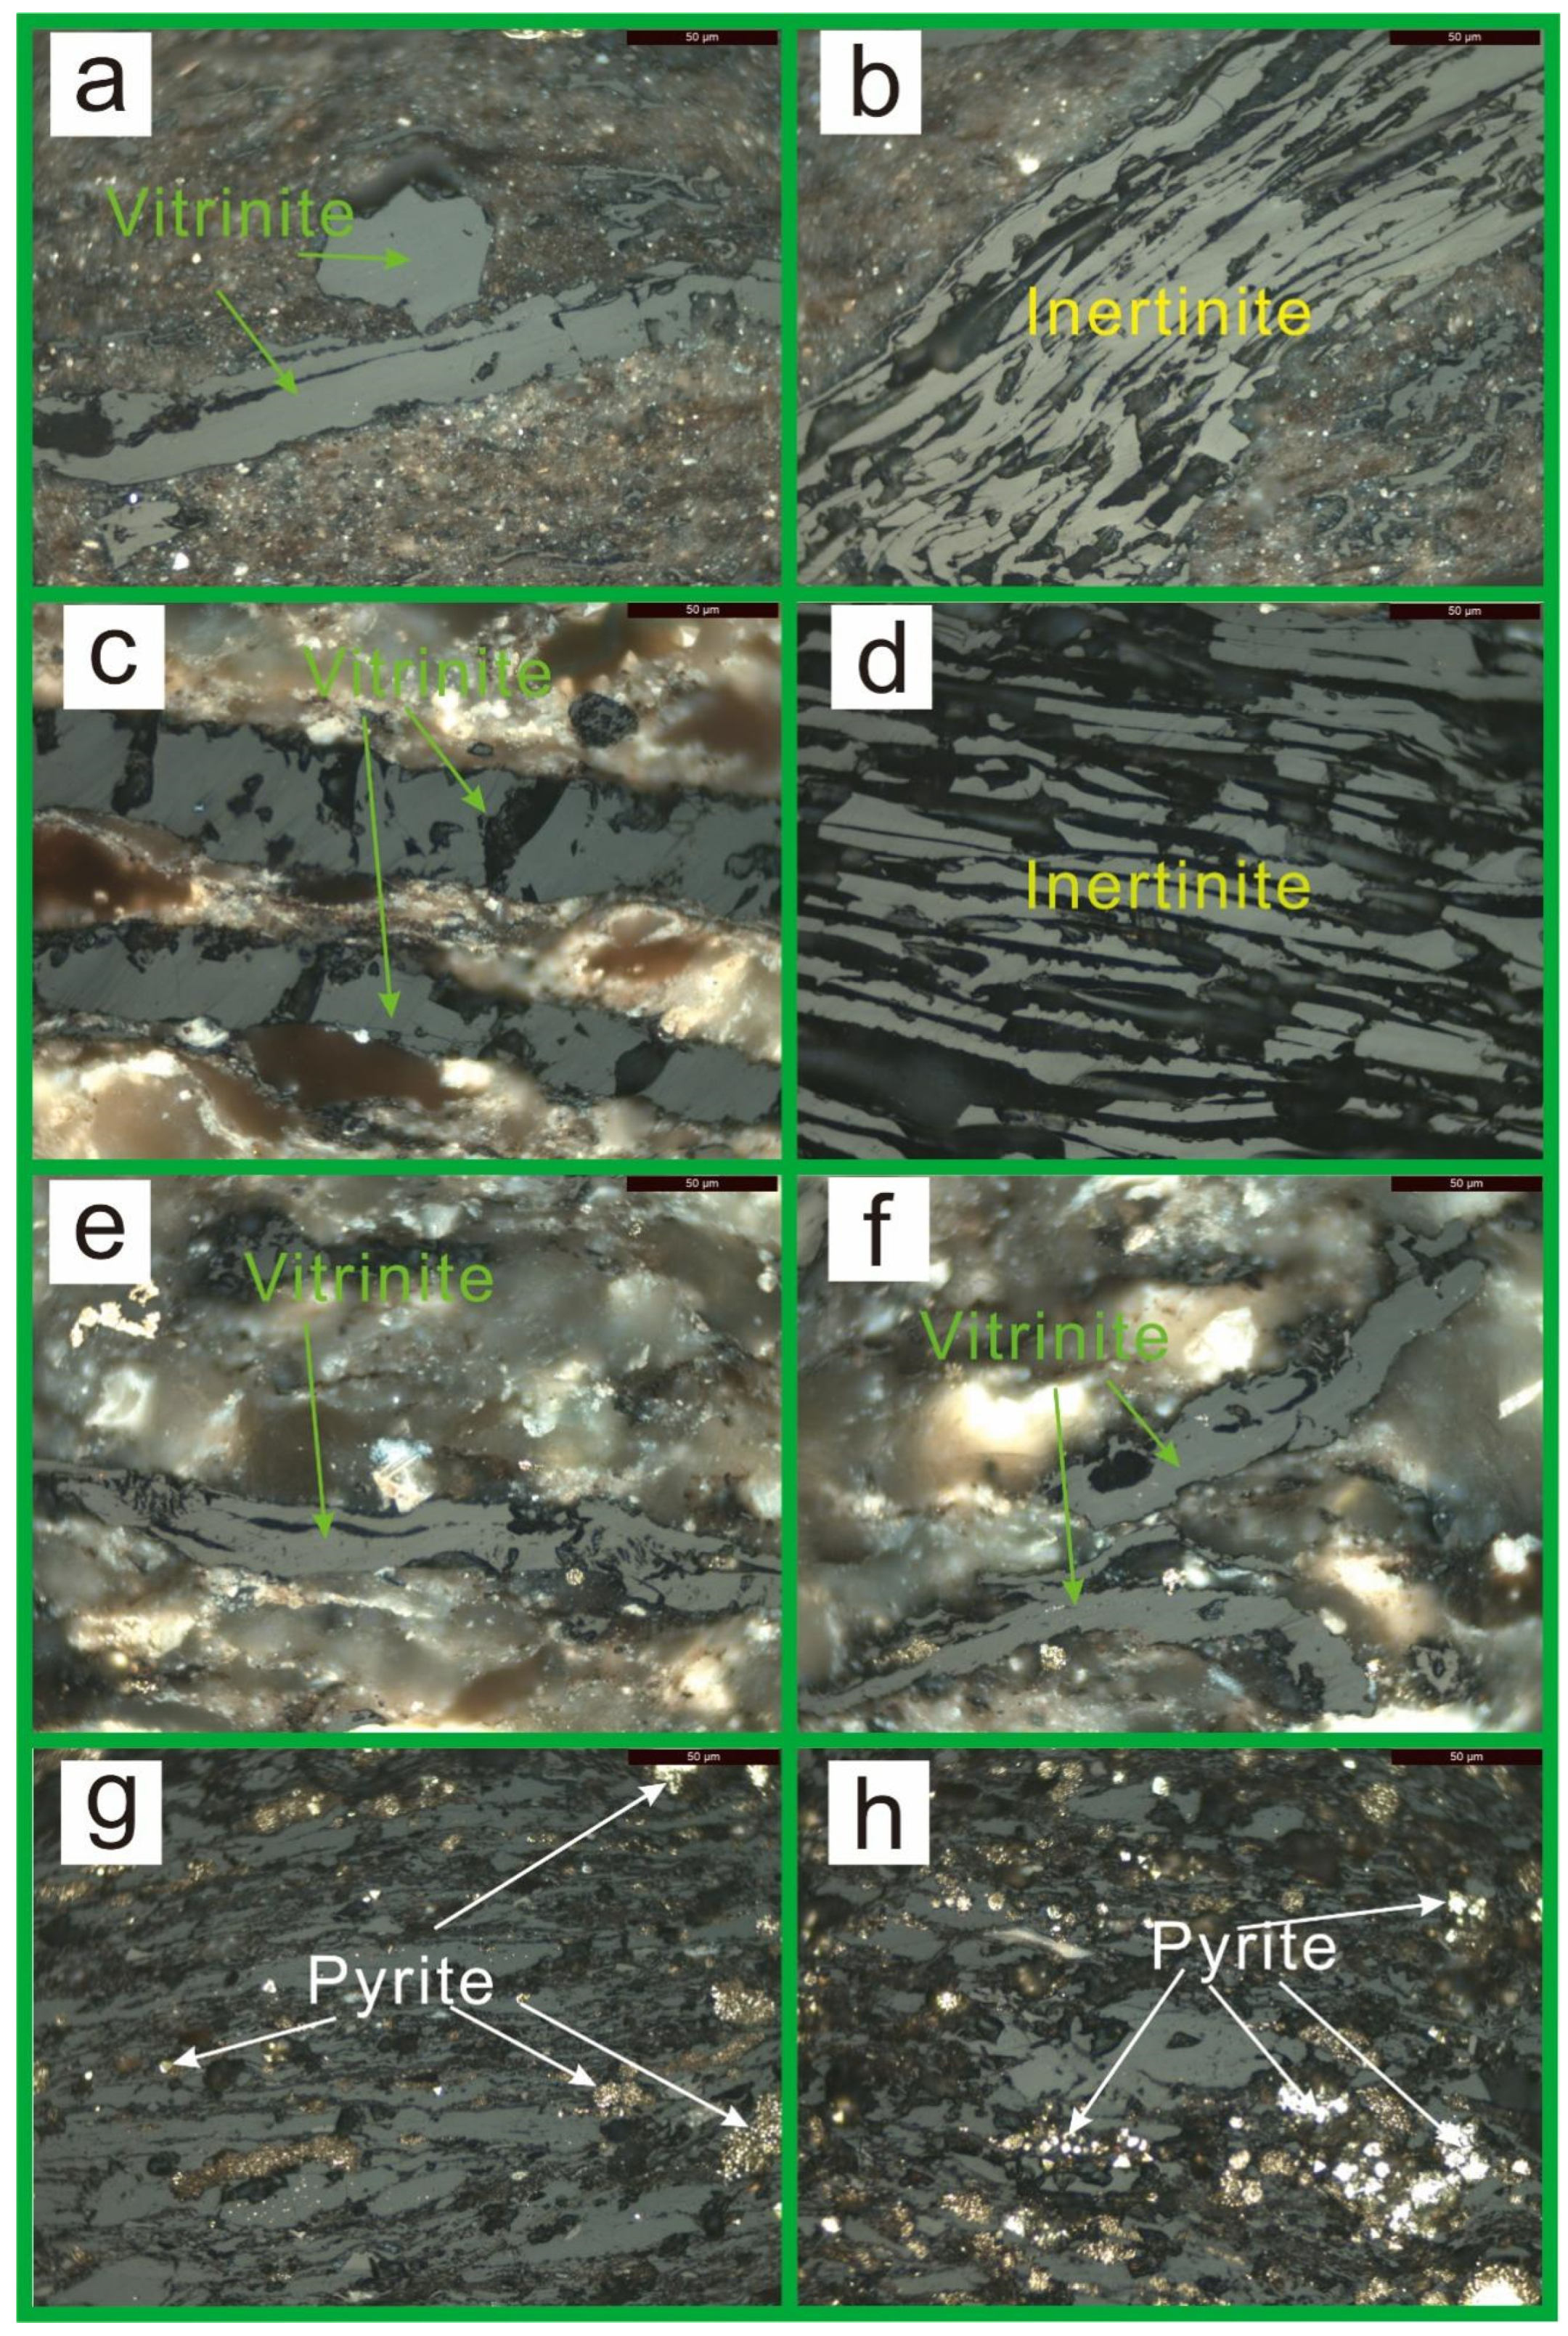
Under a microscope, abundant vitrinite and inertinite particles as well as pyrites were observed in these samples (Figure 3). Vitrinite presents a light gray color under reflected light and typically exhibits blocky or banded shapes (Figure 3a,c,e,f). Some inertinite particles display a relatively well-aligned orientation (Figure 3b,d). The inertinite appears bright white, occurring irregularly within bands or along fractures (Figure 3b,d). Additionally, pyrite grains (Figure 3g,h) are widely distributed throughout the samples, predominantly occurring as spherical or massive aggregates surrounding both vitrinite and inertinite components.
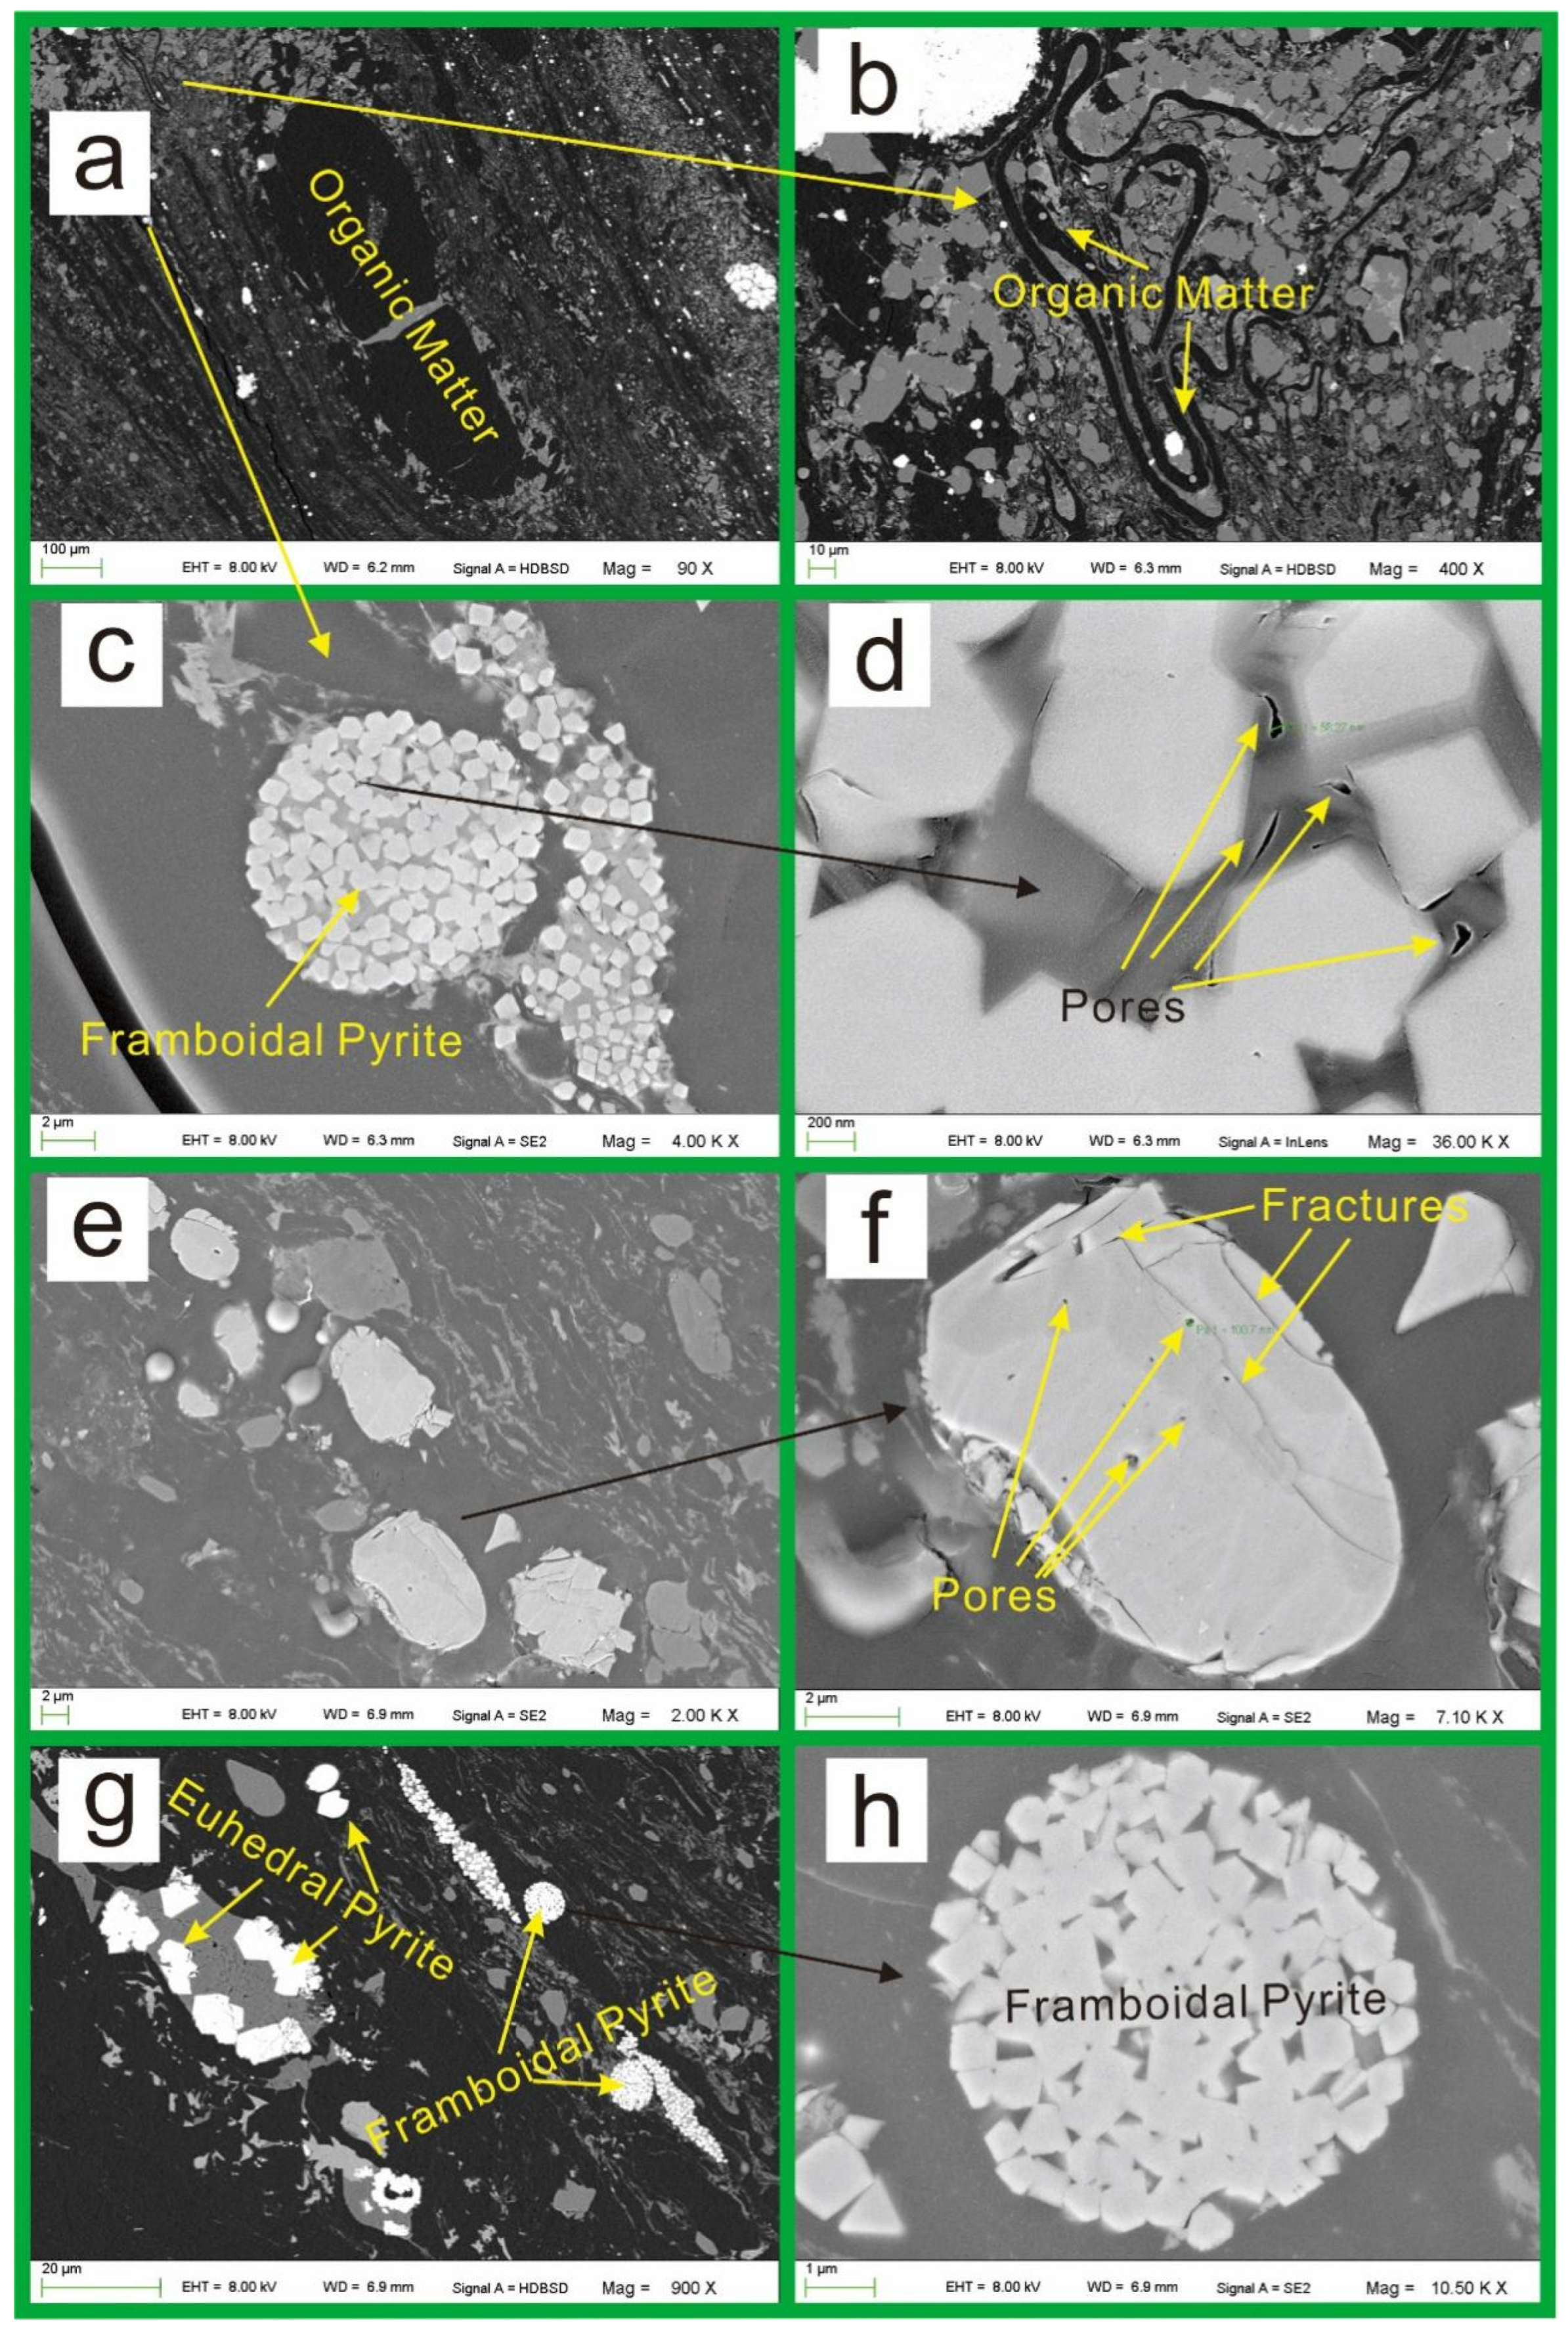
Imaging analysis via FE-SEM (Figure 4) offered additional information on the morphological features of organic matter, minerals, and pores. Figure 4a,b show that organic matter typically appears as dark gray masses interbedded with minerals, such as pyrite and quartz in which circular and irregularly shaped pores are well developed (Figure 4d,f). Figure 4c,d present the morphology of framboidal pyrite, characterized by spherically aggregated crystals with well-defined, densely packed grains. The crystal surfaces exhibit striated fractures and angular pores (Figure 4d). Figure 4e,f display euhedral pyrite grains with sharp boundaries and variable crystal sizes; distinct surface fractures are evident (Figure 4f). Figure 4g shows multiple clusters of pyrite grains aligned along bedding planes, forming banded associations with the surrounding matrix. A magnified view of the framboidal pyrite (Figure 4h) reveals tightly packed grains with intercrystalline nanopores, resembling the structure observed in Figure 4c.

4.2. Mineralogy

The X-ray diffraction (XRD) analytical results (Table 1) reveal that the mineral composition of the Longtan Formation shale samples is dominated by clays, quartz, and carbonates, followed by feldspar and pyrite. Specifically, clay mineral content ranges from 14 to 88 wt.% (average: 60.15 wt.%), comprising predominantly chlorite (43.53 wt.% average) and kaolinite (41.2 wt.% average), while illite–smectite mixed-layer minerals exhibit lower abundance (27.7 wt.% average). Quartz exhibits substantial variability in concentration, ranging from 7 to 86 wt.% (e.g., sample SV3-22) with a mean value of 24.7 wt.%. Carbonate minerals display contents between 4 and 26 wt.% (average: 10 wt.%). Both feldspar and pyrite concentrations remain below 10 wt.%, while accessory minerals occur in minor proportions (3 to 13 wt.%).

4.3. Major Elements

The major oxide compositions of the Longtan Formation shale samples in this study are summarized in Table 2. The SiO2 content dominates with concentrations ranging from 39.09 to 72.18 wt.% (mean: 54.01 wt.%), followed by Al2O3 (4.32–30.10 wt.%, mean: 20.86 wt.%) and Fe2O3 exhibiting significant variability (1.21–32.20 wt.%, mean: 17.23 wt.%). Accessory oxides including MgO, Na2O, K2O, P2O5, TiO2, CaO, and MnO collectively account for <5 wt.%, with MnO showing the lowest abundance (mean: 0.13 wt.%). These results demonstrate that SiO2, Al2O3, and Fe2O3 constitute the principal mineralogical components, while other oxides occur as minor constituents in the Longtan Formation shales.

4.4. Trace and Rare Earth Elements

The trace element distribution in Longtan Formation shale samples demonstrates significant variability based on analytical results presented in Table 3. Barium (Ba) exhibits the highest mean concentration at 462 ppm, followed by zirconium (Zr, 393 ppm) and strontium (Sr, 270 ppm). Vanadium (V, 260 ppm), copper (Cu, 145 ppm), zinc (Zn, 100 ppm), chromium (Cr, 94 ppm), and nickel (Ni, 92 ppm) display sequentially decreasing mean concentrations. The remaining fifteen trace elements demonstrate mean concentrations below 60 ppm, with titanium (Ti) showing the lowest abundance (0.775 ppm). This distribution pattern reveals distinct elemental enrichment characteristics within the Longtan shale sequence.
The rare earth element (REE) in the Longtan Formation shale samples, as presented in Table 4, reveal substantial compositional variability across the studied interval. Total REE concentrations range from 0.16 ppm (sample SV3-22) to 196.65 ppm (sample SV3-01), demonstrating significant fractionation patterns. The shale samples exhibit marked light rare earth element (LREE) enrichment relative to heavy rare earth elements (HREE), with cerium (Ce) displaying the highest concentrations (95.11–196.65 ppm, mean: 153.28 ppm) followed by lanthanum (La, 45.85–99.21 ppm, mean: 76.78 ppm). In contrast, heavy REEs show markedly lower abundances, exemplified by thulium (Tm, 0.18–0.72 ppm, mean: 0.59 ppm) and lutetium (Lu, 0.16–0.66 ppm, mean: 0.55 ppm).

5. Discussion

5.1. Provenance and Tectonic Setting

Provenance analysis in this study includes sources of organic matter and inorganic substances. Direct evidence can be found based on macroscopic observation of the core materials, on which fossils apparently from higher land plants are visible (Figure 2). This was also documented in Zhang et al. (2020) [5] and Zhang et al. (2025) [10]. However, the quantity of organic matter derived from higher land plants cannot be confirmed based on merely core observations. Microscopic analysis shows that vitrinite and inertinite are the main organic matter observed under microscope (Figure 3), which indicates that a predominant higher land plant-derived organic matter contributes to the organic substances in the Longtan shale. The absence of amorphous organic matter in the Longtan shale can be ascribed to the relatively smaller proportion of aquatic-derived organic matter therein. It can also be blamed for the thermal degradation of liptinite which has been proved that liptinite is not detectable given the maturity stage of the Longtan shale [10]. Additionally, the relative proportion of organic matter in the Longtan shale was also revealed using organic geochemical data [10].
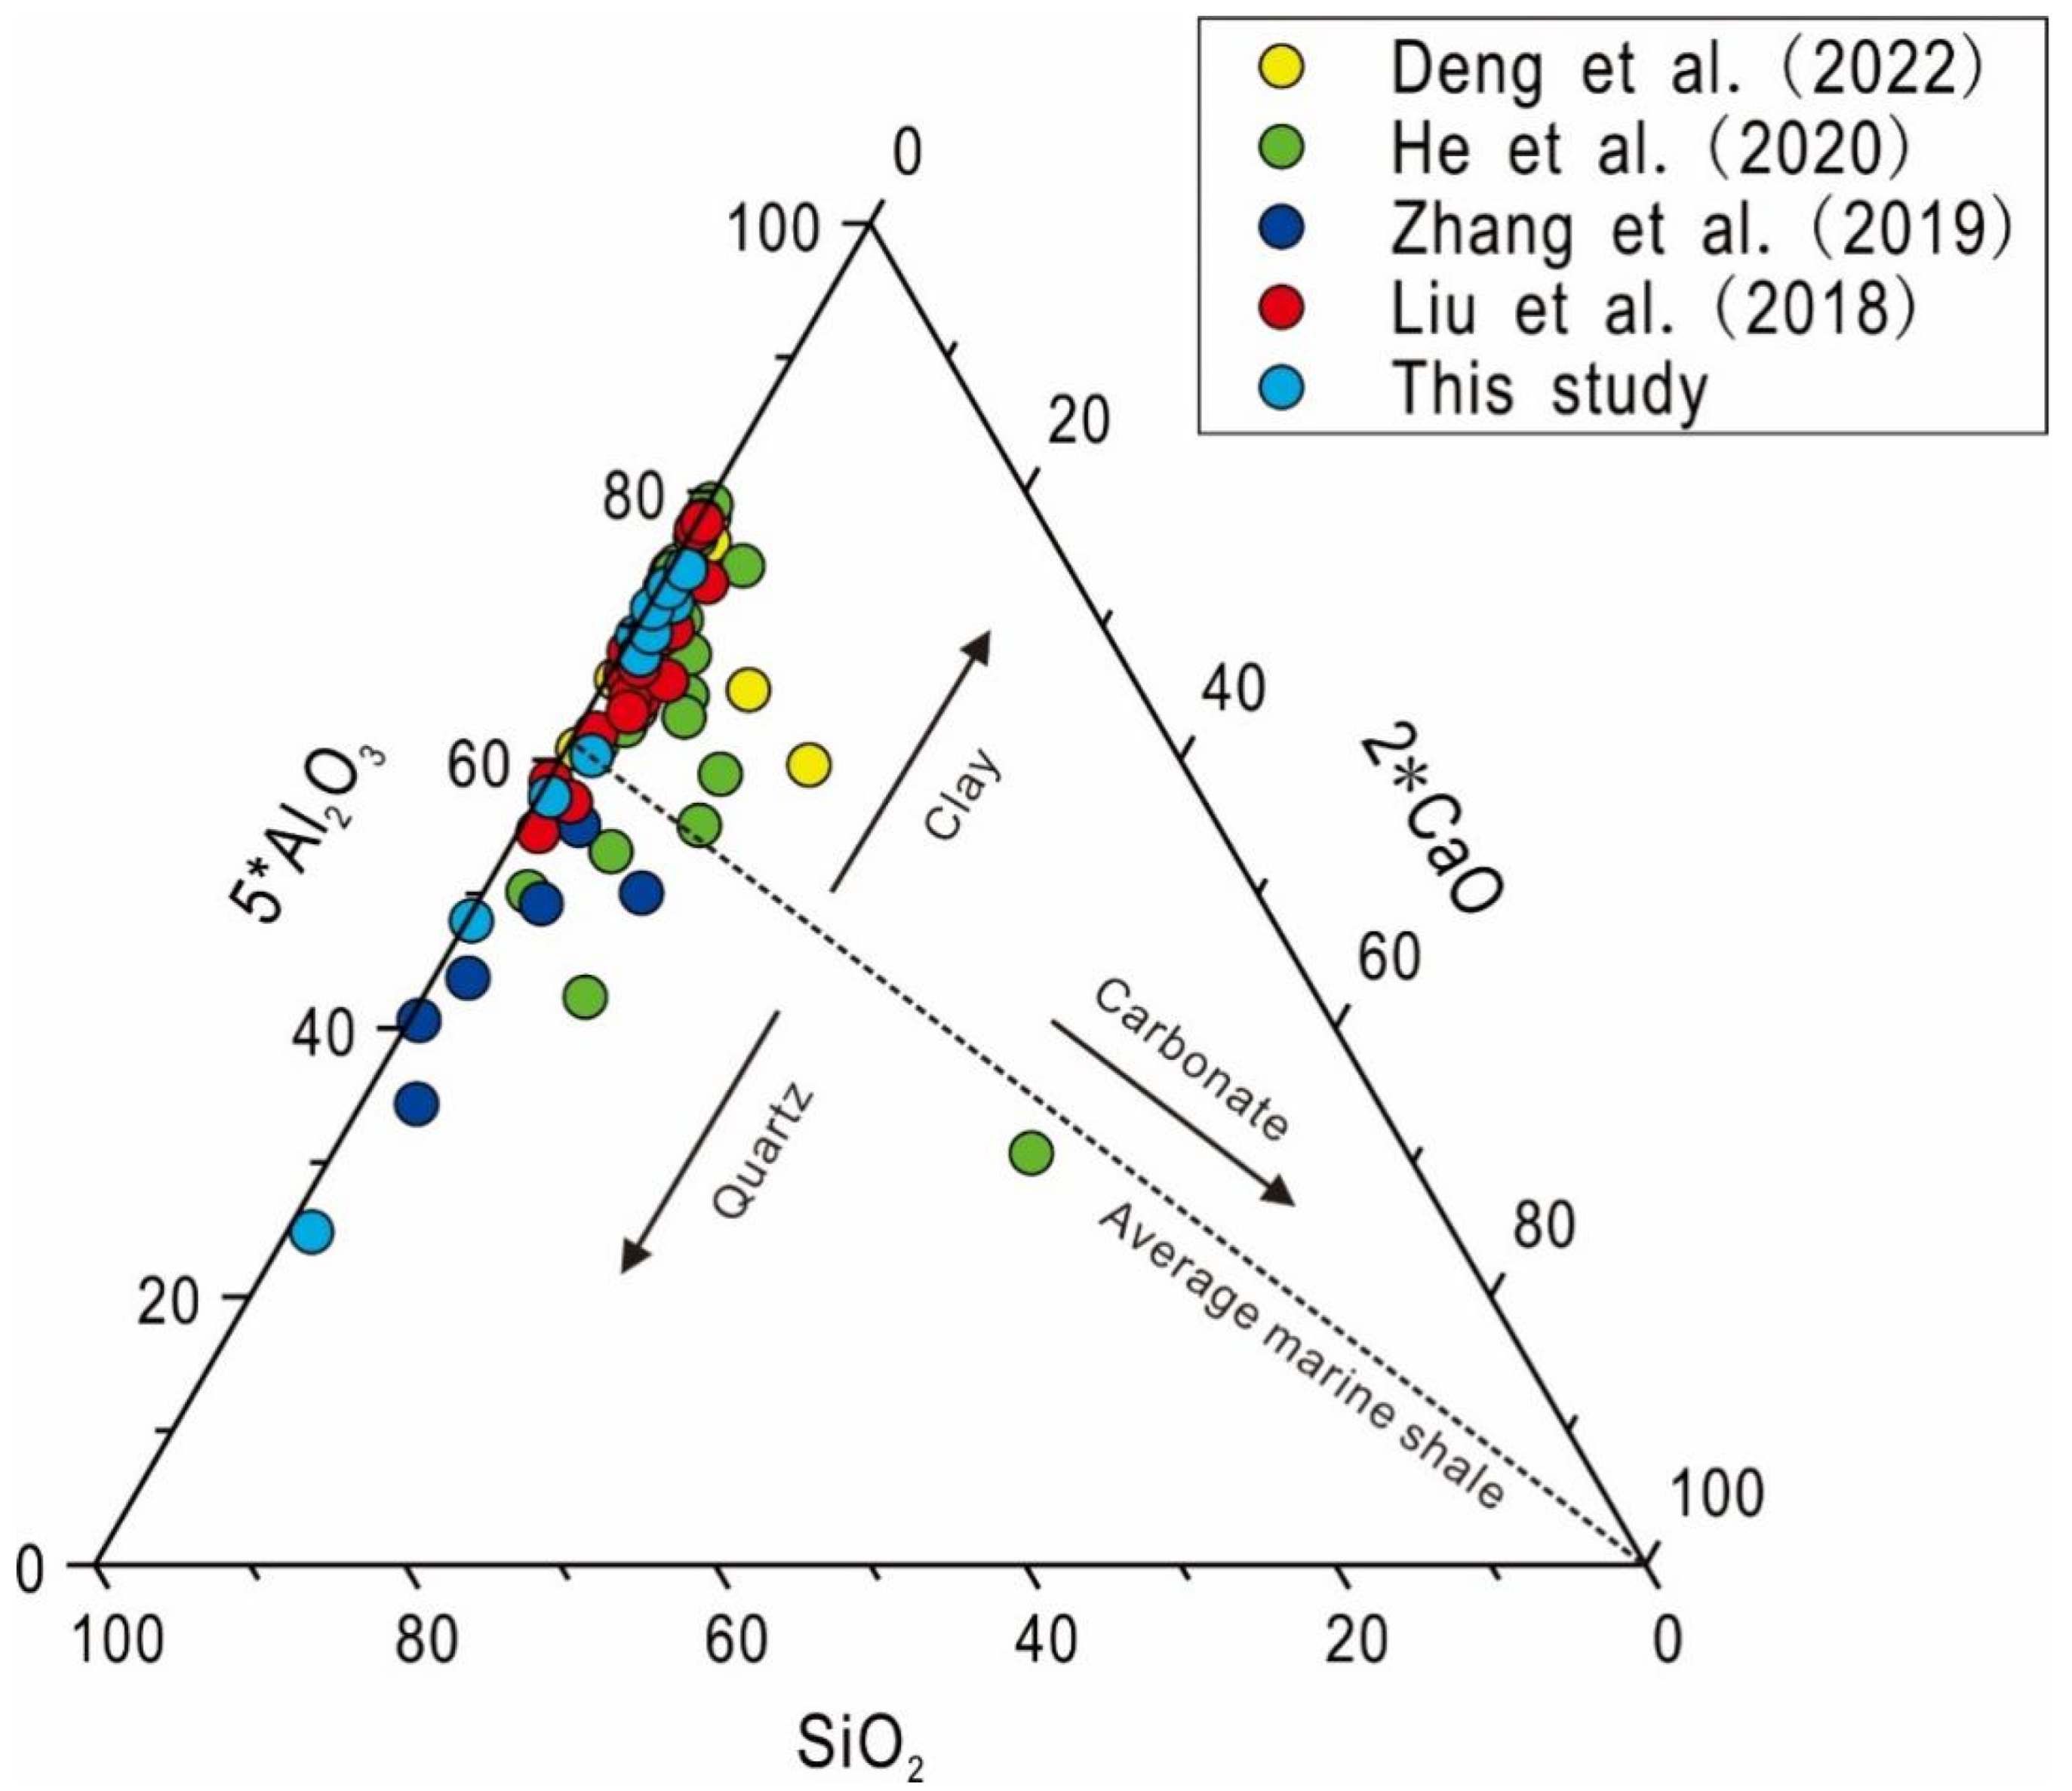
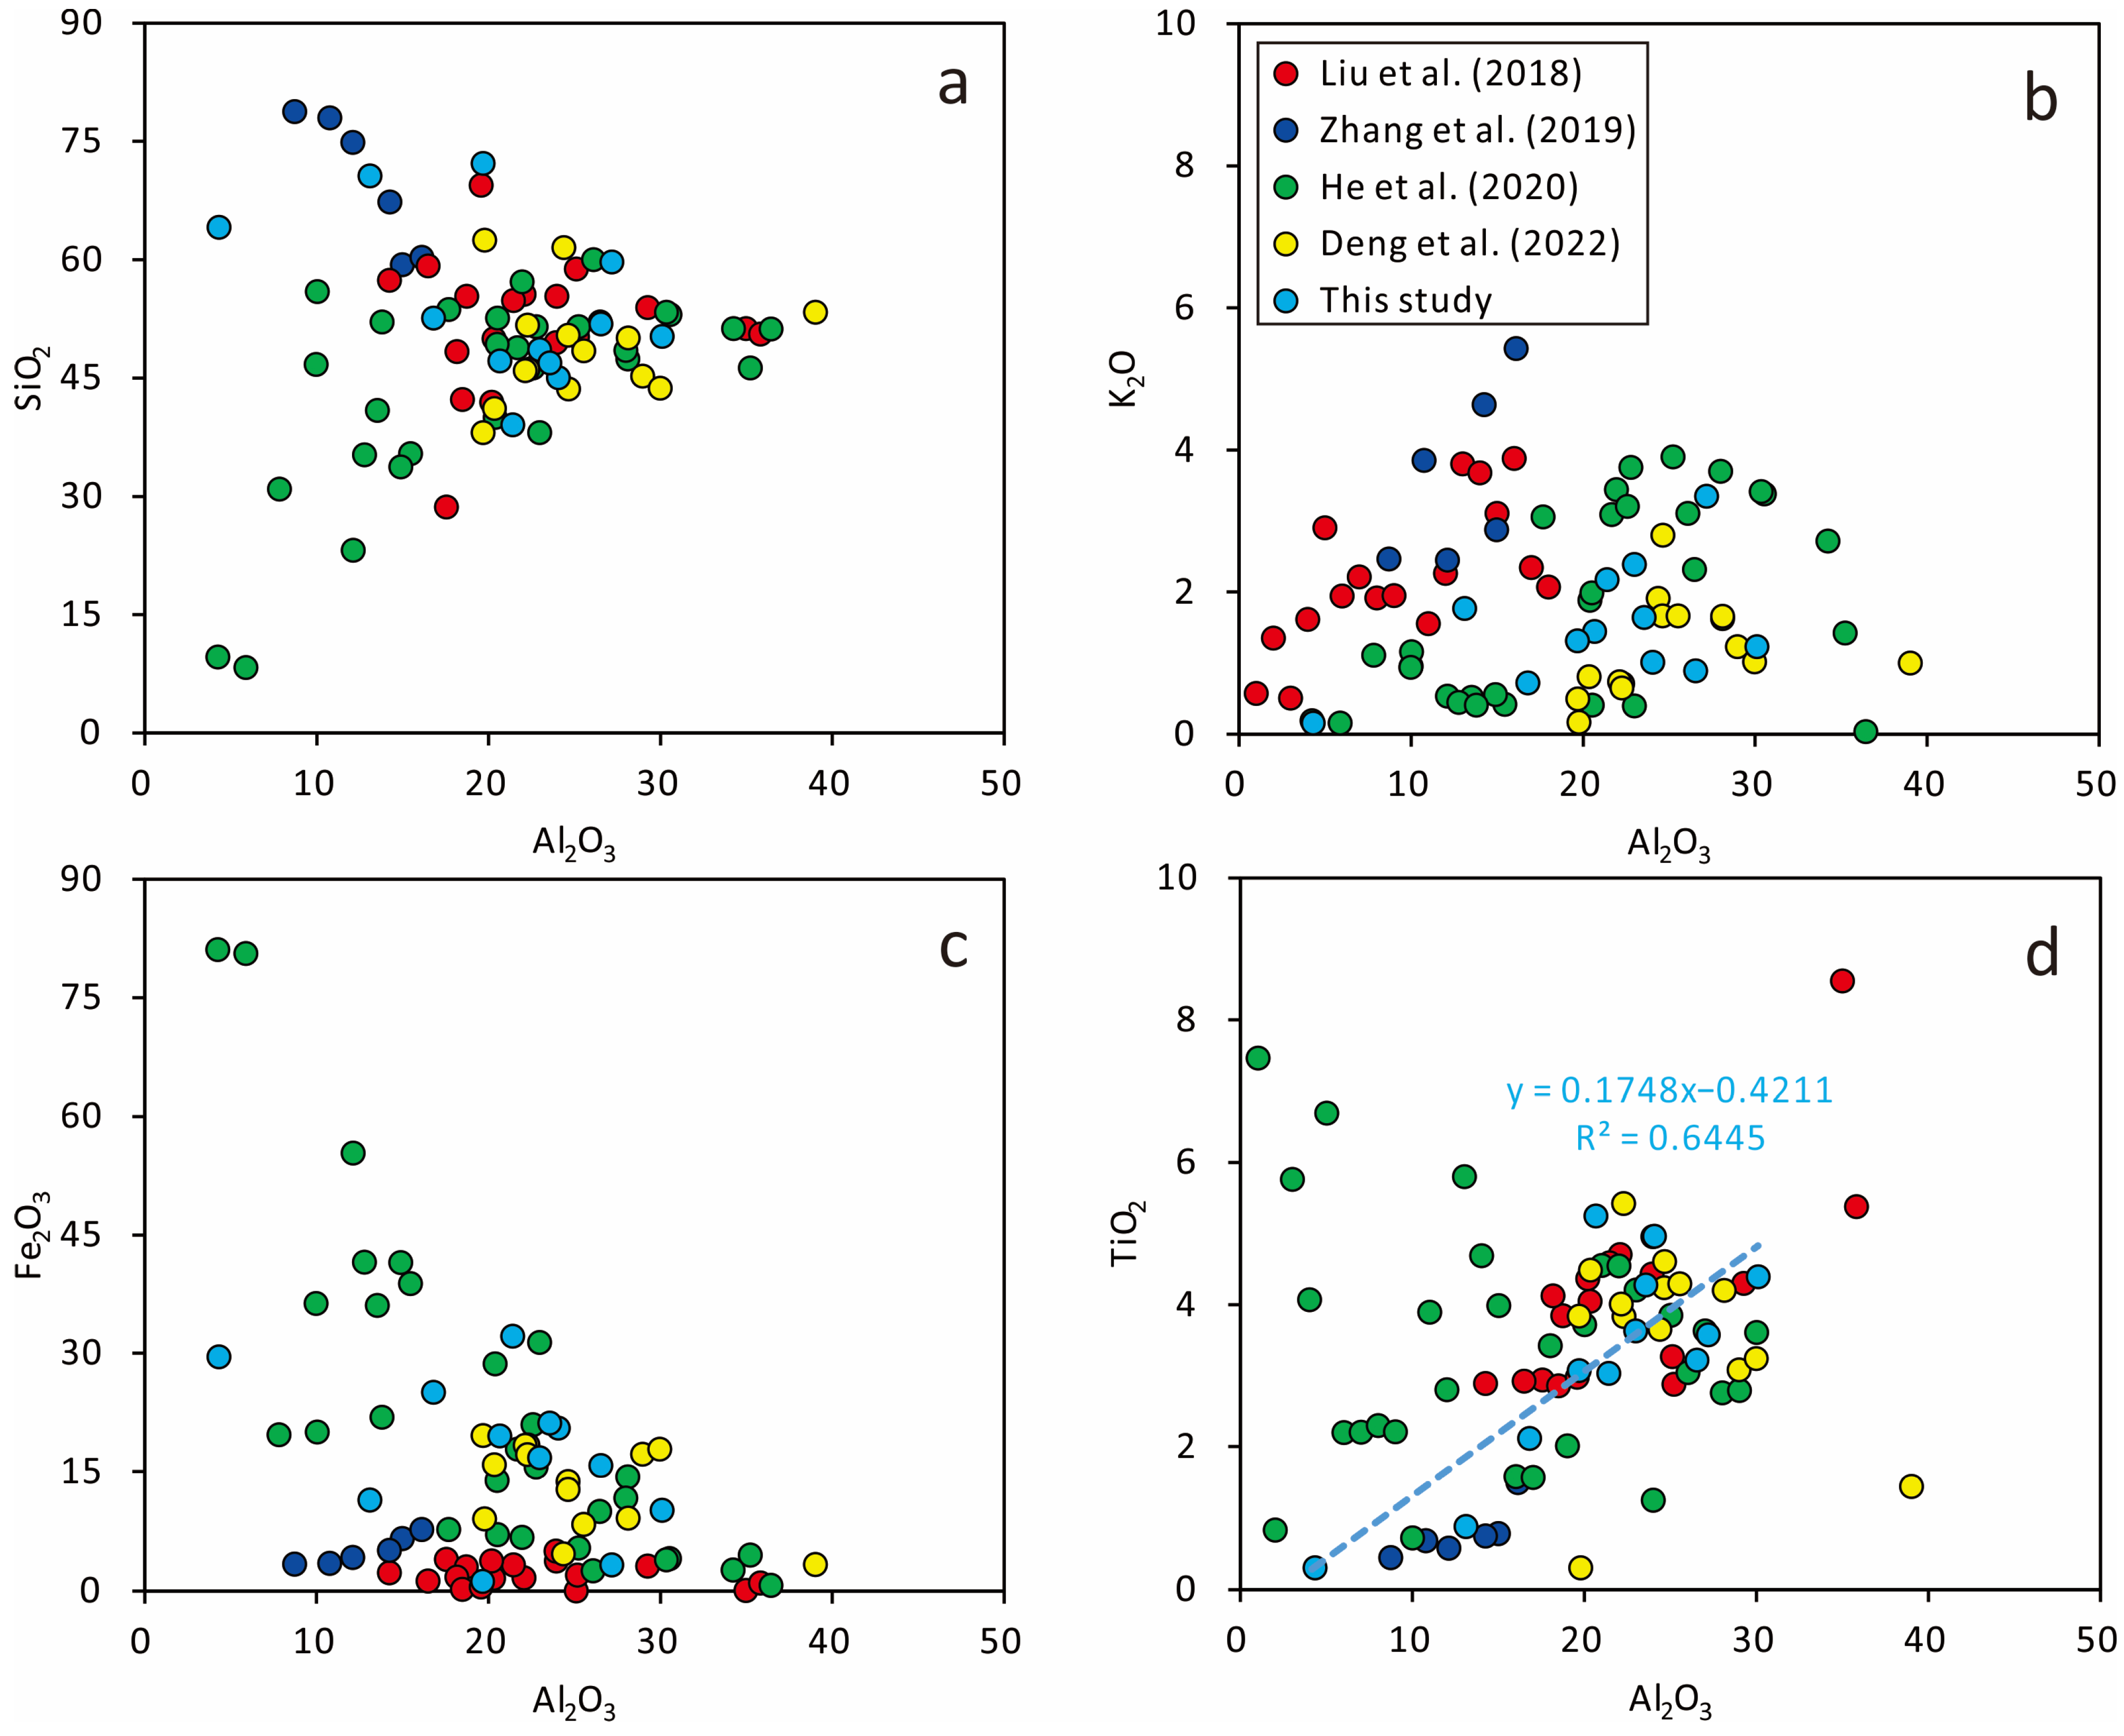
Based on the relationships among SiO2, CaO, and Al2O3, a relatively larger percentage of terrestrial input can be inferred because the Longtan shale in this study is clearly enriched in clay minerals compared to the average marine shale (Figure 5). This point is in line with the mineralogical composition (Figure 6). To quantitative analyze the degree of terrestrial input, the contents of Al and Ti are normally used as indicators given their main occurrences in detrital minerals such as quartz and feldspar [25]. A fairly good relationship, with an R2 of 0.6445, between Al2O3 and TiO2 probably suggests a strong terrestrial input (Figure 7d). This interpretation is consistent with large amounts of higher land plants-derived organic matter in the Longtan shale.
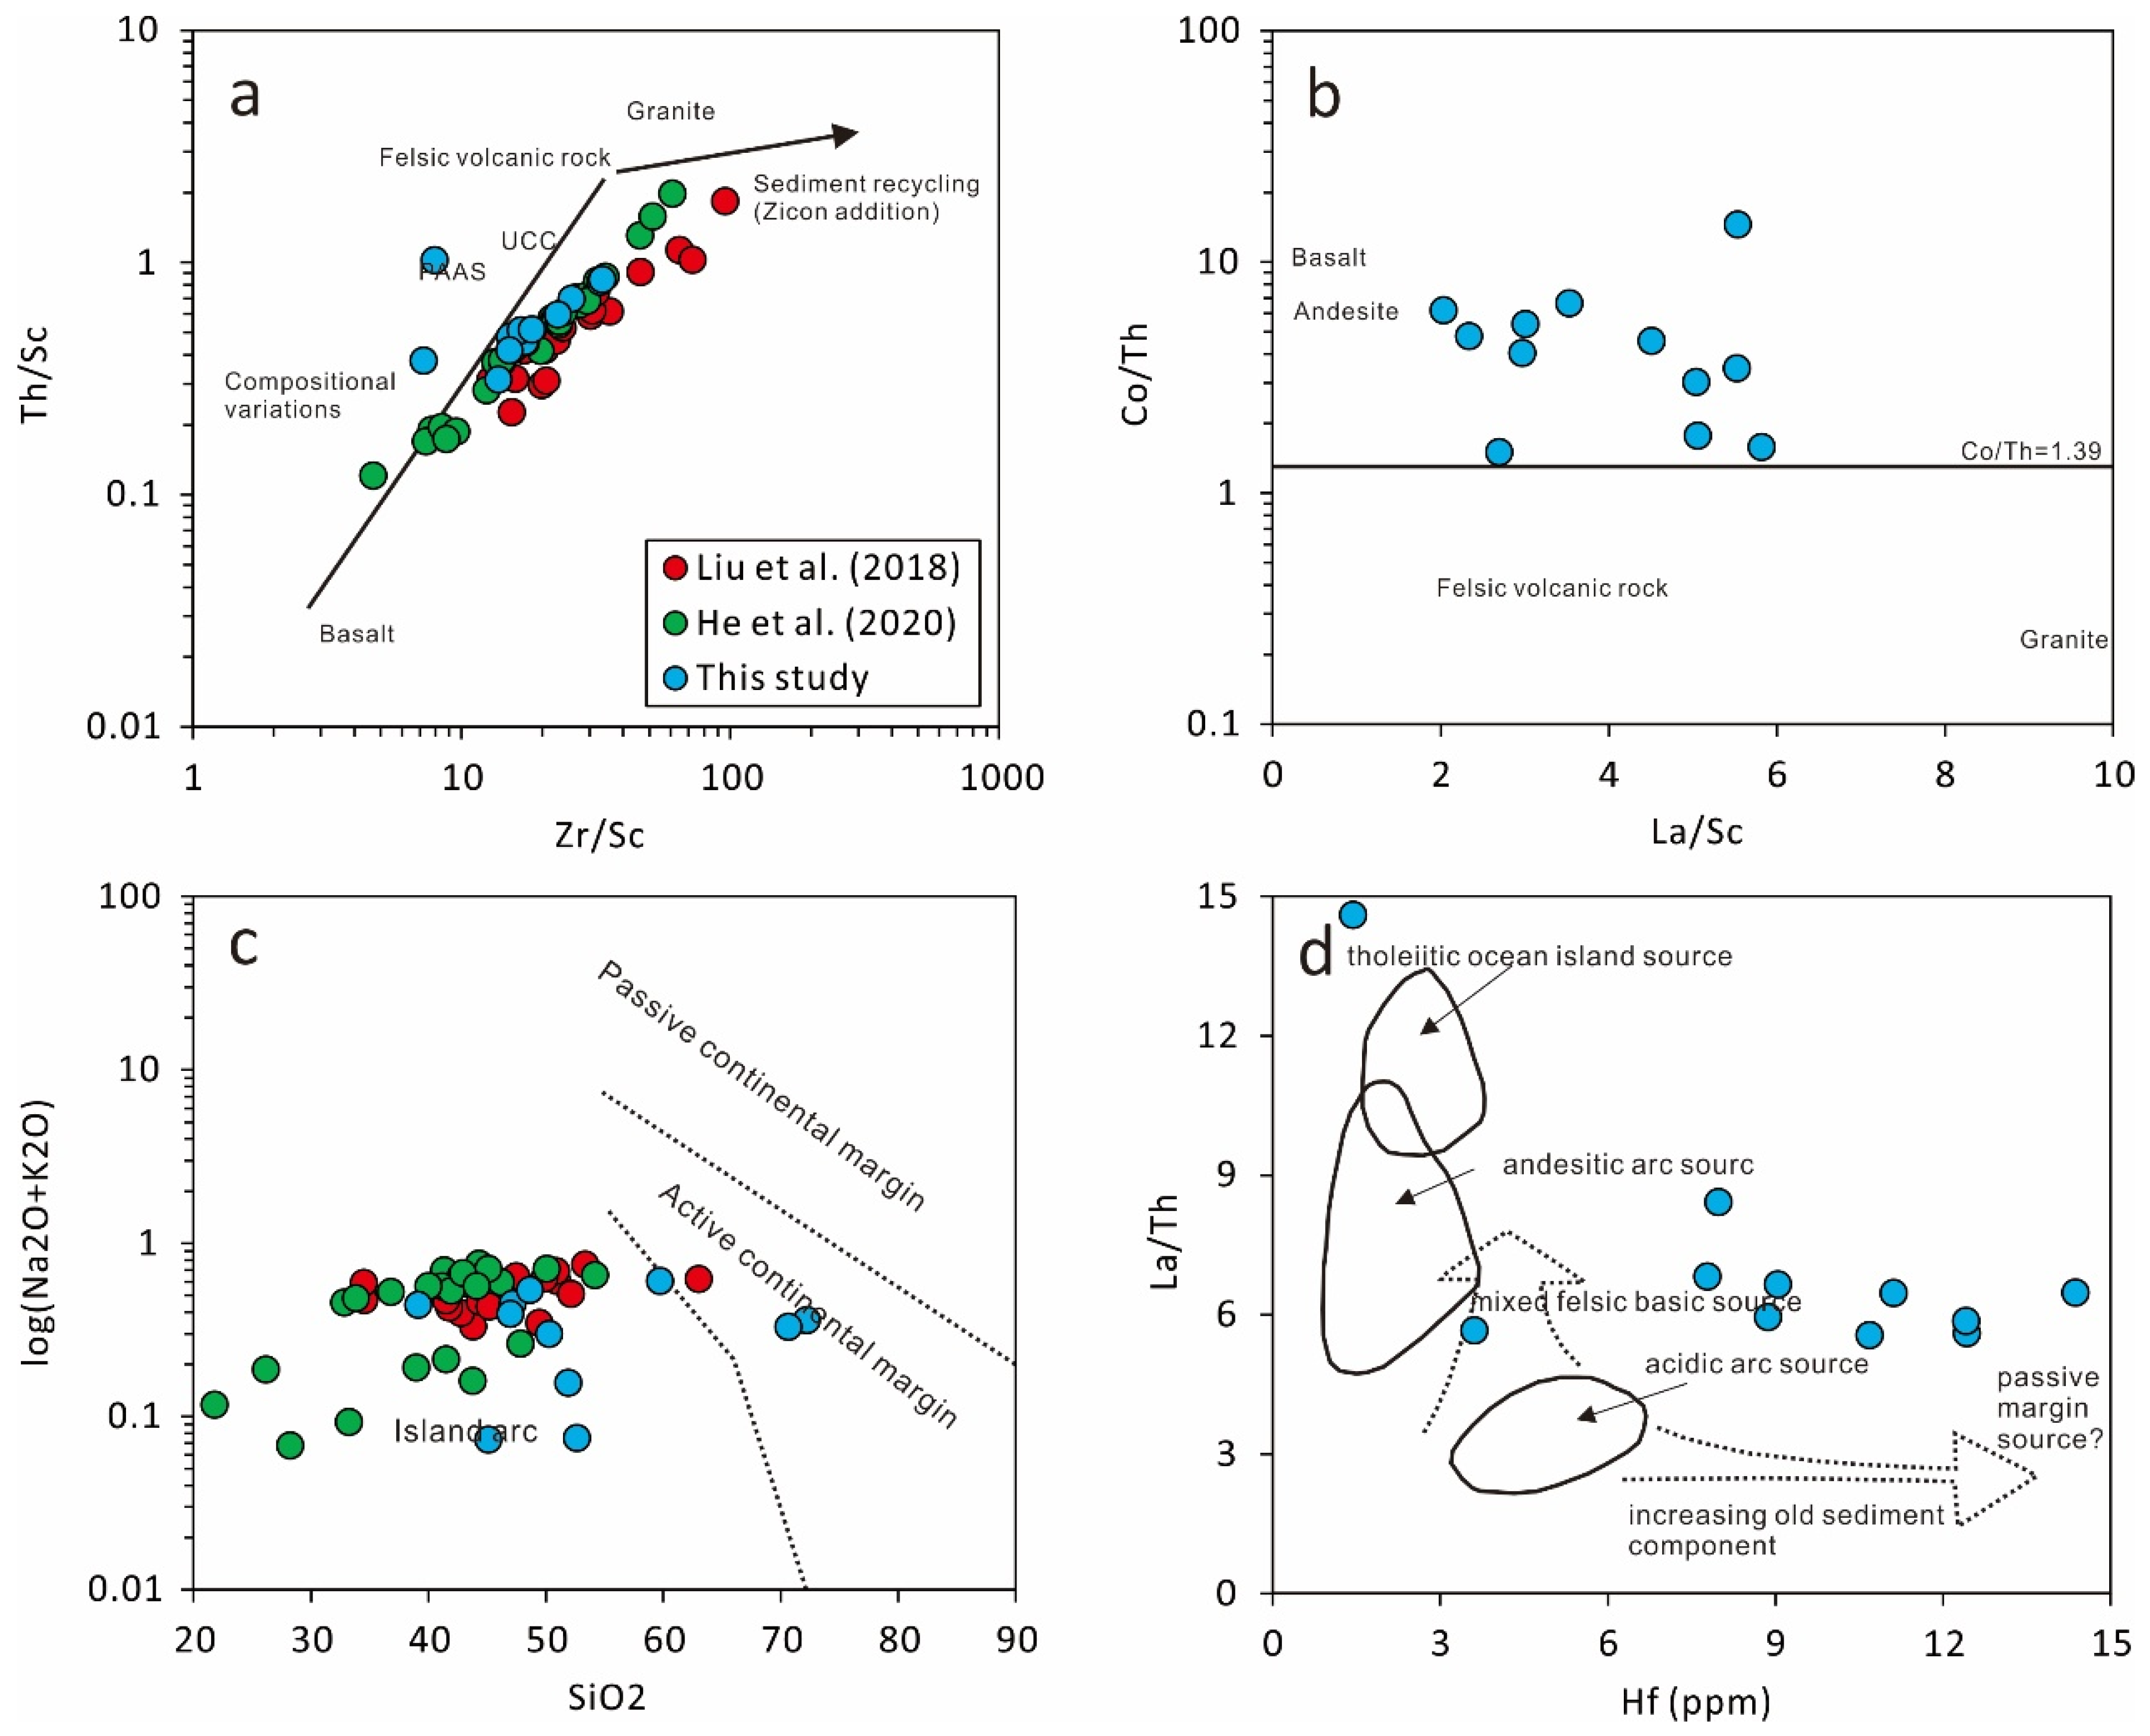
The ratios of Th/Sc and Zr/Sc were widely used to assess the sorting and recycling of sedimentary substances because Zr will be enriched given the stability of its host minerals (such as zircon), and Sc and Th are enriched in mafic and felsic rocks due to their little fractionation during the sedimentary cycle [27,28]. Figure 8a shows that the results in this study are comparable to those in Liu et al. (2018) [24] and He et al. (2020) [26], which suggests that this study, together with previous research, jointly revealed a consistent source of materials. However, it should be noted that moderate differences could also be observed between this study and the other two in which the larger ranges of both Th/Sc and Zr/Sc indicate a more complex provenance for the Longtan shale in Liu et al. (2018) [24] and He et al. (2020) [26]. Evidently, some of the samples in previous studies have larger values for Th/Sc and Zr/Sc, demonstrating that the Longtan shale in this study experienced less sedimentary cycles. It is likely that the samples in this study were derived from one location and one profile, while those in Liu et al. (2018) [24] and He et al. (2020) [26] were collected from multiple locations and profiles. The ratios of La/Sc and Co/Th have been used to interpret the source of parent rocks (Liu et al., 2020) [25]. The low-to-moderate ratios of La/Sc and moderate-to-high ratios of Co/Th suggest that the Longtan shale has a mixed source materials with relatively larger proportion of basalt and andesite (Figure 8b).
To comprehending the provenance of sediments, geochemical relationships, including lg(Na2O+K2O) vs. SiO2, La-Th-Sc, Th-Sc-Zr/10, Th-Co-Zr/10, and Ti/Zr vs. La/Sc, were plotted to reveal the source area [22,25]. Sediments formed in different tectonic settings have been proved to contain different elemental concentrations [25]. In Figure 8c, most of the data points in this study are distributed in the realm of island arc, and some of them are also scattered in the area of active continental margin. This observation indicates that source materials for the Longtan shale are a mixture that comes from different tectonic settings. The plot for La/Th against the concentration of Hf presents more scattering data points, which likely suggest a complex source of materials for the Longtan shale (Figure 8d).
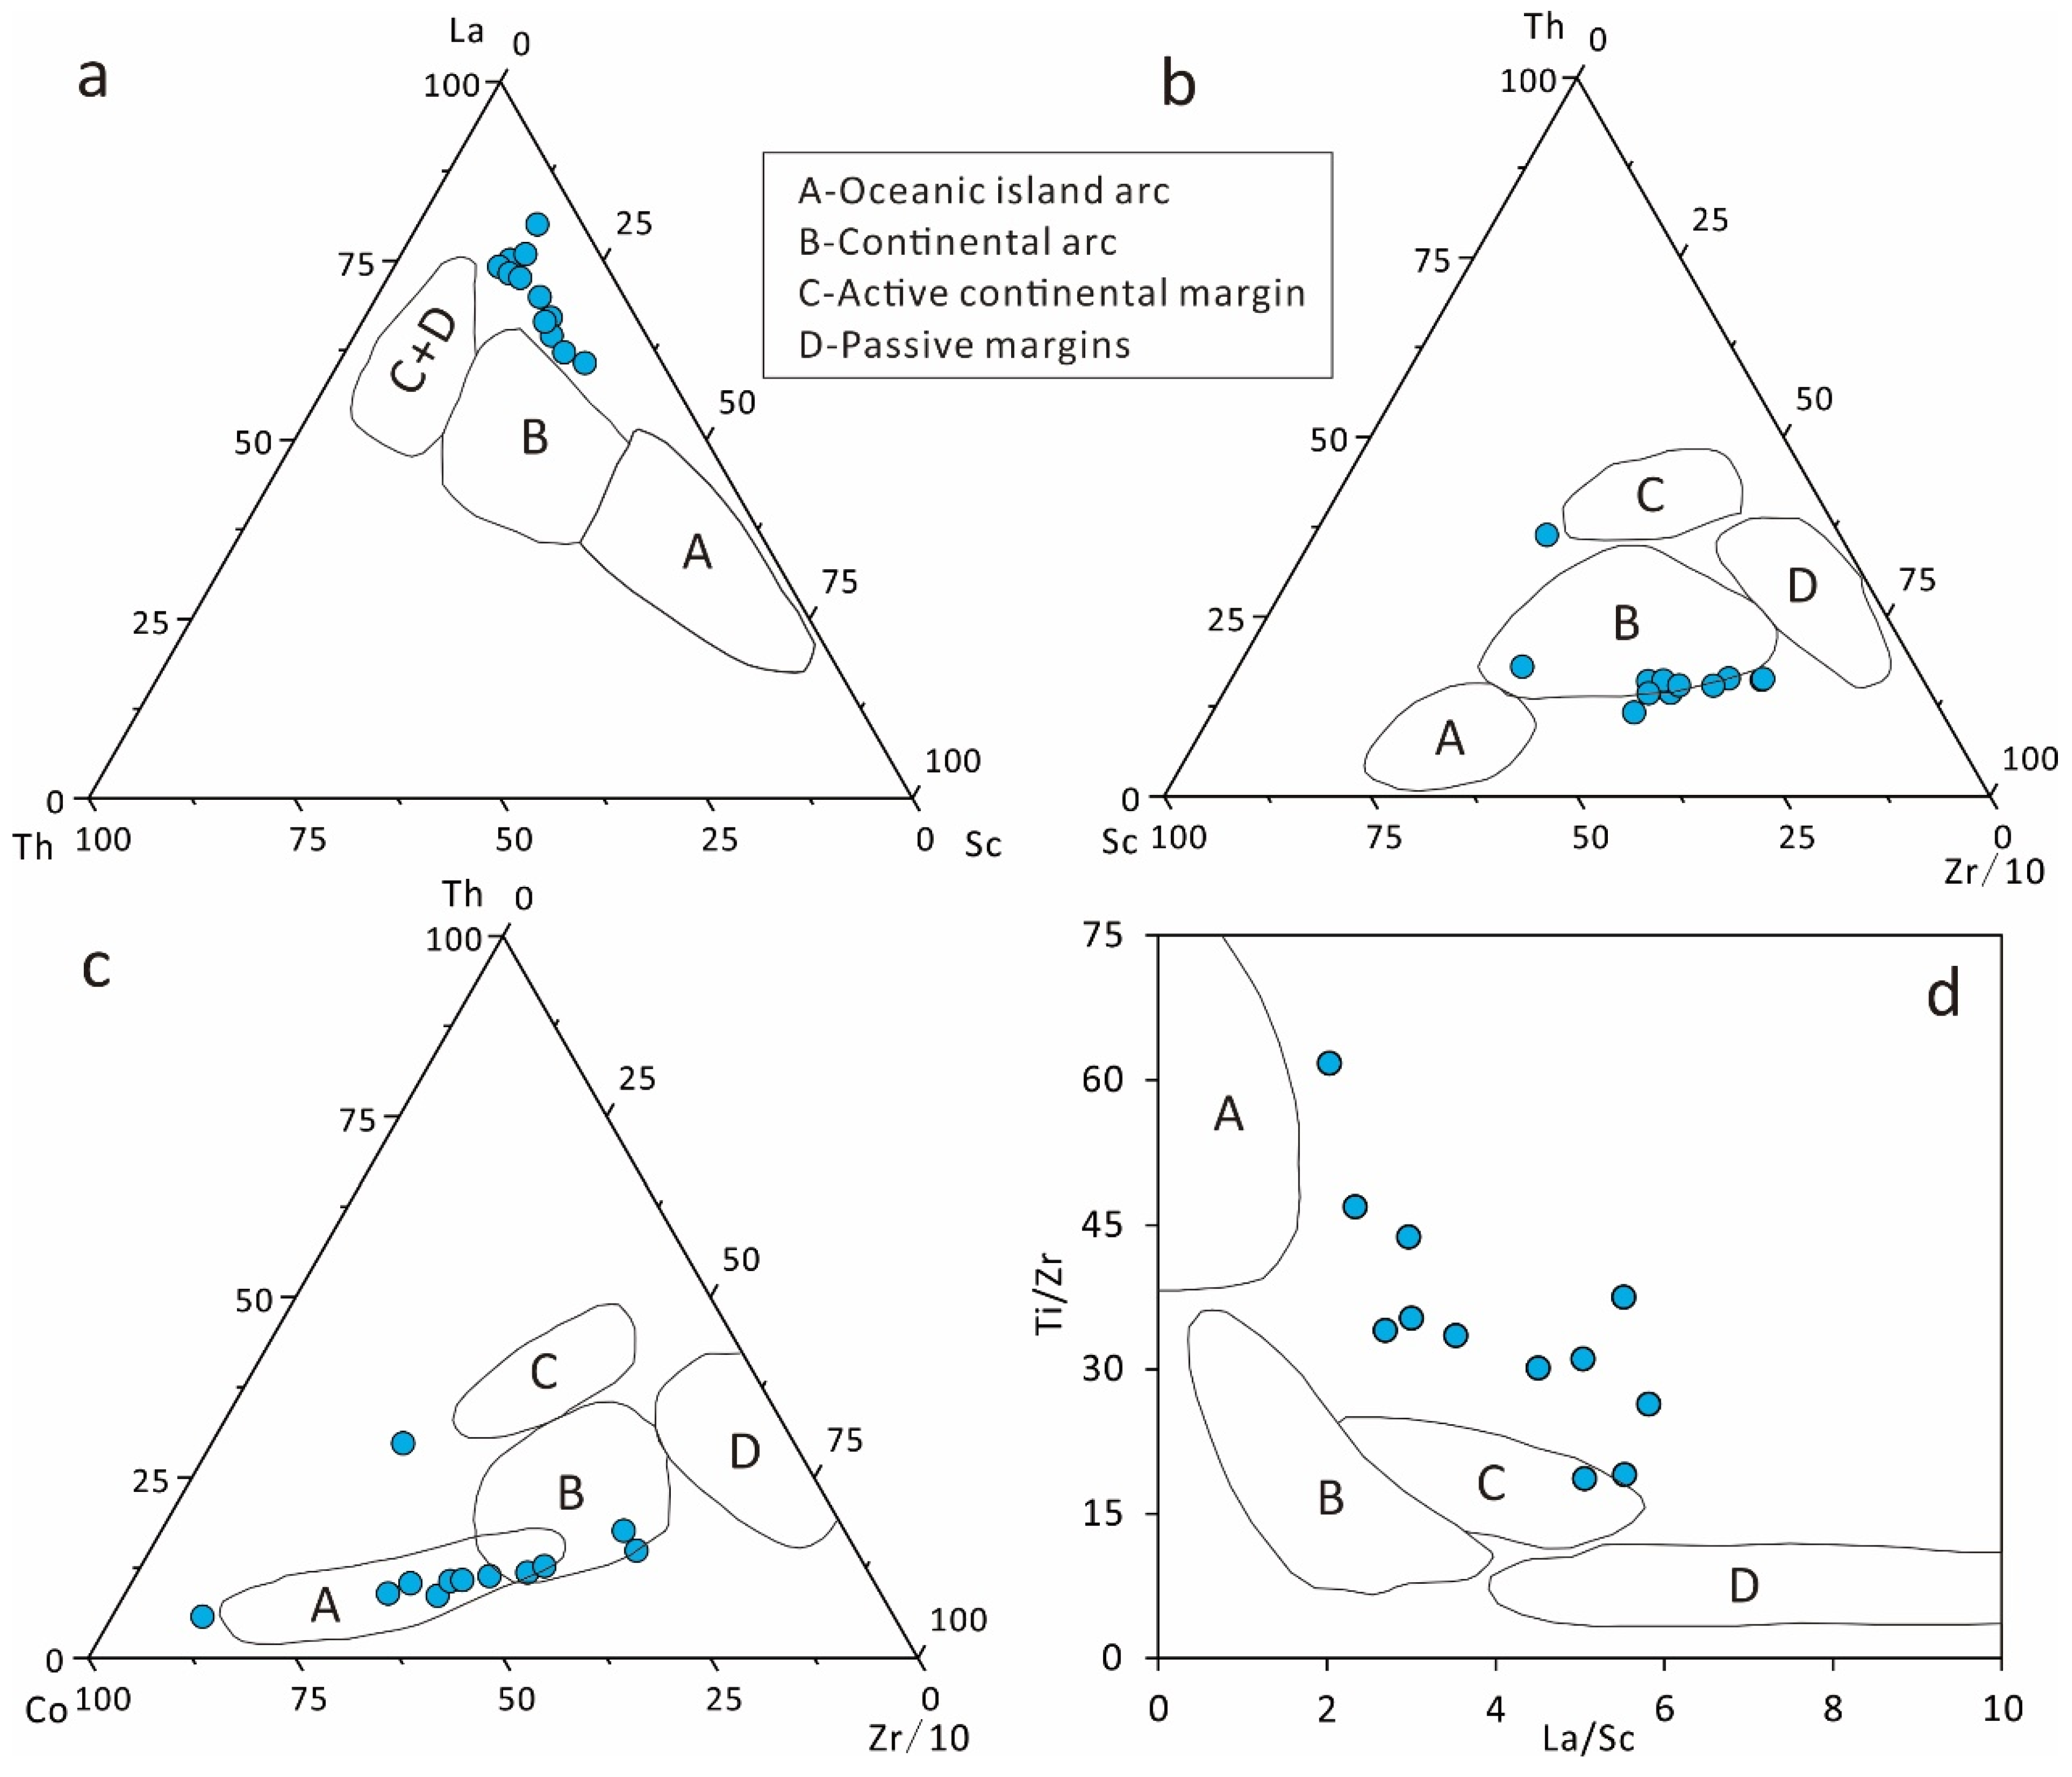
A mixed of source materials can also be revealed using the relations of La-Th-Sc, Th-Sc-Zr/10, Th-Co-Zr/10, and Ti/Zr vs. La/Sc (Figure 9). The realms of A, B, C, and D in Figure 9 represent oceanic island arc, continental arc, active continental margin, and passive margins, respectively. Based on the relations of La-Th-Sc, the Longtan shale formed in none of those tectonic settings. Nevertheless, signals on the sources from continental arc and also possibly from oceanic island arc were unraveled by using Th-Sc-Zr/10 and Th-Co-Zr/10 diagrams. Active continental margin was possible as well if the plot of Ti/Zr vs. La/Sc reflecting the realistic tectonic environments. Clearly, not all geochemical proxies offer identical information on the tectonic settings for the formation of the Longtan shale. However, a mixed source is possible as some of the parameters reflect the same settings. Additionally, passive margins seem to be impossible for the Longtan shale because none of these indices suggest that.

5.2. Paleoclimate and Paleosalinity

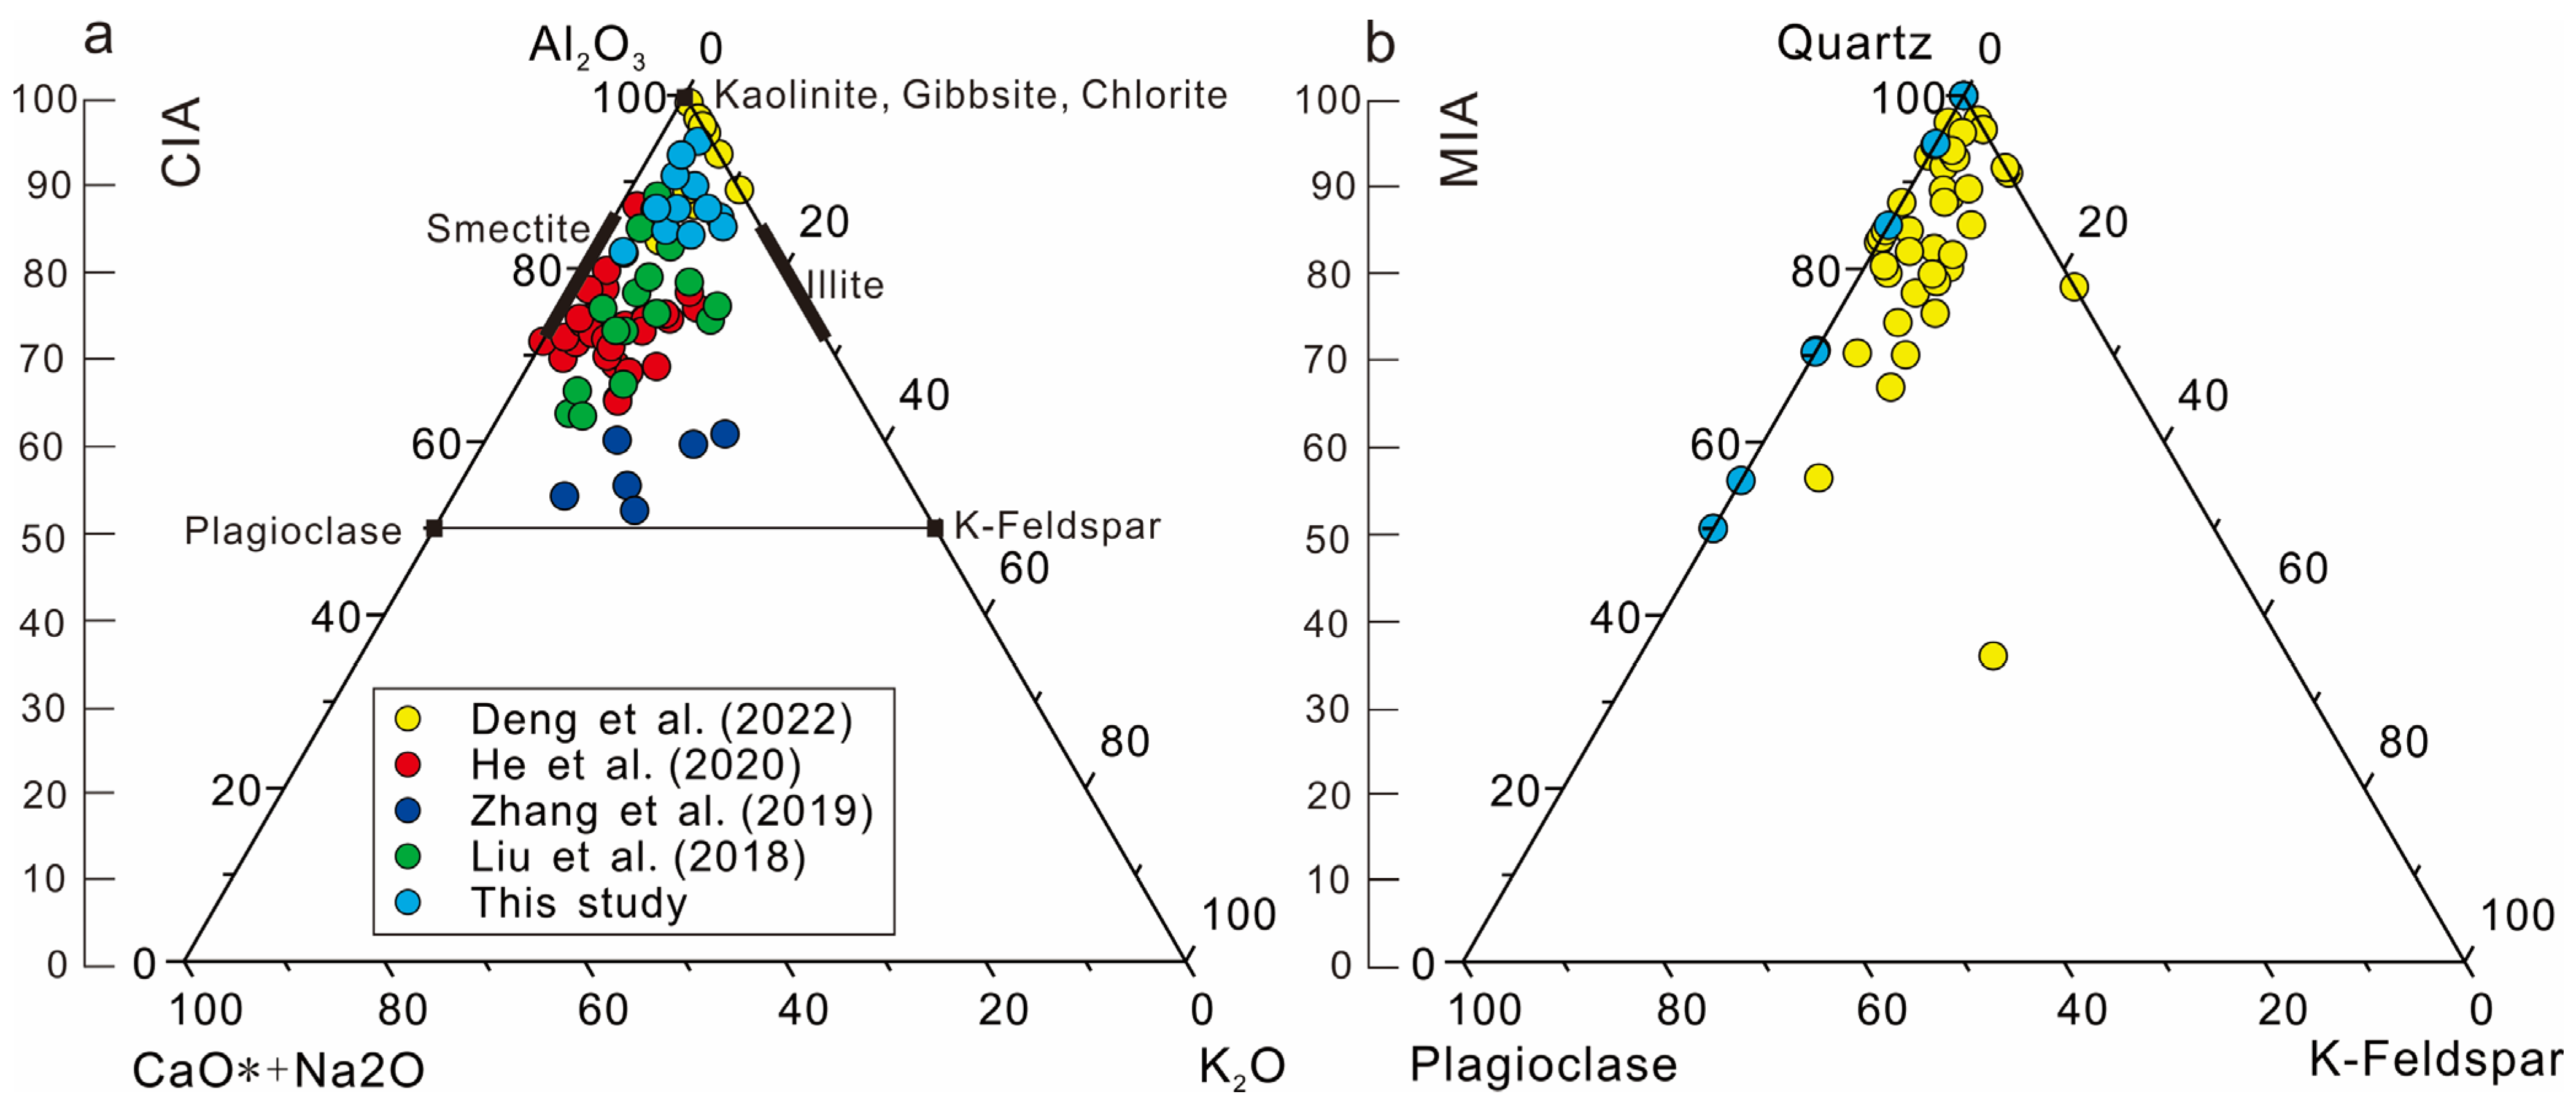
Paleoclimate plays a key role in governing the weathering intensity and consequently the terrestrial input for the formation of sedimentary rocks [29,30]. Chemical index of alteration (CIA) has been widely used as a parameter assessing the intensity of weathering of parent rocks during the deposition of organic-rich shales [14]. This index has been proposed by Nesbitt and Young (1982) [30] with the consideration of stability of different components in parent rocks during weathering. Normally, Al is less mobile than that of alkali metal elements such as Ca, Na, and K, and accordingly tend to be enriched in post-weathering rocks [31]. Therefore, the relative proportion of Al among Al, Ca, Na, and K can be used to indicate the degree of weathering. The CIA values in this study are mostly in the range between 80 and 90, suggesting an intensive weather during the deposition of the Longtan shale. Compared with the results of the Longtan shale samples from the Central Guizhou Uplift [4,24,26], the CIA values in this study are much larger (Figure 10a). While they are slightly smaller than those in Deng et al. (2022) [14], in which the Longtan shale samples were cored from the southeastern part of the sampling location in this study [10,14]. This observation probably suggested an increased degree of weathering from the northwest to the southeast of Guizhou Province in late Permian.
Apart from the chemical components, the mineralogical composition could also offer supplementary information on the weathering intensity. This is because some minerals, such as quartz, are more stable than others, e.g., feldspar, and consequently more likely enriched in the altered rocks [32]. Thus, the relatively proportion of quartz among quartz, plagioclase, and K-feldspar, later known as mineralogical index of alteration (MIA), has been developed to reflect the weathering intensity [32]. MIA has also been used by many researchers (such as Deng et al., 2022 [14]) although it is not as popular as the CIA, which is likely due to its relatively weak validity. For example, the MIA values in this study are in a similar range as those in Deng et al. (2022) [14], while the CIA values in those two studies are discernible. Anyhow, the overall larger MIA values in both studies indicate a general strong weathering during the periods of late Permian in the Guizhou Province (Figure 10b).
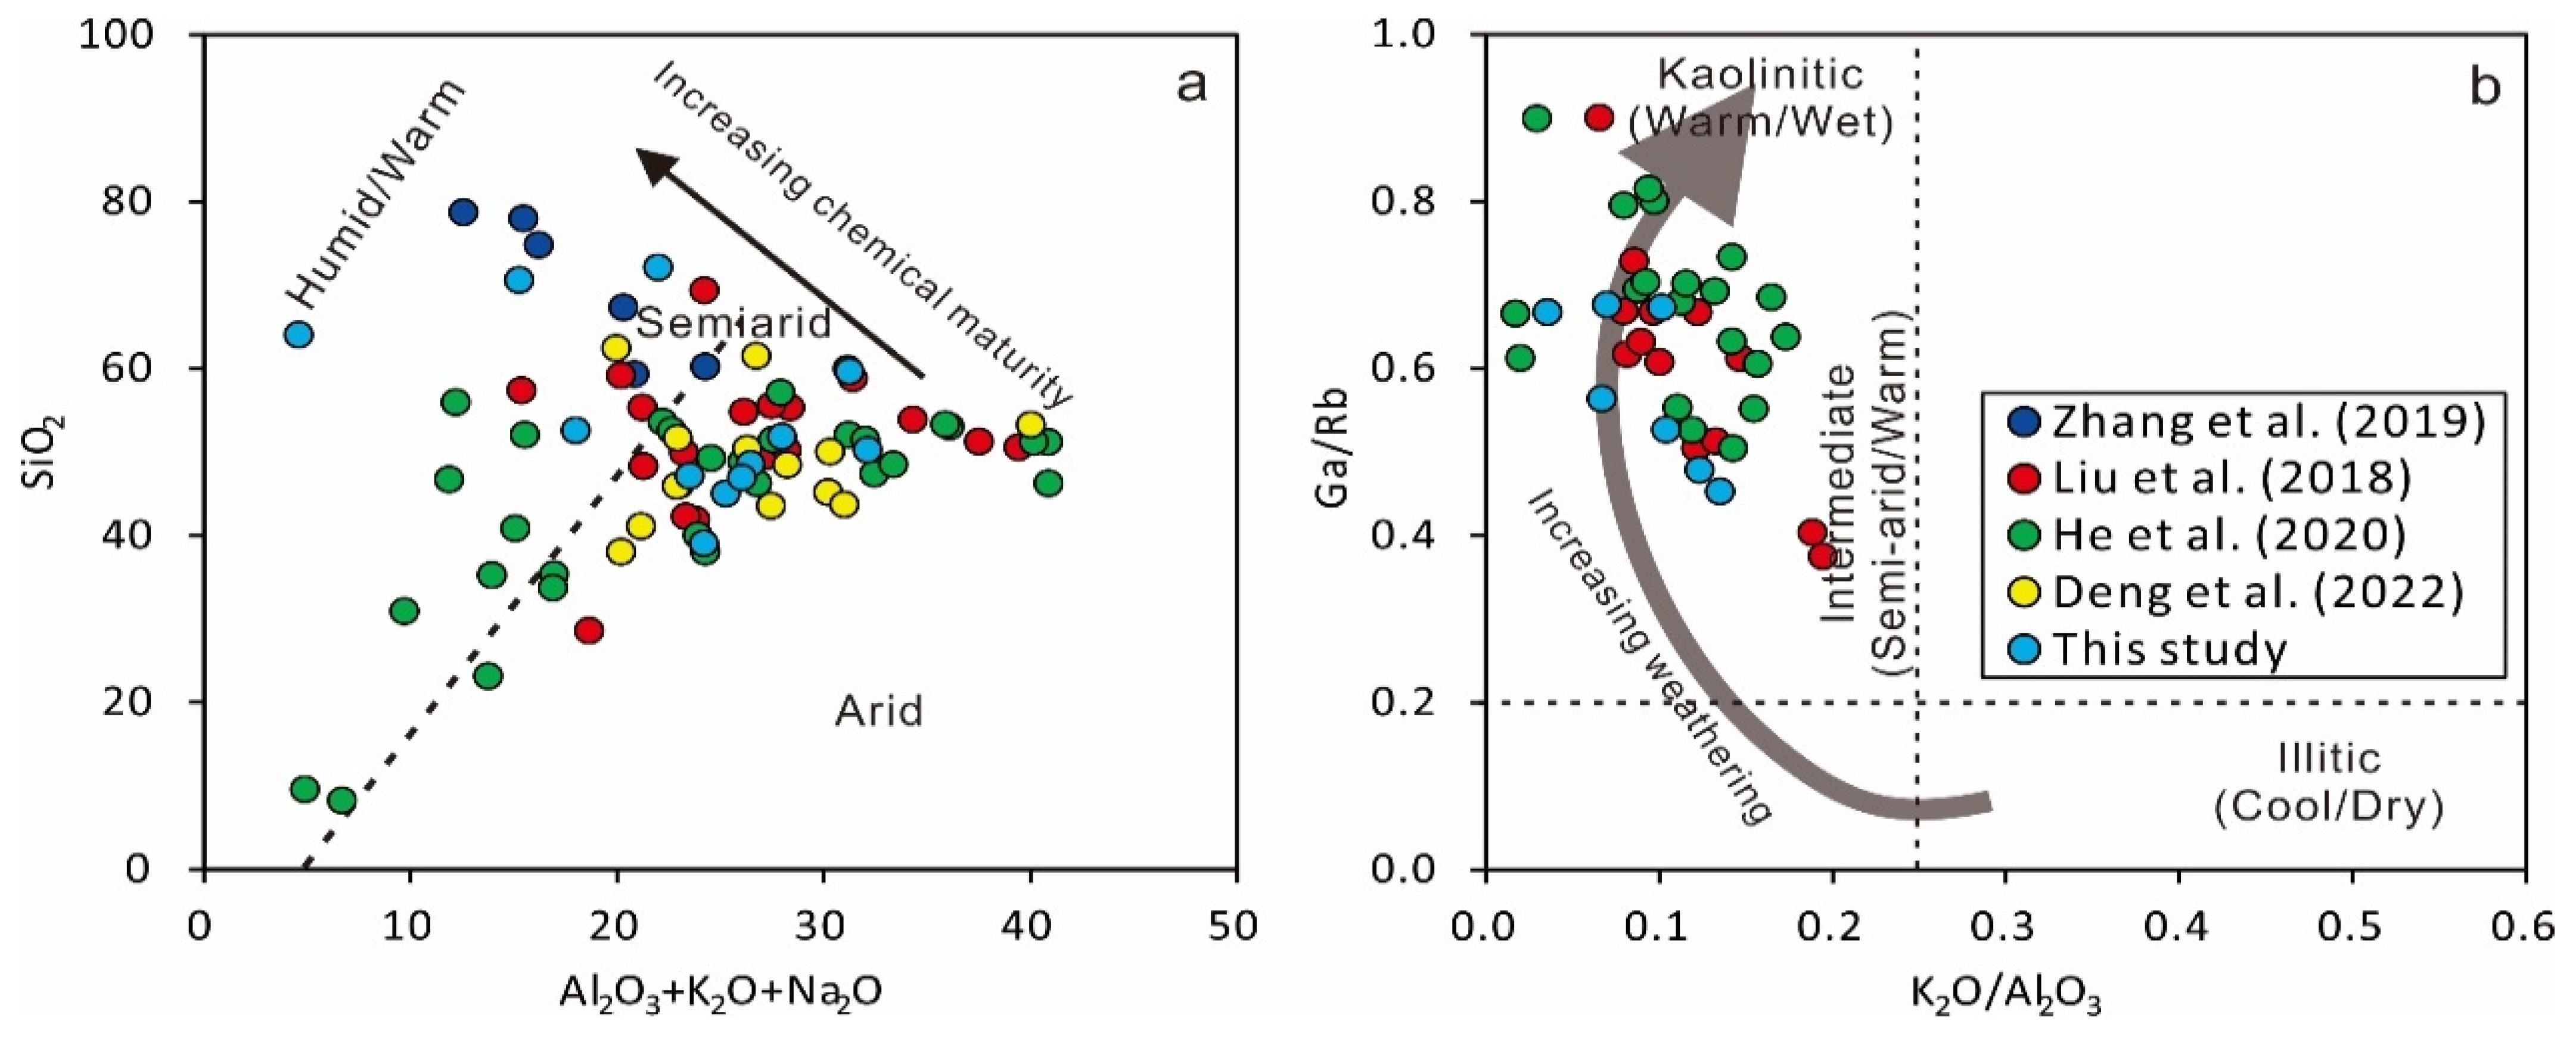
Paleoclimatic conditions can also be deduced from some correlations based on chemical composition, such as the relation between the amount of SiO2 and the sum of Al2O3, K2O, and Na2O [33]. This relationship has been widely used and proved valid for interpreting paleoclimate [29,34,35]. Our results suggest that a semi-arid to humid/warm climatic condition was revealed during the period of Longtan shale deposition (Figure 11). This point has been verified using the relation between K2O/Al2O3 and Ga/Rb, which is also a widely accepted useful tool for paleoclimate reconstruction.
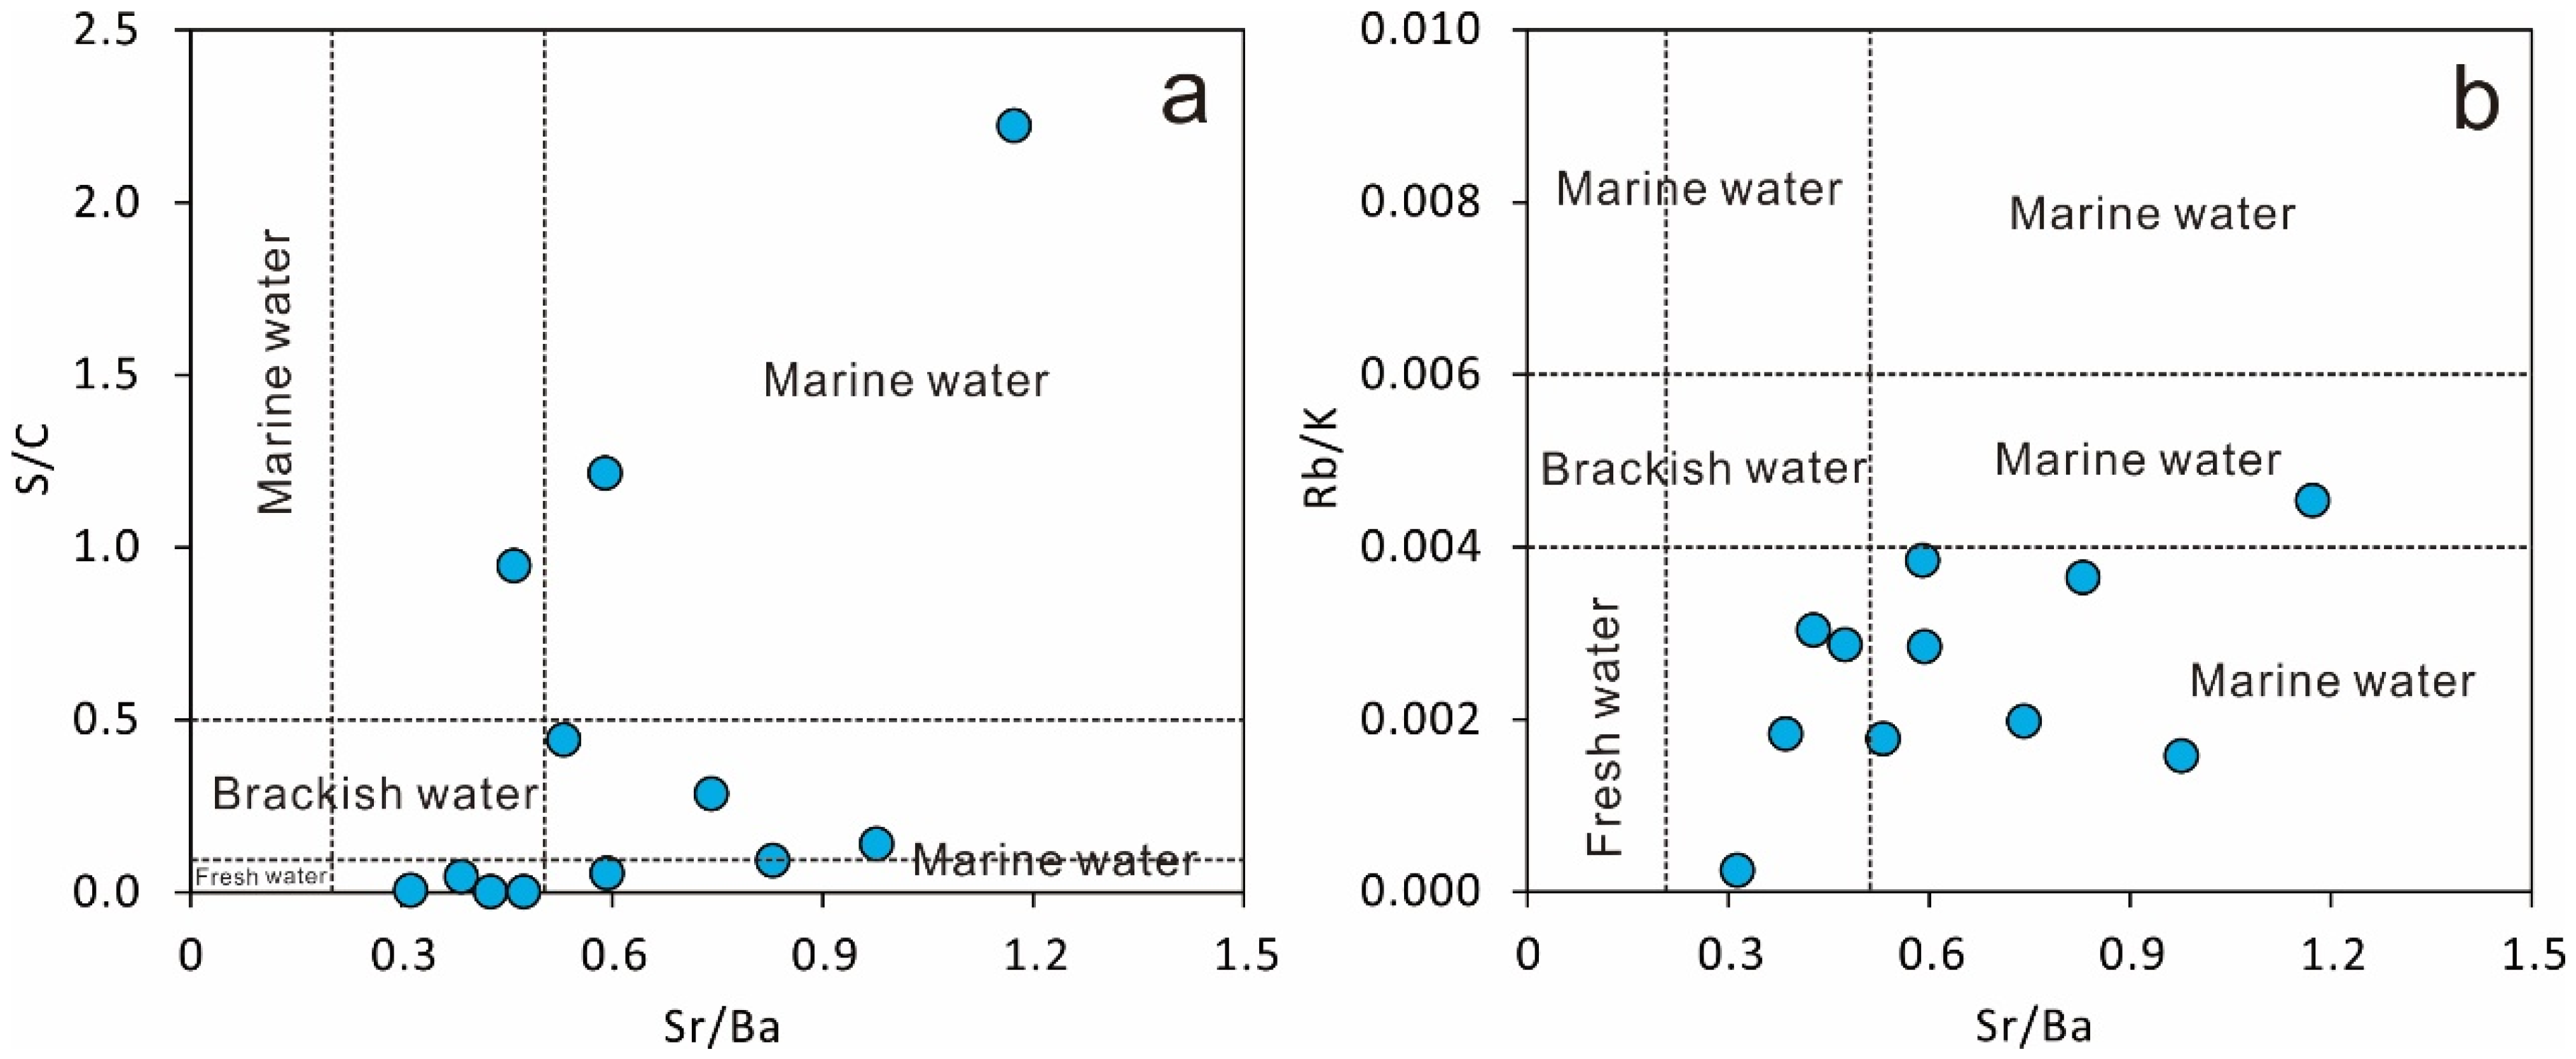
Paleosalinity has several aspects of influence on organic-rich shale formation. For example, salinity affects the living conditions for organisms, which contribute to the organic matter enrichment in shale [29]; in addition, salinity-resulting stratification of a water body also impacts the redox conditions [36]. Several geochemical proxies could be used to assess the paleosalinity conditions during the deposition of sedimentary rocks, such as B/Ga, Sr/Ba and S/C [36], and Rb/K [37], among which Sr/Ba, S/C, and Rb/K were analyzed in this study. Sr, Ba, and Rb were directly picked up for use and K was calculated based on the relative percentage of K2O. Additionally, S and C were collected from Zhang et al. (2025) [10] for the same set of samples. The values of Sr/Ba < 0.2, 0.2~0.5, and >0.5 are indicative of freshwater, brackish, and marine salinities, correspondingly [36]. The numbers of S/C < 0.1, 0.1~0.5, and >0.5 suggest a freshwater, brackish, and marine water environment [36]. The ratios of Rb/K ≤ 0.004, 0.004 ≤ 0.006, and >0.006 indicate freshwater, fresh-to-brackish water, and fully marine water conditions, respectively [37]. The results suggest that the Longtan shale was deposited in a brackish-to-marine water environment (Figure 12), which is consistent with the interpretation of a shallow marine environment affected by fresh water. A paralic depositional environment can probably be revealed for the Longtan shale.

5.3. Redox Conditions

Redox conditions during the deposition of sedimentary rocks play a key role in organic matter preservation [5]. The redox condition can be assessed by various methods, including mainly petrographic and geochemical analysis. Based on petrographic analysis, the macroscopic features, such as colors, could be used as a qualitative indicator for the redox condition [10]. In contrast, geochemical approaches, such as biomarkers derived from the predecessor of organic matter and other inorganic geochemical proxies, are more widely applied to reveal the redox condition [38,39]. In this study, petrography and inorganic geochemistry were adopted and the results were compared with those derived from organic geochemical analysis in former works.
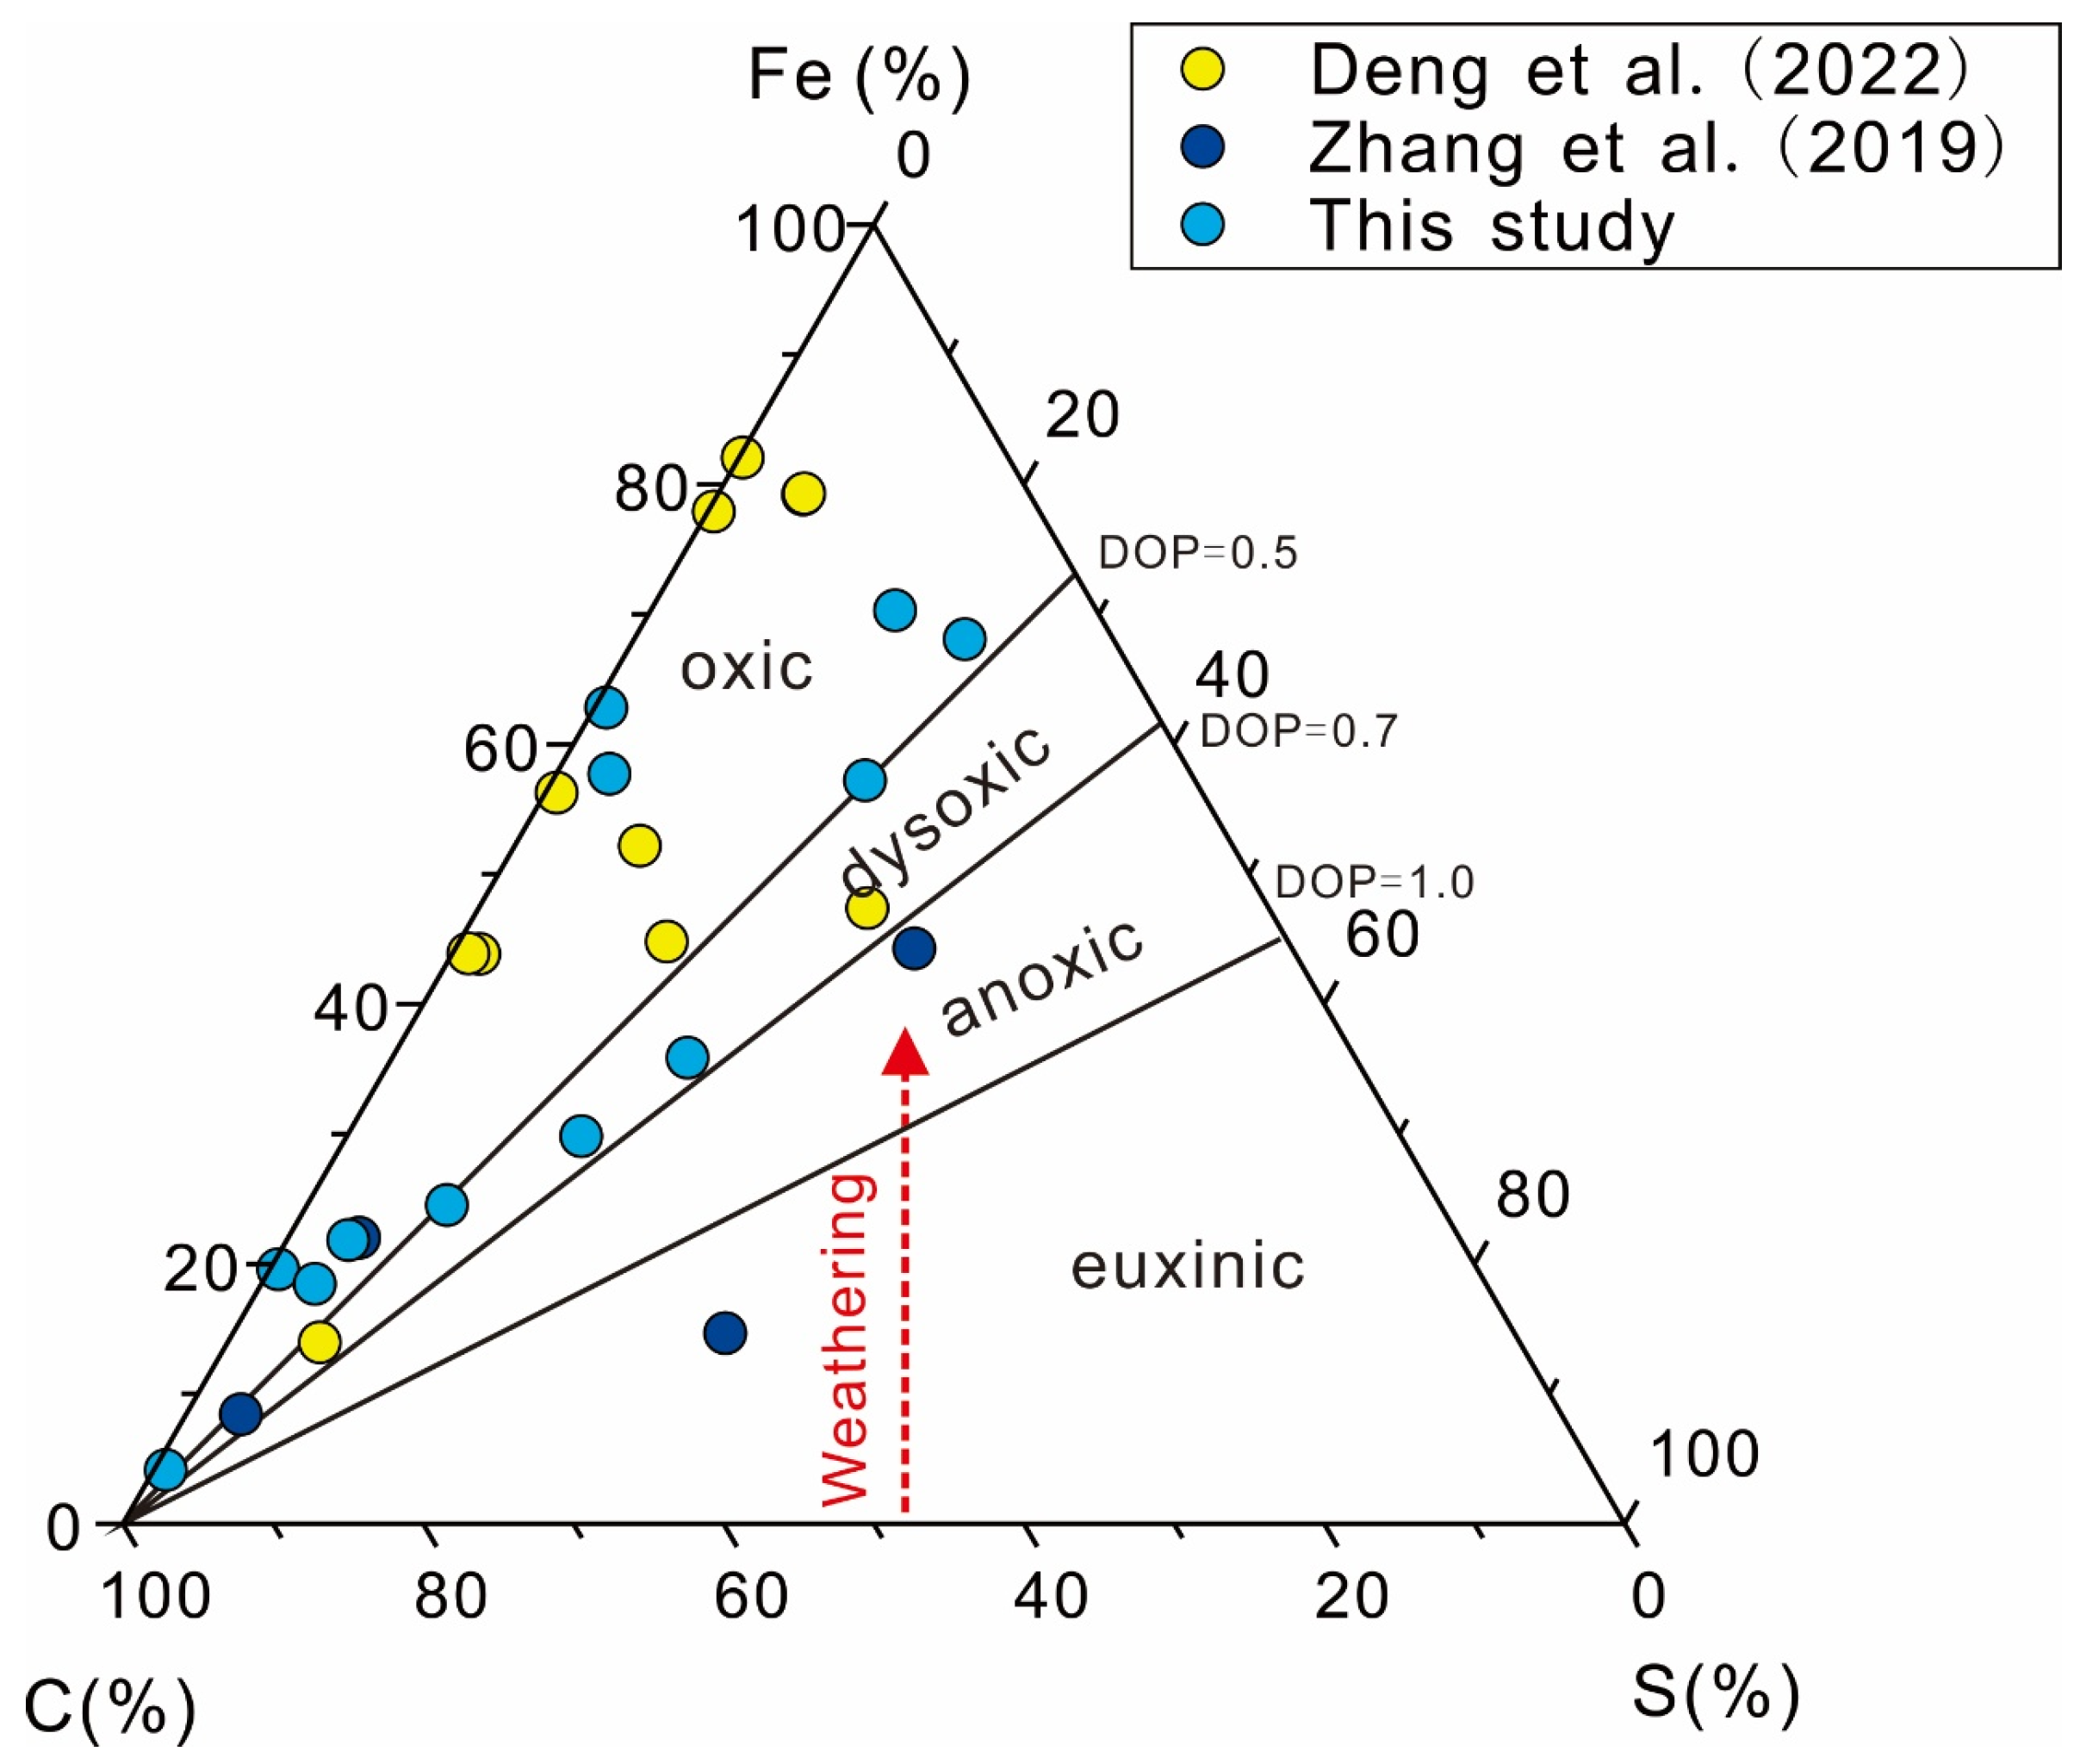
An overall oxic-to-dysoxic environment is confirmed for the Longtan shale during its deposition based on the major and trace elemental composition. The ternary diagram of C-S-Fe has been widely used to discriminate the degree of redox condition [40]. In Figure 13, the data points in this study are all distributed in the oxic and dysoxic realms, which clearly suggests an oxic-to-dysoxic depositional environment. This is in line with Deng et al. (2022) [14] but slightly different from Zhang et al. (2019) [4], where a dysoxic-to-euxinic environment was unraveled for the Longtan shale. This can be ascribed to the different locations of sampling; the samples in this study were cored from the Southwestern Guizhou Depression, where the samples in Deng et al. (2022) [14] were also from. However, the Longtan shale samples in Zhang et al. (2019) [4] were drilled in the Central Guizhou Uplift.
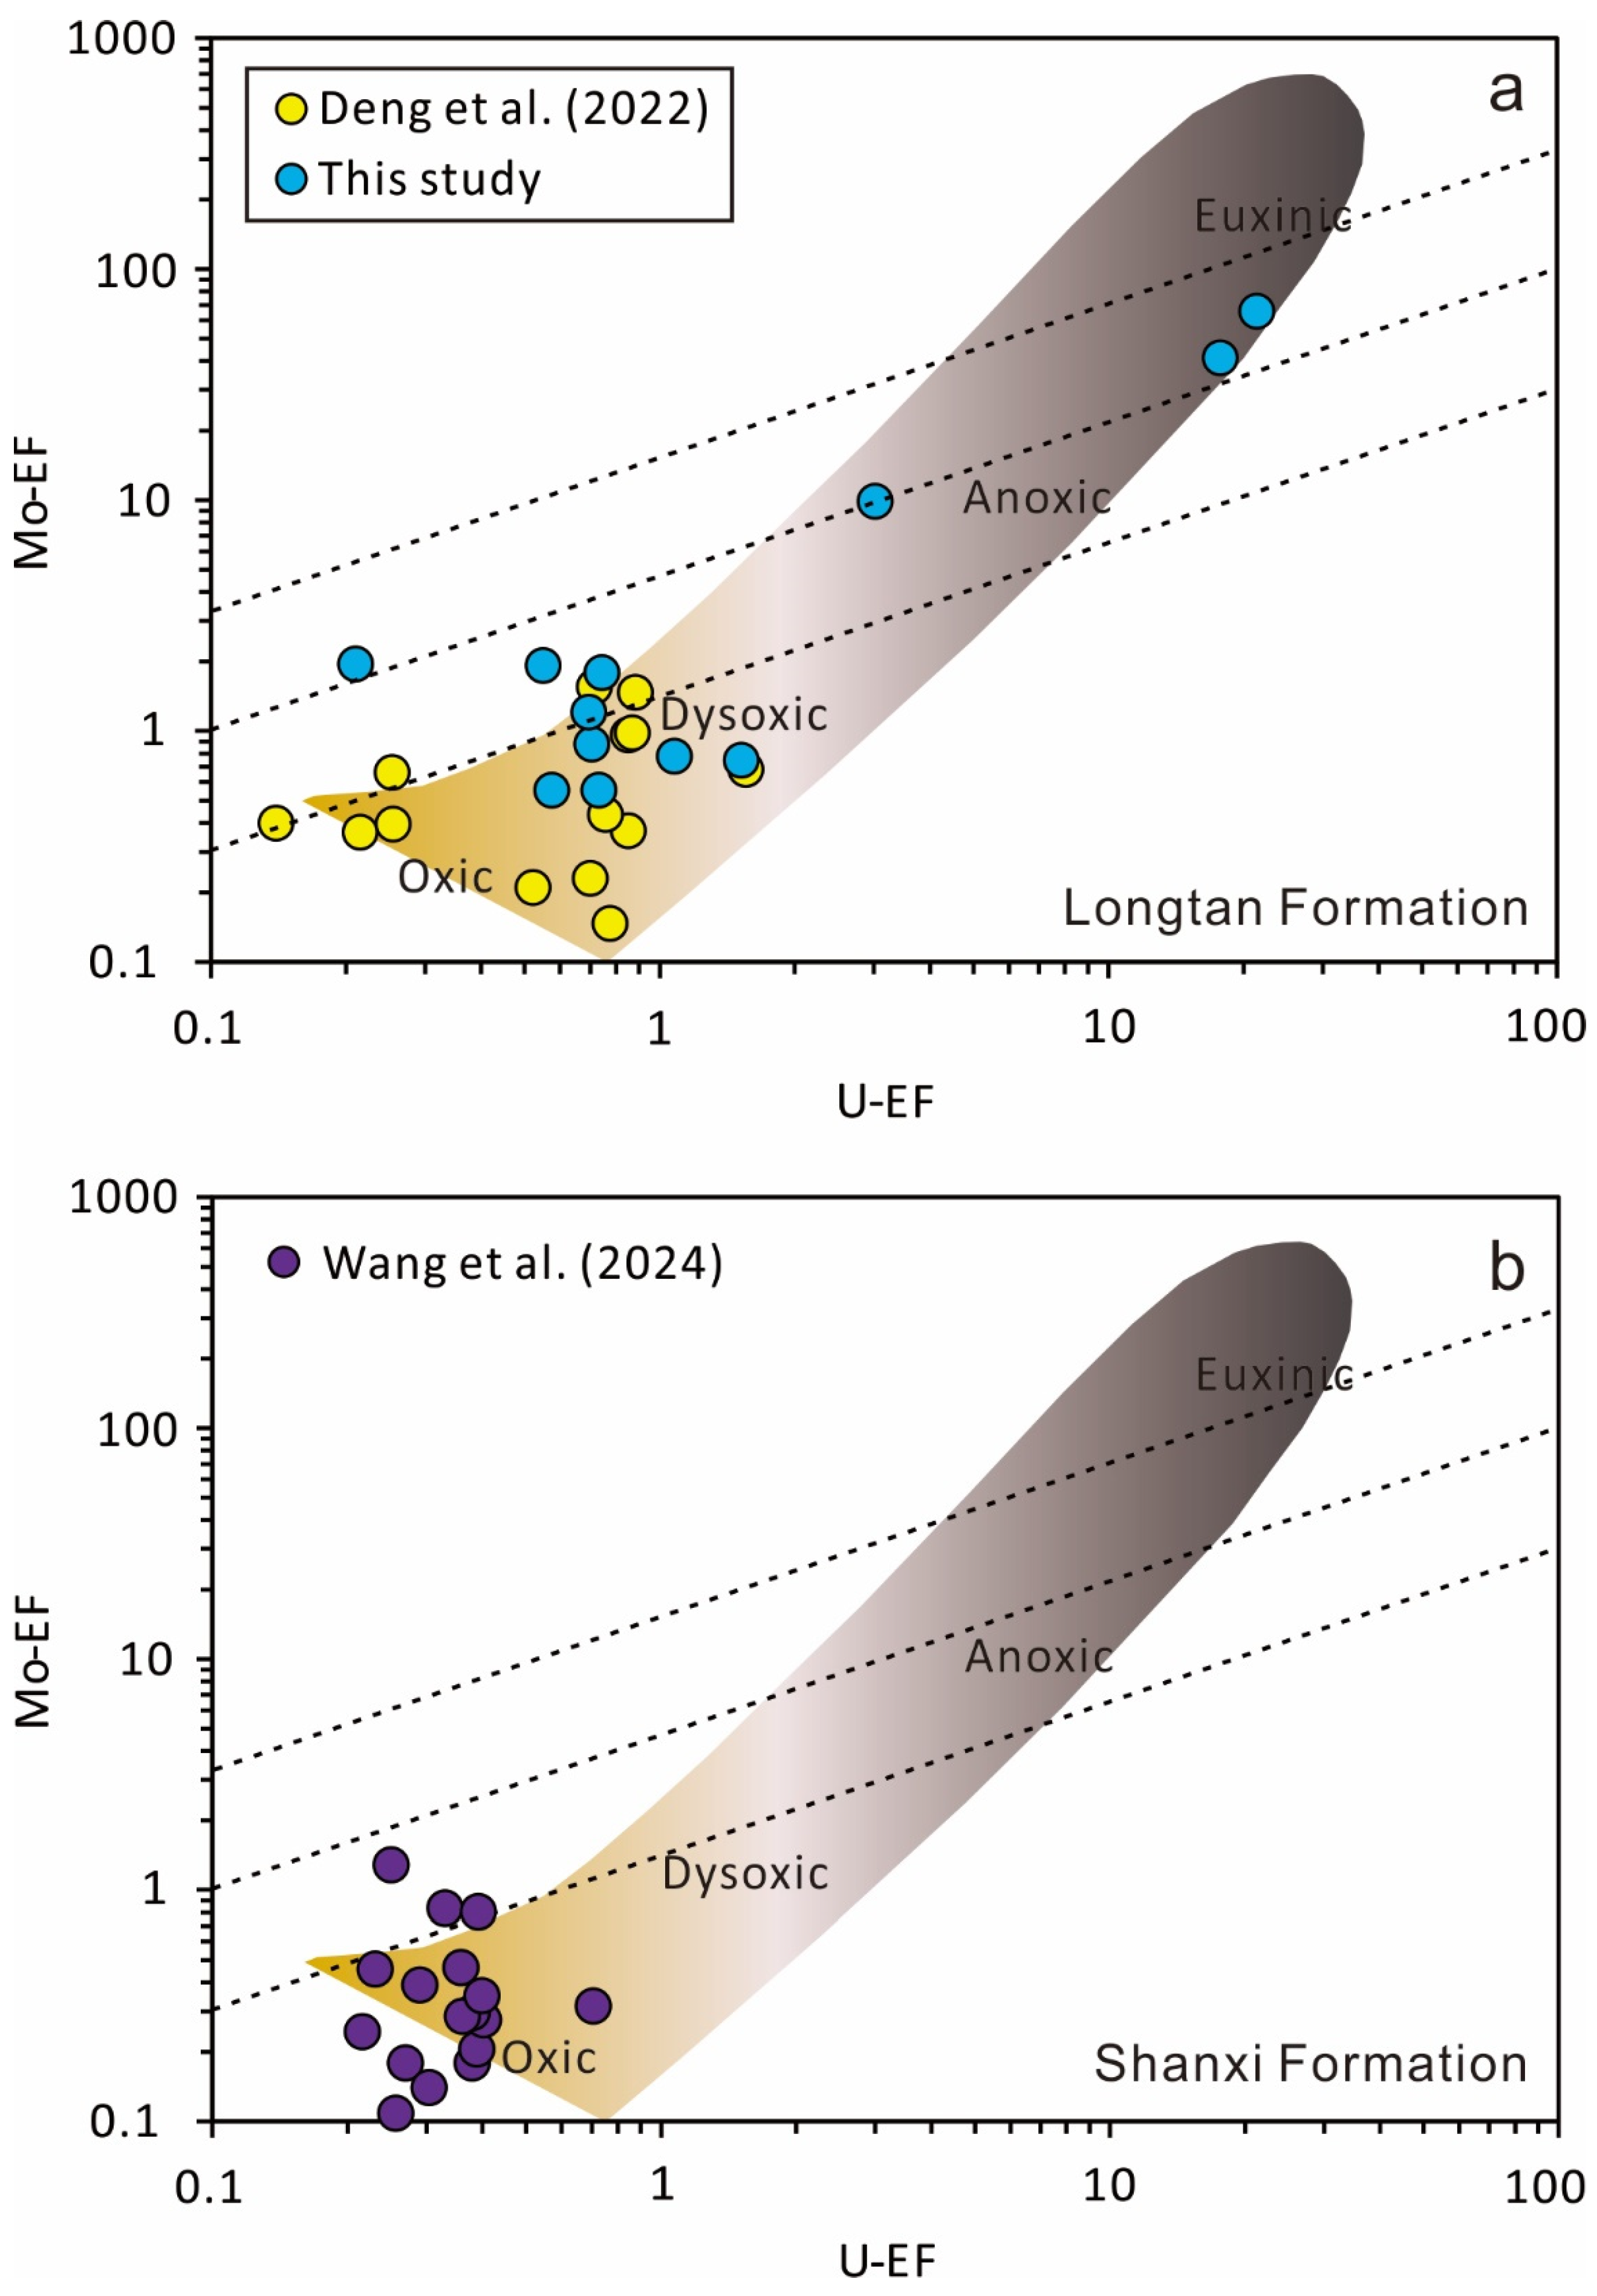
Trace elements are widely used to decipher the depositional environment, for example, Co/Ni, V/Cr, U/Th, and V/(V + Ni) have been routinely used to interpret the redox condition of sedimentary rocks [29]. Based on the ratios of Co/Ni and Cr/V, most of the data are distributed in the oxic region (Figure 14a,b). However, the same set of samples suggest a dysoxic condition based on the ratios of V/Cr, U/Th, and V/(V + Ni) (Figure 14c,d). It is not surprising that different parameters revealed different depositional conditions. It is noteworthy that the results in this study are in accordance with those in other publications for the same rock formation (Figure 14), which suggests that the data in this study are valid. Therefore, the reconstruction of depositional system for any sedimentary rock should not be based on a single proxy. Multiple indices are helpful when some of the parameters are invalid. To further confirm the redox condition, the enrichment factors of U and Mo were adopted, which have been proved to be robust evidence for reconstructing the redox condition [41,42]. The results indicate that the Longtan shale was deposited in a transitional, oxic-to-dysoxic, environment (Figure 15a). This interpretation is highly consistent with the C-Se-Fe correlation and partly in line with the trace elemental ratios. In addition, another coal-bearing shale, Shanxi Formation, deposited in the north part of Chian and also in the late Permian, was compared with this study. In Figure 15b, the Shanxi Formation was also deposited in the mixed zone from oxic-to-dysoxic conditions. In summary, an overall oxic-to-dysoxic environment is reconstructed for the Longtan shale in the southwestern Guizhou Province during the late Permian period.
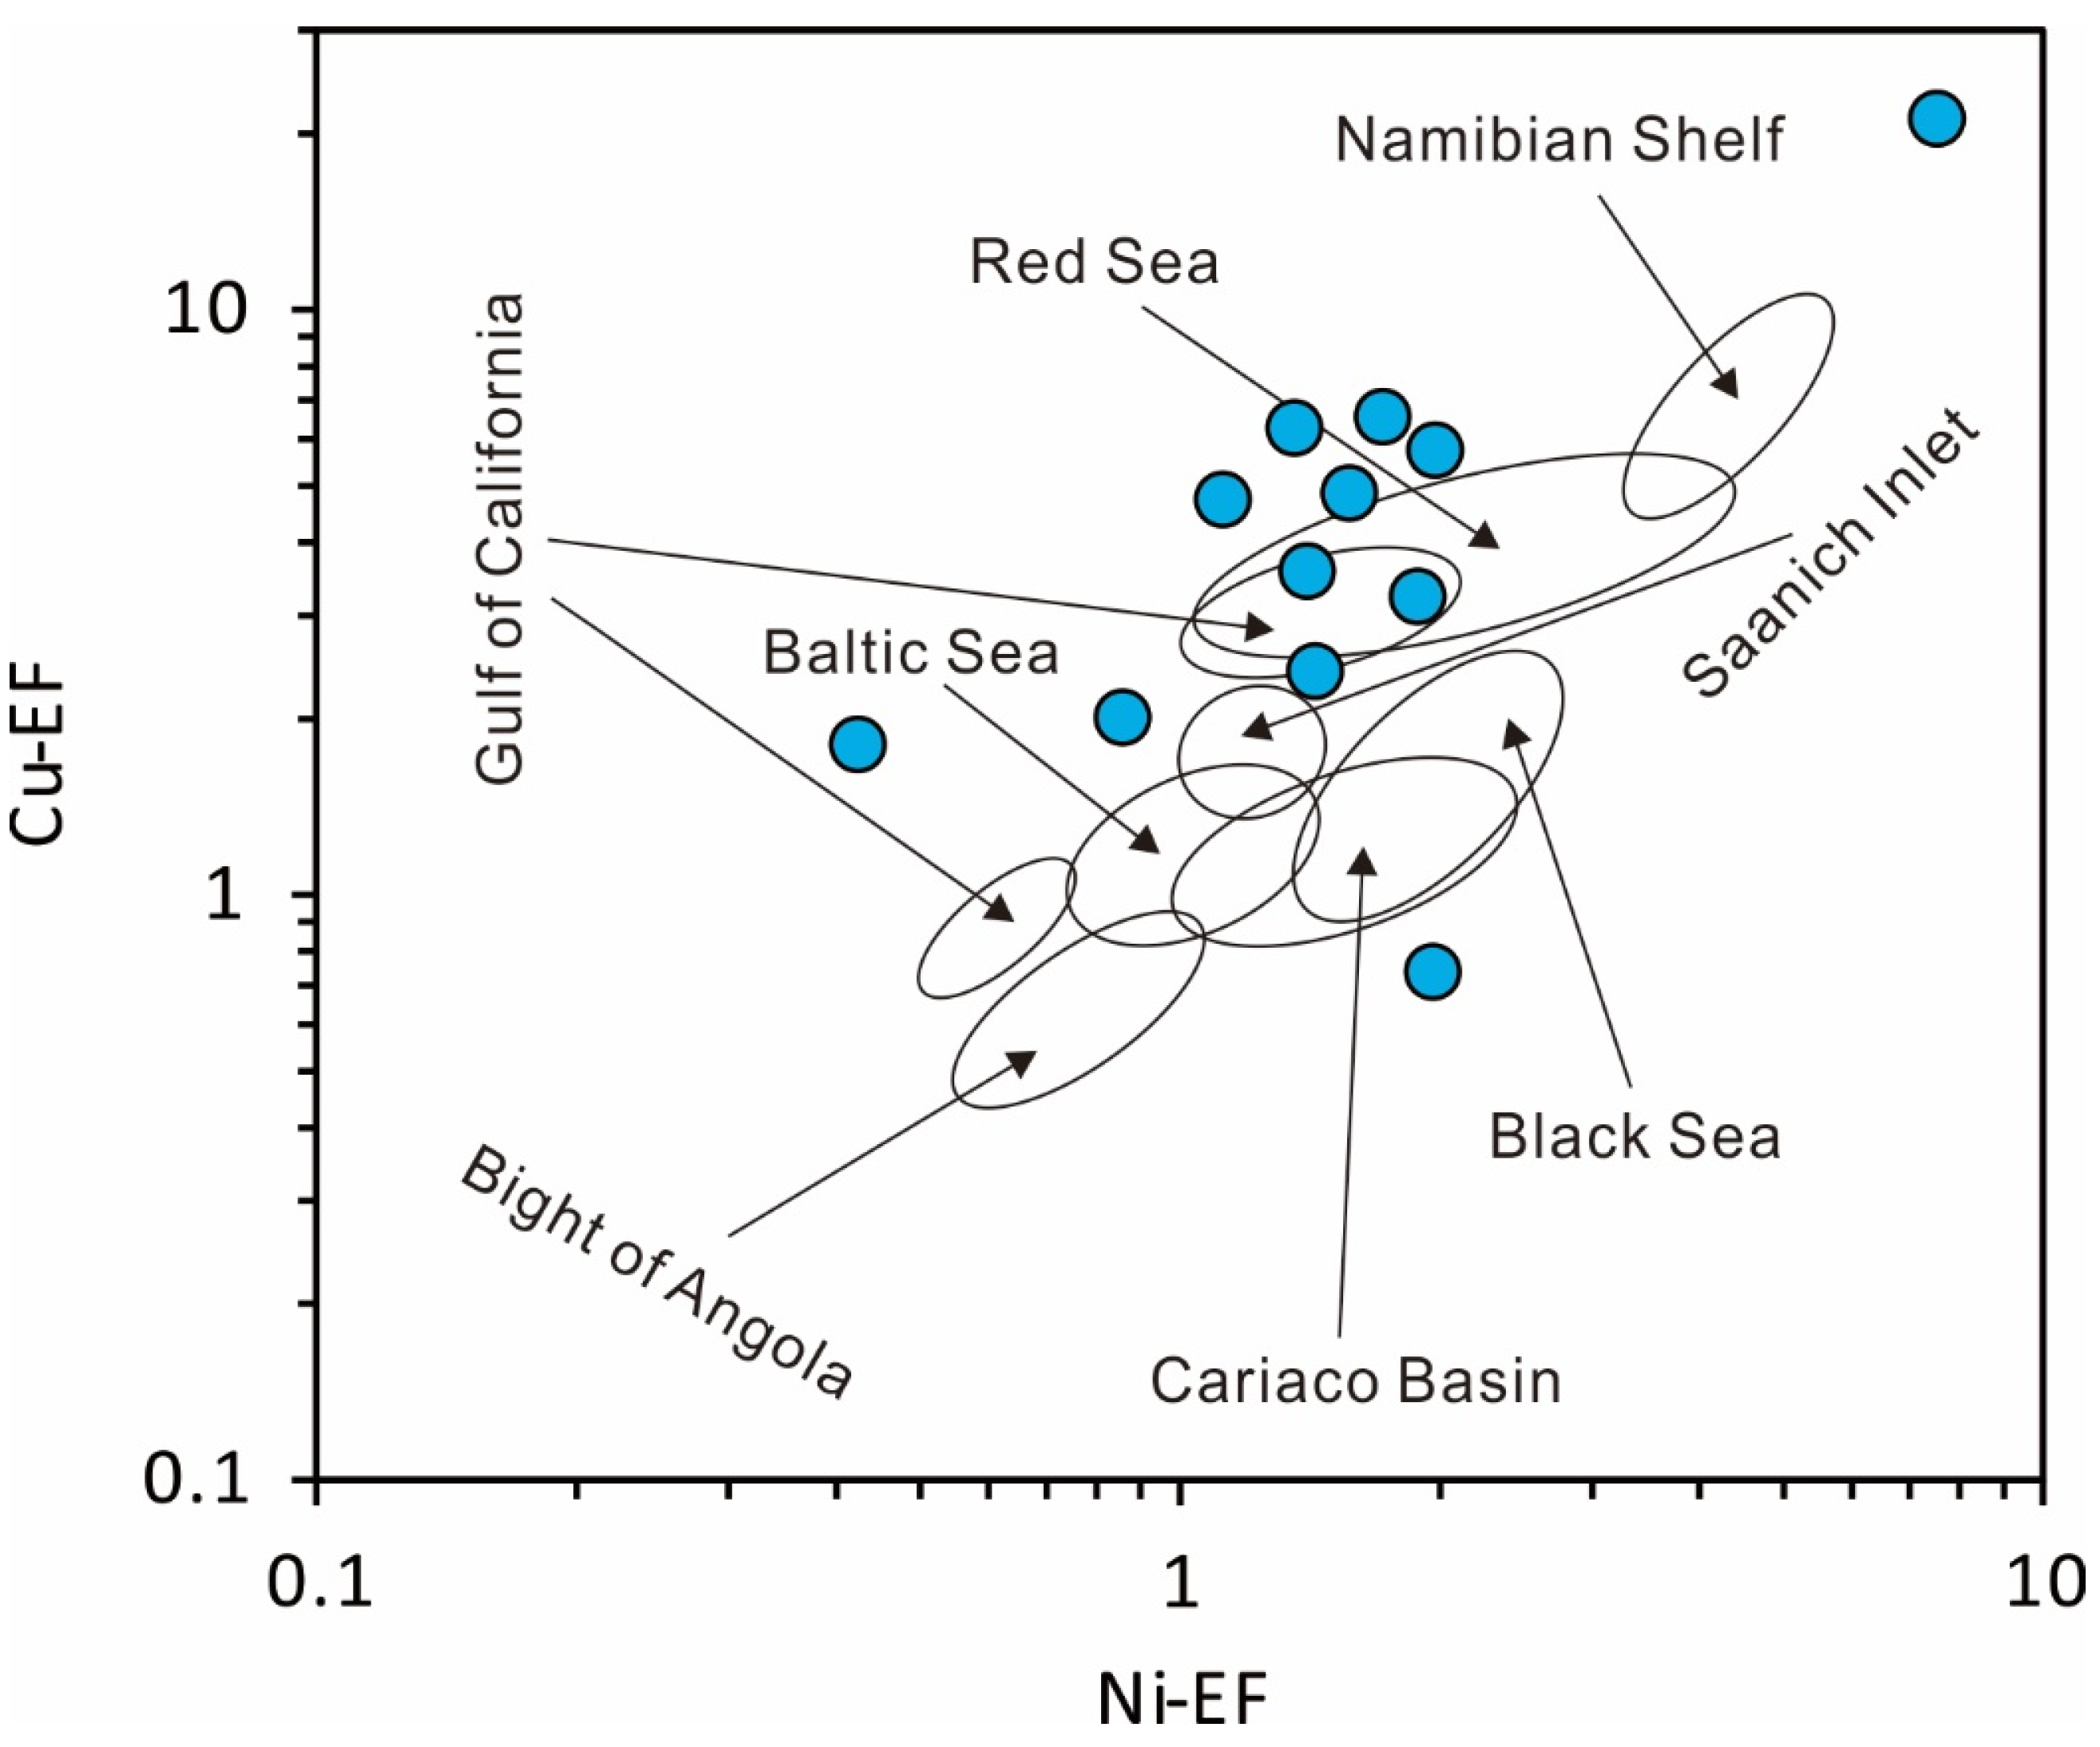
Geochemical parameters derived from modern marine environments are normally used to calibrate the depositional environments of ancient sediments. Despite that modern oceans are well oxidized, oxygen depletions were found in certain areas, such as restricted basins and high-productivity zones [43]. Therefore, redox conditions during the deposition of the Longtan shale were also compared with modern marine environments, including Namibian Shelf, Red Sea, Saanich Inlet, Gulf of California, Baltic Sea, Black Sea, Carioco Basin, and Bight of Angola (Figure 16). It is evident that none of the modern marine environments are solely similar to that of the Longtan shale. However, it is noteworthy that most of the data points were distributed in or close to the realms of Red Sea and Gulf of California, which were proved to be variable in terms of their degrees of redox condition. This is in line with the interpretation based on other redox proxies above and consistent with the results derived from organic geochemistry [10,14]. Thus, a variable redox condition can be speculated for the Longtan shale during its deposition.

5.4. Depositional Mode and Organic Matter Enrichment

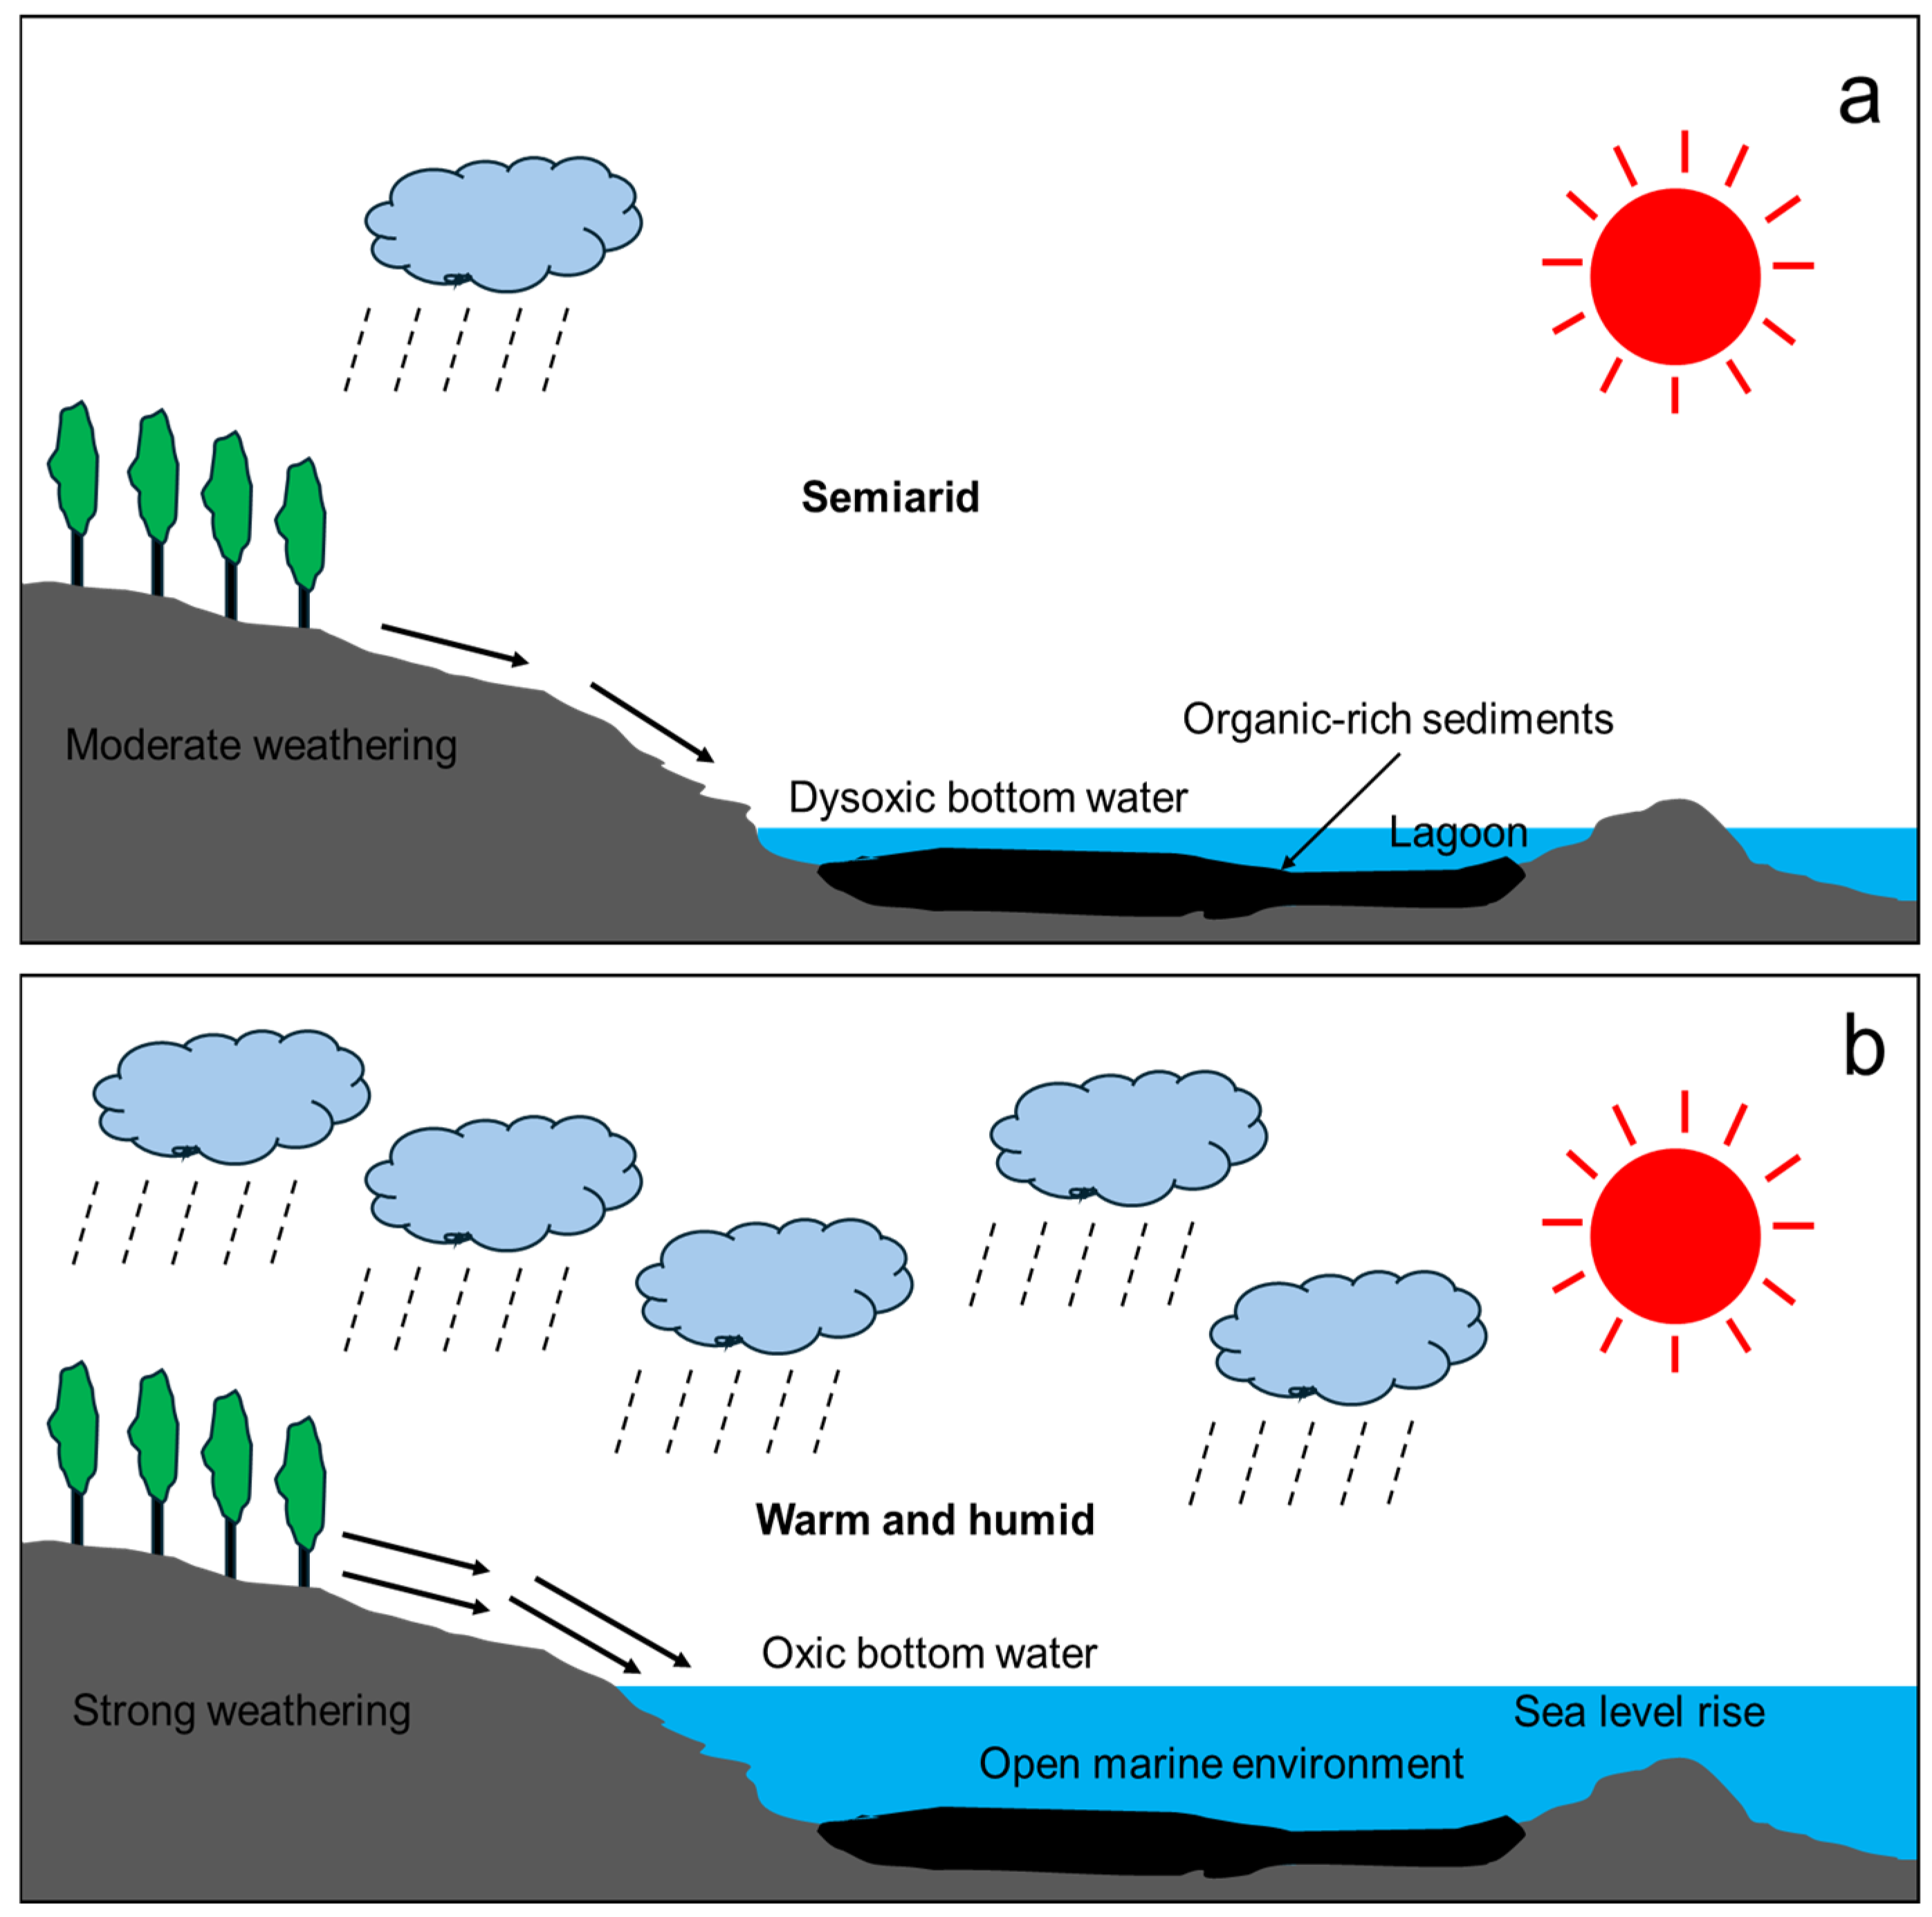
Based on the results in this study and those derived from the same group using different methods [5,10,14,15], the depositional model has been built. The paleoenvironments during the deposition of the Longtan shale in southwestern Guizhou province can be classified into two different types alternating turns (Figure 17). Such alternating depositional environments have also been suggested in the previous studies [5,14]. In semi-arid periods, moderate weathering ensured enough source of sediments and well-grown higher plants guaranteed large quantities of organic matter; relatively low sea levels during these periods formed lagoons near the coastline. The water body in lagoons is generally quiet with weak hydrodynamics, which is conducive to form a dysoxic bottom water environment and beneficial for the preservation of organic matter (Figure 17a). In humid and warm periods, strong weathering coupled with more rainfall facilitated abundant sources of sediments and organic matter rushed into the nearby marine water body; relatively high sea levels during these periods enabled the water communication between the shallow lagoons and deep marine system. Due to the strong water flow and ocean currents at relatively high sea levels, more oxygen could be brought into the water body at the depositional site and thus form an oxic bottom water environment, which is unfavorable for the preservation of organic matter (Figure 17b). Nevertheless, since the input of organic matter during the humid and warm periods was more than that in semiarid phases, the overall organic matter content preserved in the Longtan shale in the two stages may vary depending on the absolute input and consumption of organic matter during deposition.
Enrichment of organic matter in the Longtan shale is a complex process given the alternating paleoenvironments based on the aforementioned depositional mode. It has long been controversial that either productivity or preservation plays the most important role in organic matter accumulation in organic rich shales (Chow et al., 1995; Lu et al., 2019) [44,45]. Such kinds of dispute are mainly on the marine shales with organic matter primarily from aquatic organisms (Lu et al., 2019) [45]. Considering the fact that organic matter in the Longtan shale was mainly derived from higher land plants (Zhang et al., 2025) [10], whether semiarid or warm and humid paleoclimate is more beneficial for the enrichment of organic matter has yet to be confirmed. Further analysis on the paleoenvironments is vital to a better understanding of the depositional system of the Longtan shale.

6. Conclusions

Based on the petrographic and geochemical analysis of 20 Longtan shale samples collected from southwestern Guizhou Province, China, the following conclusions were made:
(1)
The Longtan shale in the study area had a mixed source of materials with relatively larger proportions of basalt and andesite during its deposition. Organic matter in the Longtan shale was derived from both higher land plants and aquatic organisms, with the former accounts for the majority.
(2)
Semiarid to humid and warm climates were revealed during the periods of late Permian in the Guizhou Province, corresponding to an overall intensive weathering based on CIA, MIA, and other inorganic geochemical proxies. The Longtan shale was deposited in a brackish-to-marine water environment.
(3)
The redox condition during the deposition of the Longtan shale has unraveled using C-S-Fe, Co/Ni, V/Cr, U/Th, and V/(V + Ni), as well as the enrichment factors of U and Mo, which has also been compared to several modern marine environments. A variable redox condition, generally oxic-to-dysoxic, was reconstructed.
(4)
The paleoenvironments during the deposition of the Longtan shale in southwestern Guizhou province have been reconstructed based on this study and the results from previous works. Alternating of two stages, from sea level rise to down and from sea level down to rise, coupled with changes in climate, water salinity, and redox condition jointly controlled the formation of the Longtan shale.
More detailed works based on isotopes are merited in the future to deepen our understanding of the depositional environment for the Longtan shale. Moreover, further correlation is needed between testing analysis, geological analysis, and the existing conclusions.

Author Contributions

Conceptualization, E.D.; methodology, J.Z. and Q.Z.; validation, Q.Z., Z.X., P.Y. and Z.Y.; formal analysis, E.D., Q.Z., Z.X. and P.Y.; investigation, E.D. and Q.Z.; resources, J.Z., Z.X., Z.Y. and B.J.; data curation, E.D. and Q.Z.; writing—original draft, E.D. and Q.Z.; writing—review and editing, J.Z., Z.X., P.Y., Z.Y. and B.J.; project administration, B.J. All authors have read and agreed to the published version of the manuscript.

Funding

This research is funded by the Guizhou Provincial Science and Technology Projects (QKHJC [2024] youth377) and the National Science and Technology Major Project Foundation of China (Grant No. 2016ZX05034004-007) are acknowledged.

Data Availability Statement

Data will be made available on request.

Conflicts of Interest

Authors Ende Deng, Zaigang Xu and Pingping Ye were employed by the company Guizhou Energy Group Corporation Limited. The remaining authors declare that the research was conducted in the absence of any commercial or financial relationships that could be construed as a potential conflict of interest.

References

  1. Eia. Technically Recoverable Shale Oil and Shale Gas Resources: An Assessment of 137 Shale Formations in 41Countries Outside the United States; U.S. Department of Energy: Washington, DC, USA, 2013.
  2. Mead, I. International Energy Outlook; US Energy Information Administration: Washington, DC, USA, 2017.
  3. Nie, H.K.; Tang, X.; Bian, R.K. Controlling factors for shale gas accumulation and prediction of potential development area in shale gas reservoir of South China. Acta Pet. Sin. 2009, 30, 484. [Google Scholar]
  4. Zhang, Q.; Littke, R.; Zieger, L.; Shabani, M.; Tang, X.; Zhang, J.C. Ediacaran, cambrian, ordovician, silurian and permian shales of the upper Yangtze platform, south China: Deposition, thermal maturity and shale gas potential. Int. J. Coal Geol. 2019, 216, 103281. [Google Scholar] [CrossRef]
  5. Zhang, Q.; Grohmann, S.; Xu, X.C.; Littke, R. Depositional environment and thermal maturity of the coal-bearing Longtan Shale in Southwest Guizhou, China: Implications for shale gas resource potential. Int. J. Coal Geol. 2020, 231, 103607. [Google Scholar] [CrossRef]
  6. Zheng, D.; Pang, X.; Luo, B.; Chen, D.; Pang, B.; Li, H.; Yu, R.; Guo, F.; Li, W. Geochemical characteristics, genetic types, and source of natural gas in the Sinian Dengying Formation, Sichuan Basin, China. J. Pet. Sci. Eng. 2021, 199, 108341. [Google Scholar] [CrossRef]
  7. Huang, J.L.; Zou, C.N.; Li, J.Z.; Dong, D.Z.; Wang, S.; Wang, S.Q.; Cheng, K.M. Shale gas generation and potential of the lower Cambrian Qiongzhusi formation in the southern Sichuan Basin, China. Pet. Explor. Dev. 2012, 39, 75–81. [Google Scholar] [CrossRef]
  8. Wu, Y.; Fan, T.L.; Jiang, S.; Yang, X.Q. Lithofacies and sedimentary sequence of the lower Cambrian Niutitang shale in the upper Yangtze platform, South China. J. Nat. Gas Sci. Eng. 2017, 43, 124–136. [Google Scholar] [CrossRef]
  9. He, Z.; Hu, Z.; Nie, H.; Li, S.; Xu, J. Characterization of shale gas enrichment in the Wufeng Formation–Longmaxi Formation in the Sichuan Basin of China and evaluation of its geological construction–transformation evolution sequence. J. Nat. Gas Geosci. 2017, 2, 1–10. [Google Scholar] [CrossRef]
  10. Zhang, Q.; Jin, Z.; Deng, E.; Xu, Z.; Zhu, R.; Liu, Q.; Yan, Z.; Hu, K.; Zheng, T.; Hu, Z. Accumulation and maturation of organic matter in shales: The coal-bearing Permian Longtan Formation at Tucheng Syncline, Southwestern Guizhou, China. Appl. Geochem. 2025, 180, 106257. [Google Scholar] [CrossRef]
  11. Zhang, J.; Li, X.; Wei, Q.; Gao, W.; Liang, W.; Wang, Z.; Wang, F. Quantitative characterization of pore-fracture system of organic-rich marine-continental shale reservoirs: A case study of the Upper Permian Longtan Formation, Southern Sichuan Basin, China. Fuel 2017, 200, 272–281. [Google Scholar] [CrossRef]
  12. Zhang, J.; Li, X.; Zhang, X.; Zhang, M.; Cong, G.; Zhang, G.; Wang, F. Geochemical and geological characterization of marine–continental transitional shales from Longtan Formation in Yangtze area, South China. Mar. Pet. Geol. 2018, 96, 1–15. [Google Scholar] [CrossRef]
  13. Luo, W.; Hou, M.; Liu, X.; Huang, S.; Chao, H.; Zhang, R.; Deng, X. Geological and geochemical characteristics of marine-continental transitional shale from the Upper Permian Longtan formation, Northwestern Guizhou, China. Mar. Petrol. Geol. 2018, 89, 58–67. [Google Scholar] [CrossRef]
  14. Deng, E.; Zhang, Q.; Jin, Z.; Zhu, R.; Yan, Z.; Jiang, B.; Littke, R. Non-overmature equivalents confirmed a high initial hydrocarbon generation potential of the Permian Longtan Shale in southern China. Int. J. Coal Geol. 2022, 259, 104043. [Google Scholar] [CrossRef]
  15. Zheng, T.; Zhang, Q.; Deng, E. Applications of low molecular weight polycyclic aromatic hydrocarbons (PAHs) and diamondoids ratios/indices on the maturity assessment of coal-bearing source rock: Insight from mature to overmature Longtan Shale. Int. J. Coal Geol. 2023, 269, 104209. [Google Scholar] [CrossRef]
  16. Peters, K.E.; Walters, C.C.; Moldowan, J.M. The Biomarker Guide; Cambridge University Press: Cambridge, UK, 2005; p. 1155. [Google Scholar]
  17. Dou, X.; Jiang, B.; Qin, Y.; Wang, W.; Chen, W. Structure evolution in west ofguizhou area and control to seam in late permian. Coal Sci. Technol. 2012, 40, 109–114. [Google Scholar]
  18. Zhang, J.; Ren, D.; Zhu, Y.; Chou, C.; Zeng, R.; Zheng, B. Mineral matter and potentially hazardous trace elements in coals from Qianxi Fault depression area in southwestern Guizhou, China. Int. J. Coal Geol. 2004, 57, 49–61. [Google Scholar] [CrossRef]
  19. Li, Y.; Zhang, T.; Ellis, G.; Shao, D. Depositional environment and organic matter accumulation of Upper Ordovician–Lower Silurian marine shale in the Upper Yangtze Platform, South China. Palaeogeogr. Palaeoclimatol. Palaeoecol. 2016, 466, 252–264. [Google Scholar] [CrossRef]
  20. Li, M.; Jiang, B.; Liu, J.; Zhu, P.; Chen, G. Geological models and structure controls of tectonically deformed coal in Tucheng syncline, western Guizhou Province. J. China Coal Soc. 2018, 43, 1565–1571. [Google Scholar]
  21. Xiong, M.; Qin, Y.; Yi, T. Sedimentary patterns and structural controls of Late Permian coal-bearing strata in Guizhou, China. J. China Univ. Min. Technol. 2006, 35, 778. [Google Scholar]
  22. Ma, X.; Guo, S.; Shi, D.; Zhou, Z.; Liu, G. Investigation of pore structure and fractal characteristics of marine-continental transitional shales from Longtan Formation using MICP, gas adsorption, and NMR (guizhou, China). Mar. Petrol. Geol. 2019, 107, 555–571. [Google Scholar] [CrossRef]
  23. Dai, S.; Ren, D.; Tang, Y.; Yue, M.; Hao, L. Concentration and distribution of elements in late Permian coals from western Guizhou Province, China. Int. J. Coal Geol. 2005, 61, 119–137. [Google Scholar] [CrossRef]
  24. Liu, S.; Wu, C.; Li, T.; Wang, H. Multiple geochemical proxies controlling the organic matter accumulation of the marine-continental transitional shale: A case study of the Upper Permian Longtan Formation, western Guizhou, China. J. Nat. Gas Sci. Eng. 2018, 56, 152–165. [Google Scholar] [CrossRef]
  25. Liu, B.; Song, Y.; Zhu, K.; Su, P.; Ye, X.; Zhao, W. Mineralogy and element geochemistry of salinized lacustrine organic-rich shale in the Middle Permian Santanghu Basin: Implications for paleoenvironment, provenance, tectonic setting and shale oil potential. Mar. Pet. Geol. 2020, 120, 104569. [Google Scholar] [CrossRef]
  26. He, Q.; Dong, T.; He, S.; Zhai, G.; Guo, X.; Hou, Y.; Yang, R.; Han, Y. Sedimentological and geochemical characterization of the Upper Permian transitional facies of the Longtan Formation, northern Guizhou Province, southwest China: Insights into paleo-environmental conditions and organic matter accumulation mechanisms. Mar. Pet. Geol. 2020, 118, 104446. [Google Scholar] [CrossRef]
  27. Ghosh, S.; Sarkar, S. Geochemistry of Permo-Triassic mudstone of the Satpura Gondwana basin, central India: Clues for provenance. Chem. Geol. 2010, 277, 78–100. [Google Scholar] [CrossRef]
  28. McLennan, S.M.; Hemming, S.; McDaniel, D.K.; Hanson, G.N. Geochemical approaches to sedimentation, provenance, and tectonics. Spec. Pap.—Geol. Soc. Am. 1993, 284, 21–40. [Google Scholar]
  29. Qiao, J.; Luo, Q.; Zhang, K.; Zhang, G.; Duan, J.; Wang, D.; Yu, H.; Wang, S.; Qu, Y.; Kopaevich, L. Geochemistry and organic petrography of the Middle Permian Lucaogou alkaline lacustrine oil shale in the southern Junggar Basin, China: Implications for formation conditions and organic matter accumulation. Int. J. Coal Geol. 2023, 268, 104198. [Google Scholar] [CrossRef]
  30. Nesbitt, H.W.; Young, G.M. Early Proterozoic climates and plate motions inferred from major element chemistry of lutites. Nature 1982, 199, 715–717. [Google Scholar] [CrossRef]
  31. Fedo, C.M.; Nesbitt, H.W.; Young, G.M. Unraveling the effects of potassium metasomatism in sedimentary rocks and paleosols, with implications for paleoweathering conditions and provenance. Geology 1995, 23, 921–924. [Google Scholar] [CrossRef]
  32. Nesbitt, H.W.; Young, G.M. Petrogenesis of sediments in the absence of chemical weathering: Effects of abrasion and sorting on bulk composition and mineralogy. Sedimentology 1996, 43, 341–358. [Google Scholar] [CrossRef]
  33. Makeen, Y.M.; Hakimi, M.H.; Abdullah, W.H. The origin, type and preservation of organic matter of the Barremian–Aptian organic-rich shales in the Muglad Basin, Southern Sudan, and their relation to paleoenvironmental and paleoclimate conditions. Mar. Pet. Geol. 2015, 65, 187–197. [Google Scholar] [CrossRef]
  34. Fan, B. Geochemical characteristics and paleoenvironment of organic-rich Triassic shale in the central Ordos Basin. Nat. Resour. Res. 2022, 31, 1739–1757. [Google Scholar] [CrossRef]
  35. Shi, L.; Yu, X.; Yuan, J.; Xu, J.; Yang, L.; Sun, L.; Li, G.; Zhang, Y.; Chen, D.; Li, G. Sedimentary Paleoenvironment and Organic Matter Enrichment of the Ying 4 Member in the Southern Shuangcheng Area, Songliao Basin. Minerals 2024, 14, 1152. [Google Scholar] [CrossRef]
  36. Wei, W.; Algeo, T.J. Elemental proxies for paleosalinity analysis of ancient shales and mudrocks. Geochim. Cosmochim. Acta 2020, 287, 341–366. [Google Scholar] [CrossRef]
  37. Sajid, Z.; Ismail, M.S.; Zakariah, M.N.A.; Tsegab, H.; Gámez Vintaned, J.A.; Hanif, T.; Ahmed, N. Impact of paleosalinity, paleoredox, paleoproductivity/preservation on the organic matter enrichment in black shales from triassic turbidites of semanggol basin, peninsular malaysia. Minerals 2020, 10, 915. [Google Scholar] [CrossRef]
  38. Qiao, J.; Baniasad, A.Z.; Zieger, L.; Zhang, C.; Luo, Q.; Littke, R. Paleo-depositional environment, origin and characteristics of organic matter of the Triassic Chang 7 Member of the Yanchang Formation throughout the mid-western part of the Ordos Basin, China. Int. J. Coal Geol. 2021, 237, 103636. [Google Scholar] [CrossRef]
  39. Wu, Z.; Littke, R.; Baniasad, A.; Yang, Z.; Tang, Z.; Grohmann, S. Geochemistry and petrology of petroleum source rocks in the Upper Cretaceous Qingshankou Formation, Songliao Basin, NE China. Int. J. Coal Geol. 2023, 270, 104222. [Google Scholar] [CrossRef]
  40. Uffmann, A.K.; Littke, R.; Rippen, D. Mineralogy and geochemistry of Mississippian and Lower Pennsylvanian black shales at the northern margin of the Variscan Mountain Belt (Germany and Belgium). Int. J. Coal Geol. 2012, 103, 92–108. [Google Scholar] [CrossRef]
  41. Emmings, J.F.; Poulton, S.W.; Vane, C.H.; Davies, S.J.; Jenkin, G.R.; Stephenson, M.H.; Lamb, A.L.; Moss-Hayes, V. A Mississippian black shale record of redox oscillation in the Craven Basin, UK. Palaeogeogr. Palaeoclimatol. Palaeoecol. 2020, 538, 109423. [Google Scholar] [CrossRef]
  42. Wang, Y.; Zhang, H.; Chen, H.; Zhu, Y.; Yang, J.; Zhang, Y.; Wang, Z. The sedimentary environment and main controlling factors of organic matter enrichment of Carboniferous-Permian marine-continental transitional shale in Kaiping syncline. Pet. Sci. Technol. 2024, 43, 2186–2206. [Google Scholar] [CrossRef]
  43. Yano, M.; Yasukawa, K.; Nakamura, K.; Ikehara, M.; Kato, Y. Geochemical features of redox-sensitive trace metals in sediments under oxygen-depleted marine environments. Minerals 2020, 10, 1021. [Google Scholar] [CrossRef]
  44. Chow, N.; Wendte, J.; Stasiuk, L. Productivity versus preservation controls on two organic-rich carbonate facies in the Devonian of Alberta: Sedimentological and organic petrological evidence. Bull. Can. Pet. Geol. 1995, 43, 433–460. [Google Scholar]
  45. Lu, Y.; Jiang, S.; Lu, Y.; Xu, S.; Shu, Y.; Wang, Y. Productivity or preservation? The factors controlling the organic matter accumulation in the late Katian through Hirnantian Wufeng organic-rich shale, South China. Mar. Pet. Geol. 2019, 109, 22–35. [Google Scholar] [CrossRef]
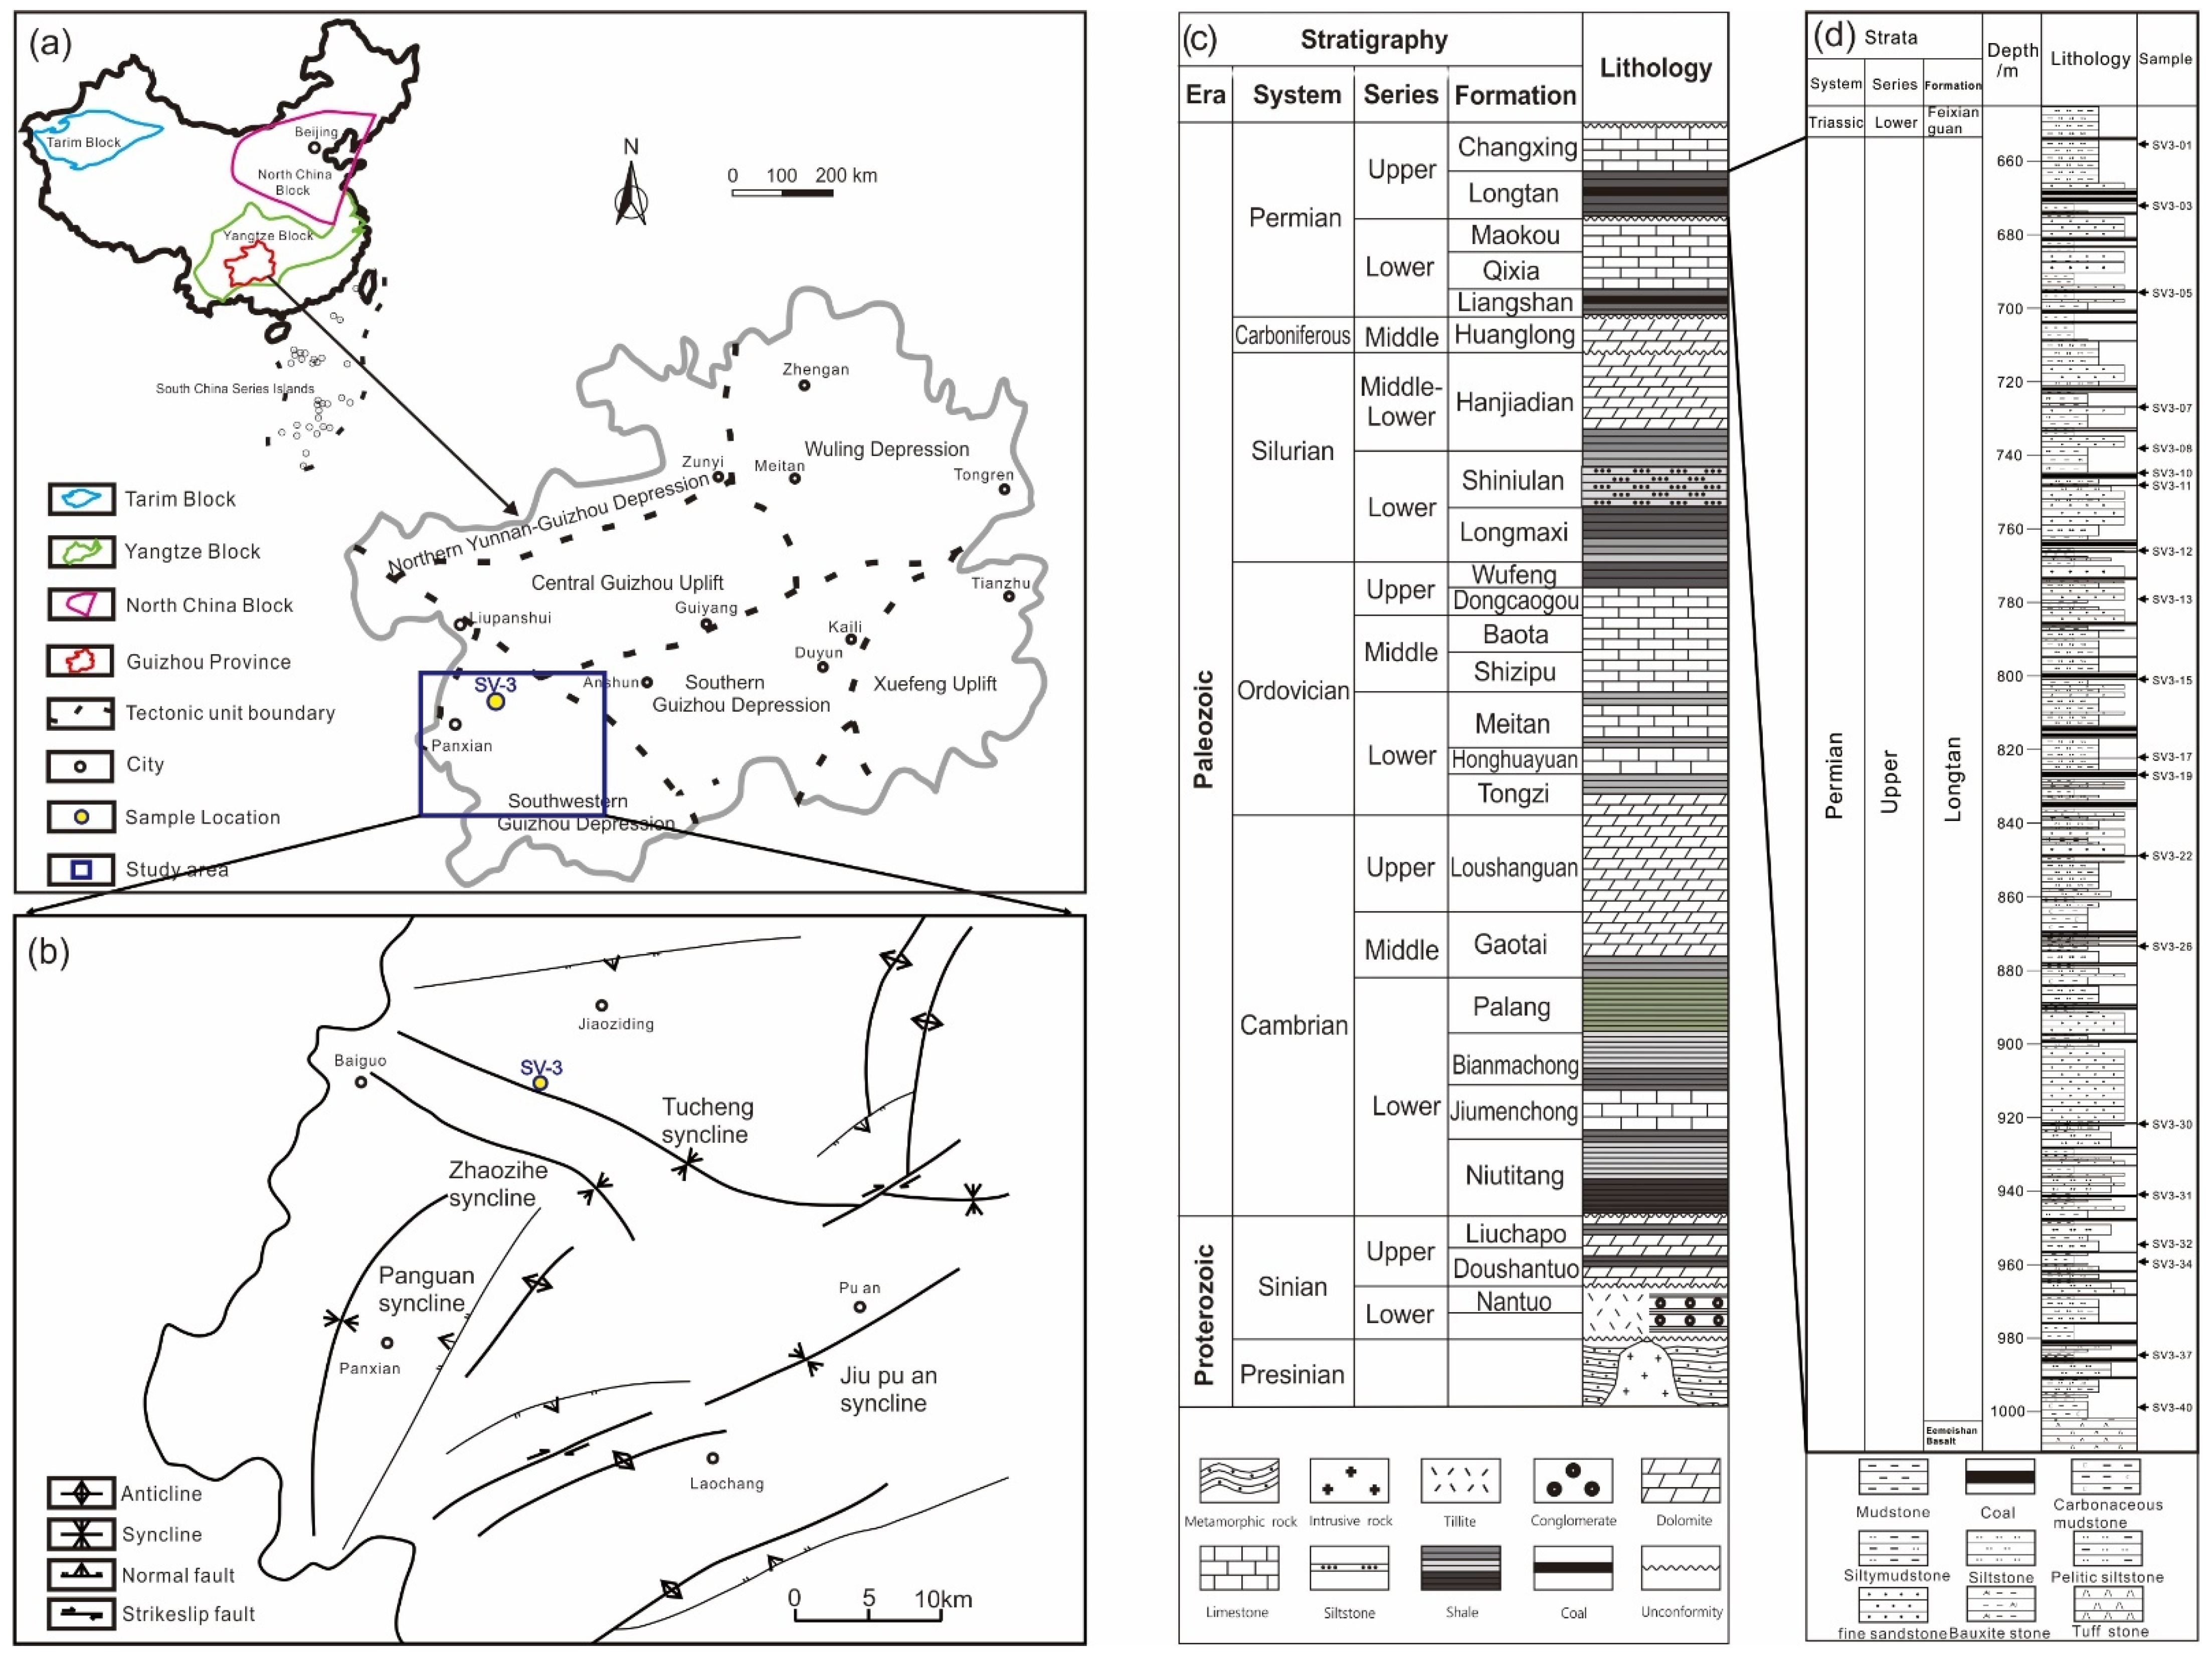
Figure 1. Geological map showing the location of borehole (a), the geological structures in the study area (b), and the stratigraphic columns of the UYP (c) and the Longtan Formation (d).
Minerals 15 00850 g001
Figure 2. The 12 core samples used for petrographic, mineralogical, and geochemical analysis. All the samples (al) show dark grey to black color.
Minerals 15 00850 g002
Figure 3. Characteristics of vitrinite, inertinite, and pyrite in the Longtan shale under microscope. (a) vitrinite; (b) inertinite; (c) vitrinite; (d) inertinite; (e) vitrinite; (f) vitrinite (g) pyrite; (h) pyrite.
Minerals 15 00850 g003
Figure 4. FE-SEM images presenting the organic matter (a,b), the euhedral (g) and framboidal (c,g,h) pyrites, and the pores (d) and fractures (df) in crystal minerals in the Longtan shale.
Minerals 15 00850 g004
Figure 5. Ternary diagram of SiO2-Al2O3-CaO indicating the main mineral components in the Longtan shale [4,14,24,26].
Minerals 15 00850 g005
Figure 6. Ternary diagrams of clay–carbonates–quartz + feldspar (a) and of kaolinite–illite/smectite + illite–chlorite (b) in the Longtan shale. Modified after [14].
Minerals 15 00850 g006
Figure 7. Major elements in the Longtan shale. Al2O3 vs. SiO2 (a), K2O (b), Fe2O3 (c) and TiO2 (d). Data collected from Liu et al. (2018) [24], Zhang et al. (2019) [4], He et al. (2020) [26], and Deng et al. (2022) [14] for the same formation were used here for comparison.
Minerals 15 00850 g007
Figure 8. Cross-plots of Zr/Sc vs. Th/Sc (a), La/Sc vs. Co/Th (b), SiO2 vs. log(Na2O+K2O) (c), and Hf vs. La/Th (d) [24,26]. Note: subfigures (ac) were modified from Liu et al., 2020 [25]; subfigure (d) was modified from Qiao et al., 2023 [29].
Minerals 15 00850 g008
Figure 9. Ternary diagrams of Th-La-Sc (a), Sc-Th-Zr/10 (b), Co-Th-Zr/10 (c), and cross-plots of La/Sc vs. Ti/Zr (d).
Minerals 15 00850 g009
Figure 10. Chemical index of alteration (CIA) and mineralogical index of alteration (MIA) values of the Longtan shale. Data collected from Liu et al. (2018) [24], Zhang et al. (2019) [4], He et al. (2020) [26] and Deng et al. (2022) [14] for the same formation were used here for comparison.
Minerals 15 00850 g010
Figure 11. Cross-plots of Al2O3+K2O+Na2O vs. SiO2 (a) and K2O/Al2O3 vs. Ga/Rb (b) [4,14,24,26].
Minerals 15 00850 g011
Figure 12. Cross-plots of Sr/Ba vs. S/C (a) and Sr/Ba vs. Rb/K (b).
Minerals 15 00850 g012
Figure 13. Ternary diagram of C-S-Fe suggesting the depositional environment [4,14].
Minerals 15 00850 g013
Figure 14. Crossplots of Ni vs. Co (a), V vs. Cr (b), U/Th vs. V/(V + Ni) (c), and V/Cr vs. V/(V + Ni) (d) reflecting the paleoredox conditions. Data collected from Liu et al. (2018) [24], He et al. (2020) [26] and Deng et al. (2022) [14] for the same formation were used here for comparison.
Minerals 15 00850 g014
Figure 15. Enrichment factors (EU) for U and Mo as an indicator of redox conditions. Data for the Shanxi Formation (b) were compared with those from the current study (a) given their similar ages [14,42].
Minerals 15 00850 g015
Figure 16. Enrichment factors (EF) for Ni and Cu were calculated and compared with those for several modern marine environments. Modified after Yano et al. (2020) [43].
Minerals 15 00850 g016
Figure 17. Depositional model for the Longtan Formation. (a) semiarid periods with few rainfalls; (b) warm and humid periods with intensive rainfalls.
Minerals 15 00850 g017
Table 1. Mineralogical composition of bulk rock and clay fraction of the Longtan shale samples. Abbreviations: Qua (quartz), Fel (feldspar), Car (carbonates), Pyr (pyrite), I (illite), K (kaolinite), C (chlorite), I/S (mixed-layer illite–smectite).
Sample No.Bulk Mineralogical Composition (wt.%)Clay Mineralogical Composition (wt.%)
QuaFelCarPyrClayOthersIKCI/S
SV3-0122---699-4753-
SV3-0314---75118382727
SV3-0518---7756322339
SV3-071414-4551311114632
SV3-08198-6616-1981-
SV3-107--973116284224
SV3-1114144458619162738
SV3-1227-26-4075156119
SV3-131739-6658203042
SV3-1512---835-5941-
SV3-17513--433-7723-
SV3-197---885-78184
SV3-2286---14--100--
SV3-2621--860116392233
SV3-3066--331--2080-
SV3-3117-72353--5248-
SV3-3215124-6363176119
SV3-3431--16485-5545-
SV3-3713---825-5644-
SV3-4023--4649-4555-
Table 2. Major oxides of the selected Longtan shale samples (given as wt.%).
Sample No.SiO2Al2O3MgONa2OK2OP2O5TiO2CaOFe2O3MnO
SV3-0145.0624.062.500.171.010.464.971.1820.520.07
SV3-0559.7027.181.640.713.350.103.580.413.330.01
SV3-0847.1520.663.151.381.440.355.251.0019.550.08
SV3-1348.6222.982.371.092.380.343.630.9516.770.88
SV3-1772.1819.670.630.991.310.263.070.671.210.01
SV3-2246.9423.561.180.831.640.104.280.2821.170.04
SV3-2664.094.320.670.110.150.040.300.6929.590.04
SV3-3070.6213.101.520.371.770.070.880.2111.440.02
SV3-3139.0921.400.760.612.170.133.030.4432.200.16
SV3-3452.6216.790.720.470.720.092.121.3325.070.08
SV3-3750.2630.101.250.781.230.614.391.0910.170.13
SV3-4051.8726.530.470.550.890.123.220.5315.780.04
Table 3. Trace elements of the selected Longtan shale samples (given as ppm).
Sample No.LiBeVCrCoNiCuZnGaRbSrZrNbMoCsBaHfTaWTlPbSnUTh
SV3-0151.603.45338.59123.6361.82137.53228.73181.4339.2538.13254.92574.9973.332.082.05217.4914.363.571.830.2920.444.723.1315.29
SV3-0537.563.36377.65179.0123.97106.62281.9054.0937.8779.12560.92501.8261.301.492.95946.7712.423.381.680.1711.644.703.6715.88
SV3-0852.172.38354.67113.6162.4493.88165.73182.0231.1946.10417.11440.7960.901.591.60707.1511.103.121.060.1414.824.174.0910.07
SV3-1328.914.06282.92169.0386.00125.22122.77110.9231.6860.10414.59517.4471.474.061.94971.8012.403.751.550.1819.684.413.1415.90
SV3-173.981.70252.8671.7931.1397.60213.13160.3517.6131.21199.27355.9240.521.081.32420.509.042.160.690.085.903.102.088.96
SV3-2222.150.3978.7857.5945.66133.7128.7521.044.863.4237.2059.885.174.540.23118.821.430.310.244.8637.560.760.913.14
SV3-2643.002.98328.42144.8857.9094.17151.33104.7829.7544.58275.92434.7563.4828.021.86599.5110.683.431.250.5816.413.7117.0012.09
SV3-3078.661.22107.1748.1425.2854.3752.2220.1212.2126.9586.53123.7418.660.971.68224.633.611.171.110.0820.792.423.6615.96
SV3-3124.302.41331.7083.5059.4686.85126.4662.0421.5632.04226.87317.0944.3287.221.29427.357.782.301.111.5313.772.6669.958.96
SV3-3419.391.84115.7649.9317.3441.6755.7176.0215.7411.81141.08384.6755.6816.420.79190.438.862.720.921.0912.153.349.349.78
SV3-3730.735.13288.4853.0485.3397.50235.11167.8739.1937.16451.76684.6596.903.591.27545.1217.264.961.640.1015.926.223.8518.66
SV3-4059.643.54261.1737.9325.7732.4979.1659.5217.9711.65168.65324.5045.705.050.48172.717.972.420.870.205.362.482.688.50
Table 4. Rare earth elements of the selected Longtan shale samples (given as ppm).
Sample No.ScYLaCePrNdSmEuGdTbDyHoErTmYbLu
SV3-0133.4258.9599.21196.6525.0497.4619.195.3617.212.3911.742.195.670.724.650.66
SV3-0533.0850.6889.09172.2421.8682.4414.373.3411.941.8910.352.055.400.674.450.63
SV3-0832.1242.1265.20126.6316.4462.1611.553.2210.231.548.451.664.450.573.640.53
SV3-1331.0954.2493.34181.1022.0079.9312.782.759.811.689.802.095.890.775.060.74
SV3-1710.8220.6059.75130.1114.8856.399.842.377.000.984.850.902.350.281.850.27
SV3-228.2911.9845.8595.1110.9737.597.491.665.320.633.020.531.360.181.160.16
SV3-2628.8643.2567.37145.8218.3671.0013.933.4310.601.559.111.754.740.653.880.56
SV3-3015.5629.3990.48179.4620.9675.0914.003.1111.451.516.991.303.590.503.350.50
SV3-3117.3636.4061.23115.2614.2454.1410.072.949.311.447.051.383.810.493.270.48
SV3-3411.5331.5958.29110.8312.9944.328.211.767.771.246.451.293.670.493.300.49
SV3-3726.6473.22119.94241.5629.88112.6321.045.5818.772.9014.872.917.891.036.510.95
SV3-4014.2448.8571.66144.5717.5168.4813.833.5613.421.999.892.005.420.704.560.67
Disclaimer/Publisher’s Note: The statements, opinions and data contained in all publications are solely those of the individual author(s) and contributor(s) and not of MDPI and/or the editor(s). MDPI and/or the editor(s) disclaim responsibility for any injury to people or property resulting from any ideas, methods, instructions or products referred to in the content.