Abstract
The Erentaolegai silver deposit is located within the Derbugan metallogenic belt in the eastern segment of the Central Asia–Mongolia giant orogenic belt. The ore bodies are primarily hosted in the volcanic rocks of the Middle Jurassic Tamulangou Formation of the Mesozoic. The mineralization process of the deposit is divided into three stages: Stage I: Pyrite–Quartz Stage; Stage II: Sulfide–Quartz Stage; Stage III: Quartz–Manganese Carbonate Stage. This paper discusses the ore-forming fluids, ore-forming materials, and deposit genesis of the Erentaolegai silver deposits using fluid inclusions microthermometry, laser Raman spectroscopy, and H-O-S isotope analyses. Fluid inclusion microthermometry and laser Raman spectroscopy analyses indicate that the Erentaolegai silver deposit contains exclusively fluid-rich two-phase fluid inclusions, all of which belong to the H2O-NaCl system. Homogenization temperatures of fluid inclusions in the three stages (from early to late) ranged from 257 to 311 °C, 228 to 280 °C, and 194 to 238 °C, corresponding to salinities of 1.91 to 7.86 wt%, 2.07 to 5.41 wt%, and 0.70–3.55 wt% NaCl equivalent, densities of 0.75 to 0.83 g/cm−3, 0.80 to 0.86 g/cm−3 and 0.85 to 0.89 g/cm−3. The mineralization pressure ranged from 12.2 to 29.5 MPa, and the mineralization depth was 0.41 to 0.98 km, indicating low-pressure and shallow-depth mineralization conditions. H-O isotope results indicate that the ore-forming fluid is a mixture of magmatic fluids and meteoric water, with meteoric contribution dominating in the late stage. The δ34S values of metallic sulfides ranged from −1.8 to +4.0‰, indicating that the metallogenic material of the Erentaolegai silver deposit was dominated by a deep magmatic source. This study concludes that meteoric water mixing and subsequent fluid cooling served as the primary mechanism for silver mineral precipitation. The Erentaolegai silver deposit is classified as a low-sulfidation epithermal silver deposit.
1. Introduction
The Erentaolegai silver deposit, situated in the Derbugan metallogenic belt within the eastern part of the Central Asia–Mongolia giant orogenic belt, is representative of epithermal systems in this region. As an important silver polymetallic ore-rich area in Northeastern China, a series of large-scale deposits were discovered in the Derbugan belt. It’s closely related to the Mesozoic tectonics-magmatic activities [,,]. Previous studies have preliminarily investigated the geological characteristics, alteration zoning, and mineralization age of this deposit [,,], but there is still a lack of systematic analysis of ore-forming fluid sources, material sources, and the genesis of the deposit. This paper presents fluid inclusions microthermometry, laser Raman spectroscopy, and H-O-S isotope analyses, and combines them with the regional tectonic-magmatic background to systematically explore the physical and chemical properties, material sources, and evolutionary pathways of ore-forming fluids. This study not only refines the genetic model of the Erentaolegai deposit but also provides new geochemical constraints for the exploration of epithermal systems within the Derbugan metallogenic belt.
2. Regional Geology
The Erentaolegai large-scale silver deposit is located in the Erguna Massif, located in the eastern part of the Central Asia–Mongolia giant orogenic belt, situated at the juncture between the Erguna–Xingkai fold belt and the Great Xing’an Variscan fold belt, specifically within the southwestern segment of the Derbugan fault zone [,,]. Due to the evolution of the Paleozoic Paleo-Asian Ocean, the Erguna Massif, Xing’an Massif, and Songliao Massif were joined together, and the Erguna Massif was dissected by a series of NE-trending fracture zones [,]. From the Mesozoic to the Middle Cenozoic, influenced by the evolution and subduction-collision of the Eastern Paleo-Pacific tectonic domain, the Northwestern Mongol–Okhotsk Ocean tectonic domain, and the Pacific tectonic domain, the region entered the late orogenic stage of the Mongol–Okhotsk Ocean collision [,,]. The Great Xing’an Range region is a major silver mineralization concentration area in Eastern China. Its southern segment is represented by deposits such as the Mengentaolegai Ag-Pb-Zn deposit, Baiyinnuoer Ag-polymetallic deposit, Shuangjianzishan Ag-Pb-Zn deposit, and Bairendaba Ag-polymetallic deposit [,,]. The northern Great Xing’an Range is dominated by the Derbugan metallogenic belt, which hosts a series of deposits including the Jiawula–Chaganbulagen Ag-Pb-Zn polymetallic deposit, the Erentaolegai silver deposit, and the Erdaohezi Pb-Zn-Ag deposit (Figure 1) [].

Figure 1.
Regional Geological Map of Erentaolegai. ① Derbugan fault; ② Erguna–Hulun fault; ③ Hanigou fault; ④ Muhaer fault; ⑤ Jiawula–Chaganbulagen fault.
The stratigraphy in the area spans from the Proterozoic to the Middle Cenozoic. Proterozoic and Paleozoic strata are sparsely developed in the region, whereas Mesozoic units are extensively distributed. The Middle Jurassic strata, dominated by mafic to intermediate volcanic rocks, are extensively exposed from north to south, while the Upper Jurassic is less widespread, consisting primarily of acid to intermediate volcanic rocks. Lower Cretaceous outcrops occur sporadically, with acid lava flows constituting the main lithology. Cenozoic strata predominantly consist of Neogene and Quaternary deposits [,,,]. This area is situated on the western side of the southern segment of the NE-trending Derbugan deep fault zone. The mining area exhibits well-developed fault structures, with the Hanwula Fault and Erentaolegai Fault being the two largest. These faults, formed at an earlier stage, represent secondary derivative faults of the Derbugan deep fault zone. The Erentaolegai Fault is located on the northeastern side of the mining area, with a NNE strike and a dip direction of 300°, while the Hanwula Fault lies on the southwestern side, dip direction of 45°. The tectonic structure is dominated by NE-trending deep faults and NW-trending fault activities. The Derbugan deep fault zone serves as the primary regional control on magmatic emplacement and mineralization, giving rise to the Derbugan metallogenic belt. The Erentaolegai silver deposit represents one of the characteristic deposits within this belt (Figure 1) [,].
Magmatic activity in the study area is frequent, with Mesozoic magmatic intrusions and volcanic activities being the most intense. The main intrusive rocks in the area are associated with the Late Hercynian, Indosinian, and Yanshan periods []. Late Hercynian intrusive rocks are dominated by Late Permian granites, mainly composed of black mica granite, plagioclase granite, porphyritic granite, monzonitic granite, and granodiorite. The Indosinian intrusive rocks are mainly dominated by monzonitic granite, syenite granite, and fine-grained granite. The Late Yanshan Intrusive is an igneous complex in the northwestern part of the mining area, intruded into the Tamulangou Formation. The main rock types are granite, quartz trachyte, quartz monzonite porphyry, granite diorite porphyry, rhyolite porphyry, and quartz porphyry. These rocks occur as vein-like bodies sporadically distributed within volcanic rocks and granites in and around the mining area. Within the region, the Middle Jurassic Tamulangou Formation (J2t) primarily comprises intermediate–mafic volcanic rocks and volcanic lavas, while the Upper Jurassic Manketou’ebo Formation (J3m) consists of intermediate–felsic volcanic rocks, pyroclastic rocks, and lavas. Fractures within the volcanic strata are filled with quartz porphyry and quartz veins.
3. Mining Geology
According to the exploration data, the proven silver metal reserves in the deposit exceed 2000 tons, with silver ore resources reaching 10.36 million tons, indicating a truly enormous resource scale [,]. The stratigraphy exposed in the mining area is relatively simple, primarily consisting of the Middle Jurassic and Upper Jurassic formations, along with Quaternary sediments (Figure 2). The Middle Jurassic Tamulangou Formation (J2t) is extensively exposed across the region, accounting for approximately 80% of the mining area. It is widely distributed from north to south and comprises a suite of intermediate–mafic volcanic rocks, including lavas, pyroclastic rocks, and volcanic–sedimentary clastic rock. The main rock types are basaltic andesite, trachyandesite, andesite, andesitic welded tuff, and andesitic lithic-crystal tuff. The southwestern sector of the mining area contains outcrops of the Upper Jurassic Manketou’ebo Formation (J3m), with a small distribution area and sporadic distribution in the central area. Its main rock types are tuff, rhyolite, and other acidic volcanic rocks, which exhibit an angular unconformity with the underlying Tamulangou Formation (J2t) []. Fracture structure is more developed in the mining area, which is the primary rock and ore-controlling tectonics, while fold structures are underdeveloped. The major large-scale fault structures are dominated by the NW-trending Hanwula Fault and the NE-trending Erentaolegai Fault. The former strikes NW-SE, while the latter strikes NE-SW. Within the triangular zone formed by these two faults, there are mainly three groups of tectonic structures, all of which are in the form of En echelon vein-type patterns, directly controlling the spreading of silver ore bodies in the Erentaolegai mining area. They are controlled by the NW-trending Erentaolegai Faults (F9, F10) and the NE-trending Erentaolegai South Fracture (F6, F7, F8). The NW-trending faults (F9, F10) act as the primary ore-conducting structures in this area. The NNW–SN-trending faults (F1, F2) serve as ore-controlling and ore-reserve structures, with strong surrounding rock alteration. In contrast, the NE-trending faults (F6, F7, F8) display weak surrounding rock alteration. They are post-mineralization faults that do not disrupt the ore bodies [,,]. In the northwestern part of the mining area, stock-like intermediate–acid intrusive rocks are observed, with the intrusions cutting through the andesitic strata of the Tamulangou Formation. Intrusive rocks are Yanshan late quartz porphyry and granite. The Late Yanshanian quartz porphyry occurs as vein-like bodies sporadically distributed within volcanic rocks and granites in and around the mining area. Yanshanian granite is a multi-stage intrusion of the igneous complex, the main rock types are biotite syenogranite, granodiorite. Intense alteration is developed along the contact zones and adjacent areas. Feng et al. (2017) constrained the formation age of the ore-hosting trachyandesite to 173.4 ± 4.6 Ma (Middle Jurassic) [], while Xu et al. (2014) determined a SHRIMP zircon U-Pb age of 138.6 ± 2.3 Ma (Early Cretaceous) for the mineralized quartz porphyry closely associated with ore-forming processes []. This reveals that mineralization was intimately linked to Early Cretaceous magmatic events (represented by the quartz porphyry) derived from deep-seated granitic magmatism, indicating the principal ore-forming episode occurred during the Early Cretaceous period.
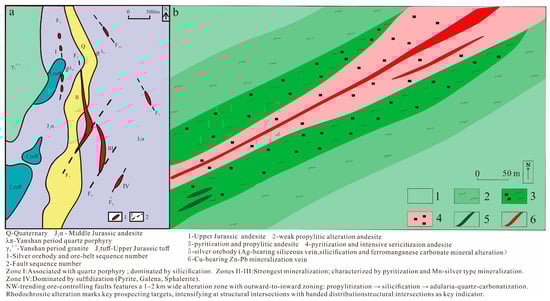
Figure 2.
(a) Geological sketch map of the Erentaolegai Silver Deposit; (b) Ore body III, detailed geological map of the Erentaolegai Silver Deposit.
The alteration characteristics associated with silver mineralization are well expressed in the mine area. Alteration is particularly concentrated along the ore-controlling faults, with surrounding rock alteration zones extending 1 to 2 km (km) in width, which can be divided into three stages: The first stage is the propylitization, which is wide and distributed at the outer edge of the mineralized zones, and weakens outward; the second stage is mainly silicification, which is less widespread than the propylitization. From the mineralization zones outward, the alteration exhibits a distinct zonation: Silicified quartz vein-strong silicification zone-sericited silicification zone-silicified sericitization zone, silver ore mineralization, exhibiting quartz vein-type characteristics, predominantly associated with strong silicification; the third stage is adularia–quartz–carbonatization alteration, which is mainly seen in the F7 fault zone. Silver mineralization is closely associated with manganese mineralization, manifested by vein-like silver mineralization crosscutting andesite. The surrounding rock alteration observed in the deposit includes silicification, epidotization, chloritization, carbonatization, and rhodochrosite mineralization. Among them, the rhodochrosite mineralization is the most significant, on both sides of which silver ore bodies are often produced. Rhodochrosite is therefore an important mineralization marker for the exploration of silver ore in this area. Spatially, hydrothermal alteration forms outward-diffusing and superimposed around the principal ore-controlling structures. The intersection zones of mineralized segments exhibit the most intense alteration, which gradually diminishes laterally. All alteration zones display banded distributions [,].
The ore bodies are predominantly hosted within the structural alteration zones of the Middle Jurassic Tamulangou Formation (J2t) volcanic rocks, strictly controlled by fault structures. Each ore body is generally composed of several quartz veins, with a quartz vein core transitioning outward to net vein-like strongly silicified andesite (Figure 2b) []. More than 10 vein-shaped industrial ore bodies have been found in the mining area, among which ore zones II, III, and IV ore bodies are larger in scale, and the rest are small ore bodies. The ore zone II is located in the central part of the mining area, which is controlled by the NNW-SN-trending Fault F2 and its branch fractures, and is approximately 1000 m (m) in length. Aligned with fault planes, there are quartz veins and manganese–silica type ore bodies (composed predominantly of manganese oxides and quartz). The silver minerals are related to quartz veins, and net vein-like strongly silicified and sericitized andesite. Ore zone III is located south of ore zone II, controlled by the NE-trending South Erentaolegai Fault F8 and its branch fractures. It exhibits a morphology similar to ore zone II, extending approximately 800 m in length. Manganese–silica type ore bodies occur on the upper plate of local quartz veins, with widths of 1 to 3 m, lengths of 10 to 150 m, and vein-like to lenticular shapes. The ore zone IV is produced in the south side of the mining area, controlled by the NE-oriented Erentaolegai South Fracture F6 and its branch fractures. The total length of the ore zone is about 300 m. Within this zone, manganese–silica assemblages intergrow with quartz veins along fracture-controlled pathways, with individual quartz veins measuring 10 to 30 m in length.
There are three main types of ore mineralization: manganese–silver type, silicified quartz vein type, and sulfide type. The manganese–silver type ore is mainly of supergene origin, while the other two types are products of hydrothermal processes. Based on mineral assemblages, spatial crosscutting relationships of veins, and ore types, the entire mineralization process is divided into two metallogenic periods: hydrothermal and supergene. The hydrothermal period is further subdivided into three mineralization stages (Figure 3). Stage I: Pyrite–Quartz Stage; Stage II: Sulfide–Quartz Stage; Stage III: Quartz–Manganese Carbonate Stage.
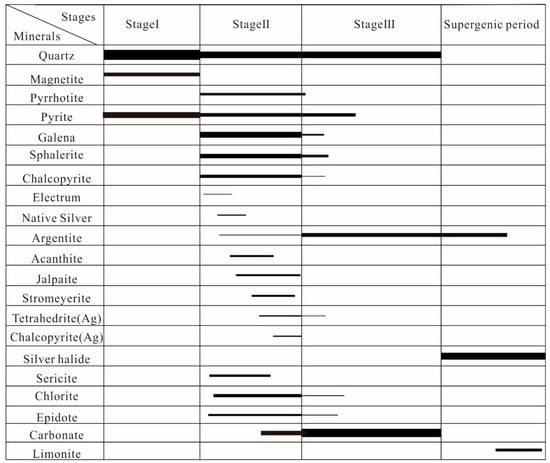
Figure 3.
Paragenetic sequence of alteration and mineralization for the Erentaolegai Silver Deposit.
The Pyrite–Quartz Stage is characterized by strong silicification and pyrite mineralization, forming large-scale milky-white quartz veins, in which automorphic-semiautomorphic cubic pyrites are developed (Figure 4A–C).
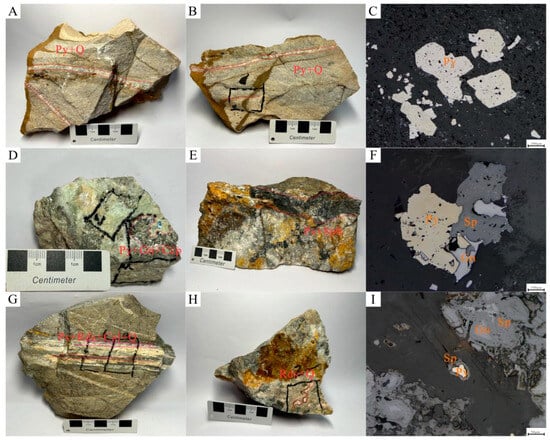
Figure 4.
Photomicrographs and hand specimens of the Erentaolegai silver deposit. (A,B): Early quartz–pyrite veins crosscutting with light-colored andesite; (C): Pyrite in quartz; (D): Calcite and fluorite interspersed within andesite; (E): Psilomelane veins crosscutting early-stage quartz–pyrite veins; (F): Sulfide minerals intergrown within quartz; (G): Veins of psilomelane, rhodochrosite, and calcite crosscutting andesite; (H): Rhodochrosite veins crosscutting both andesite and early-stage quartz; (I): Sphalerite contains pyrite; Py: pyrite; Q: quartz; Gn: galena; Sp: sphalerite; Ps: psilomelane; Ccp: chalcopyrite; Rds: rhodochrosite; Cal: calcite.
The Sulfide–Quartz Stage is characterized by strong silicification and a variety of sulfide assemblages, including pyrite, galena, sphalerite, and minor chalcopyrite. The development of sulfide-bearing quartz veins of varying widths cutting through earlier quartz veins. Their quartz features are colorless and transparent or dark gray. Pyrite, galena, and sphalerite occur in relatively high abundance, predominantly as disseminated grains, aggregates, or veinlets, discontinuously distributed within quartz veins. Chalcopyrite forms irregular grains sporadically enclosed within sphalerite or occupying intergranular spaces of quartz. Minor amounts of sphalerite are coexisting with pyrite in quartz veins. (Figure 4D–F).
The Quartz–Manganese Carbonate Stage is characterized by numerous quartz–manganese carbonate veins and minor metal sulfides (Figure 4G–I).
4. Samples and Analytical Methods
First, representative ore samples were selected for detailed petrographic studies, and then these samples were selected for fluid inclusion analysis, H-O isotope analysis, and in situ sulfur isotope analysis of sulfide.
Fluid inclusion microthermometry was performed at the Fluid Inclusions Laboratory of the Collaborative Innovation Center for Strategic Mineral Resources Exploration, China University of Geosciences (Wuhan). The microthermometry was conducted using a Linkam THMS 600 heating-freezing stage (UK), with a temperature range of −196 to +600 °C. The error of determination in the range of −120 to −70 °C is ±0.5 °C, the error of determination in the range of −70 to +100 °C is better than ±0.2 °C, and the error of determination between 100 to 500 °C is ±2 °C. Before measurements, the stage was calibrated using synthetic fluid inclusion standards from FLUID INC (USA). The temperature control rate for heating and freezing was 5 to 30 °C/min. Controlled heating rates between 0.1 and 0.5 degrees Celsius per minute were applied across the phase transition regime.
The H-O isotope analysis of quartz was completed by Guangzhou Tuoyan Testing Technology Co., Ltd., Guangzhou, China. The method for analyzing hydrogen isotopes in fluid inclusions is as follows: 10–20 mg of 40–60 mesh quartz grains are dried with tin capsules at 90 °C for 12 h. The encapsulated samples are then automatically introduced into a high-temperature pyrolysis furnace (1420 °C, Flash, EA, Thermo. The equipment was sourced from Thermo Fisher Scientific (Waltham, MA, USA), a corporation headquartered in the United States.) packed with glassy carbon. Liberated inclusion water undergoes reaction with carbon to generate CO and H2, which are transported via 5N ultra-pure He carrier gas through a chromatographic column to a Thermo Fisher 253 Plus isotope ratio mass spectrometer for δD measurement. Accuracy in testing international benchmark substances (biotite USGS57, δDVSMOW = −91‰; muscovite USGS58, δDVSMOW = −28‰; polyethylene, IAEA-CH-7, δDVSMOW = −100.3‰) is better than 1‰. The oxygen isotope analysis of silicates and oxides involves grinding samples to 200-mesh, weighing 6 mg of purified oxygen-equivalent silicate or quartz, and baking at 105 °C for 12 h. Oxygen extraction follows the BrF5 method [], where minerals react with BrF5 under vacuum at 580 °C. Liberated O2 is collected using 5Å molecular sieve traps and analyzed via gas isotope ratio mass spectrometry (253 Plus, Thermo Fisher) relative to V-SMOW, achieving external precision better than ±0.2‰ for standards.
In situ sulfur isotope analysis of sulfide was performed at the State Key Laboratory of Geological Processes and Mineral Resources, China University of Geosciences (Wuhan). The analyzing instrument was a Nu Plasma II multi-collector inductively coupled mass spectrometry (Nu instruments, Wrexham, UK) using a laser model RESOlution-S155 193 nm ArF excimer laser (Applied Spectra, Sacramento, CA, USA); the laser spot diameter was 33 μm, the denudation frequency was 10 Hz, and the energy density was 3.5 J/cm2. During laser ablation, high-purity helium was used as the carrier gas, and high-purity argon was introduced as a makeup gas to adjust the instrument’s sensitivity. The helium–argon mixture with minor hydrogen was transported into the mass spectrometer. Each analytical cycle lasted 120 s and comprised the following: (1) 20 s of background signal acquisition, (2) 40 s of sample signal collection during ablation, and (3) 60 s for ablation cell and line purge. The sample analysis process was performed using the standard sample bracketing (SSB) method for mass discrimination correction, and the in-house laboratory specimen WS−1 (δ34SV-CDT = 0.3 ± 0.1‰; []) was used as an external standard for sulfur isotope fractionation correction with an analytical precision (2σ) of about ±0.3‰.
5. Fluid Inclusions
5.1. Fluid Inclusion Petrography
Petrographic observations of fluid inclusions on samples from the Erentaolegai silver deposit were conducted. The results show that fluid inclusions exhibit widespread occurrence across all specimens, including primary inclusions and secondary inclusions []. Inclusions selected for this study are all primary inclusions, dominated by liquid-rich fluid inclusions. Because this study focuses on deposit genesis, secondary inclusions were excluded due to their physicochemical conditions being unrelated to primary mineralization events, though they are potentially informative on late-stage ore modification. The fluid inclusions’ petrographic features in the three metallogenic stages are similar (Figure 5). In Stage I, quartz primarily trapped vapor–liquid two-phase fluid inclusions. These inclusions’ long axes range from 2 to 20 μm (mostly 5–15 μm), and the vapor–liquid ratios are mostly 17 to 37%. They are primarily elliptical to irregular in shape and commonly occur in densely clustered distributions(Figure 5a,b). In Stage II, fluorite mainly trapped vapor–liquid two-phase fluid inclusions, which are slightly fewer in number compared to those in quartz. These inclusions’ long axes range from 2 to 18 μm (mostly 5–10 μm), and the vapor–liquid ratios are mostly 10 to 30%. They are predominantly elongated, elliptical, and irregular in shape and commonly occur individually or in small clusters (Figure 5c,d). In Stage III, quartz primarily trapped vapor–liquid two-phase fluid inclusions. These inclusions’ long axes range from 2 to 18 μm (mostly 5–10 μm), and the vapor–liquid ratios are mostly 10 to 30%. They are predominantly circular, elliptical, and irregular in shape and commonly occur in densely clustered groups (Figure 5e,f).
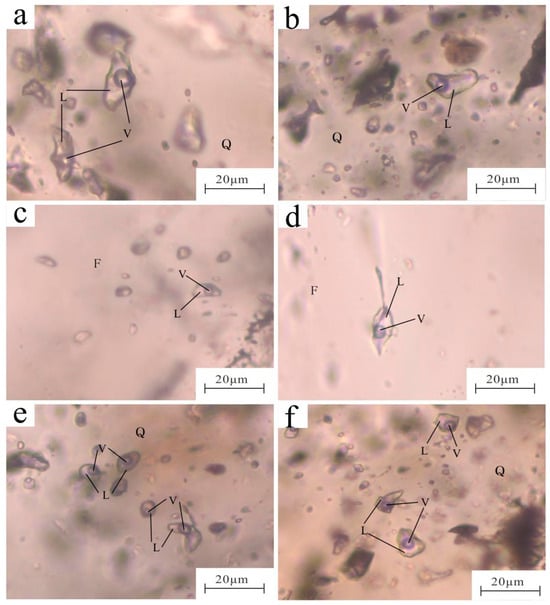
Figure 5.
Photomicrographs of fluid inclusions from the Erentaolegai silver deposit. (a,b): stage I fluid inclusions; (c,d): stage II fluid inclusions; (e,f): stage III fluid inclusions; V: vapor phase; L: liquid phase; Q: quartz; F: fluorite.
No significant correlation is observed between inclusion sizes and host mineral types, but the vapor–liquid ratios are generally low (<0.5), and all inclusions homogenize entirely to the liquid phase during heating, reflecting a relatively stable fluid environment. Comprehensive petrographic features show that the fluid inclusions in this area are mainly vapor–liquid two-phase inclusions with a low vapor–liquid ratio. These characteristics align with the typical characteristics of the medium and low temperature hydrothermal mineralizing fluids [].
5.2. Laser Raman Spectroscopy
Laser Raman spectroscopy was conducted on vapor–liquid two-phase fluid inclusions from the three metallogenic stages of the Erentaolegai deposit. The test targeted both vapor and liquid phases of inclusions to determine their chemical compositions. The results (Figure 6) show that fluid inclusions in Stage I quartz, Stage II fluorite, and Stage III quartz exhibit vapor and liquid phases exclusively dominated by H2O. The compositional homogeneity across all stages confirms that the ore-forming fluids belong to the H2O-NaCl system. No fluid inclusions containing CO2 were detected in any stage.
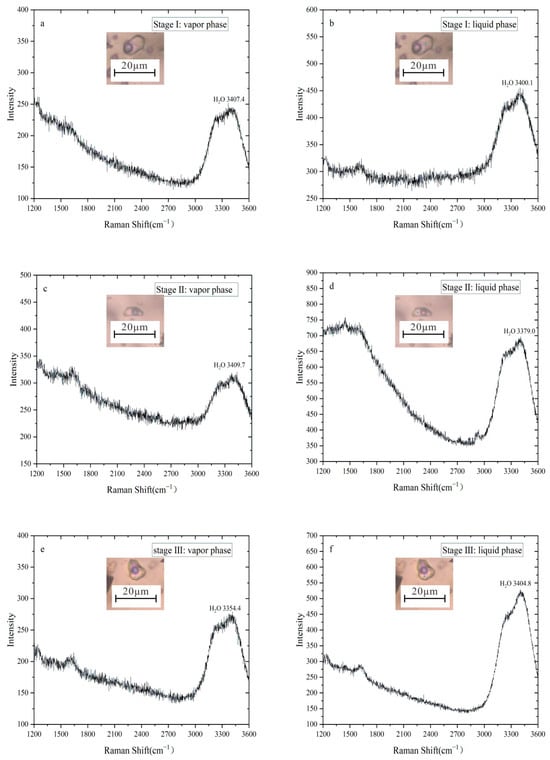
Figure 6.
Laser Raman spectroscopy of fluid inclusions from the Erentaolegai silver deposit.
5.3. Microthermometry
A total of 107 vapor–liquid inclusions (V-L type) from three mineralization stages of the Erentaolegai deposit were analyzed by microthermometry. All the fluid inclusions are homogenized entirely to the liquid phase. Salinity calculations for fluid inclusions are based on the freezing point–salinity equation for the H2O-NaCl system. (WNacl = 0.00 + 1.78Tm − 0.0442 + 0.00557 []) and the density was estimated using the Bodnar (1983) equation []. The homogenization temperatures and pressures of fluid inclusions are minimum estimates of trapping conditions []. Accurate determination of actual trapping temperatures requires pressure correction. However, due to the shallow mineralization depth of the Erentaolegai deposit, the pressure correction value is negligible. Based on the temperature–pressure relationship diagram for NaCl solutions of varying concentrations [], the correction for measured homogenization temperatures ranges from a few degrees to over ten degrees Celsius, which can be basically ignored. Consequently, in pressure–depth calculations, homogenization temperatures and pressures are approximated as equivalent to trapping temperatures and pressures. The mineralization pressure is estimated by using the empirical formula P = P0Th/T0 (105 Pa) (P0 = 219 + 2620WNacl (105 Pa), T0 = 374 + 920WNacl (°C)), and the mineralization depth is estimated by using the empirical formula (assuming a lithostatic pressure gradient of 30 MPa/km) H = P (Pa)/300 × 105 (km) []. All outcomes are in Table 1 and Figure 7. Data and calculations of microtemperature measurements:

Table 1.
Fluid inclusions microthermometric data from the Erentaolegai silver deposit.
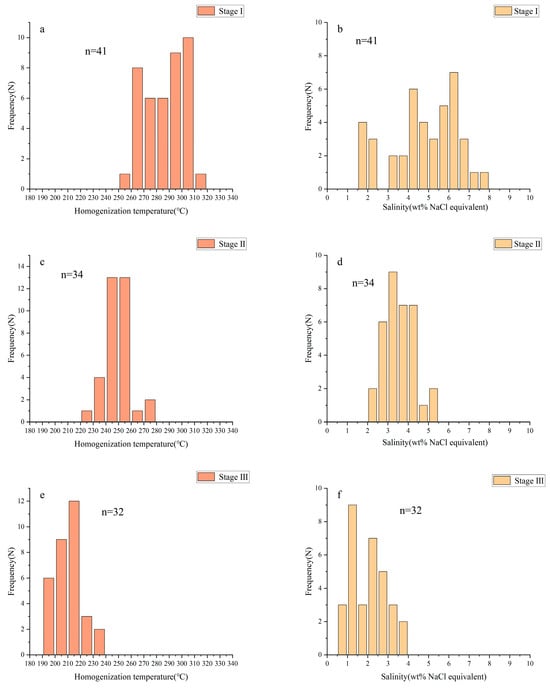
Figure 7.
Histograms of homogenization temperature (a,c,e) and salinity (b,d,f) of fluid inclusions at different stages in the Erentaolegai silver deposit.
Stage I: The homogenization temperature of fluid inclusions varied from 257 to 311 °C, with a mean value of 286 °C. The freezing points ranged from −1.1 to −5 °C with a mean value of −2.9 °C, corresponding salinities from 1.91 to 7.86 wt% NaCl equivalent with a mean value of 4.77%. Based on the measured homogenization temperatures and salinities, the fluid densities at this stage ranged from 0.75 to 0.83 g/cm3, with a mean value of 0.792 g/cm3. The mineralization pressure ranged from 17.6 to 29.5 MPa, with a mean value of 23.5 MPa, and the corresponding depth ranged from 0.59 to 0.98 km, with a mean value of 0.78 km.
Stage II: The homogenization temperature of fluid inclusions varied from 228 to 280 °C, with a mean value of 249 °C. The freezing points ranged from −1.2 to −3.3 °C with a mean value of −2.1 °C, corresponding salinities from 2.07 to 5.41 wt% NaCl equivalent with a mean value of 3.57%. The fluid densities at this stage ranged from 0.80 to 0.86 g/cm3, with a mean value of 0.834 g/cm3. The mineralization pressure ranged from 16.5 to 23.4 MPa, with a mean value of 19.1 MPa, and the corresponding depth ranged from 0.55 to 0.77 km, with a mean value of 0.63 km.
Stage III: The homogenization temperature of fluid inclusions varied from 194 to 238 °C, with a mean value of 210 °C. The freezing points ranged from −0.4 to −2.1 °C with a mean value of −2.0 °C, corresponding salinities from 0.70 to 3.55 wt% NaCl equivalent with a mean value of 2.0%. The fluid densities at this stage ranged from 0.85 to 0.89 g/cm3, with a mean value of 0.869 g/cm3. The mineralization pressure ranged from 12.2 to 18.0 MPa, with a mean value of 14.6 MPa, and the corresponding depth ranged from 0.41 to 0.60 km, with a mean value of 0.49 km.
5.4. H-O Isotopes
The H-O isotope results are shown in Table 2. The δ18O values of the mineralized fluids were obtained by calculations based on the quartz–water equilibrium formula: 1000 lnαquartz-water = 3.38 × 10⁶ T−2−3.40 [] and the rhodochrosite–water equilibrium formula: 1000lnαrhodochrosite-water = 4.19 × 10⁶ T−2−4.59 []. H-O isotopic analyses reveal the following: The δD values of the three quartz samples in stage I ranged from −141.5 to −121.3‰, the δ18O values ranged from 3.88 to 10.54‰, and the calculated δ18O values ranged from −3.53 to 2.96‰; The δD values of one quartz and one fluorite sample in stage II ranged from −132.4 to −128.4‰, the δ18O values ranged from −5.86 to 4.27‰, and the calculated δ18O values ranged from −5.86 to −4.77‰; The δD values of two rhodochrosite samples from stage III ranged from −88.2 to −86.3‰, the δ18O values ranged from −5.02 to −1.45‰, and the calculated δ18O values ranged from −18.2 to −14.6‰. The δD values gradually increased from phase I to phase III, while the δ18O values gradually decreased from phase I to phase III, shifting towards negative values. The δD-δ18O diagram shows that the data points of quartz and fluorite samples in stages I and II are fall between the primary magma water (δ18O ≈ +5.5‰~+10‰, δD ≈ −50‰~−80‰) and Meteoric water line (δD = 8δ18O + 10) [], which is similar to the H-O isotope data values measured by [] and []. Phase III rhodochrosite sample data points fall near the rain line, indicating migration of data points from magmatic water to the Meteoric water line.
Table 2.
H-O isotope data of the Erentaolegai silver deposit.
5.5. Sulfur Isotopes
As a key mineralizing element, the sulfur isotopic composition is an important indicator for revealing the evolution of mineralizing fluids and the origin of materials. Experimental samples cover pyrite, galena, sphalerite, and chalcopyrite, with a total of 28 sites for sulfur isotope testing. Sulfur isotope data are shown in Table 3 [,]. Sulfur isotope data reveal the following δ34S values: Pyrite: −0.4 to 4.0‰ (mean 2.7‰); Galena:−1.8 to 1.9‰ (mean 0.21‰); Sphalerite: −0.8 to 3.7‰ (mean 1.39‰); Chalcopyrite: −0.1 to 2.3‰ (mean 0.82‰).
Table 3.
Sulfur isotope data of the Erentaolegai silver deposit.
6. Discussion
The Erentaolegai deposit is situated in the southwestern segment of the Derbugan Fault Zone. Exposed strata are predominantly Middle Jurassic. NW-trending faults serve as the principal ore-controlling structures, with mineralization primarily hosted within structural alteration zones of Middle Jurassic volcanic rocks. Based on mineral assemblages, vein crosscutting relationships, and ore types, the mineralization is divided into two periods: hydrothermal and supergene. The hydrothermal period comprises three stages (Figure 3): Stage I: Pyrite–Quartz Stage; Stage II: Sulfide–Quartz Stage; Stage III: Quartz–Manganese Carbonate Stage.
6.1. Origin of the Ore-Forming Fluids
The petrographic observation and microtemperature measurement of the fluid inclusions show that the Erentaolegai silver deposit mainly contains vapor–liquid two-phase fluid inclusions. Fluid inclusions from the three metallogenic stages exhibit progressively decreasing homogenization temperatures with partial overlap, and all homogenize entirely to the liquid phase. The silver mineralization temperatures in the mining area are predominantly concentrated between 200 and 300 °C, and the homogenization temperatures of the main mineralization stages are between 194 and 238 °C, while temperatures exceeding 300 °C likely represent the precipitation of earlier-stage minerals. The calculation results show that the density of fluid inclusions from Stage I to Stage III is gradually increasing, the fluid density is 0.75 to 0.89 g/cm−3, and the salinity range is mainly restricted to the range 1 to 7 wt% NaCl equivalent. These results suggest that ore-forming fluids display medium–low temperature, low-density, and low-salinity. Mineralization pressure of this deposit ranges from 12.2 to 29.5 MPa, and mineralization depth is 0.41 to 0.98 km, indicating low-pressure and shallow-depth mineralization conditions.
The homogenization temperatures and salinities across the three metallogenic stages demonstrate a progressive decrease, with a statistically significant positive correlation between these parameters (Figure 8). These results indicate the ore-forming fluids mixed with low-temperature, low-salinity fluids (meteoric water) [,,,,]. H-O isotopes serve as tracers for the source of ore-forming fluids. δ18O and δD values are plotted on δD-δ18O diagrams to constrain the characteristics of fluid origins [,,]. The δD values of the Erentaolegai mineralized fluids range from −141.5 to −86.3‰, and the δ18O values range from −18.2 to 2.96‰.
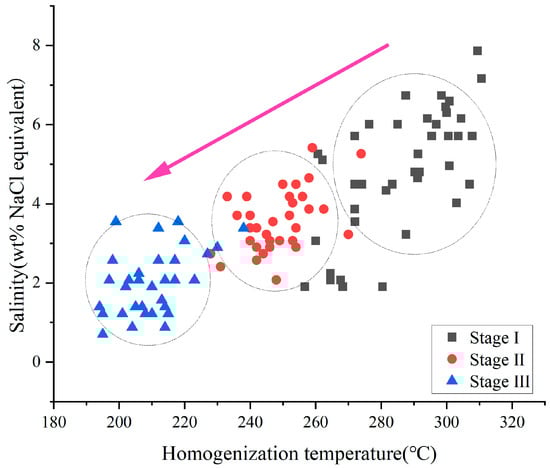
Figure 8.
Plots of homogenization temperature versus salinity at different stages of the Erentaolegai silver deposit.
Figure 9, Stage I and II data plot between the meteoric water line and the primary magmatic water field, while Stage III data cluster near the meteoric water line, implying that the ore-forming fluid is a mixture of magmatic fluids and meteoric water. The H-O isotopic compositions exhibit a marked oxygen isotope shift from early to late stages. Early-stage ore-forming fluids were influenced by circulating meteoric water during magmatic–hydrothermal ascent. The proportion of meteoric water involvement increased significantly in later stages, leading to a progressive decline in both homogenization temperatures and salinities throughout the mineralization process.
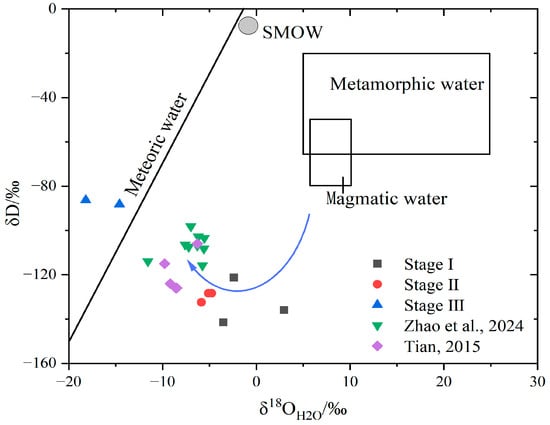
Figure 9.
δD-δ18O diagram of the Erentaolegai silver deposit. Metamorphic water field, magmatic water field, and meteoric water line are from Taylor (1974) [,,].
6.2. Source of Ore-Forming Elements
This paper explores the origin of ore-forming fluid materials by performing sulfur isotope analyses. Sulfur is an important complexing agent in hydrothermal mineralization systems and contributes significantly to controlling the migration, enrichment, and precipitation of metallic elements [,,,]. Systematic analysis of sulfur isotopic compositions (δ34S) can effectively trace sulfur sources of ore-forming environments and ore-forming fluids. In sulfur isotope studies, total δ34S values in mineralizing fluid (δ34SΣS) are a critical parameter for tracing sulfur sources. However, direct determination of δ34SΣS values in hydrothermal systems faces technical challenges [,,,]. Existing datasets demonstrate that δ34S values of sulfides are generally not equal to the δ34SΣS values. However, in systems lacking sulfate minerals and characterized by simple sulfide assemblages, the isotopic fractionation among the sulfides reaches an equilibrium state. Equilibrium precipitation would give a pyrite slightly enriched in 34S, and a galena slightly enriched in 32S, with chalcopyrite and sphalerite in between. Under such conditions, the δ34S values of sulfides approximate the δ34SΣS of the ore-forming fluids. [,,,,]. The Erentaolegai silver deposit lacks sulfate minerals, and the sulfide-bearing samples have a relatively simple assemblage. Sulfur predominantly existed as reduced species (HS−/H2S) in the ore-forming fluids. In this study, 28 pyrite samples yield a mean δ34S value of 2.7‰, 9 sphalerite samples 1.39‰, 5 chalcopyrite samples 0.82‰, and 10 galena samples 0.21‰. The sulfur isotopic sequence follows: δ34Spyrite > δ34Ssphalerite > δ34Schalcopyrite > δ34Sgalena, which is consistent with the sequence of sulfur isotope fractionation under thermodynamic equilibrium conditions [,]. Pyrite is slightly enriched in 34S, galena is slightly enriched in 32S, chalcopyrite and sphalerite display intermediate enrichment between them. At temperatures exceeding 300 °C, the amount of sulfur isotope fractionation is minimal. Therefore, δ34S of hydrothermal sulfides can approximately represent the δ34SΣS of the ore-forming fluids.
For both pyrite and galena, whether considering the overall trend or when coexisting in individual samples, their δ34S values consistently show pyrite > galena. Using the sulfur isotope fractionation equation for coexisting pyrite–galena mineral pairs (1000lnαpyrite-galena = 1.03 × 10⁶/T2 []), we calculated sulfur isotopic equilibrium temperatures range from 195 °C to 270 °C, with an average temperature of 230 °C. This result is generally consistent with fluid inclusion homogenization temperatures.
Sulfur in hydrothermal systems is generally derived from three main sources: ① Mantle-derived: δ34S values usually range from −5 to +5‰, mostly concentrated in the range of −3 to +3‰. ② Marine–seawater: δ34S mean value of +20‰, variation range +10 to +30‰, ③ Crust rocks: δ34S values are mainly in the range of −50‰ to 50‰ [,,]. The δ34S values of metallic sulfides range from −1.8 to +4.0‰, with an overall mean of +1.7‰, and a small deviation from 0 (Figure 10). Notably, the majority of samples cluster within the −3 to +3‰ interval, consistent with a typical mantle-derived sulfur signature. The maximum difference is 5.8‰ (<10‰), indicating that the sulfur source of the mineralization system is probably a single source []. It can be inferred that the sulfur of the Erentaolegai silver deposit may be dominated by the deep magmatic source.
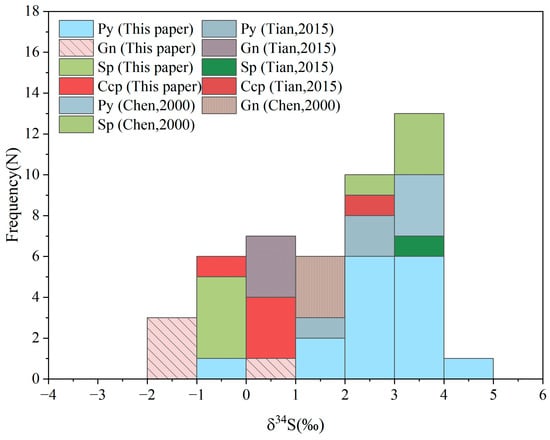
Figure 10.
Histogram of sulfur isotope compositions of sulfides from the Erentaolegai deposit [,].
6.3. Mineralization Age
Quartz porphyry is not only the main carrier of ore-forming fluids in the Erentaolegai silver deposit, but also provides a key constraint for the metallogenic age. Differentiation of granitic magma drives the enrichment of silver. With the development of magmatic evolution, the Ag content increased significantly from granite (0.32 × 10⁻⁶) to quartz porphyry (1.95 × 10⁻⁶) and finally reached a peak in quartz veins during the metallogenic period (6.01 × 10⁻⁶). This gradient growth indicates that the mineralization of the Erentaolegai silver deposit is closely related to the quartz porphyry veins []. Xu et al. (2014) carried out SHRIMP zircon U-Pb dating on the quartz porphyry veins in the mining area and obtained an age of 138.6 ± 2.3 Ma [], which indicates formation during the Early Cretaceous stage. Based on the close spatial association between ore bodies and quartz porphyry veins, it is inferred that mineralization occurred at the same time as or slightly later than the formation of the quartz porphyry, which further constrains the main mineralization period of the Erentaolegai silver deposits to be the Early Cretaceous early stage (≤138 Ma).
6.4. Ore Genesis
The ore body of the Erentaolegai silver deposit is mainly hosted in the volcanic rock strata of the Middle Jurassic Tamolangou Formation (J3t), and is controlled by the NW direction and fault structure. The mining area exhibits extensively developed alteration assemblages, including propylitization, silicification, and rhodochrosite mineralization, accompanied by carbonation, adularization, sericitization, chloritization, and Pb-Zn mineralization. These alteration types are typical of medium–low temperature hydrothermal systems, suggesting that mineralization occurred in a relatively low-temperature environment. Fluid inclusion studies show that the ore-forming fluids have homogenization temperatures of 200–300 °C, salinities of 1–7 wt% NaCl equivalent, and densities of 0.75–0.89 g/cm3, with medium–low temperature, low-salinity, and medium-density characteristics consistent with typical epithermal deposits [,,,]. Moreover, the paragenetic assemblage of stage-III, with Ag-rich manganese–carbonate–quartz has been identified elsewhere as a low-T epithermal style mineralisation of intermediate sulfidation, i.e., the Drama deposit, Northern Greece []. While this specific assemblage occurs in an intermediate sulfidation setting at Drama deposit, manganese–carbonate gangue is more commonly recognized as a distinctive feature of low-sulfidation (adularia-sericite) epithermal deposits, i.e., Round Mountain, USA, Cirotan, Indonesia, Orcopampa, Peru, and Cavnic, Romania [,].
Fluid inclusions at all stages existed mainly in the form of fluid-rich two-phase, in which the gas-phase component was dominated by H2O, and there was a significant lack of CO2 inclusions. This phenomenon suggests that the precipitation of silver is mainly due to the mixing of meteoric water []. H-O isotope analyses also reveal that meteoric water was continuously mixed, circulated, and gradually dominated throughout the process of mineralization. (Figure 8) In addition, the positive correlation between homogenization temperatures and salinities further indicates meteoric water influx (Figure 9). These observations suggest that ascending magmatic–hydrothermal fluids were continuously mixed with meteoric water. As the mixing ratio increased, the fluid temperature decreased and the salinity diluted, prompting the silver minerals to precipitate at shallow depths (0.59 to 0.98 km).
7. Conclusions
The Erentaolegai silver deposit has three mineralization stages: Stage I: Pyrite–Quartz Stage; Stage II: Sulfide–Quartz Stage; and Stage III: Quartz–Manganese Carbonate Stage.
- All stages of mineralization are dominated by vapor–liquid two-phase fluid inclusions, with their homogenization temperatures mainly concentrated between 200~300 °C, salinities mostly between 1~7 wt% NaCl equivalent, and fluid densities of 0.75~0.89 g/cm3. The mineralization occurred at shallow depths of 0.41–0.98 km, consistent with a typical epithermal hydrothermal system.
- Isotopic data indicate that the ore-forming fluids were predominantly a mixture of magmatic water and circulating meteoric water in the early stages, with meteoric water becoming dominant in the later stages. Sulfur isotopes indicate that ore-forming materials were derived primarily from deep magmatic sources. Mixing of circulating meteoric water, resulting in fluid cooling, is presumably the main mechanism for the precipitation of silver minerals.
- The main mineralization period of Erentaolegai silver deposits is the Early Cretaceous. Hydrothermal zoning (reflected in mineralization stages) is controlled by fluid temperature evolution (recorded in fluid inclusions), while stable isotopes (H-O-S) evidence that the evolutionary dynamics are derived from mixing between magmatic water and meteoric water.
- The comprehensive geological background, fluid characteristics, and isotopic evidence classify the Erentaolegai silver deposit as a low-sulfidation epithermal silver deposit.
Author Contributions
Conceptualization, Y.Z., W.M. and Z.G.; methodology, L.W.; validation, W.M.; investigation, Z.L. and S.Z.; resources, S.Z.; data curation, X.D. and J.X.; writing—original draft preparation, Y.Z.; writing—review and editing, W.M. All authors have read and agreed to the published version of the manuscript.
Funding
Support for the research was derived from the Geological Survey Special Project of the Inner Mongolia Natural Resources Department (Grant No. 150000235053210000201), Natural Science Foundation of Inner Mongolia Autonomous Region of China (2025MS04058), the Central Government Guidance Fund for Local Science and Technology Development Project of the Inner Mongolia Science and Technology Department (Grant No. 2022ZY0084), and the Research Initiation of Inner Mongolia University of Technology (Grant No. DC2200000905).
Data Availability Statement
All data are available from the corresponding author upon reasonable request.
Conflicts of Interest
The authors declare no conflicts of interest.
References
- Tian, J. Mineralization and Alteration Geological Characteristics Study in Erentaolegai Silver Deposit, Inner Mongolia. Master’s Thesis, China University of Geosciences, Beijing, China, 2015. (In Chinese). [Google Scholar]
- Zhao, Y.; Lv, J.C.; Zhang, P.; Zhang, D.B.; Shen, X.; Bi, Z.W. Characterization and Significance of Orogenic Fluids at the Deerbuer Lead-Zinc-Silver Deposit in the Northern Part of the Greater Khingan Range. Acta Geol. Sin. 2018, 92, 142–153. (In Chinese) [Google Scholar]
- Li, T.G.; Wu, G.; Liu, J.; Wang, G.R.; Hu, Y.Q.; Zhang, Y.F.; Luo, D.F.; Mao, Z.H.; Xu, B. Geochronology, fluid inclusions and isotopic characteristics of the Chaganbulagen Pb-Zn-Ag deposit, Inner Mongolia, China. Lithos 2016, 261, 340–355. [Google Scholar] [CrossRef]
- Chen, X.; Zhang, G. Isotope geochemistry of Erentaolegai silver deposit, Inner Mongolia, China. Chin. J. Geochem. 2004, 23, 71–80. [Google Scholar] [CrossRef]
- Xu, L.Q.; Liu, C.; Deng, J.F.; Li, N.; Dai, M.; Bai, L.B. Geochemical characteristics and zircon U-Pb SHRIMP age of igneous rocks in Erentaolegai silver deposit, Inner Mongolia. Acta Petrol. Sin. 2014, 30, 3203–3212. (In Chinese) [Google Scholar]
- Sngor, A.M.C.; Natalin, B. Natalin Paleotectonics of Asia: Fragments of a synthesis. Tecton. Evol. Asia 1996, 486–640. [Google Scholar]
- Liang, H.D.; Gao, R.; Xue, S.; Yang, Z. Lithospheric electrical structure between the Erguna and Xing’an blocks: Evidence from broadband and long period magnetotelluric data. Phys. Earth Planet. Inter. 2020, 308, 106586. [Google Scholar] [CrossRef]
- Wu, F.Y.; Sun, D.Y.; Ge, W.C.; Zhang, Y.B.; Grant, M.L.; Wilde, S.A.; Jahn, B.M. Geochronology of the Phanerozoic granitoids in northeastern China. J. Asian Earth Sci. 2011, 41, 1–30. [Google Scholar] [CrossRef]
- Xu, W.L.; Pei, F.P.; Wang, F.; Meng, E.; Ji, W.Q.; Yang, D.B.; Wang, W. Spatial-temporal relationships of Mesozoic volcanic rocks in NE China: Constraints on tectonic overprinting and transformations between multiple tectonic regimes. J. Asian Earth Sci. 2013, 74, 167–193. [Google Scholar] [CrossRef]
- Tomurtogoo, O.; Windley, B.F.; Kröner, A.; Badarch, G.; Liu, D.Y. Zircon age and occurrence of the Adaatsag ophiolite and Muron shear zone, central Mongolia: Constraints on the evolution of the Mongol–Okhotsk ocean, suture and orogen. J. Geol. Soc. 2005, 162, 125–134. [Google Scholar] [CrossRef]
- Kravchinsky, V.A.; Cogné, J.-P.; Harbert, W.P.; Kuzmin, M.I. Evolution of the Mongol-Okhotsk Ocean as constrained by new palaeomagnetic data from the Mongol-Okhotsk Suture zone, Siberia. Geophys. J. Int. 2002, 148, 34–57. [Google Scholar] [CrossRef]
- Tang, J.; Xu, W.L.; Wang, F.; Wang, W.; Xu, M.J.; Zhang, Y.H. Geochronology and geochemistry of Early–Middle Triassic magmatism in the Erguna Massif, NE China: Constraints on the tectonic evolution of the Mongol-Okhotsk Ocean. Lithos 2014, 184–187, 1–16. [Google Scholar] [CrossRef]
- Chen, G.Z.; Wu, G.; Li, T.G.; Liu, R.L.; Li, R.H.; Li, Y.L.; Yang, F. Mineralization of the Daolundaba Cu–Sn–W–Ag deposit in the southern Great Xing’an Range, China: Constraints from geochronology, geochemistry, and Hf isotope. Ore Geol. Rev. 2021, 133, 104117. [Google Scholar] [CrossRef]
- Zheng, W.B.; Ji, X.; Tang, M.; Chen, Z.G.; Zhang, Z.Q.; Wang, Q.C. An Early Cretaceous Tin-polymetallic system: The Baiyinchagan giant deposit in the southern Great Xing’an Range, North China. Ore Geol. Rev. 2025, 179, 106527. [Google Scholar] [CrossRef]
- Shu, Q.H.; Chang, Z.S.; Mavrogenes, J. Fluid compositions reveal fluid nature, metal deposition mechanisms, and mineralization potential: An example at the Haobugao Zn-Pb skarn, China. Geology 2020, 49, 473–477. [Google Scholar] [CrossRef]
- Zheng, H.; Sun, X.M.; Zhu, D.F.; Tian, J.X.; Song, H.; Wang, Y.D.; Zhang, X.Q. The structural characteristics, age of origin, and tectonic attribute of the Erguna Fault, NE China. Sci. China Earth Sci. 2015, 58, 1553–1565. [Google Scholar] [CrossRef]
- Liang, C.Y.; Liu, Y.J.; Zheng, C.Q.; Li, W.; Li, W.M.; Neubauer, F.; Zhang, Q.; Chen, Z.X.; Zhang, D. Deformation of granitic rocks within Derbugan Fault belt, Erguna Massif, Northeast China: Implication of the subduction of Mongol-Okhotsk oceanic plate. Geol. J. 2020, 55, 4159–4183. [Google Scholar] [CrossRef]
- Mao, A.Q.; Sun, D.Y.; Gou, J.; Zheng, H. Genesis of Early-Middle Jurassic Intrusive Rocks in the Erguna Block (NE China) in Response to the Late-Stage Southward Subduction of the Mongol-Okhotsk Oceanic Plate: Constraints from Geochemistry and Zircon U-Pb Geochronology and Lu-Hf Isotopes. Minerals 2020, 10, 372. [Google Scholar] [CrossRef]
- Liu, F.; Yang, X.L.; Xia, F.H. Inner Mongolia xinyouqi Erentaolegai Silver magnetic anomalies and Geological Prospecting Analysis. World Nonferrous Met. 2016, 24, 188–191. (In Chinese) [Google Scholar]
- Gou, J.; Sun, D.Y.; Ren, Y.S.; Liu, Y.J.; Zhang, S.Y.; Fu, C.L.; Wang, T.H.; Wu, P.F.; Liu, X.M. Petrogenesis and geodynamic setting of Neoproterozoic and Late Paleozoic magmatism in the Manzhouli–Erguna area of Inner Mongolia, China: Geochronological, geochemical and Hf isotopic evidence. J. Asian Earth Sci. 2012, 67–78, 114–137. [Google Scholar] [CrossRef]
- Lv, Z.C.; Zhang, P.P.; Liu, C.Q.; Liu, J.J. Mineralogical Characteristics of Silver Minerals in E’rentaolegai Silver Deposit. Geol. Geochem. 2000, 3, 41–47. (In Chinese) [Google Scholar]
- He, B.L. Characteristics and Genesis of the Erentaolegai Silver Deposit in Xinyouqi Banner, Inner Mongolia. Technol. Bus. 2015, 15, 107–108. (In Chinese) [Google Scholar]
- Chen, X.; Li, H.N.; Duan, G.Z. Origin of the Erentaolegai Granite and Its Relation to Silver Deposits, Inner Mongolia. Miner. Resour. Geol. 1997, 2, 20–27. (In Chinese) [Google Scholar]
- Feng, Y.Y.; Sun, J.G.; Zhu, J.Q.; Gu, A.L.; Liu, C.; Yang, M.; Liu, Y. Petrogenesis and Geological Implications of Volcanic Rocks in the Erentaolegai Silver-Polymetallic Deposit, West Slope of the Great Xing’an Range: Zircon U-Pb Geochronology and Geochemistry. World Geol. 2017, 36, 118–134. (In Chinese) [Google Scholar]
- Zhang, Q.; Dong, Z.S.; Zhan, X.Z. Geochemical Marks of Metallogenesis of the Erentaolegai Silver Deposit. Acta Mineral. Sin. 1996, 2, 152–157. (In Chinese) [Google Scholar]
- Qiao, L.L.; Xia, F.H.; Liu, Y. Inner Mongolia frontal RenTao periphery of cover silver mining area physical and chemical characteristics and prospecting prediction. World Nonferrous Met. 2016, 5, 118–120. (In Chinese) [Google Scholar]
- Clayton, R.N.; Mayeda, T.K. The use of bromine pentafluoride in the extraction of oxygen from oxides and silicates for isotopic analysis. Geochim. Cosmochim. Acta 1963, 27, 43–52. [Google Scholar] [CrossRef]
- Zhu, Z.Y.; Jiang, S.Y.; Ciobanu, C.L.; Yang, T.; Cook, N.J. Sulfur isotope fractionation in pyrite during laser ablation: Implications for laser ablation multiple collector inductively coupled plasma mass spectrometry mapping. Chem. Geol. 2017, 450, 223–234. [Google Scholar] [CrossRef]
- Roedder, E. Fluid Inclusions. Rev. Miner. 1984, 12, 644. [Google Scholar]
- Hedenquist, J.W.; Arribas, R.A.; Gonzalez-Urien, E. Exploration for Epithermal Gold Deposits. Rev. Econ. Geol. 2000, 13, 245–277. [Google Scholar]
- Hall, D.L.; Sterner, S.M.; Bodnar, R.J. Freezing point depression of NaCl-KCl-H2O solutions. Econ. Geol. 1988, 83, 197–202. [Google Scholar] [CrossRef]
- Bodnar, R.J. A method of calculating fluid inclusion volumes based on vapor bubble diameters and P-V-T-X properties of inclusion fluids. Econ. Geol. 1983, 78, 535–542. [Google Scholar] [CrossRef]
- Rusk, B.G.; Reed, M.H.; Dilles, J.H. Fluid Inclusion Evidence for Magmatic-Hydrothermal Fluid Evolution in the Porphyry Copper-Molybdenum Deposit at Butte, Montana. Econ. Geol. 2008, 103, 307–334. [Google Scholar] [CrossRef]
- Potter, R.W. Pressure corrections for fluid-inclusion homogenization temperatures based on the volumetric properties of the system NaCl-H2O. J. Res. U.S. Geol. Surv. 1977, 5, 603–607. [Google Scholar]
- Shao, J.L. Mineralogy of Gold Ore Exploration. China Univ. Geosci. Press. 1988, 2, 46–58. (In Chinese) [Google Scholar]
- Clayton, R.N.; O’Neil, J.R.; Mayeda, T.K. Oxygen isotope exchange between quartz and water. J. Geophys. Res. 1972, 77, 3057–3067. [Google Scholar] [CrossRef]
- Zheng, Y.-F. Oxygen isotope fractionation in carbonate and sulfate minerals. Geochem. J. 1999, 33, 109–126. [Google Scholar] [CrossRef]
- Sheppard, S.M. Characterization and isotopic variations in natural waters. Rev. Mineral. Geochem. 1986, 16, 165–183. [Google Scholar]
- Zhao, S.J.; Piao, L.L.; Yu, H.Y.; Li, Y.; Zhou, Y.S.; Liu, Z.H.; Zhang, M. Geological and geochemical characteristics of Erentaolegai large-scale silver deposit, Inner Mongolia. Miner. Depos. 2024, 43, 547–562. (In Chinese) [Google Scholar]
- Chen, X. Diagenetic-Metallogenic Model of the Erentaolegai Silver Deposit in Inner Mongolia. J. Guilin Univ. Technol. 2000, 1, 12–20. (In Chinese) [Google Scholar]
- Xu, J.D.; Zhang, Z.W.; Wu, C.Q.; Shu, Q.; Zheng, C.f.; Li, X.Y.; Jin, Z.R. Mineralogy, fluid inclusion, and S–Pb isotope geochemistry study of the Tuboh Pb–Zn–Ag polymetallic deposit, Lubuklinggau, Sumatra, Indonesia. Ore Geol. Rev. 2019, 112, 103032. [Google Scholar] [CrossRef]
- Wilkinson, J.J. Fluid inclusions in hydrothermal ore deposits. Lithos 2001, 55, 229–272. [Google Scholar] [CrossRef]
- André-Mayer, A.S.; Leroy, J.; Bailly, L.; Chauvet, A.; Marcoux, E.; Grancea, L.; Llosa, F.; Rosas, J. Boiling and vertical mineralization zoning: A case study from the Apacheta low-sulfidation epithermal gold-silver deposit, southern Peru. Miner. Depos. 2002, 37, 452–464. [Google Scholar] [CrossRef]
- Zhang, H.Y.; Zhai, D.G.; Liu, J.J.; Li, P.L.; Li, K.; Sun, H.J. Fluid inclusion and stable (H-O-C) isotope studies of the giant Shuangjianzishan epithermal Ag-Pb-Zn deposit, Inner Mongolia, NE China. Ore Geol. Rev. 2019, 115, 103170. [Google Scholar] [CrossRef]
- Drummond, S.E.; Ohmoto, H. Chemical evolution and mineral deposition in boiling hydrothermal systems. Econ. Geol. 1985, 80, 126–147. [Google Scholar] [CrossRef]
- Pirajno, F. Hydrothermal Processes and Mineral Systems; Springer: Dordrecth, The Netherlands, 2009. [Google Scholar]
- Taylor, H.P. The application of oxygen and hydrogen isotope studies to problems of hydrothermal alteration and ore deposition. Econ. Geol. 1974, 69, 843–883. [Google Scholar] [CrossRef]
- Spangenberg, J.; Fontboté, L.; Sharp, Z.D.; Hunziker, J. Carbon and oxygen isotope study of hydrothermal carbonates in the zinc-lead deposits of the San Vicente district, central Peru: A quantitative modeling on mixing processes and CO2 degassing. Chem. Geol. 1996, 133, 289–315. [Google Scholar] [CrossRef]
- Chang, Z.S.; Large, R.R.; Maslennikov, V. Sulfur isotopes in sediment-hosted orogenic gold deposits: Evidence for an Early Timing and a Seawater Sulfur Source. Geology 2008, 36, 971–974. [Google Scholar] [CrossRef]
- Li, Z.L.; Ye, L.; Hu, Y.S.; Huang, Z.L.; Wei, C.; Wu, T. Origin of the Fule Pb-Zn deposit, Yunnan Province, SW China: Insight from in situ S isotope analysis by NanoSIMS. Geol. Mag. 2019, 157, 393–404. [Google Scholar] [CrossRef]
- Lambert-Smith, J.S.; Allibone, A.; Treloar, P.J.; Lawrence, D.M.; Boyce, A.J.; Fanning, M. Stable C, O, and S Isotope Record of Magmatic-Hydrothermal Interactions Between the Faleme Fe Skarn and the Loulo Au Systems in Western Mali. Econ. Geol. 2020, 115, 1537–1558. [Google Scholar] [CrossRef]
- Zhu, C.W.; Liao, S.L.; Wang, W.; Zhang, Y.X.; Yang, T.; Fan, H.F.; Wen, H.J. Variations in Zn and S isotope chemistry of sedimentary sphalerite, Wusihe Zn-Pb deposit, Sichuan Province, China. Ore Geol. Rev. 2018, 95, 639–648. [Google Scholar] [CrossRef]
- Rye, R.O.; Ohmoto, H. Sulfur and Carbon Isotopes and Ore Genesis. A Review. Econ. Geol. 1974, 69, 826–842. [Google Scholar] [CrossRef]
- Ohmoto, H. Sulfur and carbon isotopes. Geochem. Hydrothermal Ore Depos. 1997, 517–612. [Google Scholar]
- Rollinson, H.R. Using Geochemical Data: Evaluation, Presentation, Interpretation; Routledge: London, UK, 1996; Volume 4. [Google Scholar]
- Hoefs, J. Stable Isotope Geochemistry, 8th ed.; Springer: Berlin/Heidelberg, Germany, 2018. [Google Scholar]
- Ohmoto, H. Systematics of sulfur and carbon isotopes in hydrothermal ore deposits. Econ. Geol. 1972, 67, 551–578. [Google Scholar] [CrossRef]
- Dixon, G.; Davidson, G.J. Stable isotope evidence for thermochemical sulfate reduction in the Dugald river (Australia) strata-bound shale-hosted zinc-lead deposit. Chem. Geol. 1996, 129, 227–246. [Google Scholar] [CrossRef]
- Seal, R.R. Sulfur Isotope Geochemistry of Sulfide Minerals. Rev. Mineral. Geochem. 2006, 61, 633–677. [Google Scholar] [CrossRef]
- Ohmoto, H. Stable isotope geochemistry of ore deposits. Rev. Mineral. 1986, 16, 491–559. [Google Scholar]
- Ohmoto, H.; Kaiser, C.J.; Geer, K.A. Systematics of sulphur isotopes in recent marine sediments and ancient sediment-hosted base metal deposits. In Stable Isotopes and Fluid Processes in Mineralization; Herbert, H.K., Ho, S.E., Eds.; University of Western Australia: Crawley, Australia, 1990; Volume 23, pp. 70–120. [Google Scholar]
- Ohmoto, H.; Rye, R.O. Isotopes of sulfur and carbon. Geochem. Hydrothermal Ore Depos. 1979, 57, 551–578. [Google Scholar]
- Holser, W.T.; Kaplan, I.R. Isotope geochemistry of sedimentary sulfates. Chem. Geol. 1966, 1, 93–135. [Google Scholar] [CrossRef]
- Hoefs, J. Stable Isotope Geochemistry, 3rd ed.; Springer: Berlin/Heidelberg, Germany, 1987; pp. 1–250. [Google Scholar]
- Chaussidon, M.; Lorand, J.P. Sulfur isotope composition of orogenic spinel lherzolite massifs from Ariege (N.E. Pyrenees, France): An ion microprobe study. Geochim. Cosmochim. Acta 1990, 53, 1209–1221. [Google Scholar]
- Shen, H.C. Isotope Geology; Changchun Geological Institute Press: Changchun, China, 1986; pp. 162–170. (In Chinese) [Google Scholar]
- Heald, P.; Foley, N.K.; Hayba, D.O. Comparative anatomy of volcanic-hosted epithermal deposits; acid-sulfate and adularia-sericite types. Econ. Geol. 1987, 82, 1–26. [Google Scholar] [CrossRef]
- Bonham, H.F., Jr. Models for volcanic-hosted epithermal precious metal deposits. In Proceedings of the International Volcanological Congress, Symposium V, Hamilton, New Zealand, 13–17 February 1986. [Google Scholar]
- Bodnar, R.J.; Lecumberri-Sanchez, P.; Moncada, D.; Steele-MacInnis, M. Fluid Inclusions in Hydrothermal Ore Deposits. Treatise Geochem. 2014, 13, 119–142. [Google Scholar]
- Soulamidis, G.; Stouraiti, C.; Voudouris, P.; Tsikos, H. New Ag-Rich Mn-Zn±Pb Vein Mineralization at the Mavro Xylo Manganese Oxide Deposit, Drama, Greece. Minerals 2024, 14, 955. [Google Scholar] [CrossRef]
- Leroy, J.; Hubé, D.; Marcoux, E. Episodic deposition of Mn Minerals in cockade breccia structures in three low-sulfidation epithermal deposits: A mineral stratigraphy and fluid-inclusion approach. Can. Mineral. 2000, 38, 1125–1136. [Google Scholar] [CrossRef]
- Wu, G.; Mei, M.; Gao, F.J.; Li, Z.Y.; Qiao, C.J. Ore-forming fluid characteristics and genesis of silver-lead-zinc deposits in the Manzhouli area, Inner Mongolia, China. Earth Sci. Front. 2010, 17, 239–255. (In Chinese) [Google Scholar][Green Version]
Disclaimer/Publisher’s Note: The statements, opinions and data contained in all publications are solely those of the individual author(s) and contributor(s) and not of MDPI and/or the editor(s). MDPI and/or the editor(s) disclaim responsibility for any injury to people or property resulting from any ideas, methods, instructions or products referred to in the content. |
© 2025 by the authors. Licensee MDPI, Basel, Switzerland. This article is an open access article distributed under the terms and conditions of the Creative Commons Attribution (CC BY) license (https://creativecommons.org/licenses/by/4.0/).