Article

Genesis of the Shabaosi Gold Field in the Western Mohe Basin, Northeast China: Evidence from Fluid Inclusions and H-O-S-Pb Isotopes

1
College of Mining Engineering, Heilongjiang University of Science and Technology, Harbin 150022, China
2
Ang’angxi Physical Geological Data Field Observation and Research Station of Heilongjiang Province, Qiqihar 161031, China
3
China Geological Survey Harbin Natural Resources Comprehensive Survey Center, Harbin 150081, China
4
College of Earth Sciences, Guilin University of Technology, Guilin 541004, China
*
Author to whom correspondence should be addressed.
Minerals 2025, 15(7), 721; https://doi.org/10.3390/min15070721
Submission received: 7 June 2025 / Revised: 1 July 2025 / Accepted: 8 July 2025 / Published: 10 July 2025

Abstract

The Shabaosi gold field is located in the western Mohe Basin, part of the northern Great Xing’an Range, NE China, and contains multiple gold deposits. However, the sources of the ore-forming materials, the fluid evolution, and the genesis of these gold deposits have been disputed, especially regarding the classification of these deposits as either epithermal or orogenic gold systems. Based on detailed field geological investigations and previous research, we conducted systematic research on the Shabaosi, Sanshierzhan, Laogou, and Balifang gold deposits using fluid inclusion and H-O-S-Pb isotope data, with the aim of constraining the fluid properties, sources, and mineralization processes. Fluid inclusion analyses reveal diverse types, including vapor-rich, vapor–liquid, CO2-bearing, CO2-rich, and pure CO2. Additionally, only a very limited number of daughter mineral-bearing fluid inclusions have been observed exclusively in the Laogou gold deposit. During the early stages, the peak temperature primarily ranged from 240 °C to 280 °C, with salinity concentrations between 6 and 8 wt% NaCl equiv., representing a medium–low temperature, low salinity, and a heterogeneous CO2-CH4-H2O-NaCl system. With the influx of meteoric water, the fluids evolved gradually into a simple NaCl-H2O system with low temperatures (160–200 °C) and salinities (4–6 wt%). The main mineralization stage exhibited peak temperatures of 220–260 °C and salinities of 5–8 wt% NaCl equiv., corresponding to an estimated formation depth of 1.4–3.3 km. The δDV-SMOW values (−138.3‰ to −97.0‰) and δ18OV-SMOW values (−7.1‰ to 16.2‰) indicate that the magmatic–hydrothermal fluids were progressively diluted by meteoric water during mineralization. The sulfur isotopic compositions (δ34S = −0.9‰ to 1.8‰) and lead isotopic ratios (208Pb/204Pb = 38.398–38.579, 207Pb/204Pb = 15.571–15.636, and 206Pb/204Pb = 18.386–18.477) demonstrate that the gold predominantly originated from deep magmatic systems, with potential crustal contamination. Comparative analyses indicate that the Shabaosi gold field should be classified as a epizonal orogenic gold system, which shows distinct differences from epithermal gold deposits and corresponds to the extensional tectonic setting during the late-stage evolution of the Mongol–Okhotsk orogenic belt.

1. Introduction

The Daxing’anling metallogenic belt in China is located at the junctions of the Paleo-Asian, Mongolia–Okhotsk, and Paleo-Pacific oceanic tectonic domains, and has experienced intensive tectonism, magmatism, and mineralization [1,2,3,4]. Most of the mineral deposits in this region are closely related to late Mesozoic intermediate–felsic igneous intrusions, and the mineralization types are diverse, including porphyry, hydrothermal veins, skarn, and epithermal deposits enriched in Cu, Pb-Zn, Mo, Sn polymetallic, and precious metals [4,5,6,7]. The Upper Heilongjiang Metallogenic Belt is a Class III mineralized belt in the Daxing’anling orogenic belt and is located in the Mohe Basin, which is connected to the Amur Basin in Russia to the north [8,9]. Recently, two large-scale (>20 t Au) deposits have been discovered in the Upper Heilongjiang Metallogenic Belt (the Shabaosi and Baoxinggou deposits) along with small- and medium-sized Au-(Cu) deposits (the Sanshierzhan, Balifang, Laogou, Shiwuliqiao, and Ershiyizhan deposits) [10,11,12]. However, the Au-dominated mineralization style contrasts with the polymetallic nature of other sub-belts within the Daxing’anling metallogenic belt.
The Shabaosi gold field is located in the western Mohe Basin, where the gold deposits are predominantly concentrated, including the Shabaosi, Sanshierzhan, Balifang, and Laogou deposits. Numerous studies of deposits in this area have reached the following conclusions: (1) The geological and geochemical characteristics of the gold deposits are similar to orogenic gold deposits, and they were formed during Mongolia–Okhotsk continental collision [7,13,14,15]. (2) The Au ore bodies are hosted in Middle Jurassic sandstone, controlled by NS-trending faults, and are related to Jurassic and later magmatic and tectonic events; in addition, the mineralizing fluids were dominated by meteoric waters with low-to-medium temperatures, and the deposits are of the sandstone-hosted disseminated type [16]. (3) In the Shabaosi gold field, mineralization involved both deep magmatic and stratigraphic sources, with ore-forming fluids being predominantly magmatic-derived but progressively diluted by meteoric water, ultimately forming a low-sulfidation epithermal system characterized by low-temperature and shallow-depth conditions [16]. (4) Trace element and S-Pb-Hg isotope analyses of different pyrite generations show that mineralizing materials in the Shabaosi gold field were derived from both deep magmas and the surrounding country rocks of the Ershierzhan Formation, and that this deposit is a magmatic–hydrothermal gold deposit [17,18].
Although numerous scientifically valuable studies have been conducted, many controversies remain regarding the evolution of ore-forming fluids, the sources of metallogenic materials, and the mineralization mechanisms within the Shabaosi gold field, particularly concerning the genetic classification of these deposits—whether they represent epithermal or orogenic gold systems. Furthermore, regional comparative studies are insufficient and systematic errors exist in some test data, preventing the formation of a comprehensive understanding. To address these issues, this study focused on four representative gold deposits—Shabaosi, Sanshierzhan, Laogou, and Balifang—based on years of field geological investigations and previous research. We systematically conducted fluid inclusion and H-O-S-Pb isotope analyses to clarify the geochemical characteristics of the deposits; summarize the properties, sources, and evolutionary patterns of the ore-forming fluids; and investigated the sources of metallogenic materials and mineralization processes. Our findings will provide critical insights for both exploration and theoretical research on gold and polymetallic deposits in the Upper Heilongjiang Metallogenic Belt.

2. Regional Geology

The Mohe Basin is located in the northeastern Erguna Block (Figure 1a). The basin exposes strata ranging from the Proterozoic to Cenozoic (Figure 1b), primarily consisting of the Meso-Neoproterozoic Xinghua Formation (Pt2–3xh), Lower Devonian Niqiuhe Formation (D1n), Upper Jurassic–Lower Cretaceous terrigenous clastic sequences (Xiufeng (J3K1x), Ershierzhan (J3K1e), and Mohe (J3K1m) Formations), as well as Lower Cretaceous volcanic sequences (Walagan (K1w), Guanghua (K1gn), Jiufengshan (K1j), and Ganhe (K1g) Formations). Gold deposits in the basin are predominantly hosted within the Ershierzhan, Mohe, and Walagan Formations. Fault and thrust structures are well developed in the area. Based on their formation chronology, these fractures can be classified into four groups with E–W, NE–SW, NW–SE, and N–S trends, among which the NE–SW and N–S trending fractures serve as the primary ore-controlling structures. The basin solely develops the Mohe thrust nappe structure, with the deformation intensity progressively weakening from the northwest to southeast along the Arctic Village–Laogou–Mohe transect (A–B), showing weaker manifestations in the central–eastern basin [19]. The Mohe nappe zone is believed to have been formed between the late Jurassic and early Cretaceous [7,15,20]. Regionally, early Paleozoic and Mesozoic magmatic rocks are exposed, among which the Mesozoic intermediate-acidic dikes show the closest genetic relationship with mineralization. Early Cretaceous shallow intermediate–silicic intrusions, including granodiorite, granite porphyry, and diorite, exhibit the closest spatial and genetic relationships with mineralization [4,21,22].
The Shabaosi gold field is situated in the western sector of the Mohe Basin, where all stratigraphic units except volcanic rocks are well developed. The average grades and tonnages of individual deposits are summarized in Table 1. The Shabaosi, Sanshierzhan, and Laogou gold deposits are hosted within the Ershierzhan Formation, while the Balifang gold deposit occurs in the Mohe Formation (Figure 1c). The study area is located in the central zone of the Mohe Thrust Nappe Structure, which is characterized by the extensive development of imbricate fans and duplex structures, along with overturned–tilted folds and chevron folds. Within this zone, the Upper Jurassic Mohe Formation has undergone intense mylonitization, with argillaceous rocks being metamorphosed into slate. The Laogou and Balifang gold deposits are located within the mylonitized zone of the Mohe Thrust Nappe Structure. Drill cores from the Shabaosi and Sanshierzhan gold deposits reveal that the contact zone between marble and sandstone at the basin base is characterized by intensely deformed, strongly foliated mylonitized zones. It is generally accepted that mylonitization plays a preliminary enrichment role in gold mineralization [19].

3. Deposit Geology

The Shabaosi gold field comprises four gold deposits distributed from west to east, namely Sanshierzhan, Shabaosi, Laogou, and Balifang, with a maximum spacing of <20 km between adjacent deposits. The gold orebodies are hosted in feldspathic sandstones of the Ershierzhan and Mohe Formations, occurring as stratiform and vein-type orebodies controlled by approximately N–S and NE–SW trending structures (Figure 2; Table 1). In the Shabaosi and Sanshierzhan deposits, the gold orebodies exhibit stratiform geometries with gentle dips along the sandstone–marble contact zones. In contrast, the Balifang deposit features steeper–dipping orebodies (30–70°). Both the Balifang and Laogou deposits are situated within a NNE–SSW trending ductile shear zone of the Mohe nappe structure, where the orebodies are controlled by NE–SW trending fractures that cut through the ductile shear zone. Although no large-scale igneous outcrops are observed in the ore field, dike rocks (including diorite porphyrite and granite porphyry) are relatively well developed. Magmatic activities related to mineralization were mainly concentrated in the early Cretaceous period (121.0 ± 1.0 to 141.1 ± 0.9 Ma) [4,10,15].
Gold mineralization is closely related to silicification and pyrite and polysulfide mineralization. The ore minerals consist of pyrite, arsenopyrite, and minor chalcopyrite, galena, sphalerite, and pyrrhotite. The precious metals include native Au and occasional native Ag. In the Shabaosi and Sanshierzhan gold deposits, the mineralized bodies are not clearly distinguishable from the surrounding rocks, except in the basement area, and geochemical data are required to identify the mineralized zones. The wall rock alterations are dominated by low- to medium-temperature alterations, including silicification, carbonatization, chloritization, kaolinization, sericitization, and minor talc formations. The mineralization stages in the deposits are similar in all cases and the hydrothermal mineralization can be broadly divided into three stages: pyrite ± arsenopyrite + quartz (I), polymetallic sulfide + quartz (II), and low sulfide + carbonate (III). Stage II is closely related to gold mineralization.

4. Samples and Methods

Samples were collected from four gold deposits, which were mainly drill core samples, with some surface trench samples. A total of 31 representative samples were selected for mineralogical analysis, FI microthermometry, and Raman spectroscopy; 12 samples were analyzed for H and O isotopes and 5 samples were analyzed for S and Pb isotopes.
Microthermometry and Raman spectroscopy analyses were conducted at the Analytical Testing Center of the Geofluids Laboratory, School of Geosciences, Jilin University, China. The instrument used for the microthermometry was a Linkam THMSG 600 (Linkam, Redhill, UK) freezing–heating system. The temperature accuracy is ±0.1 °C for temperatures of <31 °C and ±2 °C for temperatures of >31 °C. The Raman spectrometer was a Renishaw 1000 laser Raman instrument (Renishaw, Gloucestershire, UK). The analytical conditions were as follows: 514.5 nm Ar+ ion laser excitation light source; slit width of 25 μm; scanning range of 1200–4000 cm−1; integration time of 60 s; and accuracy of ±1 cm−1. For vapor–liquid aqueous inclusions, the fluid salinity was calculated from freezing temperatures using empirical formulas to derive the NaCl-H2O fluid density [23,24]. For CO2-bearing three-phase inclusions, the fluid salinity was calculated using empirical equations based on the CO2 disappearance temperature and density of a NaCl–CO2–H2O fluid based on empirical equations [24]. For pure CO2 inclusions, the CO2 fluid density was calculated using empirical equations [24]. The ore-forming pressure was calculated using the empirical formula proposed by Shao (1990) [25].
H-O-S-Pb isotope analyses were performed at the Analysis and Testing Research Center, Beijing Geological Institute of Nuclear Industry, China. For H–O isotope analysis, quartz samples were selected from the FI investigation suite. The H-O isotope ratios were measured with a gas source mass spectrometer (MAT253; no. 8633) using the Zn reduction method (DZ/T 0184.19-1997) and the CO2–water equilibrium method (DZ/T 0184.21-1997), respectively. The oxygen isotope analysis of quartz was conducted using the BrF5 method [26]. For the hydrogen isotope analysis of inclusion water, the water was extracted by thermal decrepitation at 550 °C and reduced to H2 using the Zn reduction method. Detailed instrument parameters and analytical protocols followed referenced standards [27].
Nine samples (pyrite) were analyzed for S isotopes using a Delta V Plus mass spectrometer based on the DZ/T 0184.14–1997 method. The measurement results are reported relative to the V-CDT standard, with an analytical precision of over ±0.2‰. Six samples (pyrite) were analyzed for Pb isotopes by thermal ionization mass spectrometry using the DZ/T 17672–1999 method. The measured ratios of 208Pb/204Pb, 207Pb/204Pb, and 206Pb/204Pb show uncertainties (2σ) of over 0.05%. For detailed analytical procedures, refer to [28].

5. Results

5.1. Fluid Inclusions

5.1.1. FI Descriptions

The Shabaosi gold field hosts diverse FIs, classified as follows: (1) vapor–liquid (LV-type); (2) vapor-rich (FV-type); (3) CO2-bearing (HC-type); (4) CO2-rich (FC-type); (5) pure CO2 (CC-type); and (6) rare daughter mineral-bearing (SL-type) inclusions.
(1)
LV-type FIs: These FIs have a gas proportion of <50 vol.% at room temperature and are widely developed in all the gold deposits and mineralization stages, accounting for 58.7% of the total number of FIs (n = 954). These FIs range from 5 to 20 μm in size with gas/liquid ratios of 15%–25%. These FIs are mostly elliptical and also elongated and irregular in shape (Figure 3a). At room temperature, they are gas–liquid FIs, and upon heating, they homogenize to a liquid phase. These FIs commonly coexist with other FI types.
(2)
FV-type FIs: These FIs are vapor-rich FIs with >50 vol.% gas at room temperature. They are relatively uncommon and only occur in the no. I ore body of the Laogou gold deposit (stages I and II; n = 32), accounting for 2.4% of the studied inclusions. These FIs are generally 6–12 μm in size (maximum 20 μm), and the gas/liquid ratio is generally 55%–90%. The FIs are mostly elliptical and less commonly elongated and irregular in shape. The inclusions are gas–liquid at room temperature and homogenize to a liquid phase when heated.
(3)
HC-type FIs: These FIs are common in stage I of each deposit and also in stage II of the Laogou and Balifang gold deposits (n = 127), accounting for 13.3% of all inclusions. This type consists mainly of gas-phase CO2, liquid-phase CO2, and a brine–liquid phase, homogenizing to liquid upon heating. The FIs are generally 6–15 μm in size and ellipsoidal, elongated, or irregular in shape (Figure 3b,c). CO2 occupies 30–45 vol.%, with CO2 gas accounting for 25–40 vol.% of the total CO2 phase.
(4)
FC-type FIs: Predominant in stage I of all deposits, sporadically in stage II at Laogou and Balifang (n = 158), representing 16.6% of inclusions. They comprise gas-phase CO2, liquid-phase CO2, and a brine–liquid phase, homogenizing to liquid when heated. The FIs measure 7–10 μm, primarily ellipsoidal (rarely elongated/irregular). CO2 constitutes 60–90 vol.%, with CO2 gas comprising 20–40 vol.% (max. 70 vol.%) of the CO2 phase.
(5)
CC-type FIs: Developed in stage I of the Balifang, Laogou, and Shabaosi deposits (n = 83; 8.7% of FIs), these pure CO2 three-phase inclusions (CC-type) contain gas- and liquid-phase CO2 (Figure 3c), homogenizing to liquid upon heating. The FIs range from 6 to 15 μm, mostly elliptical (some elongated). CO2 gas represents 20–30 vol.% of the total CO2.
(6)
SL-type FIs: Exclusively found in stage I of the Laogou gold deposit (n = 3). At room temperature, this type of FI consists of gas, liquid, and solid daughter minerals. The gas/liquid ratio is 15%–20%, and the proportion of solid daughter minerals is generally 15–20 vol.%. The FIs are mostly 10–12 μm in size and sub-ellipsoidal in shape. The solid daughter minerals are generally colorless, exhibiting sub-cubic crystal forms, and are therefore presumed to be NaCl [23]. In the quartz grains, these FIs are randomly and sporadically distributed or associated with vapor–liquid FIs.
Stage I hosts diverse FI types, while stages II–III progressively simplify to only vapor–liquid FIs in late stage. Random FI distributions suggest primary origins [25].
Figure 3. Photomicrographs of fluid inclusion assemblages in the Shabaosi gold field. (a) LV-, HC-, and CC-type FIs (Shabaosi); (b) HC- and CC-type FIs (Balifang); (c) HC- and FC-type FIs (Laogou). Scale bars = 10 μm. VH2O—vapor H2O; VCO2—vapor CO2; LH2O—liquid H2O; LCO2—liquid CO2.
Minerals 15 00721 g003

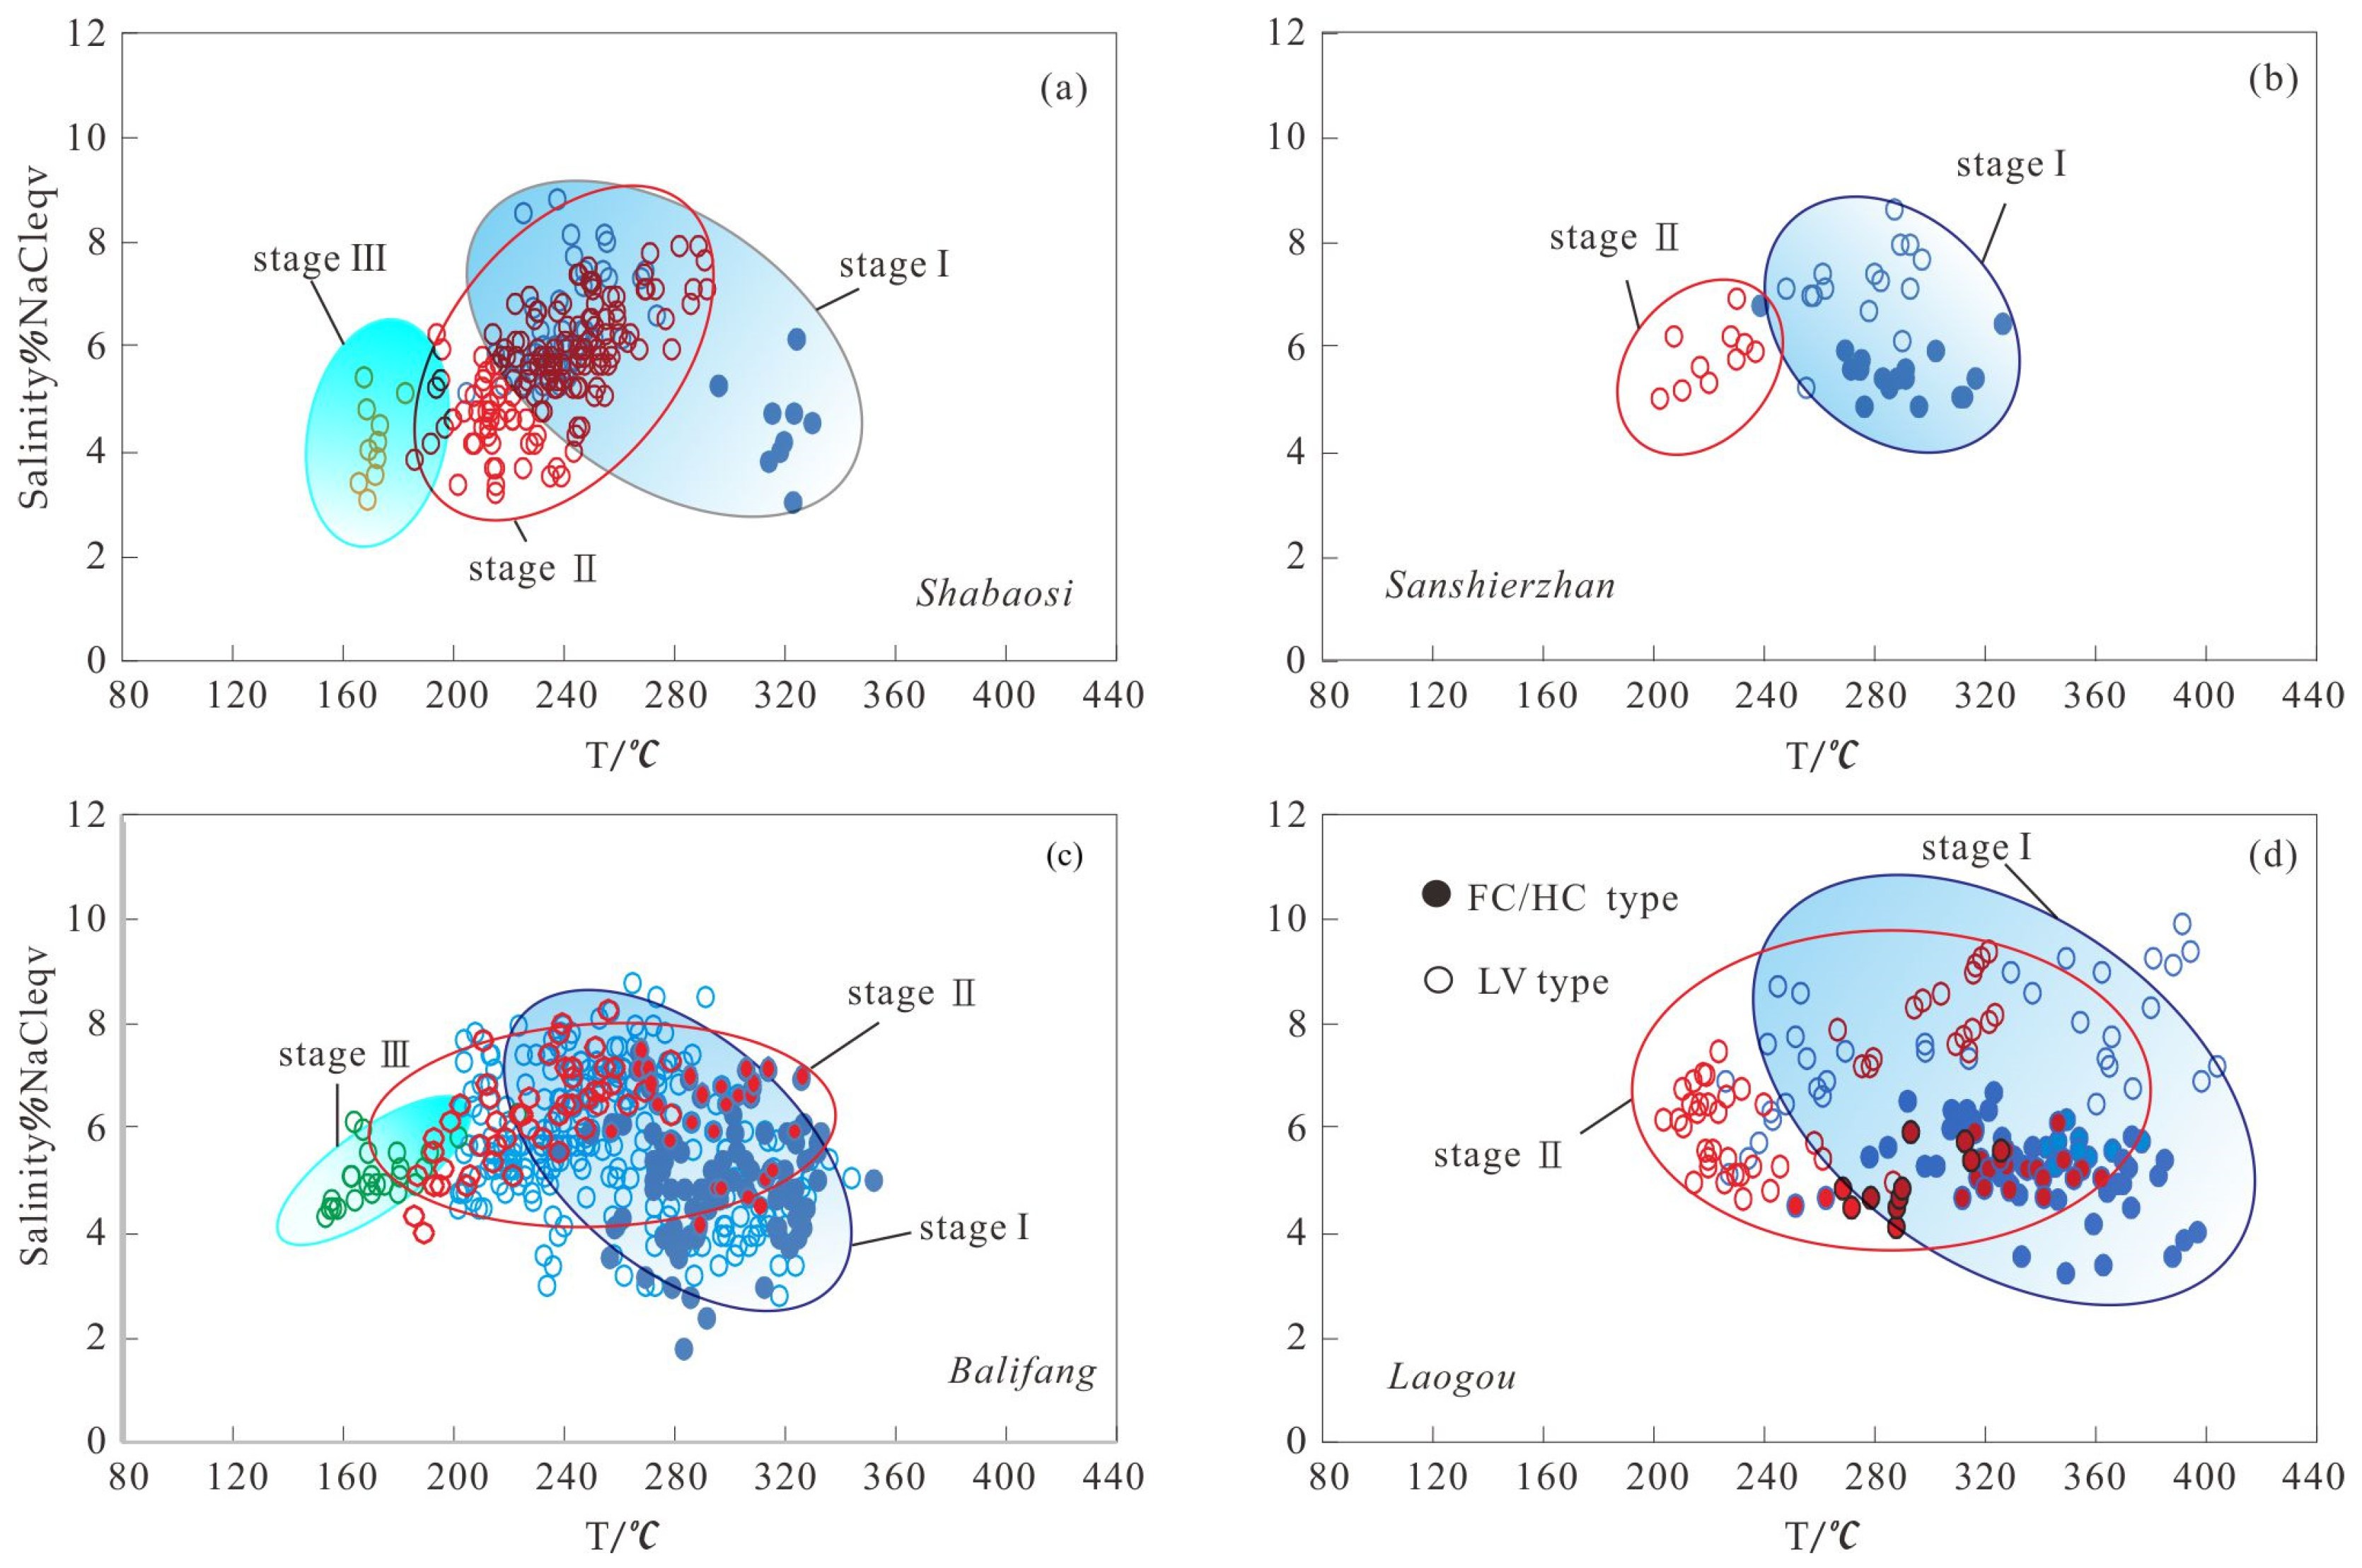
5.1.2. FI Microthermometry

In the pyrite ± arsenopyrite + quartz stage (I), FIs primarily occur in quartz and include LV-, FV-, HC-, FC-, and CC-type FIs. The CC-type FIs have solid CO2 melting temperatures of −59.9 °C to −57.9 °C and partial CO2 homogenization temperatures of 18.8–31.0 °C, although the lowest temperature in the Laogou gold deposit is 5.6 °C (Table 2). The HC- and FC-type FIs have solid CO2 melting temperatures of −59.7 °C to 56.7 °C, CO2 homogenization temperatures of 6.0–9.1 °C, and homogenization temperatures of 232.7–357.6 °C, corresponding to salinities of 1.83–7.48 wt.% NaCl equiv. The LV-type FIs have homogenization temperatures of 165.6–402.3 °C and salinities of 3.05–9.86 wt.% NaCl equiv. The peak temperature primarily range from 240 °C to 280 °C, with salinity concentrations between 6 and 8 wt% NaCl equiv. The Laogou gold deposit displays two peaks in homogenization temperature at 200–240 °C and 280–320 °C, and the Balifang gold deposit also has two weak peaks at 200–260 °C and 280–320 °C. The FV-type FIs have homogenization temperatures of 332.8–396.6 °C, with salinities of 4.48–5.25 wt.% NaCl equiv., and the SL-type FIs have homogenization temperatures of 271.6–315.6 °C, with salinities of 29.58–30.39 wt.% NaCl equiv.
In the polymetallic sulfide + quartz stage (II), the HC- and FC-type FIs have solid CO2 melting temperatures of −59.4 °C to −56.8 °C, CO2 homogenization temperatures of 6.8–7.9 °C, homogenization temperatures of 256.9–375.8 °C with a peak at 280–360 °C (Figure 4), and salinities of 4.14–6.12 wt.% NaCl equiv. with a peak at 4–6 wt.% NaCl equiv. The FV-type FIs have homogenization temperatures of 251.6–329.6 °C and salinities of 4.48–5.25 wt.% NaCl equiv. The LV-type FIs have freezing temperatures of −6.5 °C to −1.9 °C and salinities of 3.21–9.34 wt.% NaCl equiv., with a peak at 5–8 wt.% NaCl equiv., similar to all the deposits in the ore field. The homogenization temperatures are 185.9–323.8 °C, with a peak at 220–260 °C (Figure 4). The LV-type FIs in the Laogou gold deposit exhibit a relatively wide range of homogenization temperatures, spanning from 200 °C to 320 °C.
In the sulfide + carbonate stage (III), only LV-type FIs are developed, with freezing temperatures of −4.0 °C to −1.8 °C; homogenization temperatures of 155.9–225.9 °C, with a peak at 160–200 °C; and salinities of 3.05–6.44 wt.% NaCl equiv, with a peak at 4–6 wt.%.
The LV-type FIs from the main mineralization stage (II) exhibit consistent homogenization temperature peaks at 220–260 °C with salinities of 5–8 wt.% NaCl equiv., while the late mineralization stage (III) shows markedly reduced thermal and chemical parameters, with homogenization temperatures declining to 160–200 °C and salinities decreasing to 4–6 wt.% NaCl equiv., demonstrating a clear cooling and dilution trend through the mineralization sequence.

5.1.3. Raman Spectroscopy

Laser Raman spectroscopic analysis of CC-type FIs showed that the main component in the inclusions is CO2, and there are no other components, with obvious CO2 peaks at 1287 and 1388 cm−1 in the Raman spectra (Figure 5a). The main components in the HC- and FC-type FIs are CO2, N2, CH4, and H2O, with distinct CO2 peaks at 1287 and 1388 cm−1, and a N2 peak at 2328 cm−1, CH4 peak at 2914 cm−1, and H2O peak at 3500 cm−1 (Figure 5b,d,f). The LV-type FIs are dominated by H2O, N2, CH4, and minor CO2, with a distinct H2O peak at 3500 cm−1, weak CO2 peak at 1388 cm−1, N2 peak at 2328 cm−1, and CH4 peak at 2914 cm−1 (Figure 5c,e). The compositions of LV-type FIs in stage II are similar to those in stage I, but the CO2 and CH4 contents are lower and the H2O peak at 3500 cm−1 is more obvious. The mineralizing fluid was a low- to medium-temperature, low-salinity, and low-density CO2-CH4-H2O-NaCl system [29,30]. We conclude that the stage I mineralizing fluid had a CO2-CH4-H2O-NaCl composition, the main mineralization stage II fluid had a CH4-H2O-NaCl ± CO2 composition, and the late stage III mineralizing fluid had a H2O-NaCl composition.
FC-type Fis in these deposits may originate from organic matter-rich rocks (e.g., silty slate, siltstone, and mudstone), where metamorphic processes and fluid–organic matter interactions generated the CO2-CH4 fluid compositions [26]. These exhibit distinct characteristics compared to those in the Shiwuliqiao epithermal gold deposit (eastern Mohe Basin), which is primarily hosted in volcanic rocks [10].

5.2. Isotope Analysis

5.2.1. Hydrogen and Oxygen Isotopes

The H-O isotope data (Table 3) reveal broadly similar characteristics across all deposits, with δDV-SMOW = −138.3‰ to −97.0‰ (mean = −126.3‰) and δ18O = 7.1‰−16.2‰ (mean = 12.0‰). δ18OH2O varies from −2.40‰ to 5.60‰, with a mean of 2.44‰ [27]. In accordance with previous studies [7,16,31], the δDV-SMOW values of quartz from seven samples of the Shabaosi gold deposit range from −138.3‰ to −117.8‰ (mean = −130.9‰), δ18O values vary from 7.1‰ to 16.2‰ (mean = 13.2‰), and δ18OH2O values range from −2.40‰ to 5.60‰ (mean = 3.12‰). The δDV-SMOW values of the Shabaosi gold deposit decrease from stage I to stage II. The δDV-SMOW value of quartz from one sample of the Sanshierzhan gold deposit is −132.8‰, which also has δ18O = 10.8‰ and δ18OH2O = 0.35‰. The δDV-SMOW values of nine samples from the Balifang gold deposit vary from −135‰ to −112.1‰ (mean = −126.6‰), with δ18O = 8.9‰–13.0‰ (mean = 11.5‰) and δ18OH2O = 0.35‰–4.79‰ (mean = 2.71‰). The δDV-SMOW and δ18OH2O values for the Balifang gold deposit in stage I and stage II are similar, although the δ18OH2O values decrease slightly in stage II. The Laogou and other deposits share comparable H-O isotopic signatures.
The H-O isotope systematics (Figure 6) reveal a progressive evolution in fluid sources: stage I samples are plotted below the magmatic water field and stage II–III samples show systematic deviation toward the meteoric water field, indicating that stage I mineralization was dominated by magmatic fluids, stage II involved mixing with meteoric waters, and stage III was predominantly fed by meteoric-derived fluids [32], with this three-stage evolution being consistent across all deposits in the Shabaosi gold field.

5.2.2. Sulfur Isotopes

Five samples from the Shabaosi gold deposit (four from ore body II and one from ore body III) were analyzed for sulfur isotopes (Table 4). The δ34S values range from −0.9‰ to +1.8‰ (mean = 0.78‰), showing limited variability and being consistent with values from the Baoxinggou gold deposit in the eastern Mohe Basin [21]. Incorporating previously published data, 26 sulfur isotope analyses for the Shabaosi deposit exhibit δ34S values from −8.3‰ to +9.6‰ (mean = 1.94‰) [13,21,31,34]. These values display significant variation and can be categorized into three distinct groups, namely −10‰ to −6‰, −2‰ to +4‰, and +8‰ to +10‰, with the majority (68%) falling within the 0‰ to +4‰ range (Figure 7a). Previous studies have reported extensive sulfur isotope data for the Mohe Basin. The analysis of 69 samples from eight gold deposits reveals a relatively narrow δ34S range of 0‰ to +4‰ (mean = 2.13‰), as shown in Figure 7b, with the exception of a few anomalous samples from the Shabaosi deposit.

5.2.3. Lead Isotopes

The pyrite from the Shabaosi gold deposit exhibits 208Pb/204Pb (38.398–38.579, mean = 38.504), 207Pb/204Pb (15.571–15.636, mean = 15.610), and 206Pb/204Pb (18.386–18.477, mean = 18.432) (Table 5) ratios that are consistent with previously reported ranges (208Pb/204Pb: 37.756–38.440; 207Pb/204Pb: 15.476–15.690; 206Pb/204Pb: 17.752–18.453) [13,31]. Comparative data from the Ershiyizhan Au-Cu deposit show nearly identical Pb isotope signatures between mineralized sandstone (Au ore: 208Pb/204Pb = 38.340–38.346, 207Pb/204Pb = 15.587–15.594, 206Pb/204Pb = 18.469–18.510) and Cu ore (208Pb/204Pb = 38.331, 207Pb/204Pb = 15.588, 206Pb/204Pb = 18.467), demonstrating a common Pb source for both mineralization types in the Mohe Basin.

6. Discussion

6.1. Source and Evolution of Ore-Forming Fluid

The variations in FI and H-O isotope data across different mineralization stages reflect the evolving nature of ore-forming fluids. The H–O isotope data show the ore-forming fluid in the early mineralization stage (I) was mainly magmatic water and, in the main mineralization stage (II), was a mixture of magmatic and meteoric waters. The late mineralization stage was dominated by meteoric waters. Numerous types of FIs occur in stage I quartz, including LV-, HC-, FC-, and CC-types, with FV-type FIs also developed in the Laogou deposit. The stage I FIs display significantly higher homogenization temperatures (Th), salinities, and CO2/H2O ratios (15%–90%) compared to subsequent stages. Notably, HC- and FC-type FIs exhibit higher Th values than LV-type inclusions (Figure 8), suggesting fluid boiling and consequent H2O-CO2 phase immiscibility [35]. These characteristics are diagnostic of a magmatic–hydrothermal origin with extensive water–rock interactions. During stage II, progressive mixing with meteoric waters led to a marked increase in LV-type FI abundance (>80%) while CC-, FC-, and HC-type inclusions became less common, accompanied by systematic decreases in homogenization temperatures (160–320 °C), salinities (3–9 wt.% NaCl equiv.), and CO2 content (<5 vol.%), with this fluid cooling triggering polymetallic sulfide (pyrite ± pyrrhotite ± chalcopyrite) and gold precipitation. By stage III, the system contained exclusively LV-type FIs showing further reduced homogenization temperatures (160–200 °C), lower salinities (4–6 wt.% NaCl equiv.), and marginally higher densities (0.85–0.95 g/cm3), demonstrating continuous meteoric water dilution throughout later mineralization stages.
The measured δDV-SMOW values (−138.3‰ to −108.0‰; mean = −126.3‰) from the western Mohe Basin deposits exhibit significant depletion. This depletion may be attributed to the following: (1) boiling-induced fractionation, where deuterium preferentially partitions into the vapor phase, causing D-depletion in the residual liquid as vapor escapes [36], and (2) intensive water–rock interactions between stage I mineralizing fluids and sandstones, which facilitated H-O isotope exchange [26]. The ore-forming fluids evolved through three distinct stages: (1) stage I (early), dominated by magmatic CO2-CH4-H2O-NaCl fluids; (2) stage II (main), characterized by mixed magmatic–meteoric CH4-H2O-NaCl ± CO2 fluids with polymetallic sulfide (pyrite–chalcopyrite–sphalerite) precipitation; and (3) stage III (late) meteoric H2O-NaCl fluids. The gas–liquid FI homogenization temperatures (peak 220–260 °C) and estimated trapping conditions (13.5–32.7 MPa, equivalent to 1.4–3.3 km paleodepth) confirm epithermal mineralization environments, with stage III quartz FI data directly recording the Au-mineralizing fluid conditions [37,38,39].
Metamorphism associated with Mohe thrust activity resulted in elevated organic matter and CO2 contents within stage I–II FIs from the Shabaosi gold deposits compared to those of other deposits. These deposits are characterized by (1) abundant high-salinity CC-type FIs; (2) rare daughter mineral-bearing FIs (particularly at Laogou); and (3) metamorphic–hydrothermal fluid signatures [37]. These characteristics clearly differentiate them from typical epithermal gold deposits.

6.2. Sources of Mineralization

Sulfur isotopes serve as crucial tracers for both metal sources and mineralization physicochemical conditions. In sulfide-dominated mineralization systems (e.g., pyrite, chalcopyrite, sphalerite, and arsenopyrite in the western Mohe Basin), the mean δ34S value of sulfides effectively represents the sulfur isotopic composition of mineralizing fluids [40]. The absence of sulfate minerals (gypsum/barite) in this region is further validated using sulfide δ34S values to trace ore-forming material sources [41]. Mantle-derived sulfur typically exhibits δ34S values ranging from 0‰ to +3‰. Comparatively, deep magmatic sulfur demonstrates lower δ34S values than shallow magmatic sources, attributable to isotopic fractionation and crustal contamination effects during magma ascent [42]. The δ34S values of mixed magmatic sulfur typically range from −2.9‰ to +4.9‰, with positive shifts occurring through crustal contamination [43,44,45]. Magmatic–hydrothermal ore deposits generally exhibit δ34S values of 0‰ ± 5‰ [46]. In the studied gold deposits, mean δ34S values range from −0.05‰ to +6.0‰, showing a predominant peak between 0‰ and +4‰, with an overall mean of +2.24‰ (Figure 7b).
The δ34S values from Baoxinggou and Ershiyizhan Au-(Cu) deposits in eastern Mohe Basin consistently measure <3‰ [13,21,34], approaching meteoritic sulfur values despite basin-wide magmatic sulfur dominance, confirming the magmatic derivation of ore-forming materials. At Shabaosi gold deposit, the stage I–II mean, δ34S (+0.78‰), contrasts with published data (−8.3‰ to +9.6‰), while whole-rock δ34S (+1.3‰ to +9.8‰, mean +5.0‰) [34] indicates crustal sulfur incorporation. At the Sanshierzhan gold deposit, pyrite δ34S values range from 3.07‰ to 9.96‰, demonstrating the incorporation of crustal sulfur during mineralization [17]. The Laogou deposit’s mean δ34S (+6.0‰, three samples) [13] overlaps with Shabaosi’s whole-rock range, suggesting formation sulfur input. These three deposits’ elevated δ34S signatures correlate with their western basin margin position within the ductile shear zone, where sedimentary-derived sulfur dominates [47].
Lead isotope analysis was employed to trace mineralization sources, incorporating both new and published data [13,31]. In the 206Pb/204Pb–207Pb/204Pb diagram (Figure 9a), Mohe Basin samples are plotted between mantle and upper-crustal reservoirs. Shabaosi Au and Ershiyizhan Au-(Cu) deposits cluster along the orogenic belt evolution line, while western Mohe Basin samples and Laogou deposit exhibit distinct compositions, reflecting variable source mixing. The 206Pb/204Pb–208Pb/204Pb diagram (Figure 9b) shows samples distributed between lower- and upper-crustal fields, with most clustering near the mantle trend, which is consistent with Figure 9a patterns. Notably, Laogou and Shabaosi deposits form discrete clusters. Compared to the Ershiyizhan deposit in eastern Mohe Basin, most ores display homogeneous Pb isotopes, though Shabaosi and Laogou exhibit mixing signatures (dominantly deep magmatic sources with upper-crustal contributions) [31,48]. This discrepancy may be related to the ductile shear zone formed during the late orogenic stage of the Mohe thrust nappe structure within the Mongolia–Okhotsk orogenic belt.

6.3. Ore Genesis

6.3.1. Relationship Between Regional Tectonic Setting and Mineralization

The gold deposits in the Mohe Basin occur within clastic sedimentary sequences, with mineralization being genetically linked to basin evolution and magmatic activity. During the early–late Jurassic closure of the Mongolia–Okhotsk Ocean, the basin formed through continental collision in the Upper Heilongjiang region, accumulating thick sedimentary successions (Xiufeng, Mohe, and Kaikoukang formations, ascending stratigraphically) [8,9,49]. The late Jurassic–early Cretaceous transition marked a shift to post-collisional back-thrusting and strike-slip faulting along the Mongolia–Okhotsk tectonic belt, forming the Mohe thrust zone [18,20,50,51]. Thrust intensity increased westward, generating NE–SW trending mylonitic shear zones and intermediate–silicic intrusions. The gold mineralization events in the region were predominantly concentrated during the early Cretaceous (140–120 Ma), forming in an extensional setting during the late orogenic stage of the Mongolia–Okhotsk tectonic belt [14,15].

6.3.2. Ore Genesis

During the late Jurassic–early Cretaceous, the Mohe Basin formed in the late-stage evolution of the Mongolia–Okhotsk orogenic belt, undergoing intense metamorphism and deformation that generated ENE–WSW trending thrust faults and the Mohe thrust nappe [19,20]. The thrusting intensity exhibited an east-to-west increasing gradient, resulting in mylonitization and cataclasis. The thrust contact is characterized by a schistosity zone, hydrothermal alteration, and brittle fracture systems, creating favorable mineralization pathways. In the Laogou and Balifang gold deposits, ore bodies occur in ductile–brittle transitional zones with well-developed quartz veins, while the Shabaosi deposit features basement-controlled ore bodies displaying distinct foliation and metamorphic-hydrothermal FIs. Notably, the Laogou deposit also contains daughter mineral-bearing FIs. Sulfur-lead isotopes indicate predominantly deep-sourced magmatic components for the ore-forming materials, correlating with early Cretaceous mineralization. However, the Laogou and Shabaosi deposits in the western basin show more complex sources with upper-crustal sulfur contributions. Collectively, these features suggest that metamorphic–deformational processes facilitated gold mobilization and preliminary enrichment along fault zones, exhibiting characteristics typical of orogenic gold deposits [52,53].
During the early Cretaceous transition from compression to extension in the Mongol–Okhotsk orogenic belt, extensive intermediate-felsic magmatism occurred in the northern Da Hinggan Mountains. In this transitional tectonic regime, ore-forming components were mobilized by deep magmatic-metamorphic fluids and migrated upward through regional shear zones, ultimately concentrating at 1.4–3.3 km depth. The Shabaosi gold deposit formed under these conditions, structurally controlled by secondary brittle–ductile faults of the Mohe thrust nappe. While previous studies debated whether Shabaosi represents an orogenic or epithermal system, our systematic comparison (Table 6) resolves this classification issue.
Comparative analysis reveals the following:
(1)
Comparative analysis of ore-hosting wall rocks and ore-controlling structures
The ore-controlling structures of the Shabaosi gold field are characterized by secondary extensional fault systems associated with thrust nappe structures, demonstrating clear genetic inheritance from the typical orogenic gold deposit model featuring “high-angle strike-slip/thrust faults + brittle-ductile shear zones” [56,58]. In contrast to epithermal deposits controlled by volcanic edifices or breccia pipes [54], the structural assemblage of Shabaosi (including secondary thrust structures and basement faults) reflects the transitional process of tectonic stress fields at orogenic belt scales.
(2)
Comparative analysis of mineral assemblages, wall rock alteration, and trace elements
The Shabaosi gold field is characterized by a metallic mineral assemblage dominated by pyrite and arsenopyrite, with minor amounts of stibnite, sphalerite, and other minerals, which is consistent with typical orogenic gold deposits [55,56]. The presence of stibnite may reflect local superimposition of shallow low-temperature fluids under the late extensional setting of the Mongol–Okhotsk orogenic belt [37,55]. Wall rock alteration consists of silicification, sericitization, chloritization, carbonatization, and kaolinization [60], but lacks distinctive epithermal alteration features such as adularia or alunite [54,59]. In terms of trace elements, the ore is enriched in Au-As-Sb-Bi-Te, with a significant positive correlation between Te and Au in pyrite [60], while lacking the strong Hg-Tl enrichment characteristic of typical epithermal deposits [61,62]. These features collectively indicate that the deposit exhibits characteristics of an epizonal orogenic gold deposit formed in an extensional setting.
(3)
Differences in fluid system evolution
The fluid inclusion assemblages in the deposit evolve from CC-FC-HC-LV types → HC/LV types → LV types, consistent with the orogenic gold deposit fluid evolution path from “metamorphic fluid-dominated to meteoric water-involved” systems [37]. In contrast, epithermal deposits typically lack high-CO2 fluid inclusions (predominantly LV types) and maintain meteoric water-dominated fluid systems throughout [62,66,67].
(4)
Physicochemical conditions of mineralization
Although the mineralization temperature (220–260 °C) and depth (1.4–3.3 km) approach the upper limits of epithermal systems, they differ significantly from typical epithermal conditions (<200 °C, <2 km). These parameters instead match epizonal orogenic gold deposits (150–300 °C, <6.0 km). Crucially, the early-stage fluid characteristics (I-HC: 280–320 °C) show genetic continuity with mesozonal orogenic deposits (300–475 °C) [55].
(5)
Distinctive material sources
While the δ34S values (−8.3‰ to +9.6‰) exhibit a broader range than typical orogenic deposits, the primary interval (0‰ to +4‰) indicates dominant magmatic sulfur sources. This fundamentally differs from epithermal systems (+1.0‰ to +4.6‰), where sulfur isotopes of the Shabaosi gold field strongly reflect wall rock influences [63,65].
The comparative analyses conclusively demonstrate that the fundamental characteristics of the Shabaosi gold field essentially conform to the key diagnostic criteria for orogenic gold deposits established by Groves (1998) [58]. The deposit should be genetically classified as an epizonal orogenic gold system, while exhibiting distinct differences from epithermal gold deposits. The relatively “shallow” features of Shabaosi reflect the unique extensional metallogenic setting of the Mongol–Okhotsk orogenic belt. This extension-related orogenic gold system preserves the essential characteristics of deep-sourced fluids and structural controls, while simultaneously displaying transitional features in terms of mineralization depth and late-stage fluid evolution processes.

7. Conclusions

(1)
Fluid inclusion analyses reveal diverse types, including vapor-rich, liquid-vapor, CO2-bearing, CO2-rich, pure CO2, and minor solid-bearing inclusions. The ore-forming fluids initially represented a medium-low temperature, low-salinity, heterogeneous CO2-CH4-H2O-NaCl system of predominantly magmatic origin. During mineralization, progressive meteoric water influx transformed the fluids into a simpler NaCl-H2O system dominated by meteoric components in the late stage.
(2)
The main mineralization stage exhibited peak temperatures of 220–260 °C and salinities of 5–8 wt.% NaCl eq., corresponding to a formation depth of 1.4–3.3 km.
(3)
H-O-S-Pb isotopes indicate that Au was derived primarily from magmatic sources, with minor upper-crustal contributions.
(4)
Comparative analyses indicate that the Shabaosi gold field should be classified as an epizonal orogenic gold system, which shows distinct differences from epithermal gold deposits and corresponds to the extensional tectonic setting during the late-stage evolution of the Mongol–Okhotsk orogenic belt.

Author Contributions

Conceptualization, X.L. and Z.L.; methodology, L.B.; software, J.W.; validation, X.L., Z.L. and L.B.; formal analysis, X.L.; investigation, X.L. and Z.L.; resources, Z.L.; data curation, X.L.; writing—original draft preparation, X.L. and Z.L.; writing—review and editing, X.L. and Z.L.; visualization, S.L.; supervision, G.W.; project administration, Z.L.; funding acquisition, L.B. All authors have read and agreed to the published version of the manuscript.

Funding

This study was financially supported by the Geological Survey of China ([2023] 02-44-11/DD20230395) and Undergraduate Institutions Basic Scientific Research Foundation (2024-KYYWF-1110).

Data Availability Statement

The authors declare that all the analytical data supporting the findings of this study are available within the paper or cited in peer-review references.

Conflicts of Interest

The authors declare no conflicts of interest.

References

  1. Zhao, Y.; Dong, S.Y.; Zhang, Y.M.; Yong, H.H.; Zhang, J.; Lu, Y.L. Petrogenesis, tectonic setting and metallogenic potential of the Late Paleozoic and Late Mesozoic granitoids in the Central Great Xing’an Range, NE China. J. Geochem. Explor. 2025, 274, 107714. [Google Scholar] [CrossRef]
  2. Wang, K.; Lin, S.Y.; Wang, Y.H.; Zhang, F.F.; Gu, W.X. Genesis of the early mesozoic granitoids at the Hardat Tolgoi Ag-Pb-Zn deposit in East Ujimqin Banner, Inner Mongolia, NE China: Insights from whole-rock geochemistry, zircon U-Pb-Hf isotopes, and Pb-Si systematics. Ore Geol. Rev. 2021, 139, 104530. [Google Scholar] [CrossRef]
  3. Duan, M.X.; Ren, Y.S.; Xue, C.J.; Yang, Q.; Hao, Y.J.; Liu, T. Provenance Tracing and Age Analysis of Lead–Zinc Mineralization in Qiyimuchang, Inner Mongolia, NE China. Minerals 2022, 12, 1146. [Google Scholar] [CrossRef]
  4. Wu, G.; Wang, G.R.; Liu, J.; Zhou, Z.H.; Li, T.G.; Wu, H. Metallogenic Series and Ore–forming Pedigree of Main Ore Deposits in Northerm Great Xing’an Range. Miner. Depos. 2014, 33, 1127–1150, (In Chinese with English Abstract). [Google Scholar]
  5. Deng, C.Z.; Sun, D.Y.; Han, J.S.; Chen, H.Y.; Li, G.H.; Xiao, B.; Li, R.C.; Feng, Y.Z.; Li, C.L.; Lu, S. Late-stage southwards subduction of the Mongol-Okhotsk oceanic slab and implications for porphyry Cu-Mo mineralization: Constraints from igneous rocks associated with the Fukeshan deposit, NE China. Lithos 2019, 326–327, 341–357. [Google Scholar] [CrossRef]
  6. Sun, Y.G.; Li, B.L.; Ding, Q.F.; Qu, Y.; Wang, C.K.; Wang, L.L.; Xu, Q.L. Mineralization age and hydrothermal evolution of the Fukeshan Cu (Mo) deposit in the northern Great Xing’an Range, northeast China: Evidence from fluid inclusions, H-O-S-Pb isotopess, and Re-Os geochronology. Minerals 2020, 10, 591. [Google Scholar] [CrossRef]
  7. Wu, G.; Li, Z.Q.; Mi, M.; Liu, J.; Zhu, M.T. Characteristics of ore forming fluid and genesis of the shabaosi gold deposit in the northern daxingg’an mountain. Miner. Petrol. 2008, 28, 31–38, (In Chinese with English Abstract). [Google Scholar]
  8. Li, J.Y.; Liu, J.F.; Qu, J.F.; Zheng, R.G.; Zhao, S.; Zhang, J.; Sun, L.X.; Li, Y.F.; Yang, X.P.; Wang, L.J.; et al. Major geological features and crustal tectonic framework of Northeast China. Acta Petrol. Sin. 2019, 35, 2989–3016, (In Chinese with English Abstract). [Google Scholar]
  9. Chen, L.; Liang, C.Y.; Liu, Y.J.; Zheng, C.Q.; Zhang, Q.; Song, Z.W.; Li, D.X.; Qu, S.Y.; Liu, X.J. Tectonic evolution of Mohe area, North-east China: Evidence from the Early Ordovician to Early Cretaceous magmatism and tectonism. Geol. J. 2021, 56, 5478–5505. [Google Scholar] [CrossRef]
  10. Li, X.W. Metallogenic Regularities of Gold Deposits in Upper Heilongjiang Metallogenic Belt and Its Prospecting. Ph.D. Thesis, Jilin University, Changchun, China, 2015. (In Chinese). [Google Scholar]
  11. Li, X.W.; Yang, Y.C.; Wang, X.Z.; Liu, Z.J.; Gong, W.G. Discussion on geology characters and metallogenic tectonic Environment about Baoxinggou gold deposit in Tahe, Heilongjiang Province. J. Jilin Univ. 2012, 42, 1700–1710, (In Chinese with English Abstract). [Google Scholar]
  12. Li, R.H.; Zhang, H.; Sun, F.Y.; Wu, G.; Zhang, Y.T.; Wang, S. Geochronology and geochemistry of the Ershiyizhan intrusive rocks in the northern Great Hinggan Range, and its prospecting implication. Acta Petrol. Sin. 2018, 34, 1725–1740, (In Chinese with English Abstract). [Google Scholar]
  13. Wu, G.; Sun, F.Y.; Zhu, Q.; Li, Z.T.; Ding, Q.F.; Li, G.Y.; Pang, Q.B.; Wang, H.B. Geological characteristics and genesis of gold deposits in Upper Heilongjiang Basin. Miner. Depos. 2006, 25, 215–230, (In Chinese with English Abstract). [Google Scholar]
  14. Liu, J.; Wu, G.; Qiu, H.N.; Li, Y. 40Ar/39Ar dating, fluid inclusions and S-Pb isotope systematics of the Shabaosi gold deposit, Heilongjiang Province, China. Geol. J. 2014, 50, 592–606. [Google Scholar] [CrossRef]
  15. Zhang, G.B.; Yang, Y.C.; Wang, X.Z.; Zhang, Z.G.; Ye, S.Q.; Li, Q.L.; Li, X.W.; Li, H.Y.; Wang, Q.S. Geocheminstry and Ore Genesis of Balifang Gold deposit in Mohe, heilongiang Province. J. Jilin Univ. 2013, 43, 2812–2827, (In Chinese with English Abstract). [Google Scholar]
  16. Qi, J.Z.; Li, L.; Guo, X.D. Geological characteristics of the Shabaosi altered sand stone type gold deposit in north dahinggan mountains. Miner. Depos. 2000, 19, 116–124, (In Chinese with English Abstract). [Google Scholar]
  17. Li, X.W.; Deng, C.Z.; Sun, D.Y.; Liang, S.S.; Zhang, L.D.; Liu, W.P.; Yang, B.Z.; Zhang, X.M.; Ni, X.R. Genesis of the sediment-hosted Sanshierzhan Au deposit, NE China: Evidence from pyrite geochemistry and S-Hg isotopes. Ore Geol. Rev. 2025, 184, 106719. [Google Scholar] [CrossRef]
  18. Wang, Y.C.; Tan, W.; Zhao, Y.Y.; Liu, J.L.; He, L.; Chen, H.; Huang, J.H.; Gong, X. Geochemical Characteristics of Pyrite from the Shabaosi Gold Deposit in the Upper Heilongjiang Basin and Its Mineralization Significance. Acta Geosci. Sin. 2023, 45, 320–336, (In Chinese with English Abstract). [Google Scholar]
  19. Wang, X.Y.; Liang, H.J.; Jin, T.H.; Yang, J.O.; Huai, B.F. Mohe nappe structure Heilongjiang and its control to gold mineralization. Geotect. Metallog. 2008, 32, 218–225, (In Chinese with English Abstract). [Google Scholar]
  20. Liang, C.Y.; Liu, Y.J.; Zheng, C.Q.; Li, W.M.; Neubauer, F.; Zhang, Q.; Zhang, D. Deformation patterns and timing of the thrust-nappe structures in the Mohe Formation in Mohe Basin, Northeast China: Implication of the closure timing of Mongol–Okhotsk Ocean. Geol. J. 2019, 54, 746–769. [Google Scholar] [CrossRef]
  21. Li, X.W.; Zhang, Z.G.; Wang, K.Y.; Sun, J.P.; Yan, J.B.; Yang, H. Characteristics of ore-forming fluid and genesis of Baoxinggou gold deposit in the north part of Great Xing’an range. J. Jilin Univ. 2018, 48, 1071–1084, (In Chinese with English Abstract). [Google Scholar]
  22. Wang, Y.H.; Zhao, Y.Y.; Cheng, X.D. Geology, fluid inclusion, 40Ar-39Ar geochronology, and isotope constraints on the ore genesis of the Ershiyizhan Cu–Au deposit, Heilongjiang Province, China. Ore Geol. Rev. 2024, 168, 106058. [Google Scholar] [CrossRef]
  23. Zhang, W.H.; Chen, Z.Y.; Zhang, E.S. Fluid Inclusion Geology; China University of Geoscience Press: Wuhan, China, 1993; pp. 1–240. ISBN 7-5625-0885-2. [Google Scholar]
  24. Liu, B.; Shen, K. Thermodynamics of Fluid Inclusion; Geological Publishing House: Beijing, China, 1999; pp. 1–282. ISBN 7-116-02677-0. [Google Scholar]
  25. Shao, J.L. Prospecting Mineralogy of Gold Deposit; China University of Geosciences Press: Beijing, China, 1990; (In Chinese with English Abstract). [Google Scholar]
  26. Clayton, R.N.; Mayeda, T.K. The use of bromine pentafluoride in the extraction of oxygen from oxides and silicates for isotopic analysis. Geochim. Cosmochim. Acta 1963, 27, 43–52. [Google Scholar] [CrossRef]
  27. Clayton, R.N.; O’Neil, J.R.; Mayeda, T.K. Oxygen isotope exchange between quartz and water. J. Geophys. Res. 1972, 77, 3057–3067. [Google Scholar] [CrossRef]
  28. Li, H.Z.; Yang, Q.; Zhang, L.G.; Ren, Y.S.; Li, M.T.; Li, C.; Wang, B.; Chen, S.T.; Peng, X.L. Ore-Forming Fluid Evolution and Ore Genesis of the Cuyu Gold Deposit in Central Jilin Province, NE China: Constraints from Geology, Fluid Inclusions, and H-O-S-Pb Isotope Studies. Minerals 2025, 15, 535. [Google Scholar] [CrossRef]
  29. Drummond, S.E.; Ohmoto, H. Chemical evolution and mineral deposition in boiling hydrothermal systems. Econ. Geol. 1985, 80, 126–147. [Google Scholar] [CrossRef]
  30. Shi, K.T.; Wang, K.Y.; Wang, R.; Ma, X.L.; Sun, L.X.; He, Y.G. Geological, fluid inclusion, and O-C-S–Pb-He-Ar isotopic constraints on the genesis of the Honghuagou lode gold deposit, northern North China Craton. Geochemistry 2021, 81, 125807. [Google Scholar] [CrossRef]
  31. Sun, Q.; Ren, Y.S.; Yang, Q.; Duan, M.X.; Hao, Y.J. Ore Genesis and Metallogenic Age of Luoguhe Poly Metallic Deposit in Mohe Area, Heilongjiang Province. J. Mineral. Petrol. 2015, 35, 20–28, (In Chinese with English Abstract). [Google Scholar]
  32. Yang, H.; Wang, K.; Ye, B. Genesis of the Xiangluwanzi Gold Deposit, Northeastern China: Insights from Fluid Inclusions and C-H-O Isotopes. Minerals 2025, 15, 250. [Google Scholar] [CrossRef]
  33. Taylor, H.P. The application of oxygen and hydrogen isotope studies to problems of hydrothermal alteration and ore deposition. Econ. Geol. 1974, 69, 843–883. [Google Scholar] [CrossRef]
  34. Song, B.J.; Wang, X.Y.; Ma, J. Characteristics of geological, genesis and structural background of gold deposits in the North Daxing’anling, Northeast China. Miner. Petrol. 2014, 35, 15–24, (In Chinese with English Abstract). [Google Scholar]
  35. Pokrovski, G.S.; Akinfev, N.N.; Borisova, A.Y.; Zotov, A.V.; Kouzmanov, K. Gold speciation and transport in geological fluids: Insights from experiments and physicalchemical modelling. Geol. Soc. Lond. Spec. Publ. 2014, 402, 9–70. [Google Scholar] [CrossRef]
  36. Harris, A.C.; Golding, S.D. New evidence of magmatic-fluid-related phyllic alteration: Implications for the genesis of porphyry Cu deposits. Geology 2002, 30, 335–338. [Google Scholar] [CrossRef]
  37. Chen, Y.J.; Ni, P.; Fan, H.R.; Pirajno, F.; Lai, Y.; Su, W.C.; Zhang, H. Diagnostic fluid inclusions of different types hydrothermal gold deposits. Acta Petrol. Sin. 2007, 23, 2085–2108, (In Chinese with English Abstract). [Google Scholar]
  38. Bodnar, R.J. Revised equation and table for determining the freezing point depression of H2O-NaCl solutions. Geochim. Cosmochim. Acta 1993, 57, 683–684. [Google Scholar] [CrossRef]
  39. Hedenquist, J.W.; Arribas, A.; Gonzalez-Urien, E. Exploration for epithermal gold deposits. Rev. Econ. Geol. 2000, 13, 245–277. [Google Scholar] [CrossRef]
  40. Martín-Izard, A.; Gumiel, P.; Arias, M.; Cepedal, A.; Fuertes-Fuente, M.; Reguilón, R. Genesis and evolution of the structurally controlled vein mineralization (Sb-Hg) in the escarlati deposit (León, Spain): Evidence from fault population analysis methods, fluid-inclusion research and stable isotope data. J. Geochem. Explor. 2009, 100, 51–66. [Google Scholar] [CrossRef]
  41. Wang, Z.L.; Yang, L.Q.; Guo, L.N.; Marsh, E.; Wang, J.P.; Liu, Y.; Zhang, C.; Li, R.H.; Zhang, X.L.; Zhao, H. Fluid immiscibility and gold deposition in the Xincheng deposit, Jiaodong Peninsula, China: A fluid inclusion study. Ore Geol. Rev. 2015, 65, 701–717. [Google Scholar] [CrossRef]
  42. Chaussidon, M.; Lorand, J.P. Sulphur isotope composition of orogenic spinel Herzolite Massifs from Ariege (North-Eastern Pyrenees, France):An Ion microprobe study. Geochim. Cosmochim. Acta 1990, 54, 2835–2846, (In Chinese with English Abstract). [Google Scholar] [CrossRef]
  43. Hoefs, J. Stable Isotope Geochemistry; Springer: Berlin/Heidelberg, Germany, 2009; pp. 1–286. ISBN 978-3-642-01094-7. [Google Scholar]
  44. Ohmoto, H.; Goldhaber, B. Sulphur and Carbon Isotopes. In Geochemistry of Hydrothermal Ore Deposits; Barnes, H.L., Ed.; Wiley: New York, NY, USA, 1997; pp. 517–600. [Google Scholar]
  45. Quan, H.; Graham, I.; Worland, R.; Adler, L.; Dietz, C.; Madayag, E.; Wang, H.; French, D. Interpreting the Complexity of Sulfur, Carbon, and Oxygen Isotopes from Sulffdes and Carbonates in a Precious Metal Epithermal Field: Insights from the Permian Drake Epithermal Au-Ag Field of Northern New South Wales, Australia. Minerals 2025, 15, 134. [Google Scholar] [CrossRef]
  46. Yu, Q.; Wang, K.Y.; Zhang, X.B.; Sun, Q.F.; Bai, W.Q.; Ma, C.; Xiao, Y.C. Fluid evolution and ore genesis of the Songjianghe Au deposit in Eastern Jilin Province, NE China: Constraints from fluid inclusions and H-O-S-Pb isotopes systematics. Minerals 2023, 13, 652. [Google Scholar] [CrossRef]
  47. Dubinina, E.O.; Chugaev, A.V.; Ikonnikova, T.A.; Avdeenko, A.S.; Yakushev, A. Sources and fluid regime of quartz-carbonate veins at the Sukhoi Log gold deposit, Baikal-Patom Highland. Petrology 2014, 22, 329–358. [Google Scholar] [CrossRef]
  48. Chugaev, A.V.; Znamenskii, S.E. Lead isotope characteristics of the Mindyak gold deposit, Southern Urals: Evidence for the source of metals. Geol. Ore Deposits 2018, 60, 52–61. [Google Scholar] [CrossRef]
  49. Chen, L.; Liang, C.Y.; Neubauer, F.; Liu, Y.J.; Zhang, Q.; Song, Z.W. Sedimentary processes and deformation styles of the Mesozoic sedimentary succession in the northern margin of the Mohe basin, NE China: Constraints on the final closure of the Mongol–Okhotsk Ocean. J. Asian Earth Sci. 2022, 232, 105052. [Google Scholar] [CrossRef]
  50. Liu, Q.; Liu, C.; Deng, J.F.; Liu, J.X.; Duan, P.X.; Zhang, Y.; Zhao, H.D.; Tian, S.P. Igneous records of transformation from ocean to continent of Mongolia–Okhotsk Ocean: Evidence from granitoids of Woduhe area, Heilongjiang Province, China. Geol. J. 2023, 58, 3694–3719. [Google Scholar] [CrossRef]
  51. Chen, L.; Liang, C.Y.; Neubauer, F.; Liu, Y.J.; Yin, J.Z.; Gao, X.R.; Zhao, J.Q. Nature and multi-stage evolution of the Mongol-Okhotsk Ocean: New insights from the sedimentary record in the Mohe Basin. Earth-Sci. Rev. 2024, 254, 104794. [Google Scholar] [CrossRef]
  52. Badhe, K.; Ni, P.; Wang, G.G.; Liu, Z.; Li, W.S.; Ding, J.Y.; Pan, J.Y. Fluid inclusion and pyrite geochemistry of the Jiapigou gold deposit, North China Craton: Implication for origin of orogenic gold deposit? Ore Geol. Rev. 2024, 174, 106281. [Google Scholar] [CrossRef]
  53. Michael, M.F. Case Histories of Orogenic Gold Deposits. Minerals 2023, 13, 369. [Google Scholar] [CrossRef]
  54. Yao, F.L.; Sun, F.Y. Ore Deposit Geology Tutorial; Geological Publishing House: Beijing, China, 2006. (In Chinese) [Google Scholar]
  55. Wang, Q.F.; Deng, J.; Zhao, H.S.; Yang, L.; Ma, Q.Y.; Li, H.J. Review on orogenic gold deposits. Earth Sci. 2019, 44, 2155–2186, (In Chinese with English Abstract). [Google Scholar]
  56. Chen, Y.J. Orogenic-type deposits and their metallogenic model and exploration potential. Geol. China 2006, 33, 1181–1196, (In Chinese with English Abstract). [Google Scholar]
  57. Goldfarb, R.J.; Groves, D.I.; Gardoll, S. Orogenic gold and geologic time: A global synthesis. Ore Geol. Rev. 2001, 18, 1–75. [Google Scholar] [CrossRef]
  58. Groves, D.I.; Goldfarb, R.J.; Gebre-Mariam, M.; Hagemann, S.G.; Robert, F. Orogenic gold deposits: A proposed classification in the context of their crustal distribution and relationship to other gold deposit types. Ore Geol. Rev. 1998, 13, 7–27. [Google Scholar] [CrossRef]
  59. Hedenquist, J.W. Volcanic-related hydrothermal systems in the Circum-Pacific Basin and their potential for mineralisation. Min. Geol. 1987, 37, 347–364. [Google Scholar]
  60. Wang, X.Z.; Liu, H.L.; Liu, Z.T.; Tang, P.F.; Wang, X.Y. Characteristics of ore minerals and gold-bearing minerals in the Shabaosi gold deposit, Heilongjiang Province. Petrol. Geochem. 2015, 34, 101–109, (In Chinese with English Abstract). [Google Scholar]
  61. Cooke, D.R.; McPhail, D.C. Epithermal Au-Ag-Te Mineralization, Acupan, Baguio District, Philippines: Numerical Simulations of Mineral Deposition. Econ. Geol. 2001, 96, 109–131. [Google Scholar] [CrossRef]
  62. Heinrich, C.A. Fluid-fluid interactions in magmatic-hydrothermal ore formation. Rev. Mineral. Geochem. 2007, 65, 363–387. [Google Scholar] [CrossRef]
  63. Lu, H.Z.; Chi, G.X.; Zhu, X.Q.; Guha, J.; Archambault, G.; Wang, Z.G. Geological characteristics and ore-forming fluids of orogenic gold deposits. Geotecton. Metallog. 2018, 42, 244–265, (In Chinese with English Abstract). [Google Scholar]
  64. Qi, J.P.; Chen, Y.J.; Pirajno, F. Geological characteristics and tectonic setting of the epithermal deposits in Northeast China. J. Mineral. Petrol. 2005, 25, 47–59, (In Chinese with English Abstract). [Google Scholar]
  65. Qiu, Z.J.; Fan, H.R.; Cong, P.Z.; Liu, X.; Yang, K.F. Recent progress in the study of ore-forming processes of orogenic gold deposits. Min. Depos. 2015, 34, 21–28, (In Chinese with English Abstract). [Google Scholar]
  66. Xu, Z.K.; Sun, J.G.; Liu, Y.; Xu, Z.T.; Zhang, X.W.; Pan, Y.D.; Liu, Y.M.; Li, X.P. Timing and ore genesis of the Ciweigou low-sulfidation epithermal gold deposit in the Yanbian Cu-Au district, NE China. Ore Geol. Rev. 2022, 149, 105067. [Google Scholar] [CrossRef]
  67. Shapovalova, M.; Shaparenko, E.; Tolstykh, N. Geochemistry and Fluid Inclusion of Epithermal Gold-Silver Deposits in Kamchatka, Russia. Minerals 2025, 15, 2. [Google Scholar] [CrossRef]
Figure 1. Simplified geotectonic location map (a), simplified geological map of the Mohe Basin (b), and geological map of the Shabaosi gold field (c).
Minerals 15 00721 g001
Figure 2. Geological map of the primary gold deposits. (a) Shabaosi; (b) Sanshierzhan; (c) Laogou; (d) Balifang.
Minerals 15 00721 g002
Figure 4. Histograms of homogenization temperature and salinity for stage II (polymetallic sulfide–quartz) fluid inclusions.
Minerals 15 00721 g004
Figure 5. Laser Raman spectra of fluid inclusions from gold deposits. (a) Shabaosi stage I WJDL010 (CC); (b) Shabaosi stage I WJDL010 (HC); (c) Shabaosi stage I WJDL010 (LV); (d) Sanshierzhan stage I WJDL027 (HC); (e) Sanshierzhan stage I WJDL027 (LV); (f) Balifang stage I WJDL043 (FC).
Minerals 15 00721 g005
Figure 6. δD vs. δ18O diagram for gold deposits (blue = stage I; red = stage II) (modified from [33]).
Minerals 15 00721 g006
Figure 7. Histograms of the sulfur isotope of Shibaosi gold deposit (a) and Mohe Basin (b).
Minerals 15 00721 g007
Figure 8. Homogenization temperature versus salinity plot of fluid inclusions from major gold deposits in the Shabaosi gold field (blue = stage I; red = stage II; green = stage III). (a) Shabaosi; (b) Sanshierzhan; (c) Balifang; (d) Laogou.
Minerals 15 00721 g008
Figure 9. Plumbo-tectonic model of lead isotopes for deposits. (a) 206Pb/204Pb vs. 207Pb/204Pb diagram; (b) 206Pb/204Pb vs. 208Pb/204Pb diagram (blue = stage I; red = stage II).
Minerals 15 00721 g009
Table 1. Geological characteristics of major gold deposits in the Shabaosi gold field.
DepositHost RockMagmatismStructureWall Rock AlterationOre TypeMetallic MineralsGangue MineralsGrade (g/t)Reserves (kg)
ShabaosiSandstone (J3K1e), MarbleDiorite, Granodiorite PorphyrySN-trending, basement structureSilicification, Carbonatization, SericitizationDisseminated fine-grainedPyrite, Arsenopyrite; minor Sphalerite, Galena, ChalcopyriteQuartz, Feldspar, Kaolinite, Mica3.2031,001
SanshierzhanSandstone (J3K1e), MarbleDiorite, Granite PorphyryNE-trending, basement structureSilicification, Kaolinization, Chloritization, CarbonatizationDisseminated fine-grainedPyrite, Arsenopyrite; minor Sphalerite, ChalcopyriteQuartz, Kaolinite, GraphiteI: 2.44
II: 1.64
III: 1.31
6606
LaogouSandstone (J3K1e)Diorite Dikes, Diabase PorphyriteNE-trending, ductile shear zoneSilicification, Sericitization, CarbonatizationSparse vein-disseminated to quartz vein-typePyrite; minor Pyrrhotite, StibniteQuartz, Calcite, Chlorite, KaoliniteI: 2.67677
BalifangSandstone (J3K1m)Diorite, Monzonite PorphyryNE-trending, ductile shear zoneSilicification, Chloritization, CarbonatizationVein-disseminated to quartz vein-typePyrite, Arsenopyrite; minor Sphalerite, GalenaQuartz, Calcite, Chlorite, KaoliniteII: 1.62
III: 2.20–8.80
494
Table 2. Characteristics and microthermometric parameters of fluid inclusions.
DepositStageFI TypeSize (μm)Gas–Liquid RatioNumberTm (Ice) (°C)Th (°C)Salinity
(NaCl wt.%)
Density (g/cm−3)Pressure (MPa)
ShabaosiICC7~1010010/////
FC8~1060~9067.8~−8.1 *315.4~331.23.76~4.690.56~0.6724.51~26.87
HC9~1835~4036.8~8.5 *296.7~323.73.00~6.120.56~0.6723.99~28.65
LV7~1015~2043−5.7~−1.8165.6~269.83.05~8.810.82~0.9412.54~25.24
IILV6~1010~20156−5.4~−1.9187.6~315.73.21~8.400.77~0.9214.66~30.41
IIILV7~1015~2010−3.3~−1.8165.6~182.53.05~5.40.92~0.9412.54~15.28
SanshierzhanIFC7~1265~9076.4~7.3 *238.6~316.65.23~6.810.63~0.7721.71~26.95
HC7~1330~40106.6~7.5 *275.2~326.84.87~6.490.64~0.6922.91~29.28
LV5~815~2015−4.9~−3.2247.6~296.75.25~8.670.79~0.8521.52~28.19
IILV6~1015~2010−5.6~−3.1201.7~236.55.09~7.010.86~0.9016.89~21.09
LaogouICC7~101006/////
FC6~2270~90176.9~7.6 *278.6~357.64.69~5.940.64~0.7023.72~30.44
HC7~1815~50126.5~7.1292.3~354.25.59~6.130.65~0.7126.19~30.82
SL10~1215~203148.0~167.9 **271.6~315.629.58~30.391.14~1.1541.78~49.02
FV5~2055~9017−2.7~−1.9332.8~396.63.21~5.850.55~0.6825.51~32.72
LV5~1815~5036−6.5~−3.1224.6~402.35.09~9.860.60~0.8918.92~40.03
IICC5~71003/////
FC5~1255~95156.9~7.9 *268.2~375.84.14~5.940.61~0.7523.04~32.57
HC5~1535~50156.8~7.6 *316.5~362.34.69~6.120.61~0.6926.47~30.56
FV5~1255~706−3.2~−2.7251.6~329.64.48~5.250.70~0.8320.38~27.72
LV5~205~4049−6.1~−2.8203.4~323.84.63~9.340.74~0.9216.62~30.82
BalifangICC5~1510057/////
FC5~1850~95936.2~8.6 *232.7~343.82.81~7.140.62~0.8517.33~28.73
HC5~2210~50876.0~9.1 *238.7~351.81.83~7.480.58~0.8619.36~29.86
LV5~1515~20165−5.7~−2.0201.4~291.23.37~8.810.81~0.9216.32~28.49
IICC7~151007/////
FC6~1560~95206.4~7.7 *256.9~343.82.81~7.140.68~0.8422.45~28.73
HC5~2025~50216.0~8.0 *266.8~327.63.95~7.480.70~0.8422.94~29.86
LV5~1515~2551 −5.3~−2.4185.9~279.54.01~8.270.81~0.9214.93~25.98
IIILV5~1210~3025−4.0~−2.7155.9~225.94.48~6.440.88~0.9512.63~20.90
Note: * in the Tm (ice) (°C) column represents the CO2 clathrate disappearance temperature; ** daughter mineral disappearance temperature.
Table 3. Hydrogen and oxygen isotope compositions of quartz from gold deposits (‰).
NumberDepositSampleStageδ18O (‰)δ18OH2O (‰)δD (‰)Th (°C)Notes
1ShabaosiSBS–1I–II15.74.70−117.8210.7[31]
2SBS–2I–II14.74.60−138.3226.8
3SBS–3I–II16.25.00−126.1208.3
4SBS–4I–II15.55.60−132.2230.2
5SBS–5I–II14.85.30−132.1238.9
6WJDL008II8.5−1.00−137.3238.9
7WJDL009II7.1−2.40−132.5238.9
8SanshierzhanWJDL027II10.80.35−132.8221.0
9BalifangWJDL032I13.04.79−130.3266.5
10WJDL040I8.90.69−128.1266.5
11WJDL041I10.72.49−124.4266.5
12WJDL042I10.32.09−133.8266.5
13WJDL043I12.03.79−126.2266.5
14WJDL047I12.34.09−118.8266.5
15WJDL050I12.44.19−130.9266.5
16WJDL045II12.61.95−112.1237.5
17WJDL046II11.00.35−135.0237.5
18LaogouHj1L1-2II5.6−1.3−97.0300.5[13]
19Hj1L1-3II9.31.8−120.0285.0
20Hj1L1-5II10.63.5−135.0295.2
21Hj1L1-10I12.15.2−119.0299.2
Table 4. Sulfur isotope compositions of the Shabaosi gold deposit (‰).
Serial NumberSampleOre BodyStageδ34SV–CDT (‰)MeanNotes
1WJDL010II–1I1.60.78This study
2WJDL009II–1II−0.9
3WJDL021II–2II0.5
4WJDL022II–1II1.8
5WJDL023III–1II0.9
Table 5. Lead isotope composition in the Shabaosi gold deposit.
NumberSampleOre BodyStage208Pb/204Pb207Pb/204Pb206Pb/204Pb
1WJDL010II–1I38.56615.63418.386
2WJDL009II–1II38.57915.63618.387
3WJDL021II–2II38.39815.57118.477
4WJDL022II–2II38.43315.59418.441
5WJDL023III–1II38.54615.61418.408
Table 6. Comparative characteristics of epithermal, orogenic and Shabaosi.
Feature CategoryEpithermal Gold DepositsOrogenic Gold DepositsShabaosi Gold Field
Tectonic SettingContinental arc/back-arc extensional setting [54]Early orogenic compression transitioning to late-stage extension [55,56,57]Southeastern margin of Mongol–Okhotsk orogenic belt (late orogenic extension)
Host RocksContinental volcanic sequences [54]Metamorphic rocks/shear zones (no strict lithological control) [58]Upper Jurassic–Lower Cretaceous clastic rocks
Mineralization AgePredominantly Mesozoic–Cenozoic (some Late Paleozoic)Synchronous with orogenic events [56]Early Cretaceous (121.0 ± 1.0–141.1 ± 0.9 Ma)
Ore-Controlling StructuresVolcanic edifices/tensile fracturesHigh-angle strike-slip/thrust faults with brittle–ductile deformation [37,55]Secondary tensile faults of Mohe nappe structure + basement structures
Associated IntrusionsVolcanic–subvolcanic rocksNo direct magmatic association [58]Early Cretaceous intermediate-felsic dikes
Alteration TypesLow-sulfidation: adularia–sericite; high-sulfidation: alunite–kaolinite; propylitic halo [59]Silicification, sericitization, chloritization, carbonatization [58]Silicification, carbonatization, chloritization, kaolinization, sericitization
Ore MineralsPyrite, galena, sphalerite, chalcopyritePyrite, arsenopyrite (dominant) + base metal sulfides [55,56]Pyrite, arsenopyrite (main) + minor Sb-Cu sulfides [60]
Trace ElementsAs-Sb-Hg-Tl enrichment [61]Au-As-Sb-Te-W-Bi enrichment [56]Au-As-Sb-Bi-Te enrichment (pyrite shows Au-Te correlation) [60]
Fluid Inclusion TypesDominantly LV-type (rare daughter minerals) [37]Early: CC-FC-HC-LV types; Late: LV-only [37]Early: CC-FC-HC-LV (rare daughter minerals); late: LV-only
Fluid CharacteristicsMagmatic–meteoric mixing → meteoric-dominated (H2O-NaCl) [37,61]CO2-CH4-rich metamorphic → meteoric (H2O-NaCl) [37]; possible magmatic input [62]Early CO2-CH4-rich → late H2O-NaCl (metamorphic affinity in early stage)
Homogenization T (°C)50–200 °C (up to 320 °C) [37]Shallow: 150–300 °C; Mid: 300–475 °C; Deep: >475 °C [55,63]Early: 240–280 °C; Main: 220–260 °C; Late: 160–200 °C
Mineralization Depth (km)<1.5 (max 2) kmShallow: <6 km; Mid: 6–12 km; Deep: >12 km [58]1.4–3.3 km (avg. >1.5 km)
Material SourcesMagmatic/host rock-derived (δ34S: +1.0‰ to +4.6‰) [64]Variable sulfur sources (δ34S: −20‰ to +25‰) [65]Magmatic-dominated + minor strata (δ34S: −8.3‰ to +9.6‰)
Disclaimer/Publisher’s Note: The statements, opinions and data contained in all publications are solely those of the individual author(s) and contributor(s) and not of MDPI and/or the editor(s). MDPI and/or the editor(s) disclaim responsibility for any injury to people or property resulting from any ideas, methods, instructions or products referred to in the content.

