Article

Fine Crustal Velocity Structure and Deep Mineralization in South China from Joint Inversion of Gravity and Seismic Data

1
Key Laboratory of Intraplate Volcanoes and Earthquakes (China University of Geosciences, Beijing), Ministry of Education, Beijing 100083, China
2
School of Geophysics and Information Technology, China University of Geosciences (Beijing), Beijing 100083, China
3
Department of Geophysics, Graduate School of Science, Tohoku University, Sendai 980-8578, Japan
*
Authors to whom correspondence should be addressed.
Minerals 2025, 15(7), 668; https://doi.org/10.3390/min15070668
Submission received: 25 May 2025 / Revised: 12 June 2025 / Accepted: 19 June 2025 / Published: 20 June 2025

Abstract

The South China block (SCB) is characterized by complex tectonics, large-scale lithospheric deformation, and extensive mineralization in its southeastern region. However, the geodynamic processes and mechanisms driving mineralization remain controversial, partly due to the lack of information on its fine crustal structure. The resolution of crustal seismic tomography is relatively low due to the uneven distribution of local earthquakes in South China. In this study, we conduct a joint inversion of Bouguer gravity and seismic travel-time data to investigate the detailed 3-D P-wave velocity (Vp) structure of the crust beneath the SCB. Our results show the following: (1) strong lateral heterogeneities exist in the crust, which reflect the surface geology and tectonics well; (2) the Vp patterns at different depths beneath the Yangtze block are almost consistent, but those beneath the Cathaysia block vary significantly, which might be related to the lithosphere thinning in the Mesozoic; (3) decoupling between the upper crust and the lower crust occurs at ~20 km depth beneath the eastern SCB; (4) the Vp patterns vary beneath different metallogenic belts; and (5) distinct low-Vp anomalies exist in the lower crust beneath mineral deposits. These results suggest that the deep mineralization is closely associated with the lithospheric thinning and upwelling thermal flow in the Mesozoic beneath the eastern SCB. Our Vp tomographic result also strongly supports the viewpoint that the mineralization mechanism varies for different metallogenic belts.

1. Introduction

The South China block (SCB) is situated at the southeastern edge of the Eurasian plate. It is generally considered that the SCB was formed through the collision and amalgamation of the Yangtze block and the Cathaysia block along the Jiangnan orogen during the Neoproterozoic [1,2]. During the Triassic, the northern SCB collided with the North China Craton, giving rise to the formation of the Qinling–Dabie orogenic belt [3]. In the west, the SCB might have collided with the Songpan–Ganzi block of the Tibetan Plateau during the Triassic [4]. The SCB lithosphere has been severely disrupted due to past tectonic events such as thrusting and plate subduction.
The SCB has become one of the richest regions of polymetallic mineral resources in the world, having a low-temperature metallogenic province of Au, Sb, Zn, and Pb deposits in the west and a high-temperature metallogenic province of Sn and W deposits in the east [5]. In the eastern SCB, there are some significant ore belts, such as the Qinhang ore belt (Cu-Au), the Middle–Lower Yangtze River ore belt (Au-Cu-Fe), the Jiangnan ore belt (W-Sn-Nb-Ta), the Nanling ore belt (W-Sn-Mo-REE), and the Wuyi ore belt (Ag-Pb-Zn-U) [6]. These ore deposits are predominantly linked to the Late Mesozoic magmatic activity, dating back ~170 to 90 Ma, which underwent multi-stage mineralization with peaks at 170 Ma (Qinhang), 150 Ma (Wuyi), 145 Ma (Jiangnan), and 135 Ma (Middle–Lower Yangtze River) [6,7]. These multi-stage magma activities have brought about significant transformations to the SCB crust. Therefore, the SCB has been an ideal region for investigating the relationship between crustal structure and deep mineralization.
Previous studies have extensively explored the crust–mantle structure of the SCB through various geophysical methods [8,9,10,11,12,13]. Teleseismic receiver-function analyses showed that the SCB crust thins from ~40 km inland (the Yangtze block) to ~30 km near the coast (Cathaysia block) [14,15,16]. The 3-D crustal velocity structure can be well constrained by seismic tomography [17,18]. Ambient noise tomography was used to study the shear-wave velocity (Vs) structure [19] and crustal anisotropy of the SCB [20]. A fine crustal velocity model was obtained by deep seismic reflection surveys [21], which are generally very expensive. Teleseismic travel-time tomography was conducted to investigate the 3-D isotropic and anisotropic velocity structures of the lithosphere and asthenosphere [22,23], but this method could not explore the crustal structure well because the teleseismic rays did not crisscross in the crust. To date, there have been few studies investigating the crustal P-wave velocity (Vp) structure of the SCB using seismic body-wave tomography because of the low seismicity in the central SCB.
To investigate the detailed crustal structure beneath the SCB, the joint inversion method has received increasing attention and been developed rapidly. Researchers combined gravity data and receiver function in a joint inversion to improve crustal thickness measurements across South China [24]. In another study, surface and body-wave data were jointly inverted to develop a 3-D model of the crust and upper mantle beneath east-central China [25]. Additionally, a probabilistic inversion incorporating multiple datasets was conducted to investigate the velocity profiles, thermal properties, and density variations in the upper mantle beneath South China [26]. However, achieving high spatial resolution in velocity models by a joint inversion remains difficult. Benefiting from the superior lateral resolution of gravity data and the high depth resolution of seismic body-wave data, here we carry out a joint inversion of seismic travel-time data and gravity data to obtain a better 3-D Vp model of the crust beneath the SCB. Especially for the region with scarce ray crisscrossing beneath the central SCB, the joint inversion of seismic and gravity data can significantly improve the spatial resolution. Our results reveal distinct crustal heterogeneities, offering new insights into the Mesozoic mineralization process in the SCB.

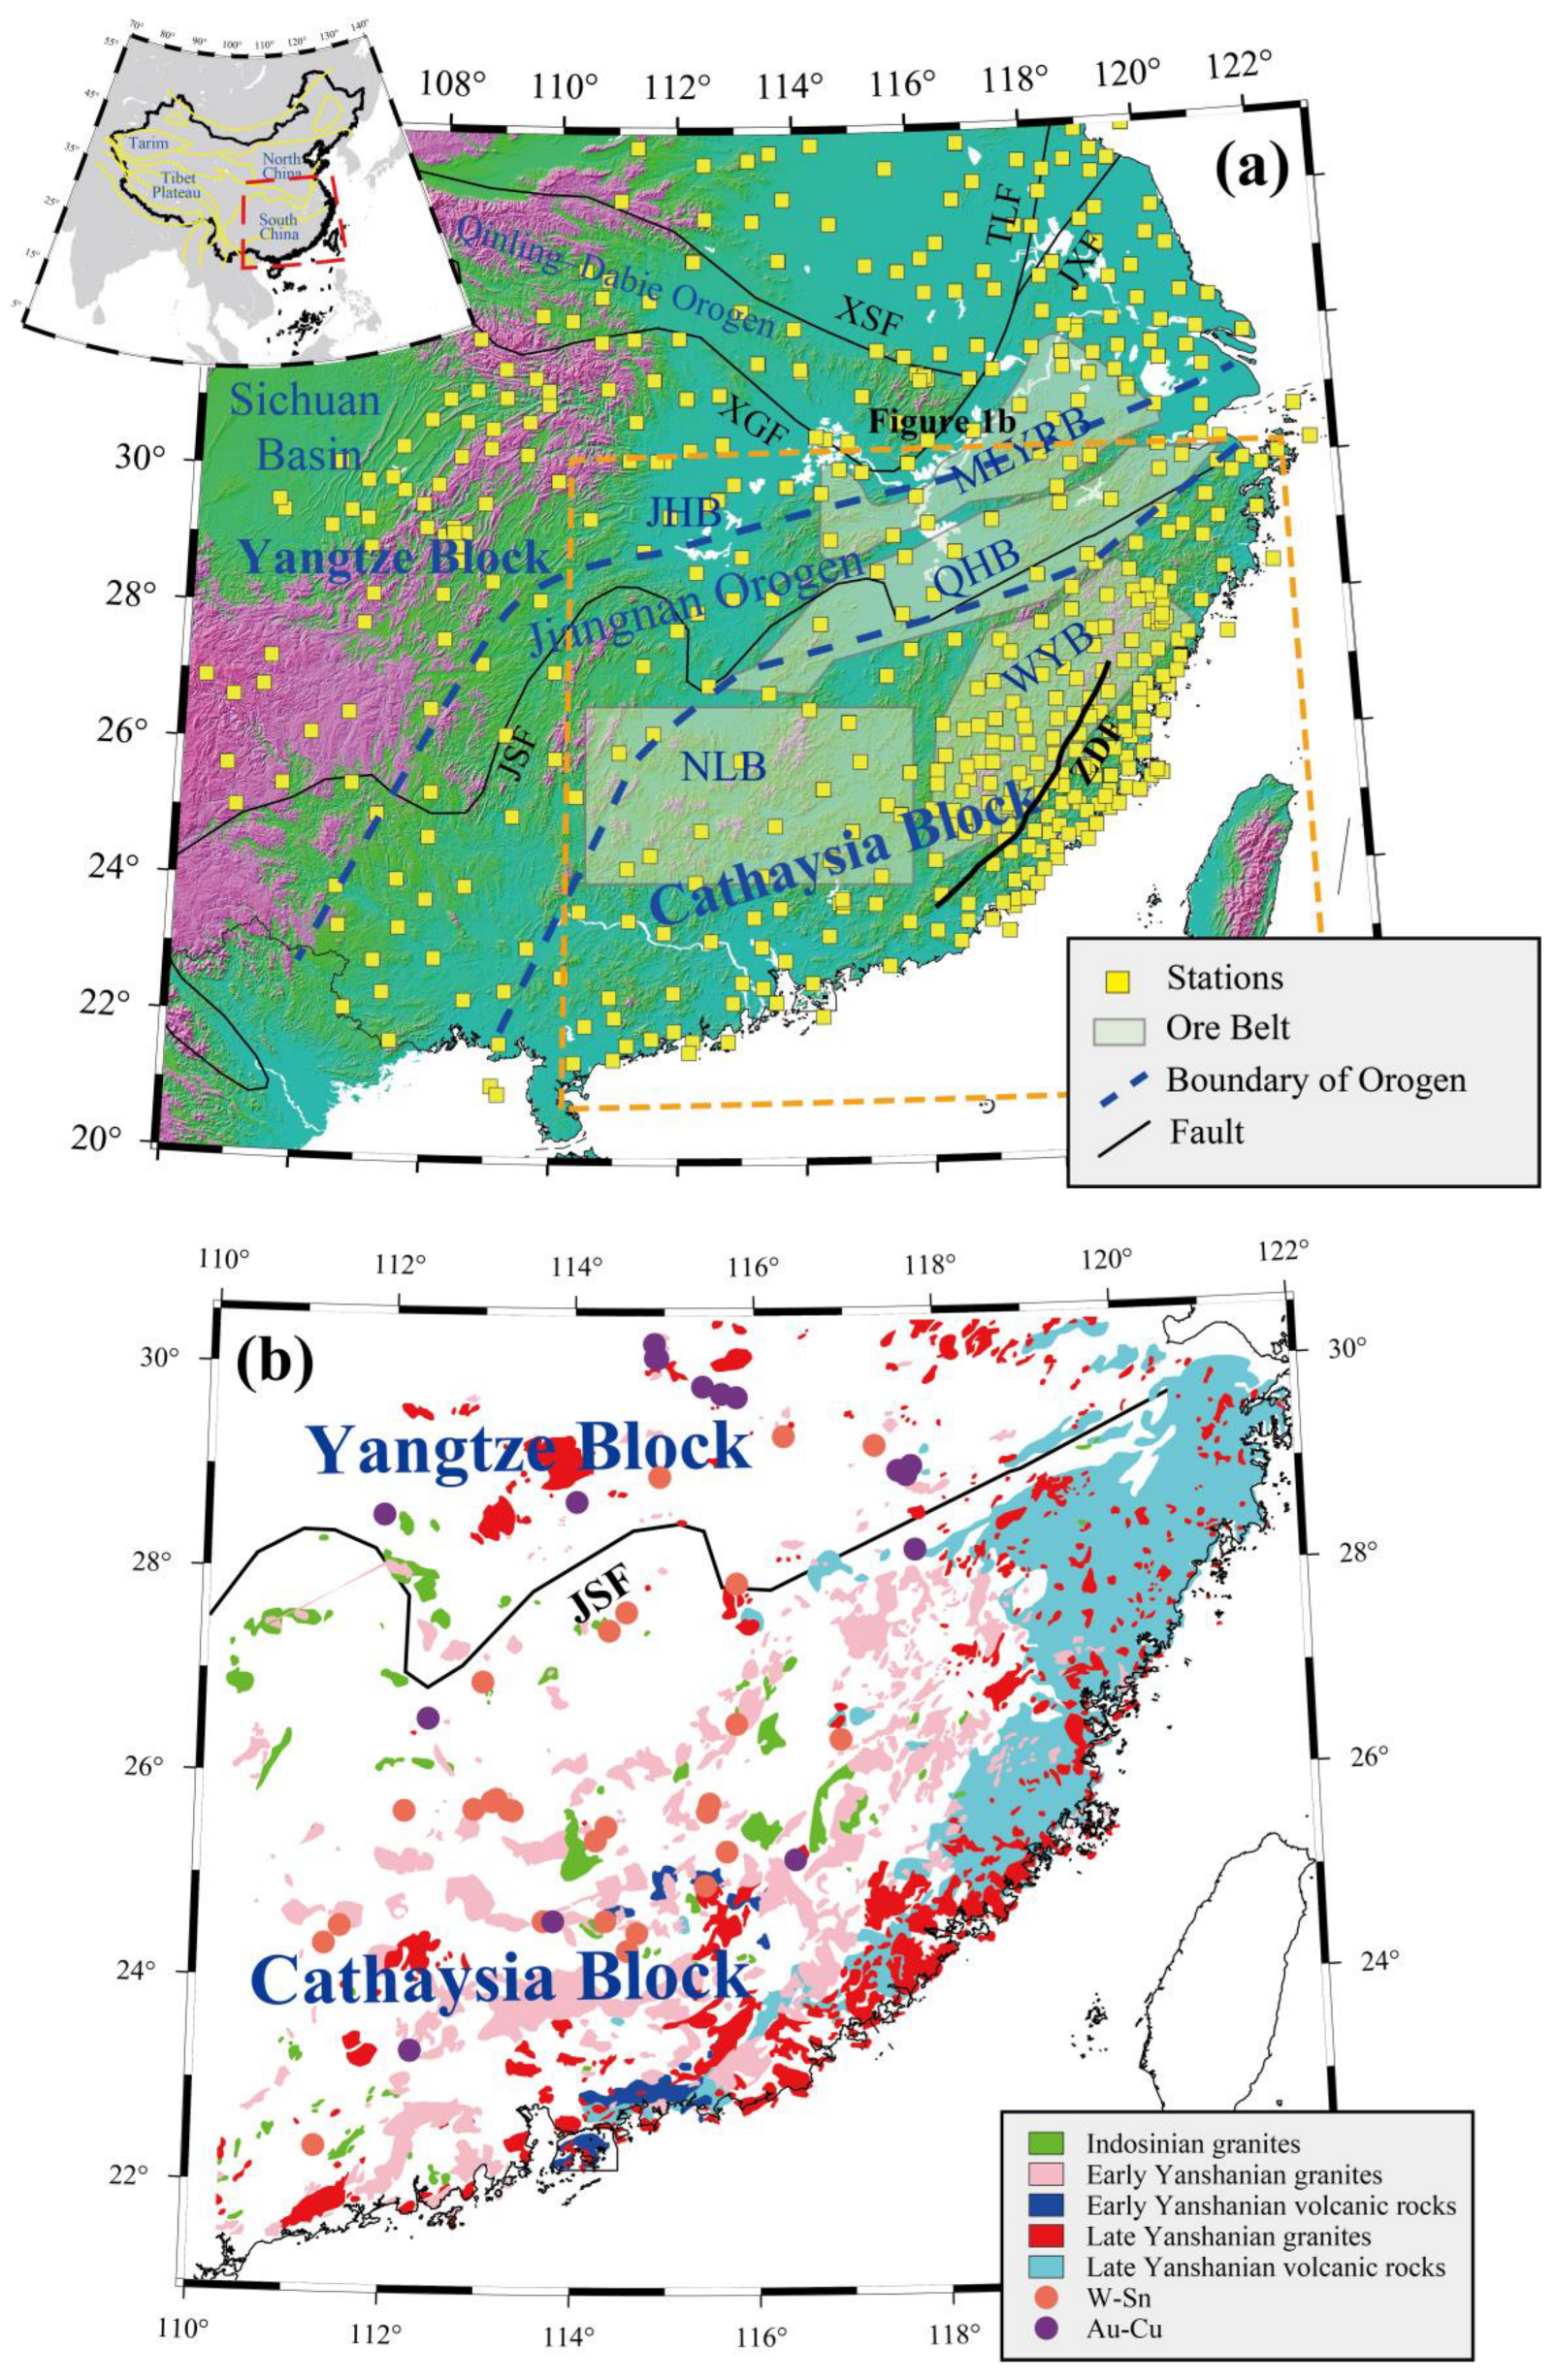
2. Geological Background

The Neoproterozoic and Mesozoic are two significant periods in the SCB’s evolution. The collision and amalgamation of the Yangtze Craton and the Cathaysia block during the Neoproterozoic led to the formation of the South China continental block [27]. During the Neoproterozoic, the Rodinia supercontinent underwent assembly and fragmentation [28,29]. The western Yangtze block was one of the most significant continental components during the evolution of Rodinia. Its basement is predominantly composed of Neoproterozoic rocks, with subordinate exposures of Paleoproterozoic and Mesoproterozoic basement units [30]. In the Mesozoic, the SCB lithosphere was severely disrupted [31,32], which led to lithospheric thinning, widespread magmatic activity, and extensive mineralization. Receiver function results suggest that the lithospheric root within the SCB remains deeper than 170 km just beneath the Sichuan basin in the southwest [33], while the lithosphere in other regions is less than 80 km thick [34]. Several geodynamic models were proposed to account for the Mesozoic lithospheric thinning in the SCB, such as the subduction of the paleo-Pacific Plate [21,33], an Andean-type active continental margin [35], and an Alpine-type collision belt [36]. Despite ongoing debates regarding the associated dynamic processes, the subduction of the paleo-Pacific Plate is frequently employed to explain the Mesozoic magmatic activity and polymetallic mineralization in the SCB [37,38]. In the Early Permian, the paleo-Pacific Plate subduction might have triggered a transformation in the southeastern SCB, shifting its tectonic setting from a passive to an active continental margin [31,39]. The western Yangtze Craton’s basement predominantly comprises exposed Archean–Proterozoic lithologies. In contrast, Mesozoic granites and volcanics are mainly found in the southeast of the SCB, while Cenozoic basalts occur in the vicinity of the southeastern coastal zone [7]. Different ore belts in the eastern SCB correspond to different processes of mineralization. The Nanling ore belt is predominantly composed of Yanshanian granites [40], whereas the Middle–Lower Yangtze River ore belt is mainly characterized by Neoproterozoic and Mesozoic igneous rocks [41]. The Wuyi ore belt is dominated by Yanshanian volcanic and intrusive rocks [42], whereas the Qinhang ore belt is primarily composed of Jurassic granites [43].

3. Data and Methods

3.1. Seismic Data and Tomography

In this study, the seismic travel-time data were extracted from seismic phase reports of local earthquakes, which were provided by the Second Monitoring Center of the China Earthquake Administration. Local earthquakes were selected according to the following two primary criteria: (1) that each epicenter was situated in the range of 104°–123° E longitude and 20°–35° N latitude, (2) that each event was recorded at five or more seismic stations. As a result, our dataset contains 82,175 local earthquakes recorded at 678 permanent stations (Figure 1 and Figure 2). The earthquakes primarily occurred in coastal regions and along the southwestern Yangtze block. However, a few events occurred in the central part of the study region. After the removal of outliers beyond the travel-time curve, a total of 238,971 high-quality P-wave arrival-time data are used for tomographic inversion (Figure 2).
We apply the TOMOG3D method [17,18] to the P-wave arrival-time data to obtain a 3-D Vp model down to 40 km depth beneath the SCB. This method has proven to be highly effective and has been widely employed to analyze 3-D velocity variations in the crust and upper mantle [22,23,45,46,47,48]. This tomographic approach involves establishing a 3-D grid in the study volume, with Vp perturbations (dVp, from a 1-D starting model) at the grid nodes serving as the primary variables to be determined. The dVp at each point in the study volume is calculated through the linear interpolation of the dVp values at eight grid nodes surrounding that point. At the core of TOMOG3D lies a sophisticated 3-D ray-tracing method [17] that seamlessly integrates the pseudo-bending approach for continuous media with Snell’s law at velocity boundaries like the Moho discontinuity. Once the ray paths and theoretical travel times are calculated with the 3-D ray tracing code, a large sparse system of observation equations is formulated, which is subsequently solved using the LSQR algorithm [49] with damping regularizations.
As shown in Figure 3a, the optimal damping value is found to be 25.0 according to the trade-off curve between the norm of the 3-D Vp model and the root-mean-square (RMS) travel-time residual.

3.2. Gravity Data and Inversion

In this study, we collected the satellite Bouguer gravity anomaly data in South China from the grid database of the global gravity map WGM2012 [50]. The data cover a range of 104° E–123° E and 20° N–35° N. It is well known that gravity anomalies result from undulations of discontinuities and heterogeneous mass distributions within the Earth. Therefore, it is essential to remove these influences prior to the gravity inversion. The WGM2012 model is derived from the global satellite gravity model EGM2008 and has already been terrain-corrected using the DTU10 digital elevation model at a 1′ × 1′ grid setting. On this basis, three additional effects need to be accounted for and removed: (1) the influence of sedimentary layer thickness variations, (2) the effect of the Moho undulations, (3) anomalies caused by mass heterogeneity below the crust. The anomalies induced by the Moho discontinuity and the sedimentary layer are computed in the frequency domain using the Parker method [51] in gravity field separation, whereas the thickness data of the crust and the sedimentary layer are derived from the latest global crustal model CRUST1.0 [52]. The density contrasts across the base of the sedimentary layer and the Moho used in this study are 0.4 g/cm3 and 0.2 g/cm3, respectively, referring to previous studies [53,54]. The relationship between the spherical harmonic degree and source depth can be used to estimate gravity anomalies caused by deep mass heterogeneities. The depth to the source Z is given by
Z = R n 1
where Z represents the burial depth of the source, n is the degree of the spherical harmonic, and R is the radius of Earth. In this study, we adopt spherical harmonic degrees ranging from 2 to 160 to calculate the satellite Bouguer gravity anomalies with depths greater than 40 km beneath the SCB. The final complete lattice anomalies are shown in Figure 4, in which positive gravity anomalies are primarily concentrated in the central part of the SCB and the Sichuan basin, whereas negative anomalies are mainly distributed in the southeastern Cathaysia block and around the Sichuan basin.
After the above processing, we utilize the gravity inversion method proposed by Li and Oldenburg [55]. The depth weighting function is used to suppress the decay of the sensitivity kernel matrix with depth,
W Z Z = 1 ( Z + Z 0 ) β 2
where Z is the depth of the subsurface model center and Z0 and β are constants. The value of Z0 is determined by the model cell size and the observation height of the gravity data. In this study, Z0 and β are set to 12.3 km and 2.0, respectively. Considering the stratified crustal structure of the SCB, the inversion is performed for multiple depth layers (5, 10, 15, 20, 30, and 40 km) with a lateral grid interval of 0.25° to enable a high-resolution investigation of the crustal density structure.

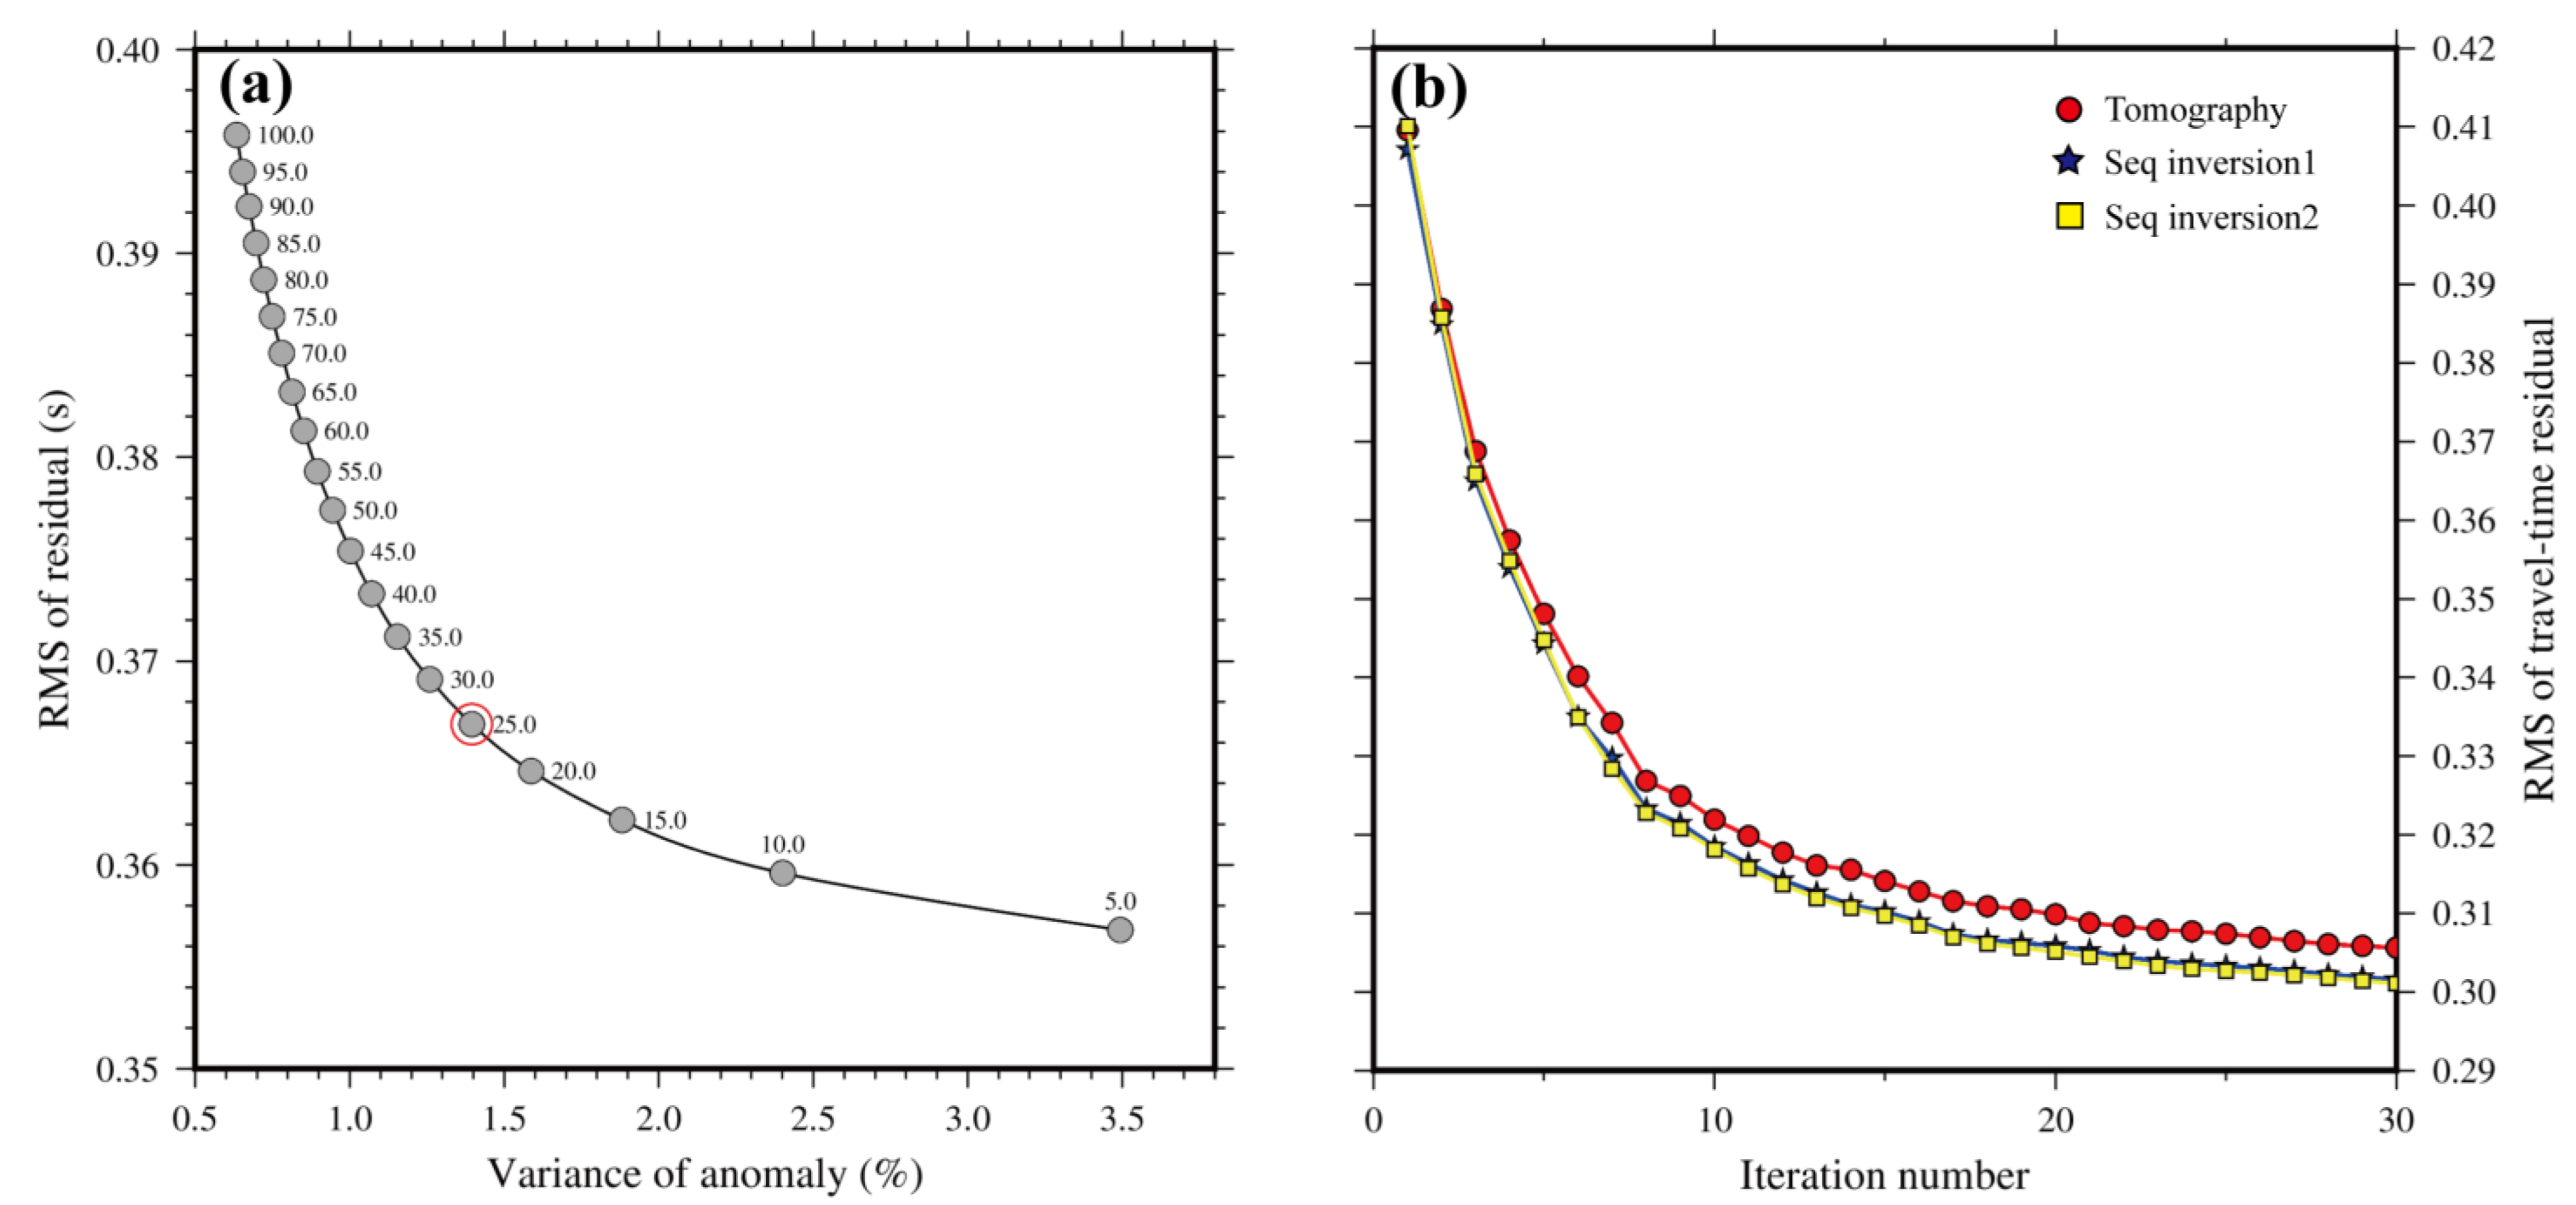
3.3. Seismic and Gravity Joint Inversion

We employ a sequential inversion approach for combined gravity and seismic data analysis. Firstly, the seismic travel-time data are inverted for a 3-D Vp model with the TOMOG3D method. Secondly, the 3-D Vp model is transformed into a 3-D density model via the Vp-density relationship. Thirdly, considering this 3-D density model as an initial model, the Bouguer gravity data are inverted for an updated 3-D density model. Finally, the updated density model is converted to a Vp model, which serves as the initial model for the next Vp inversion. The above steps are carried out iteratively until the objective function converges to a stable minimum (Figure 3b).
An appropriate relationship between seismic velocity and density has a significant impact on the inversion result. Many previous studies have proposed various relationships between rock velocity and density under different conditions, e.g., linear [56], exponential [57], piecewise linear [58], and polynomial relationships [59]. Here we employ the segmented linear relationship presented by Feng et al. [60], which is found to be optimal by considering the tectonic background of the SCB,
ρ = 2.78 + 0.56   V P 0.6 5.5 V P 6.0 ρ = 3.07 + 0.29   V P 7.0 6.0 < V P < 7.5 ρ = 3.22 + 0.20   V P 7.5 7.5 V P 8.5
where ρ is density in g/cm3 and Vp is in km/s.

4. Resolution Analysis

4.1. Checkerboard Tests for Seismic Tomography

Spatial resolution analysis is crucial for geophysical inversion. We use the checkerboard resolution test (CRT) to identify the best grid spacing [17]. We firstly establish a 3-D grid in the study volume. We perform the three CRTs, and the horizontal grid intervals are taken to be 1.25°, 1.0°, and 0.75°, respectively. The vertical grid interval is set to 5 km in the shallow layers and to 10 km in the deeper layers (Figure 5b–d). Secondly, Vp anomalies of ±3% based on the 1-D IASP91 model [61] are alternately assigned to adjacent grid nodes to construct a checkerboard Vp model (the synthetic model). Thirdly, we employ the 3-D ray-tracing scheme [17] to compute theoretical travel times for the synthetic model. The synthetic data are contaminated with random noise with a deviation of 0.1 s to simulate picking errors. Finally, the synthetic travel times with random noise are inverted to generate a 3-D Vp model (the output model). Figure 5 shows the results of the three CRTs at 15 km depth with varying grid intervals. Comparing these test results, the optimal grid interval is determined to be 1.0° according to the pattern of recovered Vp anomalies. Figure 6 shows that the resolutions at depths greater than 10 km beneath the central part of SCB are lower, because P-wave rays do not crisscross well there (Figure 5a).

4.2. Checkerboard Tests for Joint Inversion

To examine the effect of gravity data on the spatial resolution of the crustal structure in the joint inversion, we performed a new CRT. In the input synthetic model, density and Vp anomalies are alternated in the horizontal direction, and the pattern is the same in the depth direction. The horizontal grid interval is 1.0° and the anomaly value is ±3%. For gravity, each grid node represents the centroid of each mass. The joint inversion method as described in Section 3.3 is used to invert the synthetic gravity and seismic data obtained by forward modeling. Figure 7 shows that the resolution in the deep parts is significantly improved, especially in areas with low ray density, indicating that joint inversion can indeed achieve a higher resolution than seismic inversion alone.

5. Results

For the joint inversion of the real observed data, prism cells with a lateral interval of 0.25° are used to divide the study volume for gravity inversion, while the lateral grid interval for seismic tomography is set to 1.0°. When converting density to Vp, we take the density values at the centers of every four prism cells and assign them to the adjacent grid nodes for Vp. Conversely, we use the Kriging interpolation method to convert Vp at each grid point to the density of each of the four adjacent prisms [62].

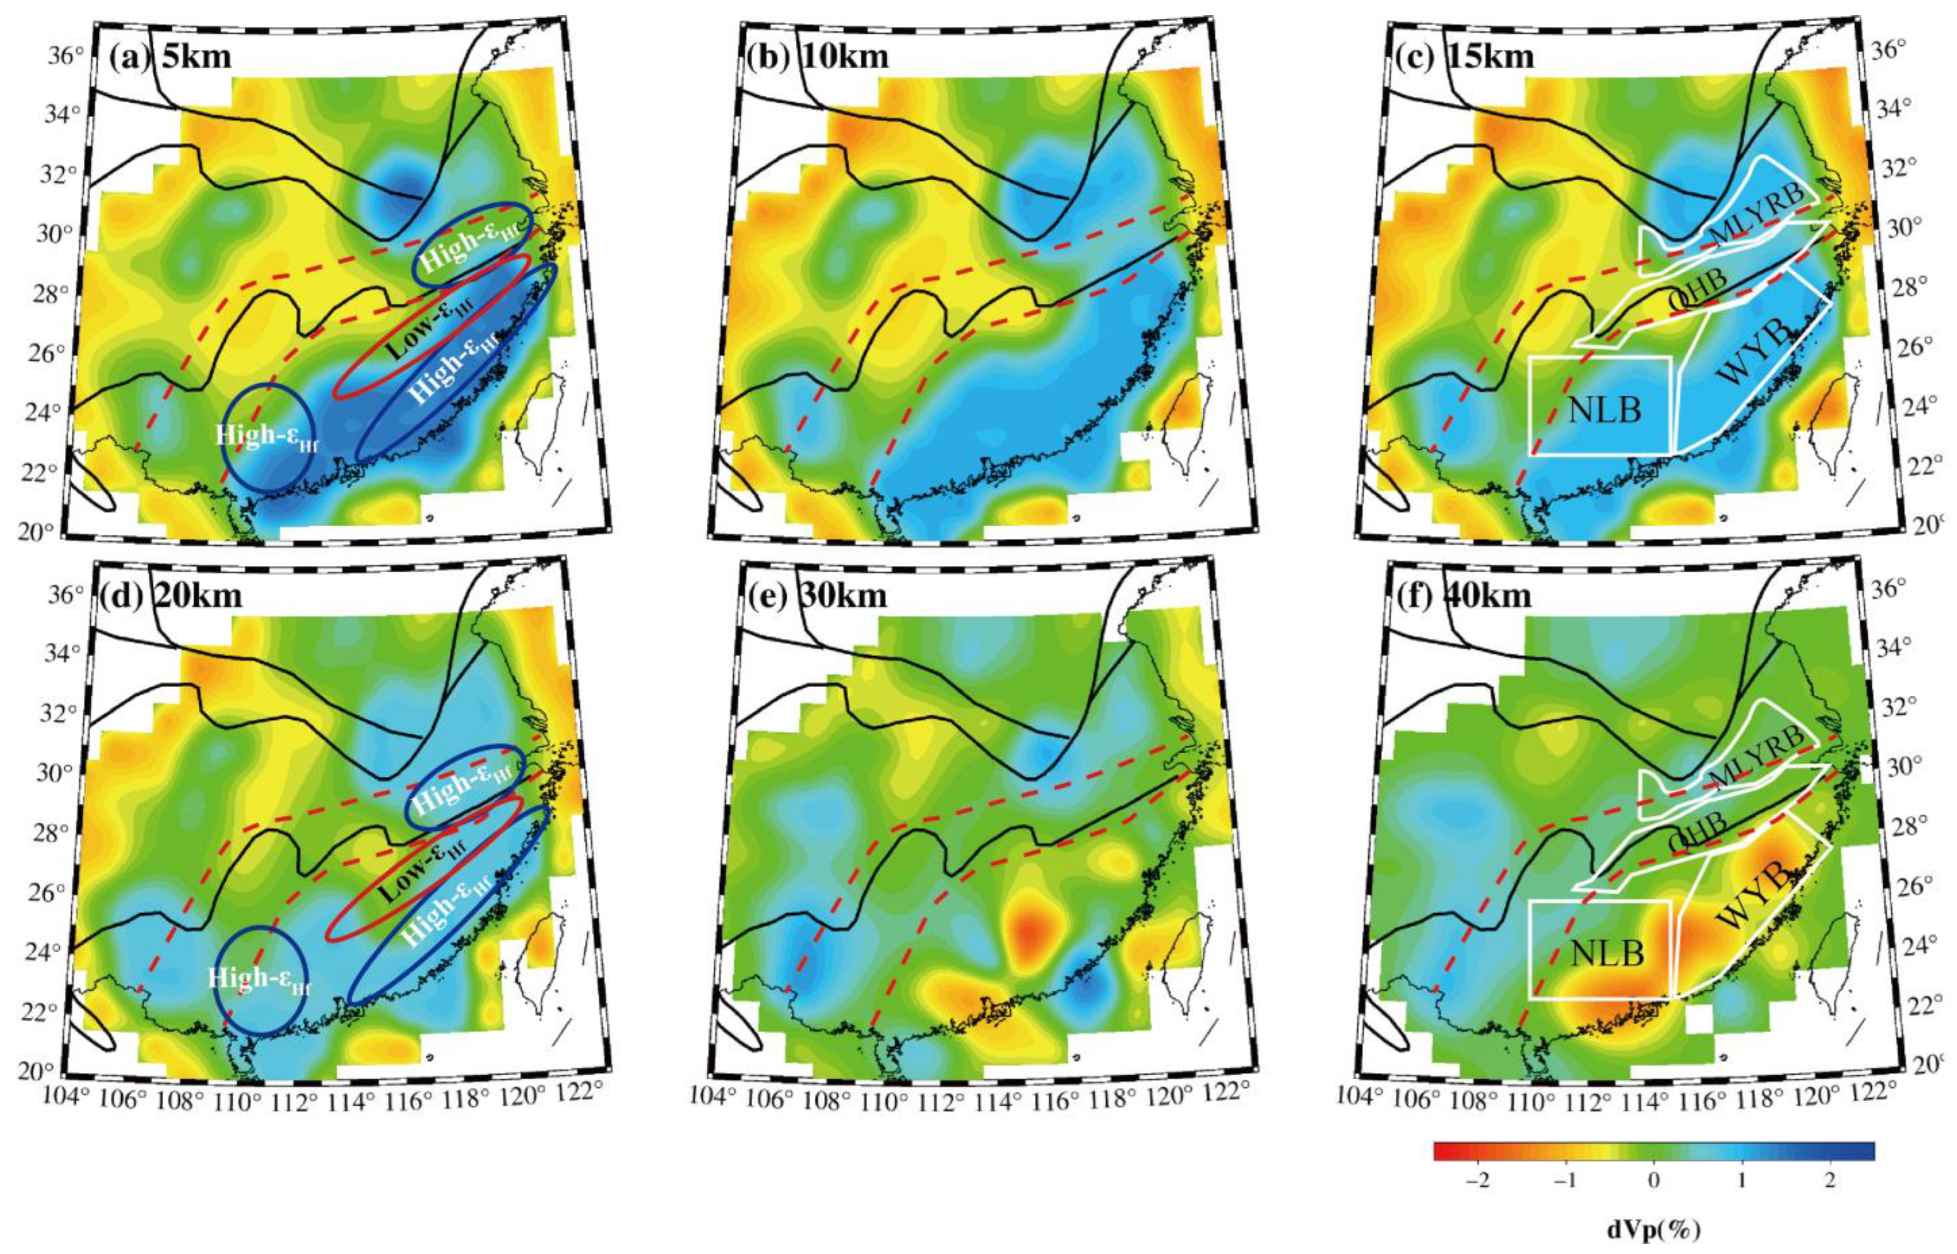
5.1. Map Views of Velocity Structure

Figure 8 and Figure 9 show map views of the crustal Vp images obtained by seismic inversion and joint inversion, respectively. Notably, the joint inversion reveals more detailed lateral Vp variations. Figure 8 just shows the major velocity features in the crust and uppermost mantle beneath the SCB. Obvious low-velocity (low-Vp) anomalies exist beneath the middle Yangtze block, whereas high-velocity (high-Vp) anomalies appear beneath the Cathaysia block and the Lower Yangtze block at depths of 5–20 km. The Jiangnan orogen seems to be the transition zone between high-V and low-V anomalies. At depths of 30–40 km, there exist some low-Vp anomalies near the coast under the Cathaysia block. Therefore, the crustal Vp images reflect the surface geology and tectonic features well.
Figure 9 shows the Vp tomographic results obtained by the joint inversion, which show more refined velocity variations. The Vp anomalies at depths of 5–30 km beneath the Yangtze block and the Jiangnan orogen are almost consistent, but those beneath the Cathaysia block show large depth variations. The pattern of Vp anomalies in the upper crust (at 5–15 km depths) is different from those in the lower crust and the uppermost mantle (at 30–40 km depths) beneath the Cathaysia block. The latest results also show significant differences in radial anisotropy at a ~20 km depth beneath the Cathaysia block [63]. In addition, other results indicate that the Vs structure beneath the SCB transitions near the middle crust [64]. Therefore, we consider that the depth of 20 km might represent a transition layer. In addition, we can also infer that the lower crust and the upper crust beneath the Cathaysia block are decoupled, which is different from the Yangtze block.
In Figure 9, some prominent low-Vp anomalies are marked as L1-L4, and some high-Vp anomalies are marked as H1-H3. In the west, the low-Vp anomalies are mainly located beneath the Jianghan basin (L3), the margin of the Sichuan basin (L1), and the western Jiangnan orogen (L4). It is worth noting that L3 and L4 are consistent with low-Vp/Vs anomalies [24]. In contrast, the high-Vp anomalies in the east are primarily associated with orogens near the southeastern coast (H3). Additionally, a prominent high-Vp anomaly (H2) is identified at the southwestern Yangtze Craton. In the western SCB, an obvious high-Vp anomaly (H1) exists beneath the Sichuan basin, which is also evident in previous large-scale Vp tomography [65]. In the eastern SCB, at depths of 30–40 km, a broad low-Vp anomaly (L2) is clearly visible, aligning with the regional pattern of elevated surface heat flow [66]. Comparing our Vp tomography with the results of zircon Hf isotopic mapping [6], the Vp image of the upper crust under the Cathaysia block exhibits strong spatial alignment with the Hf isotope distribution (Figure 9), suggesting that the crust beneath the eastern SCB has undergone severe modification or was seriously reworked.

5.2. Vertical Cross-Sections of Velocity Structure

Figure 10 shows seven vertical cross-sections of Vp tomography across the study area, in which four profiles are parallel to the Qinling-Dabie orogenic belt (AA’–DD’) and the other three profiles are perpendicular to it (EE’–GG’). Along the AA’, BB’, and EE’ profiles, there is a prominent low-Vp anomaly (L1) beneath the western Qinling–Dabie orogenic belt (DBO), extending throughout the entire crust (Figure 10a,b,e). In the AA’ profile, a distinct low-Vp anomaly (L2) in the lower crust is also identified beneath the Lower Yangtze block (Figure 10a). Similarly, in the DD’ and GG’ profiles, L2 is clearly concentrated in the lower crust beneath the Wuyi metallogenic belt, whereas a strong high-Vp anomaly (H3) exists in the upper crust (Figure 10d,g). In the BB’ and CC’ profiles, a pronounced low-Vp anomaly is detected beneath the Zhenghe-Dapu fault zone, which could serve as a principal channel for magmatic upwelling [21]. In the BB’ and FF’ profiles, the distinct low-Vp anomalies L3 and L4 appear beneath the Jianghan basin and the eastern Jiangnan orogen, respectively (Figure 10b,f). In the CC’ profile, a high-Vp anomaly (H1) appears in the middle–lower crust beneath the Sichuan basin (Figure 10c), exhibiting a cratonic feature. In addition, a distinct high-Vp anomaly (H2) is imaged beneath the southwestern Yangtze Craton along the DD’ and EE’ profiles (Figure 10d,e).

6. Discussion

6.1. Geological Implications of Velocity Tomography

Our results show two primary features of seismic velocity: (1) there is a very good consistency between the Vp structure and the surface geology; (2) the high-Vp anomalies in the upper crust change to low-Vp anomalies in the lower crust beneath the Cathaysia block, where the Mesozoic polymetallic mineralization belts exist. These features suggest that the crustal Vp structure might reflect the remnants of Mesozoic geodynamics. In general, the presence of high temperatures, partial melting, or fluids (e.g., water, magma) reduces the elastic modulus of rocks, leading to a decrease in Vp. In contrast, changes in mineral composition (e.g., an increase in mafic minerals) and increases in pressure enhance rock density and elastic modulus, causing an increase in Vp.
The high-Vp anomaly (H1) beneath the Sichuan basin likely reflects the presence of an ancient and stable craton, suggesting that this region experienced little significant lithospheric modification during the Mesozoic. In contrast, lithospheric reworking during the Mesozoic was predominantly localized in the eastern SCB. Mesozoic granites are primarily located in the Lower Yangtze block and the Cathaysia block [7,43]. Our results reveal pronounced low-Vp anomalies (L2) at the base of the crust in the eastern Cathaysia block, overlain by a high-Vp zone (H3). The low-Vp feature (L2) may reflect elevated temperatures at the crust–mantle boundary [66]. The high-Vp belt (H3) only occurs in the upper crust beneath the Cathaysia block, which indicates that it remains an old and stable crustal feature owing to the absence of intense pre-Jurassic crustal remelting [6]. Seismic reflection profiles revealed a distinct velocity gradient near the Moho beneath the SCB, indicating that deep thermal material likely ascended only to the crust–mantle boundary [21,67]. This feature corresponds well to the low-Vp anomalies in the middle to lower crust (Figure 9).
In addition, the upwelling of deep magma likely exploited deeply buried fault zones as pathways to reach the surface. These faults usually penetrate the Moho. Deep seismic reflection profiles show significant structural differences between the upper and lower crust on either side of the Zhenghe–Dapu fault zone, suggesting that this fault likely extends deep into the crust [67]. In our BB’ and CC’ profiles (Figure 10b,c), low-Vp anomalies beneath the Zhenghe–Dapu fault zone are clearly visible, indicating that this fault likely served as a conduit for magmatic upwelling during the Mesozoic [68].

6.2. Geodynamics and Mineralization

Previous studies suggested a structural shift in the SCB from a compressive to an extensional tectonic phase during the Mesozoic [7,44,69]. This shift caused major alterations in crustal composition, triggering widespread magmatism and polymetallic ore formation [70]. The geochronological studies suggested that the SCB underwent two separate periods of volcanic activity, from the Late Jurassic to the Early Cretaceous. These phases are directly tied to the movement of the paleo-Pacific plate, which first subducted westward and then reversed its course [31]. The subduction and rollback of the paleo-Pacific Plate induced lithospheric extension in the SCB, facilitating the upwelling of asthenospheric thermal material [44]. The upwelling material interacted with crustal components through assimilation at the base of the crust and gradually crystallized in the upper crust, which might have ultimately led to mineralization.
Our Vp tomography shows velocity changes beneath different metallogenic belts, suggesting that the mechanisms of different metallogenic belts vary. According to Hf isotopic mapping [6], porphyry Au-Cu deposits primarily occur in young crustal domains (e.g., the Qinghang ore belt), which correspond to the low-Vp zones in the lower crust (Figure 9), and granite-related W-Sn deposits mainly occur in reworked crustal domains (e.g., the Nanling ore belt) which have a mixed state of high- and low-Vp anomalies. Most Ag-Pb-Zn and U deposits occur in ancient crustal domains (e.g., the Wuyi ore belt), which correspond to the high-Vp zones (Figure 9a).
Recent studies have revealed that the SCB exhibits a distinct NE-SW-trending anisotropic structure, which likely resulted from lithospheric stretching due to the Mesozoic paleo-Pacific plate subduction and rollback, facilitating thermal material upwelling [16]. Li et al. [23] also pointed out that intense thermal upwelling beneath the Cathaysia block caused large-scale mineralization in this region. Considering the fact that most intermediate–basic intrusive rocks in the Middle–Lower Yangtze River ore belt and the northeastern Qinhang ore belt share the same geochemical characteristics as adakites [43], many previous studies have proposed that their mineralization processes are analogous to the MASH model [71,72], where lithospheric thinning causes mantle heat to rise, driving strong crust–mantle interactions [73,74,75]. This process corresponds to the low-Vp zone detected beneath the region. The W and Sn mineralization in the Nanling ore belt is typically associated with crust-derived granites [14], which is related to our proposed model of inside-crustal mixing and assimilation between crustal materials and deep thermal materials followed by gradual cooling and mineralization. This process aligns with the observed high-Vp upper crust and low-Vp lower crust beneath the region. Large crustal-scale faults beneath the Wuyi ore belt provide pathways for magma upwelling to the vicinity of the crust, resulting in low-Vp anomalies beneath the Zhenghe–Dapu fault zone. Hence, our crustal Vp tomography provides new insights into the Mesozoic dynamic processes and mechanism of mineralization.

7. Conclusions

In this study, we conduct a joint inversion of gravity and seismic travel-time data to investigate the detailed crustal P-wave velocity (Vp) structure of the SCB. Our results indicate that this joint inversion significantly enhances the spatial resolution of crust velocity tomography. Our Vp tomography shows the following: (1) strong lateral heterogeneities exist in the crust of the study region; (2) the velocity patterns at different depths beneath the Yangtze block are almost consistent, but those beneath the Cathaysia block vary significantly; (3) decoupling between the upper and lower crusts occurs at a depth of ~20 km beneath the eastern SCB. Combing our results with petrological, geochronological, and other geophysical findings, we explore the magmatic activity and metallogenic background of the SCB since the Late Mesozoic. We propose that the lithosphere and/or crust in the eastern SCB have undergone serious damage, leading to the deep thermal material underplating at the base of the crust, and that this thermal material ascended into the crust along deep faults, resulting in deep mineralization.

Author Contributions

Conceptualization, A.L. and Z.J.; methodology, D.Z. and G.J.; data curation, A.L. writing—original draft preparation, A.L.; writing—review and editing, Z.J., G.J. and D.Z.; supervision, G.Z.; funding acquisition, G.Z. All authors have read and agreed to the published version of the manuscript.

Funding

This research was co-supported by the National Key Research and Development Program of China (2016YFC0600201), the National Natural Science Foundation of China (Nos. 41974060 and 41630320), and the Fundamental Research Funds for the Central Universities (2-9-2019-037).

Data Availability Statement

The data that support the findings of this study are available from the corresponding author upon reasonable request.

Acknowledgments

We thank the Second Monitoring Center (China Earthquake Administration) for providing the seismic data. We are grateful to the two anonymous reviewers for their valuable comments and constructive suggestions. This work was supported by the High-performance Computing Platform of China University of Geosciences, Beijing. Most figures were made using the GMT [76].

Conflicts of Interest

The authors declare no conflicts of interest.

Abbreviations

The following abbreviations are used in this manuscript:
SCBSouth China Block
YZCYangtze Craton
CBCathaysia Block
JNOJiangnan Orogen

References

  1. Li, X.H.; Li, W.X.; Li, Z.X.; Lo, C.H.; Wang, J.; Ye, M.F.; Yang, Y.H. Amalgamation between the Yangtze and Cathaysia Blocks in South China: Constraints from SHRIMP U–Pb zircon ages, geochemistry and Nd–Hf isotopes of the Shuangxiwu volcanic rocks. Precambrian Res. 2009, 174, 117–128. [Google Scholar] [CrossRef]
  2. Zhao, Z.; Gao, P.; Zheng, Y. The source of Mesozoic granitoids in South China: Integrated geochemical constraints from the Taoshan batholith in the Nanling Range. Chem. Geol. 2015, 395, 11–26. [Google Scholar] [CrossRef]
  3. Li, M.; Pei, X.; Pei, L.; Li, Z.C.; Li, R.B. Late Triassic Felsic and Mafic Magmatism in the South Qinling Orogen, Central China: Insights from the Petrology, Zircon U-Pb Geochronology, and Geochemistry of the Huoshaodian Pluton. Minerals 2025, 15, 120. [Google Scholar] [CrossRef]
  4. Pullen, A.; Kapp, P.; Gehrels, G.E.; Vervoort, J.D.; Ding, L. Triassic continental subduction in central Tibet and Mediterranean-style closure of the Paleo-Tethys Ocean. Geology 2008, 36, 351–354. [Google Scholar] [CrossRef]
  5. Hu, R.; Gao, W.; Fu, S.; Su, W.; Peng, J.; Bi, X. Mesozoic intraplate metallogenesis in South China. Earth Sci. Front. 2024, 31, 226–238. (In Chinese) [Google Scholar]
  6. Zhang, Z.; Hou, Z.; Lü, Q.; Zhang, X.; Pan, X.; Fan, X.; Zhang, Y.; Wang, C.; Lü, Y. Crustal architectural controls on critical metal ore systems in South China based on Hf isotopic mapping. Geology 2023, 51, 738–742. [Google Scholar] [CrossRef]
  7. Zhou, X.M.; Sun, T.; Shen, W.Z.; Shu, L.S.; Niu, Y.L. Petrogenesis of Mesozoic granitoids and volcanic rocks in South China: A response to tectonic evolution. Episodes 2006, 29, 26–33. [Google Scholar] [CrossRef] [PubMed]
  8. Han, R.; Yang, D.; Li, Q.; Huang, R.; Zhang, H.; Li, J.; Chen, H.; Ye, Z.; Fu, W. Receiver function imaging of dense seismic array and deep dynamic mechanism beneath the eastern South China. Sci. China Earth Sci. 2023, 66, 1289–1308. [Google Scholar] [CrossRef]
  9. He, C.; Santosh, M. Crustal evolution and metallogeny in relation to mantle dynamics: A perspective from P-wave tomography of the South China Block. Lithos 2016, 263, 3–14. [Google Scholar] [CrossRef]
  10. Hou, J.; Xu, T.; Lü, Q.; Bai, Z.; Zhang, Y.; Zhang, Z.; Yang, D. The deep background of large-scale, Mesozoic Cu-Au-W metallogenesis in northeastern South China: Constraints from Yingshan-Changshan wide-angle seismic reflection/refraction data. Sci. China Earth Sci. 2022, 65, 2202–2218. [Google Scholar] [CrossRef]
  11. Huang, R.; Xu, Y.; Zhu, L.; He, K. Detailed Moho geometry beneath southeastern China and its implications on thinning of continental crust. J. Asian Earth Sci. 2015, 112, 42–48. [Google Scholar] [CrossRef]
  12. Li, Q.; Gao, R.; Wu, F.T.; Guan, Y.; Ye, Z.; Liu, Q.; Kuo-Chen, H.; He, R.; Li, W.; Shen, X. Seismic structure in the southeastern China using teleseismic receiver functions. Tectonophysics 2013, 606, 24–35. [Google Scholar] [CrossRef]
  13. Tang, Q.; Sun, W.; Yoshizawa, K.; Fu, L.Y. Anomalous Radial Anisotropy and Its Implications for Upper Mantle Dynamics Beneath South China From Multimode Surface Wave Tomography. J. Geophys. Res. Solid Earth 2022, 127, e2021JB023456. [Google Scholar] [CrossRef]
  14. Zhang, Y.; Shi, D.; Lü, Q.; Xu, Z.; Yan, J.; Chen, C.; Xu, T. The crustal thickness and composition in the eastern South China Block constrained by receiver functions: Implications for the geological setting and metallogenesis. Ore Geol. Rev. 2021, 130, 103988. [Google Scholar] [CrossRef]
  15. Chen, J.; Pan, L.; Li, Z.; Chen, X. Continental reworking in the eastern South China Block and its adjacent areas revealed by F-J multimodal ambient noise tomography. J. Geophys. Res. Solid Earth 2022, 127, e2022JB024776. [Google Scholar] [CrossRef]
  16. Qian, L.; Lei, J.; Zhao, D. Crustal anisotropy and deformation in the South China Block. J. Asian Earth Sci. 2025, 289, 106627. [Google Scholar] [CrossRef]
  17. Zhao, D.; Hasegawa, A.; Horiuchi, S. Tomographic imaging of P and S wave velocity structure beneath northeastern Japan. J. Geophys. Res. 1992, 97, 19909–19928. [Google Scholar] [CrossRef]
  18. Zhao, D.; Hasegawa, A.; Kanamori, H. Deep structure of Japan subduction zone as derived from local, regional and teleseismic events. J. Geophys. Res. 1994, 99, 22313–22329. [Google Scholar] [CrossRef]
  19. Guo, Z.; Gao, X. Azimuthally anisotropic seismic ambient noise tomography of South China block. Tectonophysics 2022, 823, 229187. [Google Scholar] [CrossRef]
  20. Ma, J.; Guo, Z.; Huang, J.; Fu, Y.V.; Barnard, A. Defining the Yangtze–Cathaysia suture zone in South China using ambient noise tomography. Geophys. J. Int 2023, 50, 512–527. [Google Scholar] [CrossRef]
  21. Dong, S.; Li, J.; Cawood, P.A.; Gao, R.; Zhang, Y.; Xin, Y. Mantle influx compensates crustal thinning beneath the Cathaysia Block, South China: Evidence from SINOPROBE reflection profiling. Earth Planet. Sci. Lett. 2020, 544, 116360. [Google Scholar] [CrossRef]
  22. Jiang, G.; Zhang, G.; Zhao, D.; Lü, Q.; Shi, D.; Li, H.; Li, X. Mantle Flow and Dynamics Beneath Central-East China: New Insights From P-Wave Anisotropic Tomography. J. Geophys. Res. Solid Earth 2021, 126, e2020JB020070. [Google Scholar] [CrossRef]
  23. Li, S.; Jiang, G.; Zhao, D.; Zhang, G.; Lü, Q.; Shi, D.; Chai, G. Deep geodynamics and metallogenic mechanism of the South China block: New insight from mantle tomography. Tectonophysics 2023, 869, 230107. [Google Scholar] [CrossRef]
  24. Guo, L.; Gao, R.; Shi, L.; Huang, Z.; Ma, Y. Crustal thickness and Poisson’s ratios of South China revealed from joint inversion of receiver function and gravity data. Earth Planet. Sci. Lett. 2019, 510, 142–152. [Google Scholar] [CrossRef]
  25. Yang, X.Z.; Luo, Y.; Zhao, K. 3D crustal and upper mantle model of East-Central China from a joint inversion of surface and body waves and its tectonic implications. J. Geophys. Res. Solid Earth 2021, 126, e2021JB022667. [Google Scholar] [CrossRef]
  26. Yang, X.Y.; Li, Y.; Afonso, J.C.; Yang, Y.; Zhang, A. Thermochemical state of the upper mantle beneath South China from multi-observable probabilistic inversion. J. Geophys. Res. Solid Earth 2021, 126, e2020JB021114. [Google Scholar] [CrossRef]
  27. Zhou, J.C.; Wang, X.L.; Qiu, J.S. Geochronology of Neoproterozoic mafic rocks and sandstones from northeastern Guizhou, South China: Coeval arc magmatism and sedimentation. Precambrian Res. 2009, 170, 27–42. [Google Scholar] [CrossRef]
  28. Cawood, P.A.; Strachan, R.A.; Pisarevsky, S.A.; Gladkochub, D.P.; Murphy, J.B. Linking collisional and accretionary orogens during Rodinia assembly and breakup: Implications for models of supercontinent cycles. Earth Planet. Sci. Lett. 2016, 449, 118–126. [Google Scholar] [CrossRef]
  29. Wei, Y.; Li, H.; Zhou, W.; Ma, C.; Fru, E.; Xu, D.; Deng, X.; Tan, M.; Zhao, X.; Xu, Y.; et al. The Early Neoproterozoic Andean-Type Orogenic and Within-Plate Magmatic Events in the Northern Margin of the Yangtze Craton during the Convergence of the Rodinia Supercontinent. Minerals 2024, 14, 820. [Google Scholar] [CrossRef]
  30. Zheng, Y.F.; Xiao, W.J.; Zhao, G. Introduction to tectonics of China. Gondwana Res. 2013, 23, 1189–1206. [Google Scholar] [CrossRef]
  31. Li, Z.; Li, X. Formation of the 1300-km-wide intracontinental orogen and postorogenic magmatic province in Mesozoic South China: A flat-slab subduction model. Geology 2007, 35, 179–182. [Google Scholar] [CrossRef]
  32. Sun, W.; Ding, X.; Hu, Y.H.; Li, X.H. The golden transformation of the Cretaceous plate subduction in the west Pacific. Earth Planet. Sci. Lett. 2007, 262, 533–542. [Google Scholar] [CrossRef]
  33. Zhang, Y.Y.; Chen, L.; Ai, Y.S.; Jiang, M.M.; Xu, W.W.; Shen, Z.Y. Lithospheric structure of the South China Block from S-receiver function. Chin. J. Phys. 2018, 61, 138–149. [Google Scholar]
  34. Shen, X.; Kind, R.; Huang, Z.; Yuan, X.; Liu, M. Imaging the Mantle Lithosphere below the China cratons using S-to-p converted waves. Tectonophysics 2019, 754, 73–79. [Google Scholar] [CrossRef]
  35. Guo, L.Z.; Shi, Y.S.; Ma, R.S. On the formation and evolution of the Mesozoic Cenozoic active continental margin and island arc tectonics of the western Pacific Ocean. Acta Geol. Sin. 1983, 1, 11–21. [Google Scholar]
  36. Hsü, K.J.; Shu, S.; Li, J.; Chen, H.; Peng, H.; Sengör, A.M.C. Mesozoic overthrust tectonics in south China. Geology 1988, 16, 418–421. [Google Scholar] [CrossRef]
  37. Mao, J.; Ye, H.; Liu, K.; Li, Z.; Takahashi, Y.; Zhao, X.; Kee, W.S. The Indosinian collision–extension event between the South China Block and the Palaeo-Pacific plate: Evidence from Indosinian alkaline granitic rocks in Dashuang, eastern Zhejiang, South China. Lithos 2013, 172–173, 81–97. [Google Scholar] [CrossRef]
  38. Wang, G.; Ni, P.; Zhao, C.; Wang, X.; Li, P.; Chen, H.; Zhu, A.; Li, L. Spatiotemporal reconstruction of Late Mesozoic silicic large igneous province and related epithermal mineralization in South China: Insights from the Zhilingtou volcanic-intrusive complex. J. Geophys. Res. Solid. Earth 2016, 121, 7903–7928. [Google Scholar] [CrossRef]
  39. Wang, Y.; Fan, W.; Zhang, G.; Zhang, Y. Phanerozoic tectonics of the South China Block: Key observations and controversies. Gondwana Res. 2013, 23, 1273–1305. [Google Scholar] [CrossRef]
  40. Chen, J.; Wang, R.; Zhu, J.; Lu, J.; Ma, D. Multiple-aged granitoids and related tungsten-tin mineralization in the Nanling Range, South China. Sci. China Earth Sci. 2013, 56, 2045–2055. [Google Scholar] [CrossRef]
  41. Liu, G.; Deng, Y.; Yuan, F.; Chen, X.; Yang, B. Rb–Sr dating and S–Sr–Nd isotopic constraints on the genesis of the Hehuashan Pb–Zn deposit in the Middle–Lower Yangtze River Metallogenic belt, China. Solid Earth Sci. 2021, 6, 57–69. [Google Scholar] [CrossRef]
  42. Shu, L.; Faure, M.; Yu, J.; Jahn, B. Geochronological and geochemical features of the Cathaysia block (South China): New evidence for the Neoproterozoic breakup of Rodinia. Precambrian Res. 2011, 187, 263–276. [Google Scholar] [CrossRef]
  43. Mao, J.; Xie, G.; Duan, C.; Pirajno, F.; Ishiyama, D.; Chen, Y. A tectono-genetic model for porphyry–skarn–stratabound Cu–Au–Mo–Fe and magnetite–apatite deposits along the Middle–Lower Yangtze River Valley, Eastern China. Ore Geol. Rev. 2011, 43, 294–314. [Google Scholar] [CrossRef]
  44. Zhang, Y.; Shi, D.; Lü, Q.; Xu, Y.; Xu, Z.; Gong, X.; Yan, J.; Xu, T. A fine crustal structure and geodynamics revealed by receiver functions along the Guangchang-Putian line in the Cathaysia Block, South China. Tectonophysics 2021, 815, 229007. [Google Scholar] [CrossRef]
  45. Zhao, D. Multiscale Seismic Tomography; Springer: Berlin/Heidelberg, Germany, 2015; p. 304. [Google Scholar]
  46. Zhao, D.; Katayama, Y.; Toyokuni, G. The Moho, slab and tomography of the East Japan forearc derived from seafloor S-net data. Tectonophysics 2022, 837, 229452. [Google Scholar] [CrossRef]
  47. She, L.; Zhang, G.; Jiang, G.; Zhao, D.; Xi, J.; Lü, Q.; Shi, D. Slab morphology around the Philippine Sea: New insights from P-wave mantle tomography. J. Geophys. Res. Solid Earth 2023, 128, e2022JB024757. [Google Scholar] [CrossRef]
  48. Jia, R.; Zhao, D. Anisotropic tomography of the East Japan subduction zone: Influence of inversion algorithms. Geophys. J. Int. 2023, 234, 2199–2213. [Google Scholar] [CrossRef]
  49. Paige, C.C.; Saunders, M.A. LSQR: An algorithm for sparse linear equations and sparse least squares. ACM Trans. Math. Softw. 1982, 8, 43–71. [Google Scholar] [CrossRef]
  50. Balmino, G.; Vales, N.; Bonvalot, S.; Briais, A. Spherical harmonic modelling to ultra-high degree of Bouguer and isostatic anomalies. J. Geod. 2012, 86, 499–520. [Google Scholar] [CrossRef]
  51. Parker, R.L. The rapid calculation of potential anomalies. Geophys. J. Int. 1973, 31, 447–455. [Google Scholar] [CrossRef]
  52. Laske, G.; Masters, G.; Ma, Z.; Pasyanos, M. Update on CRUST1.0—A1-degree global model of Earth’s crust. Geophys. Res. Abstr. 2013, 15, EGU2013-2658. [Google Scholar]
  53. Wang, X.; Fang, J.; Hsu, H. Three-dimensional density structure of the lithosphere beneath the North China Craton and the mechanisms of its destruction. Tectonophysics 2014, 610, 150–158. [Google Scholar] [CrossRef]
  54. Braitenberg, C.; Zadro, M.; Fang, J.; Wang, Y.; Hsu, H.T. The gravity and isostatic Moho undulations in Qinghai–Tibet plateau. J. Geodyn. 2000, 30, 489–505. [Google Scholar] [CrossRef]
  55. Li, Y.; Oldenburg, D.W. 3-D inversion of gravity data. Geophysics 1998, 63, 109–119. [Google Scholar] [CrossRef]
  56. Birch, F. The velocity of compressional waves in rocks to 10 kilobars: 2. J. Geophys. Res. 1961, 66, 2199–2224. [Google Scholar] [CrossRef]
  57. Gardner, G.; Gardner, G.R. Formation velocity and density—The diagnostic basics for stratigraphic traps. Geophysics 1974, 39, 770–780. [Google Scholar] [CrossRef]
  58. Nafe, J.; Drake, C. Physical properties of marine sediments. Sea 1963, 3, 794–815. [Google Scholar]
  59. Ludwig, W.; Nafe, J.; Drake, C. Seismic refraction. Sea 1970, 4, 53–84. [Google Scholar]
  60. Feng, R.; Yan, H.; Zhang, R. The rapid inversion of 3-D potential field and program design. Acta Geol. Sin. 1986, 60, 390–403. [Google Scholar]
  61. Kennett, B.; Engdahl, E. Traveltimes for global earthquake location and phase identification. Geophys. J. Int. 1991, 105, 429–465. [Google Scholar] [CrossRef]
  62. Matheron, G. Principles of Geostatistics. Econ. Geol. 1963, 58, 1246–1266. [Google Scholar] [CrossRef]
  63. Chen, J.; Li, Z.; Chen, X. A Mid-Crustal Channel of Positive Radial Anisotropy Beneath the Eastern South China Block From F-J Multimodal Ambient Noise Tomography. Geophys. Res. Lett 2024, 51, e2024GL110766. [Google Scholar] [CrossRef]
  64. Li, T.; Jiang, M.; Zhao, L.; Yao, W.; Chen, L.; Chu, Y.; Sun, B.; Ai, Y.; Wan, B.; Gessner, K.; et al. Wedge tectonics in South China: Constraints from new seismic data. Sci. Bull. 2022, 67, 1496–1507. [Google Scholar] [CrossRef]
  65. Huang, J.; Zhao, D. High-resolution mantle tomography of China and surrounding regions. J. Geophys. Res. Solid. Earth 2006, 111, B09305. [Google Scholar] [CrossRef]
  66. Jiang, G.; Hu, S.; Shi, Y.; Zhang, C.; Wang, Z.; Hu, D. Terrestrial heat flow of continental China: Updated dataset and tectonic implications. Tectonophysics 2019, 753, 36–48. [Google Scholar] [CrossRef]
  67. Lin, J.; Xu, T.; Cai, H.; Lü, Q.; Bai, Z.; Deng, Y.; Zhang, Y.; Huang, M.; Badal, J.; Jin, X. Crustal velocity structure of Cathaysia Block from an active-source seismic profile between Wanzai and Hui’an in SE China. Tectonophysics 2021, 811, 228874. [Google Scholar] [CrossRef]
  68. Ni, P.; Wang, G.G.; Li, W.S.; Chi, Z.; Li, S.N.; Gao, Y. A review of the Yanshanian ore-related felsic magmatism and tectonic settings in the Nanling W-Sn and Wuyi Au-Cu metallogenic belts, Cathaysia Block, South China. Ore Geol. Rev. 2021, 133, 104088. [Google Scholar] [CrossRef]
  69. Li, J.H.; Zhang, Y.Q.; Dong, S.W.; Johnston, S.T. Cretaceous tectonic evolution of South. China: A preliminary synthesis. Earth-Sci. Rev. 2014, 134, 98–136. [Google Scholar] [CrossRef]
  70. Sun, Y.; Ma, C.; Liu, Y. The latest Yanshanian magmatic and metallogenic events in the middle-lower Yangtze River belt: Evidence from the Ningzhen region. Chin. Sci. Bull. 2013, 58, 4308–4318. [Google Scholar] [CrossRef]
  71. Hildreth, W.; Moorbath, S. Crustal contributions to arc magmatism in the Andes of central Chile. Contrib. Miner. Petrol. 1988, 98, 455–489. [Google Scholar] [CrossRef]
  72. Richards, J. Tectono-magmatic precursors for porphyry Cu-(Mo-Au) deposit formation. Econ. Geol. 2003, 98, 1515–1533. [Google Scholar] [CrossRef]
  73. Xu, J.; Shinjo, R.; Defant, M.; Wang, Q.; Rapp, R. Origin of Mesozoic adakitic intrusive rocks in the Ningzhen area of east China: Partial. melting of delaminated lower continental crust? Geology 2002, 30, 1111–1114. [Google Scholar] [CrossRef]
  74. Xu, T.; Zhang, Z.; Tian, X.; Liu, B.; Bai, Z.; Lü, Q.; Teng, J. Crustal structure beneath the Middle-Lower Yangtze metallogenic belt and its surrounding areas: Constraints from active source seismic experiment along the Lixin to Yixing profile in East China. Acta Petrol. Sinica 2014, 30, 918–930. (In Chinese) [Google Scholar]
  75. Zhang, Y.; Lü, Q.; Teng, J.; Wang, Q.; Xu, T. Discussion on the crustal density structure and deep mineralization background in the Middle-Lower Yangtze metallogenic belt and its surrounding areas: Constraints from the gravity inversion. Acta Petrol. Sin. 2014, 30, 931–940. [Google Scholar]
  76. Wessel, P.; Smith, W.H.F. New, improved version of generic mapping tools released. Eos Trans. Am. Geophys. Union. 1998, 79, 579. [Google Scholar] [CrossRef]
Figure 1. (a) The tectonic setting, the surface terrain, and locations of seismic stations (yellow squares) used in this research. The blue dashed lines represent the boundaries of the Jiangnan orogen [24]. The orange dashed box highlights the location of Figure 1b. Major fault zones are indicated by solid black lines, with abbreviations as follows: TLF, Tancheng-Lujiang Fault; JXF, Jiashan–Xiangshui Fault; XSF, Xinyan–Shucheng Fault; XGF, Xiangfan–Guangji Fault; JSF, Jiaxing–Shaoxing Fault; ZDF, Zhenghe-Dapu Fault; JHB, Jianghan basin. The abbreviations of the four major metallogenic belts are as follows: NLB, Nanling ore belt; WYB, Wuyi ore belt; MLYRB, Middle–Lower Yangtze River ore belt; QHB, Qinhang ore belt. The inset map shows the distribution of major tectonic features in China. The solid yellow lines indicate primary tectonic boundaries, and the red dashed box highlights the study region. (b) The distributions of Mesozoic granitic and volcanic rocks in the major Mesozoic mineral deposits, after Zhang et al. [44]. The colored dots denote the positions of W-Sn and Au-Cu ores.
Minerals 15 00668 g001
Figure 2. Distribution of the earthquakes used in the study. The inset shows the travel-time curve. The fault zone abbreviations are the same as those in Figure 1.
Minerals 15 00668 g002
Figure 3. (a) The trade-off curve for the root-mean-square (RMS) travel-time residual versus the norm of the 3-D Vp model. The optimal damping parameter is highlighted with a red circle. (b) The convergence curve of the joint inversion between the number of iterations and the RMS travel-time residual. The red, blue, and yellow curves represent the RMS values in the single seismic tomography, the first sequential inversion, and the second sequential inversion, respectively.
Minerals 15 00668 g003
Figure 4. (a) Satellite Bouguer anomalies derived from WGM2012 [50]. (b) Residual gravity anomalies used for joint inversion. Colored bars represent anomalies of gravity in mGal. Other labels same as in Figure 1.
Minerals 15 00668 g004
Figure 5. (a) Distribution of seismic ray density at 15 km depth. A1 outlined by the red box represents area where ray crisscrossing is poor. (bd) Checkerboard resolutions test results at 15 km depth for grid spacings of 0.75°, 1.0°, and 1.25°, respectively. Vp perturbation scale shown at bottom. Black box same as red box in (a).
Minerals 15 00668 g005
Figure 6. The results of a checkerboard resolution test for Vp tomography with a lateral grid interval of 1.0° at depths of 5 to 40 km. The blue and red dots denote high and low Vp perturbations, respectively, whose scale is shown at the bottom.
Minerals 15 00668 g006
Figure 7. The results of a checkerboard resolution test for joint inversion with a lateral grid interval of 1.0° at depths of 5 to 40 km. The other labels are the same as those in Figure 6.
Minerals 15 00668 g007
Figure 8. (af) Map views of P-wave velocity (Vp) anomalies at depths of 5–40 km from seismic tomography. Red dashed lines represent boundary of Jiangnan orogen, modified from Guo et al. [24]. Blue and red colors indicate high- and low-Vp anomalies, respectively; scale shown at bottom. Red and blue ellipses in (a,d) indicate low and high Hf isotope (εHf) values, respectively [6]. Black curves denote primary faults (same as in Figure 1). Major metallogenic belts encircled by white wireframes in (c,f), modified from Zhang et al. [14].
Minerals 15 00668 g008
Figure 9. The same as Figure 8 but for the results obtained by the joint inversion.
Minerals 15 00668 g009
Figure 10. (ag) Vertical cross-sections of Vp anomalies determined by joint inversion along the 7 profiles, as shown in (h), with a vertical exaggeration of 3:1. The blue and red colors denote high- and low-Vp anomalies, respectively, whose scale is shown at the bottom. Abbreviations: YZC, Yangtze Craton; CB, Cathaysia block; JNO, Jiangnan orogen; NLB, Nanling ore belt; LYB, Lower Yangtze block; WYB, Wuyi ore belt; MLYRB, Middle-Lower Yangtze River ore belt; QHB, Qinhang ore belt; SB, Sichuan basin; DBO, Dabie Orogenic Belt; JHB, Jianghan basin; ZDF, Zhenghe-Dapu Fault.
Minerals 15 00668 g010
Disclaimer/Publisher’s Note: The statements, opinions and data contained in all publications are solely those of the individual author(s) and contributor(s) and not of MDPI and/or the editor(s). MDPI and/or the editor(s) disclaim responsibility for any injury to people or property resulting from any ideas, methods, instructions or products referred to in the content.

