Article

Zircon out, Elpidite in: Deformation-Driven Zirconosilicate Evolution in Peralkaline Granites: A Case Study of the Papanduva Pluton (Brazil)

by
Larissa P. Grangeiro
1,
Frederico C. J. Vilalva
1,2,*,
Silvio R. F. Vlach
3 and
Armando L. S. de Oliveira
4
1
Programa de Pós-Graduação em Geodinâmica e Geofísica, Universidade Federal do Rio Grande do Norte, Natal 59078-970, RN, Brazil
2
Departamento de Geologia, Centro de Ciências Exatas e da Terra, Universidade Federal do Rio Grande do Norte, Natal 59078-970, RN, Brazil
3
Instituto de Geociências, Universidade de São Paulo, São Paulo 05508-080, SP, Brazil
4
Programa de Pós-Graduação em Ciências do Sistema Terra e Sociedade, Instituto de Geociências, Universidade de São Paulo, São Paulo 05508-080, SP, Brazil
*
Author to whom correspondence should be addressed.
Minerals 2025, 15(7), 667; https://doi.org/10.3390/min15070667
Submission received: 30 April 2025 / Revised: 5 June 2025 / Accepted: 19 June 2025 / Published: 20 June 2025
(This article belongs to the Section Mineral Geochemistry and Geochronology)

Abstract

The peralkaline granites of the Papanduva Pluton (South Brazil) display a remarkable facies dichotomy, with zircon dominant in massive facies and diverse zirconosilicates (Zr-Si) in foliated facies. This study employs petrography and mineral chemistry (major and trace elements) to elucidate the textural diversity and compositional evolution of these minerals. Three discrete zirconosilicate groups were identified: Na-rich elpidite (euhedral, vein-like, and granular varieties), Na-poor (Na,K)Zr-Si-I, and silica-rich (Na,K)Zr-Si-II. Contrary to the expected crystallization sequences, trace element data reveal that REE enrichment correlates with deformation intensity rather than paragenetic order, with vein-like aggregates along deformation features showing the highest REE concentrations. Statistical analysis demonstrates significant correlations between REE contents and alkali exchange patterns. We propose a three-stage evolutionary model involving magmatic crystallization, deformation-enhanced fluid interaction, and late-stage recrystallization, with a progressive evolution from Na-dominated to K-dominated conditions. This study provides new insights into closed-system fluid evolution in agpaitic environments and highlights deformation as a primary control on element mobility in peralkaline granitic systems.

1. Introduction

Zirconosilicates are critical petrogenetic tracers in peralkaline igneous systems, providing unique insights into late-stage magmatic–hydrothermal evolution and element mobility [1,2,3]. In metaluminous magmas, zirconium is typically hosted in zircon (ZrSiO4); however, in peralkaline melts—defined by molar (Na2O + K2O)/Al2O3 > 1—zirconosilicates crystallize late because Zr functions as a network modifier in silicate melts, breaking Si-O-Si bonds rather than participating in the silicate framework [1]. In the presence of excess alkalis, Zr4+ remains dispersed in the melt structure rather than forming its own complexes, suppressing early zircon crystallization and stabilizing diverse Na-, K-, and Ca-bearing zirconosilicates [1,2,4]. This fundamental shift in Zr behavior makes zirconosilicates sensitive indicators of intensive parameters, such as peralkalinity, silica activity, oxygen fugacity, volatile content, and fluid evolution in agpaitic environments, providing critical insights into late-stage differentiation and high-field strength element (HFSE) mobilization processes [2,4,5,6,7,8,9,10].
Submagmatic deformation, which occurs at temperatures just below the solidus during crystal–melt coexistence [11,12,13], represents an underexplored control on zirconosilicate evolution. High-temperature deformation (>650 °C) generates microfractures and foliation that enhance fluid–rock interaction and HFSE mobilization; however, the mechanisms linking deformation intensity to zirconosilicate chemical evolution remain poorly understood. This knowledge gap limits our understanding of the behavior of trace elements in deformed peralkaline systems.
Elpidite (Na2ZrSi6O15·3H2O) is an ideal mineral for investigating these processes due to its microporous framework structure and high cation exchange capacity. Its double wollastonite-like [Si6O15]6− ribbon structure, cross-linked by ZrO6 octahedra, creates channels that facilitate reversible dehydration and Na+ exchange for larger monovalent cations (K+, Rb+,and Cs+). Under hydrothermal conditions, these channels accommodate the partial substitution of Na+ by Ca2+, with a concomitant loss of channel water [5,14,15,16,17]. Elpidite crystallizes during late-magmatic to hydrothermal stages of peralkaline granites and syenites, marking high alkali and water activities during late-stage magmatic crystallization [2,5].
Elpidite occurrences in peralkaline granite complexes worldwide demonstrate diverse formation and alteration mechanisms. At Strange Lake (Canada), euhedral prisms are replaced by Ca-zirconosilicates during metasomatic alteration [4,5]. The Khan Bogd complex (Mongolia) hosts up to 30 vol% elpidite evolving from Ca-poor to Ca-rich compositions before being replaced by gittinsite and zircon [10]. Ilímaussaq (Greenland) shows elpidite mantles around resorbed zircon and euhedral crystals in miaroles with up to 65% Na loss during post-magmatic alteration [9]. Additional occurrences at Evisa (Corsica), Khibiny (Russia), Siwana (India), and the Arabian Shield demonstrate the high susceptibility of elpidite to fluid-mediated modification through ion exchange, metasomatism, and hydrothermal processes [18,19,20,21,22].
In Brazil, elpidite occurrences in peralkaline granites are rare and poorly characterized. Only two significant occurrences have been documented: the Ouro Fino Intrusive Suite (northern Brazil), which contains Ca-rich elpidite (≤5 vol%) in hypersolvus alkali-feldspar granites [23], and the Papanduva Pluton (southern Brazil), where elpidite is the primary zirconosilicate mineral in highly evolved peralkaline granites. The Papanduva locality exhibits multiple textural generations of elpidite associated with (Na,K)-zirconosilicates, HFSE- and REE-bearing phases, and fluid alteration features [24,25]. Despite previous investigations [26,27,28], the crystallization sequence, compositional variation, and replacement mechanisms remain poorly understood.
This study integrates petrography and mineral chemistry to (1) document the textural diversity and compositional evolution of elpidite and associated zirconosilicates from the Papanduva granites; (2) establish quantitative relationships between deformation intensity and element redistribution; (3) reconstruct the crystallization sequence and fluid evolution pathways; and (4) propose a comprehensive model for deformation-controlled zirconosilicate evolution in peralkaline, silica-oversaturated agpaitic systems (cf. [2,29]). Our results provide new insights into the structural controls on element mobility and highlight deformation as a key control on zirconosilicate stability and composition in peralkaline granite environments.

2. Geological Background

The Papanduva Pluton, part of the Neoproterozoic (~580 Ma) Graciosa Province [30,31], is situated within the Morro Redondo Complex in southern Brazil [25] (Figure 1A). The Graciosa Province extends along the Brazilian Atlantic coast (Figure 1B) from southern São Paulo to northeastern Santa Catarina and comprises predominantly A-type granitic and syenitic plutons and related volcanics, along with minor mafic and hybrid rocks. The Papanduva Pluton, covering ~100 km2, intrudes Archean to Paleoproterozoic granulites and migmatitic gneisses of the Luis Alves Terrain [25,32,33,34,35]. U–Pb zircon dating places its emplacement at approximately 580 ± 5 Ma [36], marking it as one of the latest manifestations of regional magmatism in the area.

2.1. Petrographic and Mineralogical Characteristics

The Papanduva Pluton comprises hypersolvus alkali–feldspar granites that occur in four petrographic facies: massive (most abundant), cataclastic, foliated, and microgranular, and follows an agpaitic crystallization sequence, in which mafic and accessory minerals precipitate late in interstitial sites [25,26,37]. Primary mafic minerals include richterite, Na-rich amphiboles (arfvedsonite and riebeckite), aegirine–augite, and aegirine, whereas common accessory minerals include zircon, ilmenite, chevkinite, astrophyllite, and aenigmatite [25,37,38]. In the foliated facies at the pluton margins, zircon is absent and is replaced by alkali–zirconosilicates. These minerals occur alongside other alkali-rich accessory phases that concentrate HFSE and/or REE, including narsarsukite, nacareniobsite-(Ce), britholite-(Ce), neptunite, and REE-rich turkestanite [24,29,39].
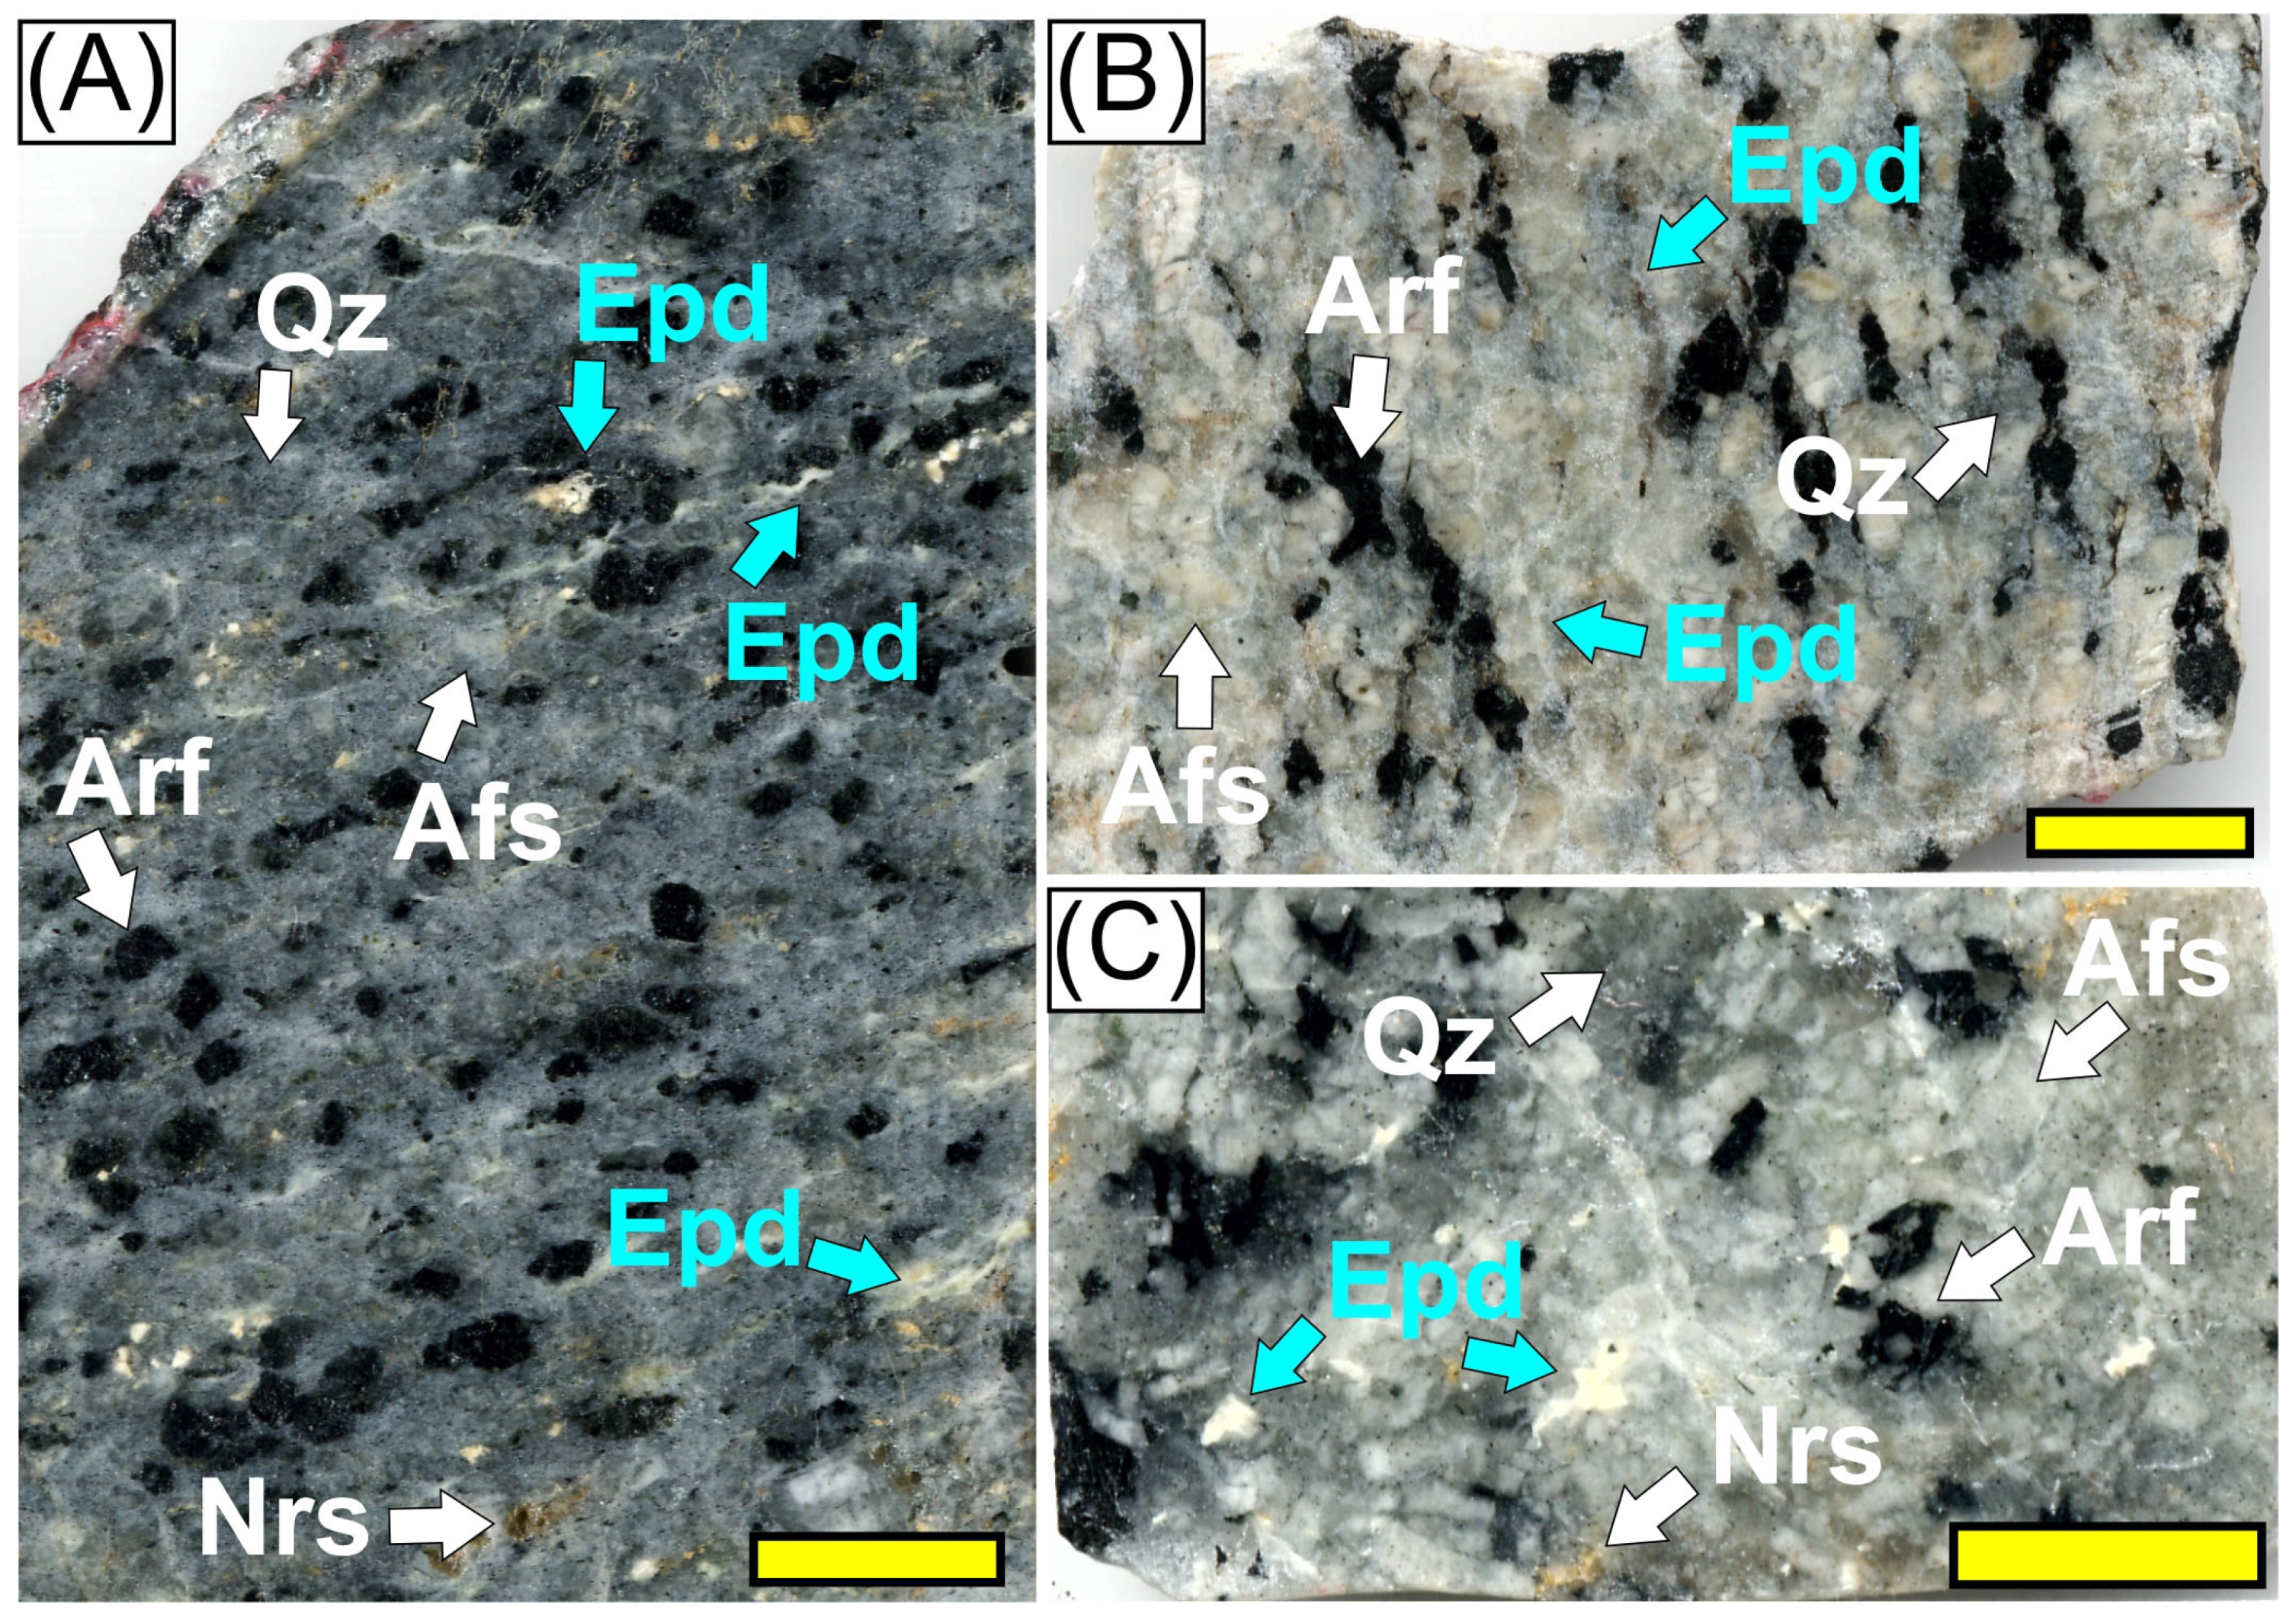
The foliated and deformed facies are confined to the eastern and western portions of the Papanduva Pluton, while the central massive facies remains undeformed (Figure 1). This distribution reflects submagmatic deformation linked to reactivated regional fault zones during the final crystallization stages, rather than regional metamorphism or igneous flow. Evidence for submagmatic conditions includes porphyroclastic textures with alkali feldspar, arfvedsonite, and quartz megacrysts set in a recrystallized matrix (Figure 2A–C), high-temperature deformation (up to 750 °C, based on quartz c-axis thermometry for sample MR-03 [40]), bent feldspars with melt-filled microfractures, and chessboard quartz extinction patterns, indicating deformation above 650 °C under crystal-melt coexistence [11,41,42]. These textures align mesoperthite, arfvedsonite, and quartz megacrysts within a fine-grained quartz–feldspar matrix. Accessory phases, such as narsarsukite and vein-like zirconosilicate aggregates are oriented along the foliation (Figure 2A,B). The same facies records pervasive late- to post-magmatic albitization, which yields abundant albite laths and intricate exsolution textures in alkali feldspars; the intensity of these features correlates with the high agpaitic index and Zr content [25,37].

2.2. Geochemical Signature

Geochemically, the Papanduva rocks are classified as peralkaline and ferroan A-type granites. They show high silica content (SiO2: 74–78 wt.%), elevated alkali concentrations (Na2O + K2O: 8.7–9.3 wt.%), and significant iron enrichment (FeOt/(FeOt + MgO): 0.96–1.0). Their pronounced peralkalinity is indicated by high values of the agpaitic index ((Na2O + K2O)/Al2O3: 1.04–1.28). The relative enrichment in HFSE and REE is significant, with Zr, Nb, Y, and ΣREE abundances up to 2430, 88, 320, and 996 ppm, respectively, with the highest values recorded in the foliated facies, reflecting their evolved chemical nature [25].

3. Analytical Methods

3.1. Petrography

Ten thin sections of foliated peralkaline granite containing elpidite from key locations within the Papanduva Pluton (Figure 1A) were selected for petrographic characterization. The samples were carefully prepared as standard polished thin sections. Petrographic analysis involved optical microscopy (transmitted and reflected light), complemented by Backscattered Electron (BSE) imaging obtained using Electron Probe Microanalysis (EPMA). Petrography focused specifically on textures, mineral associations, alteration features, and the crystallization sequence of zirconosilicates.

3.2. Electron Probe Microanalysis (EPMA)

Major element compositions were determined for 17 elpidite crystals and associated (Na,K)-zirconosilicates from five representative samples. Analyses were conducted at the GeoAnalítica Core Facility (University of São Paulo, São Paulo, Brazil) using a JEOL JXA-FE-8530 electron microprobe (JEOL Ltd., Akishima, Tokyo). The operating conditions were set at an accelerating voltage of 15 kV, beam current of 10 nA, and defocused beam diameter of 30 µm to reduce sodium migration and water loss from sensitive zirconosilicate phases.
Quantitative analyses by wavelength dispersive spectroscopy (WDS) included the following elements (with corresponding analytical conditions in parentheses): Si (TAP, Kα, 10s peak, zircon), Al (TAP, Kα, 20s peak, anorthoclase), Fe (LIFL, Kα, 10s peak, fayalite), Gd (LIFL, Lβ, 20s peak, synthetic GdPO4), Dy (LIFL, Lβ, 20s peak, synthetic DyPO4), Hf (LIFL, Lα, 30s peak, zircon), Yb (LIFL, Lα, 20s peak, synthetic YbPO4), K (PETJ, Kα, 10s peak, orthoclase), Ca (PETJ, Kα, 10s peak, wollastonite), P (PETJ, Kα, 10s peak, fluoroapatite), Ti (PETJ, Kα, 20s peak, rutile), Zr (PETJ, Lα, 10s peak, zircon), Y (PETJ, Lα, 20s peak, synthetic YPO4), Nb (PETJ, Lα, 20s peak, ilmenite), Th (PETJ, Mα, 30s peak, rhyolitic glass), Na (TAPH, Kα, 5s peak, albite), and F (TAPH, Kα, 10s peak, fluoroapatite). The background counting times were half of each peak count time.
Matrix corrections and conversions to elemental concentrations were performed using the PRZ/Armstrong procedure. The detection limits for all the elements analyzed remained below 0.01 wt.%. Backscattered electron (BSE) imaging was used to document intracrystalline chemical zoning, hydrothermally altered regions, and fractured portions.
The structural formulas for elpidite were calculated by assuming the ideal formula Na2ZrSi6O15·3H2O [14], normalized to 15 oxygens and 6 Si [43]. For the other (Na,K)-zirconosilicates, structural calculations considered either 15 oxygens and 6 Si or 19 oxygens and 8 Si per formula unit [44]. The full dataset is provided in Supplementary Material S1.

3.3. LA-ICP-MS Analysis

Trace-element analyses (spot and raster mode) of elpidite were performed using Laser Ablation Inductively Coupled Plasma Mass Spectrometry (LA-ICP-MS) on 10 crystals from four additional samples at the GeoAnalítica Core Facility. A Thermo Scientific iCAP Q ICP-MS instrument (Thermo Scientific, Waltham, MA, USA) coupled with a CETAC LSX-213 G2+ laser ablation system (Teledyne CETAC Technologies, Omaha, NE, USA) was employed, following the procedures developed by [45]. The analytical settings included a 30 µm beam diameter, energy fluence of 7.67 J/cm2, and repetition rate of 20 Hz. Each analysis lasted 80 s (30 s background, followed by 50 s ablation).
The calibration utilized standard reference materials NIST SRM-610, GJ-Zircon, and Zr-91500. Internal calibration was based on the SiO2 content of elpidite (determined by EPMA). The analytes included alkali metals (7Li, 23Na, 39K, 85Rb), alkaline earths (24Mg, 42Ca, 44Ca, 88Sr, 137Ba), rare earth elements (139La, 140Ce, 141Pr, 143Nd, 147Sm, 151Eu, 157Gd, 159Tb, 161Dy, 165Ho, 166Er, 169Tm, 173Yb, 175Lu), high field strength elements (89Y, 91Zr, 93Nb, 179Hf, 181Ta, 232Th, 238U), and additional elements (27Al, 31P, 45Sc, 49Ti, 51V, 52Cr, 55Mn, 56Fe, 59Co, 66Zn, 71Ga, 95Mo, 118Sn, 121Sb, 182W, 206Pb, 207Pb, 208Pb).
Analyses systematically targeted different textural domains within elpidite crystals to establish microstructure–chemistry relationships. The analyses focused on the following: (1) homogeneous cores and rims of euhedral crystals (Type-I), (2) fine-grained portions within vein-like aggregates oriented parallel to foliation (Type-II), and (3) coarser-grained areas of interstitial granular aggregates (Type-III). Care was taken to avoid fractured or altered zones during the analysis. LA-ICP-MS analysis of elpidite and (Na,K)-zirconosilicates was challenged by matrix effects and elemental fractionation, primarily due to their fine grain size and degree of hydrothermal alteration. These limitations were mitigated through careful internal standardization and calibration of the data. However, reliable trace element data could not be obtained for the associated (Na,K)-zirconosilicates. Data reduction was performed using Glitter software version 4.5 [46]. The full dataset, detection limits, and precisions are provided in Supplementary Material S2.

4. Results

4.1. Textural and Compositional Classification of Zirconosilicates

Petrographic and chemical analyses identified three distinct zirconosilicate mineral groups in the foliated facies of the Papanduva Pluton: elpidite (with three textural variants) and two (Na,K)-bearing varieties. These minerals are absent in the massive facies, where zircon is the primary Zr-bearing mineral, indicating substantially distinct crystallization environments.

4.1.1. Textural Characteristics

A.
Elpidite Textural Varieties:
I.
Type-I (Euhedral Crystals): Subhedral to euhedral crystals ranging from 0.5–2.0 mm, with clearly defined orthorhombic shapes and uniform optical properties (Figure 3A). These crystals frequently display fractures filled with secondary phases appearing bright in BSE images (Figure 3B). Some crystals contain inclusions of albite laths (Figure 3A).
II.
Type-II (Vein-like Aggregates): Consist of elongated clusters of fine-grained crystals aligned parallel to protomylonitic foliation (Figure 3A,B). Compared to other types, they exhibit darker optical coloration and more extensive alterations.
III.
Type-III (Granular Aggregates): Anhedral to subhedral crystals ranging from 1.0–2.0 mm, filling interstitial spaces between larger feldspar and quartz grains (Figure 3C,D). These crystals often exhibit epitaxial growth aligned with the cavity boundaries (Figure 3C).
B.
(Na,K)-Zirconosilicates textural varieties:
I.
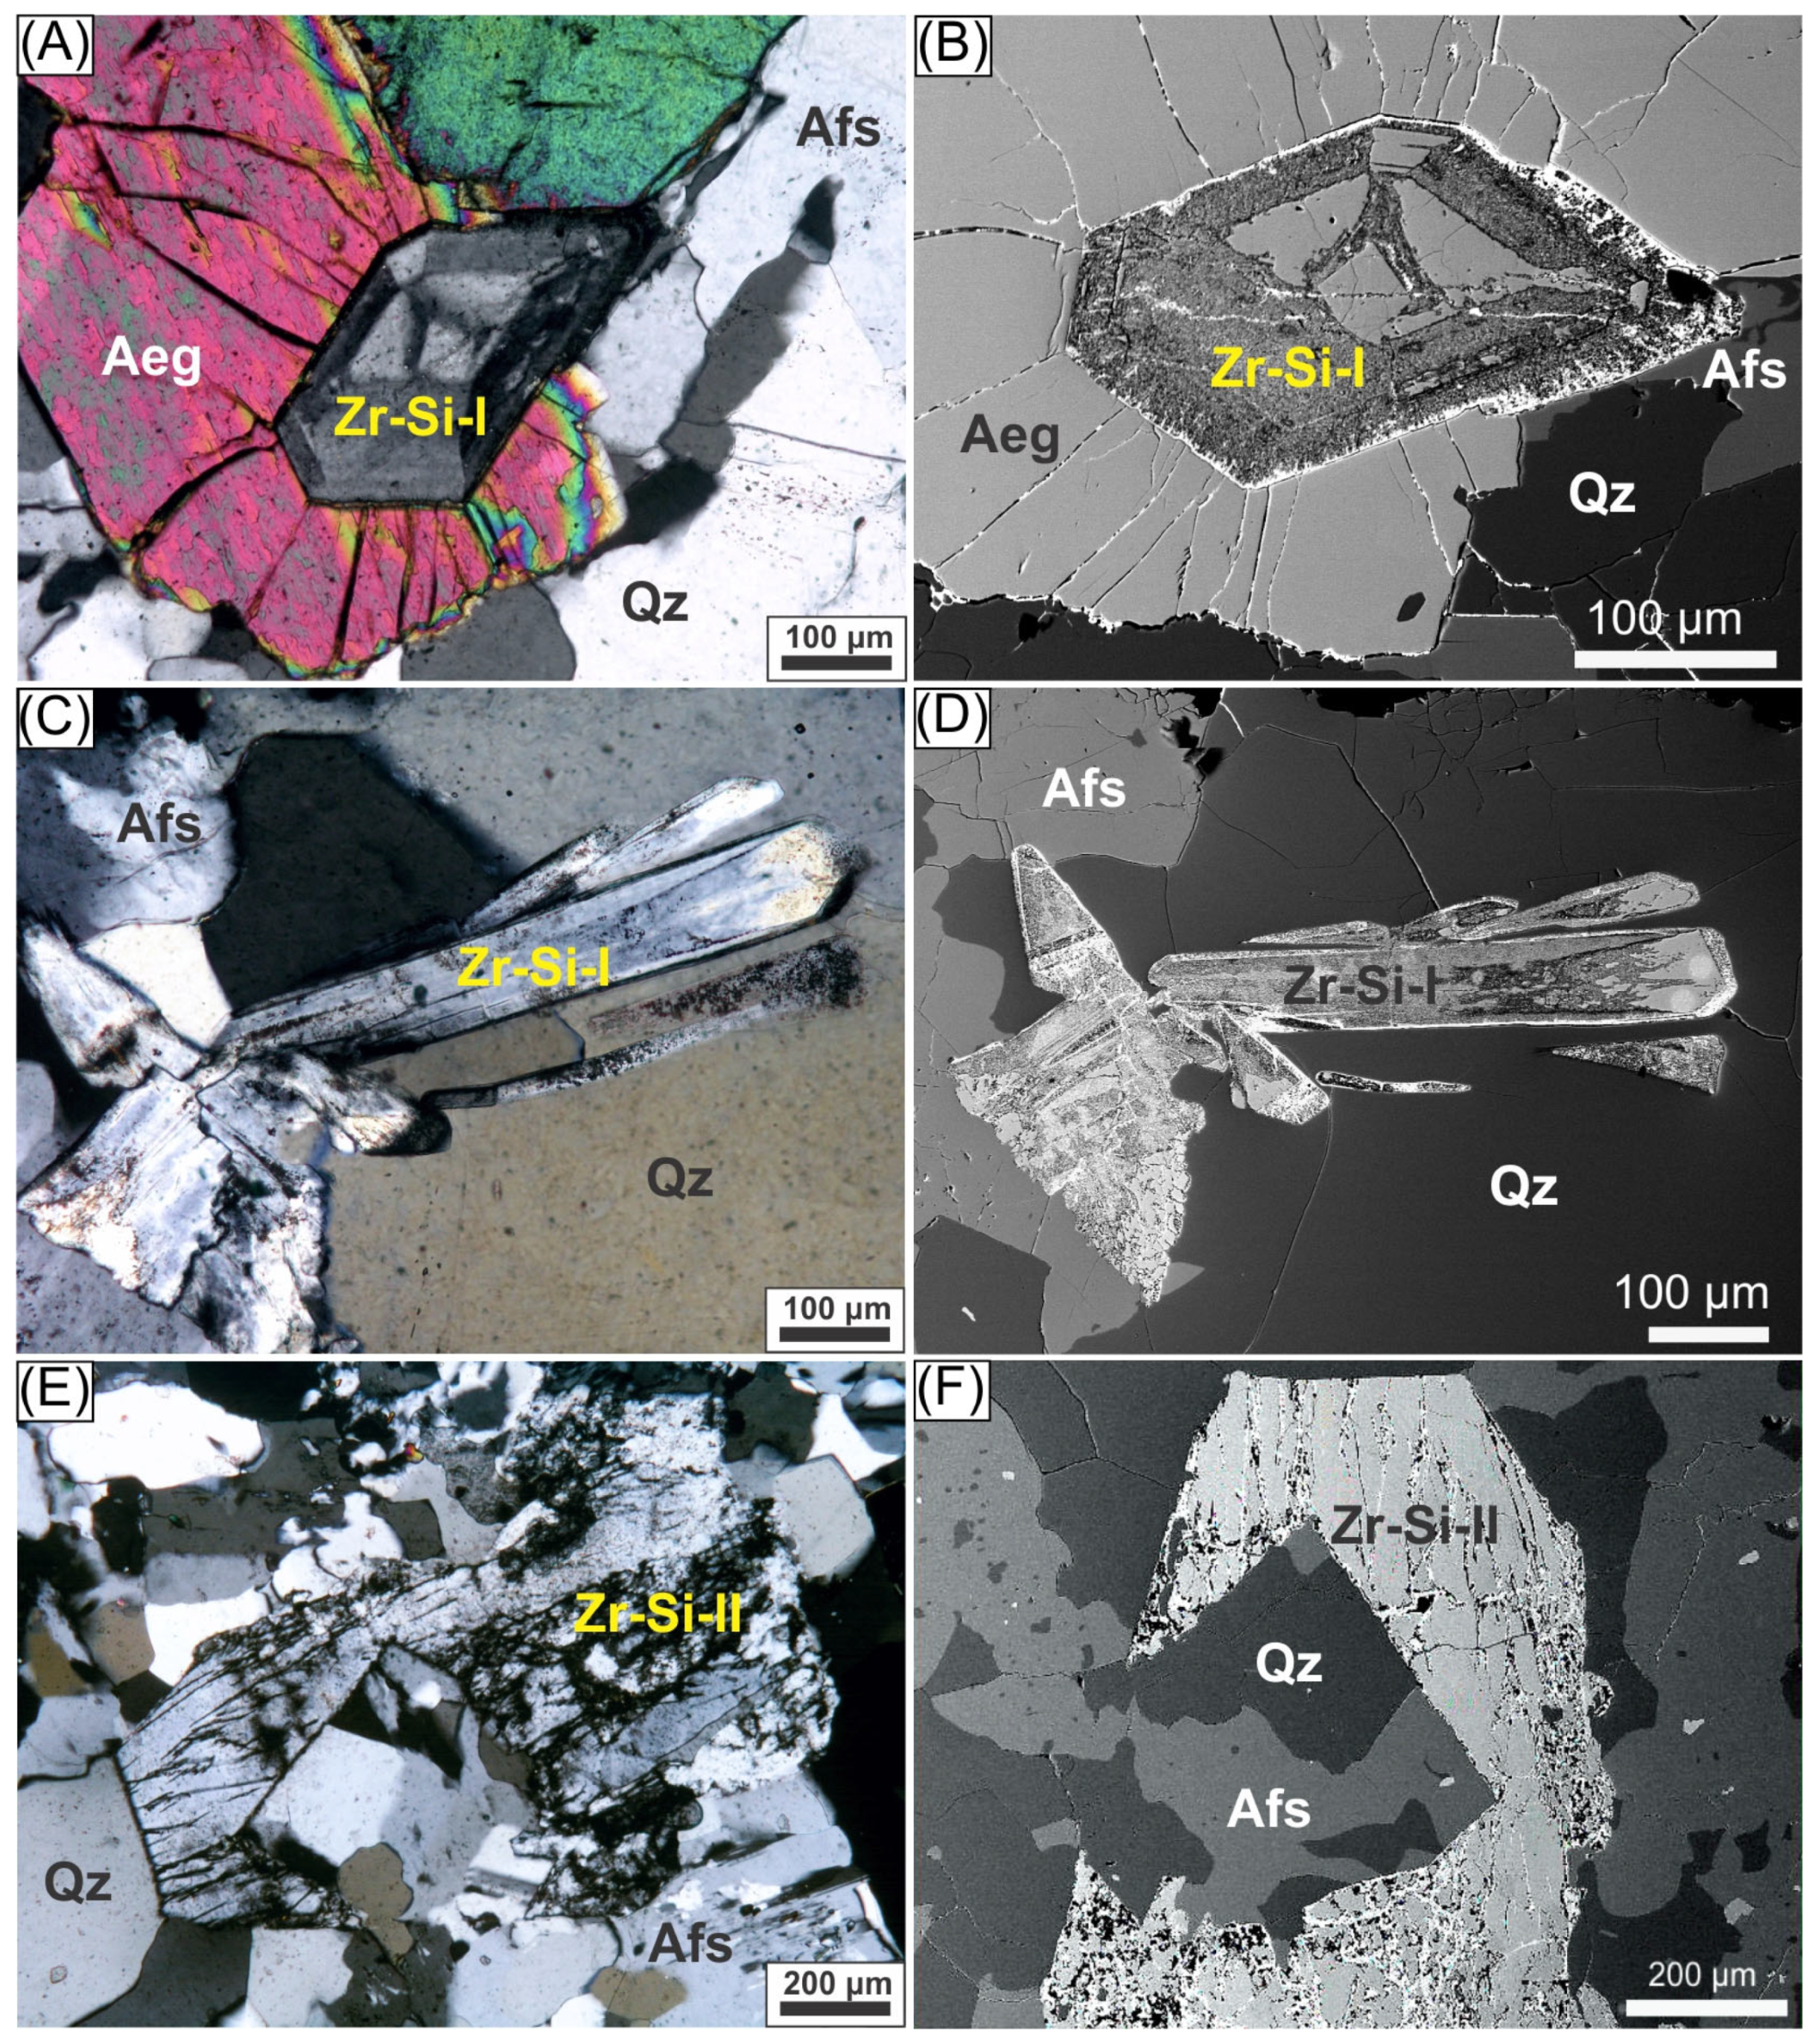
(Na,K)Zr-Si-I (sample MR-38): Euhedral crystals exhibiting an apparent monoclinic habit with high relief, low birefringence, and a complex internal structure (Figure 4A,C). BSE imaging reveals concentric zoning patterns that preserved the original morphologies despite significant alterations (Figure 4B,D). Cathodoluminescence (CL) imaging shows Na-rich luminescent cores surrounded by darker, K-enriched rims, indicative of alteration-driven structural changes. CL elemental mapping (Supplementary Material S3) demonstrates pronounced chemical zoning, with Na concentrated in the crystal core, which corresponds to relics of the original crystal, and K enrichment along the intermediate and outer zones and fractures. The Zr concentrations increase towards the crystal edges, with Hf and Al showing similar patterns. Ca shows no rim enrichment and is randomly distributed along the internal fractures.
II.
(Na,K)Zr-Si-II (sample MR-26): Subhedral to euhedral elongated crystals with an apparent orthorhombic habit, B(-) optical sign, moderate relief, and first-order interference colors (Figure 4E). They appear homogeneous in BSE imaging but display extensive fracturing with secondary infill (Figure 4F).
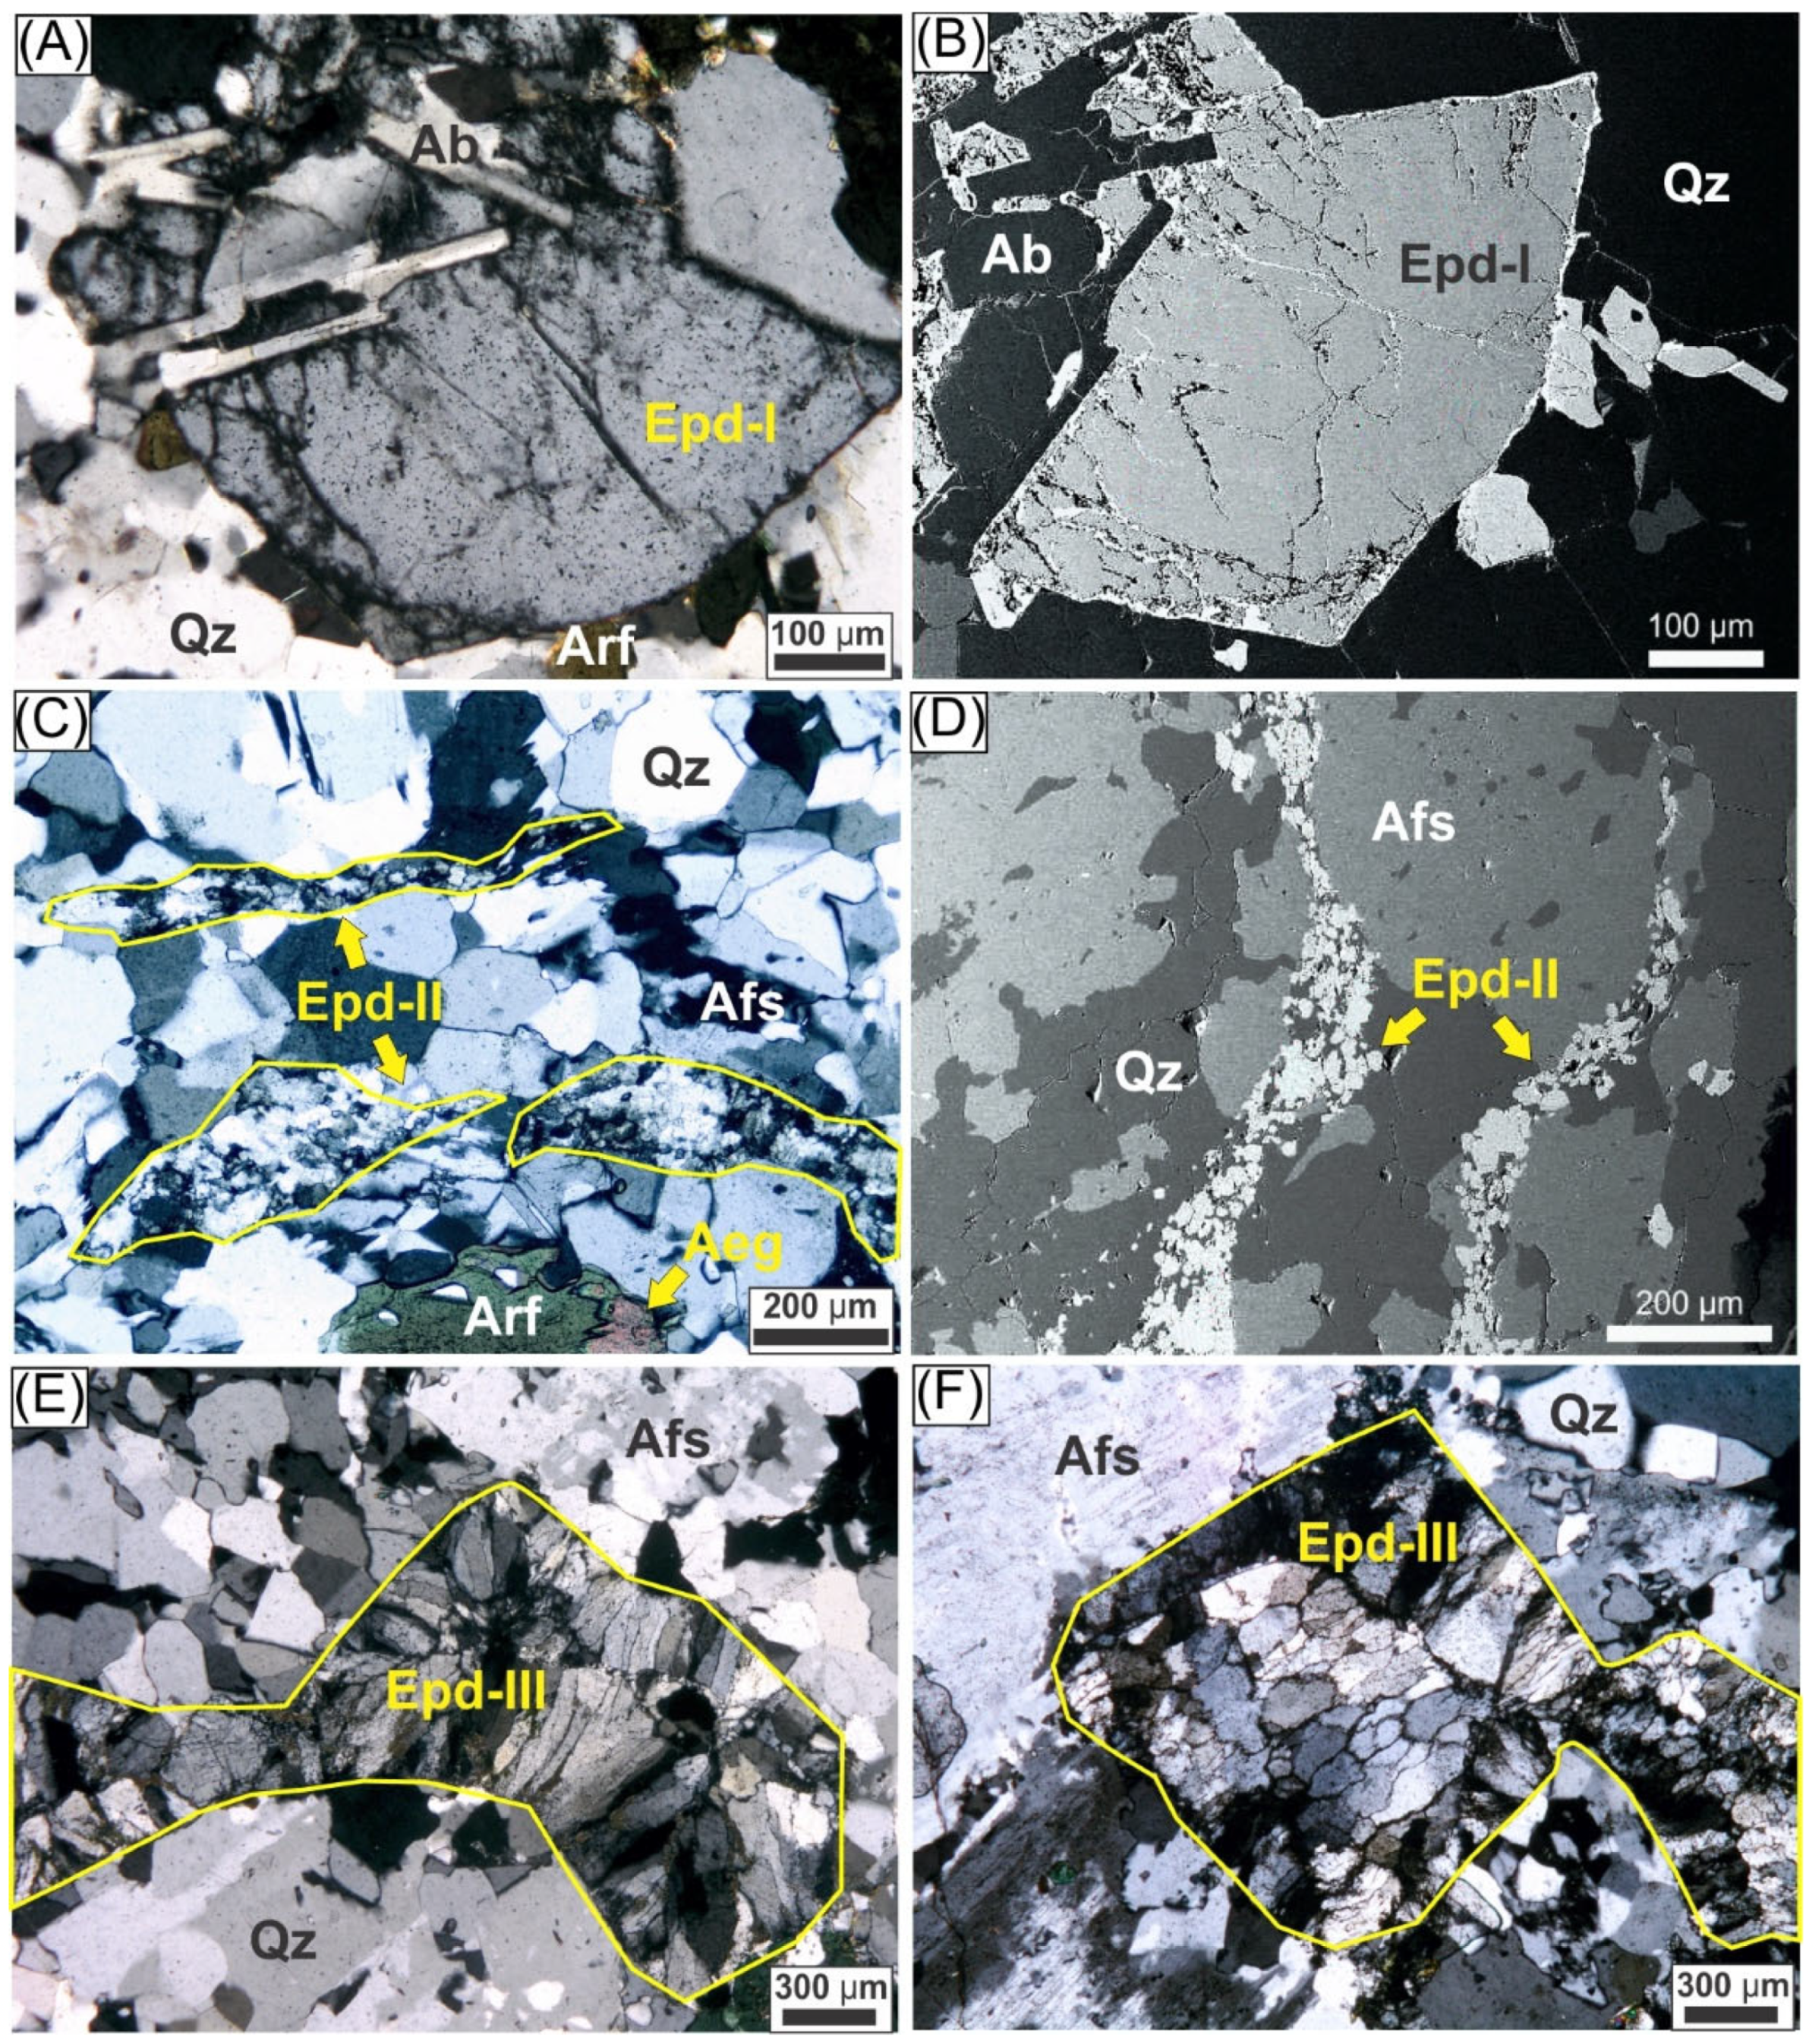
Figure 3. Microscopic features of elpidite generations in the foliated facies of the Papanduva Pluton. (A) Euhedral elpidite crystal (type I) with inclusions of albite laths. (B) Backscattered electron (BSE) image of the same crystal shown in (A), highlighting the orthorhombic habit and microfractures filled with secondary minerals (bright phases). (C) Fine-grained, vein-like aggregates of elpidite (type II) aligned parallel to the protomylonitic foliation within a quartz–feldspathic matrix. (D) BSE image of the same area as (C), illustrating the orientation of the elpidite aggregates along the foliation. (E,F) Interstitial aggregates of granular elpidite (type III) filling spaces between quartz and alkali feldspar crystals. Elpidite crystals show epitaxial growth perpendicular to the void walls, particularly in (E). Mineral abbreviations: Epd—elpidite; Qz—quartz; Afs—alkali feldspar; Ab—albite; Arf—arfvedsonite; Aeg—aegirine. Photomicrographs (A,C,E) under crossed polarizers.
Minerals 15 00667 g003
Figure 4. Microscopic features of (Na,K)-zirconosilicates in the foliated facies of the Papanduva Pluton. (A) Euhedral crystal with apparent monoclinic morphology of (Na,K)-zirconosilicate-I showing concentric zoning partially engulfed by aegirine. (B) Backscattered electron (BSE) image of the same crystal shown in (A), highlighting its pseudomorphic nature, with relics of the original zirconosilicate preserved in the core and an amorphous-like alteration in the intermediate and rim zones. Microfractures and external rims are filled with secondary minerals (bright phases). (C) Euhedral, elongated crystals of (Na,K)-zirconosilicate-I intergrown with quartz and alkali-feldspar. (D) BSE image of the same area as (C), showing intense hydrothermal alteration overprinting zirconosilicate crystals. (E) Euhedral crystal with apparent orthorhombic morphology of (Na,K)-zirconosilicate-II, with fractures filled with secondary dark-colored phases. (F) BSE image of the same crystal shown in (E), highlighting its compositional homogeneity and secondary mineral infill along the fractures. Mineral abbreviations: Zr-Si—(Na,K)-zirconosilicates; Qz—quartz; Afs—alkali feldspar; Aeg—aegirine. Photomicrographs (A,C,E) under crossed polarizers.
Minerals 15 00667 g004

4.1.2. Quantitative Classification Framework

Principal component analysis (PCA) of the major element compositions identified two main compositional trends (Figure 5). The first principal component (PC1, 65.2%) shows a positive correlation with Na2O (0.6839) and ZrO2 (0.4785) but negative with SiO2 (−0.4945) and K2O (−0.2370). The second principal component (PC2, 34.8%) correlates positively with K2O (0.5733) and ZrO2 (0.4893) and negatively with Na2O (−0.4695) and SiO2 (−0.4565). This statistical framework clearly distinguishes three compositional groups: Na-rich elpidite, Na-poor (Na,K)Zr-Si-I, and silica-rich (Na,K)Zr-Si-II.
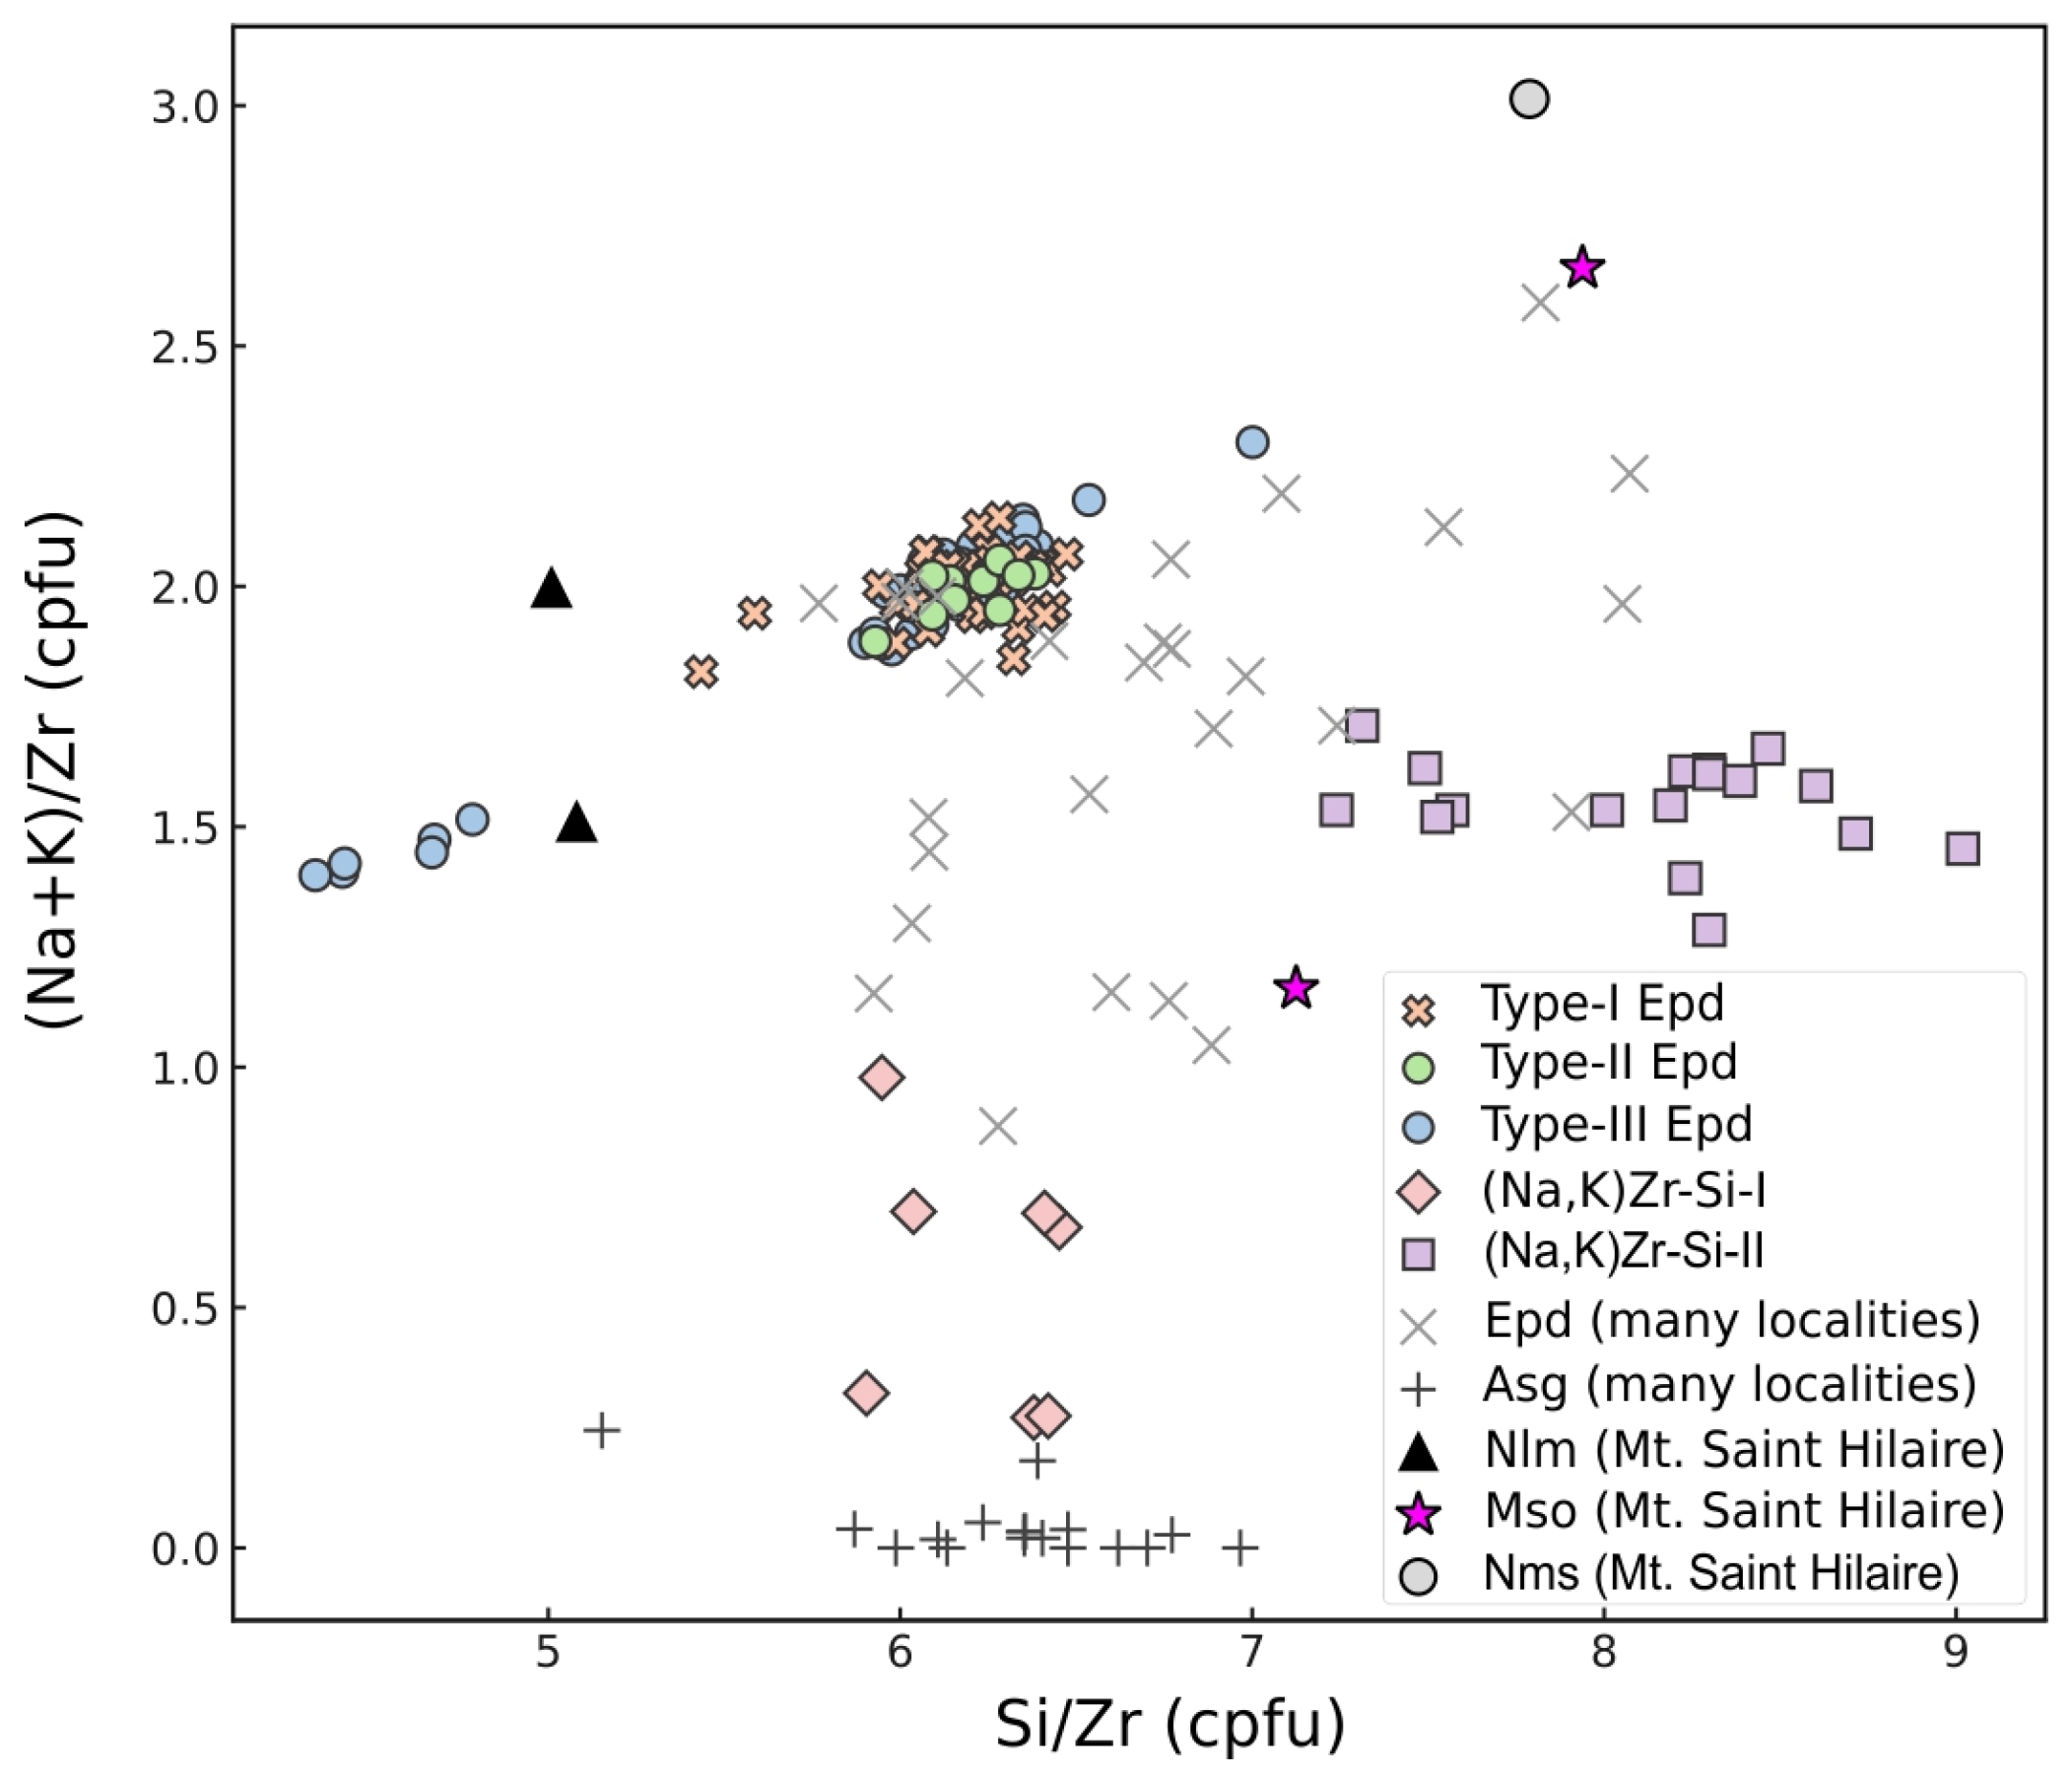
Two complementary metrics were also used to quantify group separations: Euclidean distance (dE), based on compositional differences, and ratio distance (dR), based on the structural ratios of Si/Zr and (Na+K)/Zr (Figure 6). These metrics provide robust and objective classifications relative to the ideal zirconosilicate end-member compositions.

4.1.3. Chemical Composition

A.
Elpidite Chemical Characteristics:
All three elpidite varieties are characterized by high Na2O (~9.7 wt%) and ZrO2 (19.5–20.2 wt%, Supplementary Material S1) contents, tightly clustered around Si/Zr ratios of 6.00 ± 0.04 and (Na+K)/Zr ratios of 1.98 ± 0.03. They show minimal Euclidean (dE = 2.94–3.41) and ratio distances (dR < 0.05) from the ideal elpidite. Minor enrichments of CaO and TiO2 observed in Type-III indicate localized hydrothermal alteration but do not significantly affect stoichiometry. Average structural formulas are
Type-I (euhedral): (Na1.95K0.017)Σ1.967Zr0.997Si6O15·3H2O
Type-II (vein-like): (Na1.935K0.013Ca0.009)Σ1.957Zr1.004Si6O15·3H2O
Type-III (granular): (Na1.938K0.01Ca0.013)Σ1.961Zr1.037Si6O15·3H2O
B.
(Na,K)-Zirconosilicate Chemical Characteristics
The (Na,K)Zr-Si-I phase is notably alkali-depleted (Na2O = 2.27 ± 1.02 wt.%) but Ca-rich (CaO = 0.33 ± 0.08 wt.%; Supplementary Material S1), with structural ratios of Si/Zr averaging 6.22 ± 0.25 and (Na+K)/Zr averaging 0.56 ± 0.27. The average structural formula is (Na0.422Ca0.158K0.078)Σ0.658Zr0.964Si6O15·nH2O (n ≈ 3.5).
Conversely, the (Na,K)Zr-Si-II variety is silica-rich (SiO2 = 61.01 ± 0.29 wt%) and distinctly K-bearing (K2O = 2.24 ± 0.43 wt%; Supplementary Material S1), with high Si/Zr ratios (mean 8.11 ± 0.51) and elevated (Na + K)/Zr ratios (mean 1.55 ± 0.10). The calculated average structural formula is (Na1.17K0.368)Σ1.538Zr1.005Si8O19·nH2O (n ≈ 4.5).
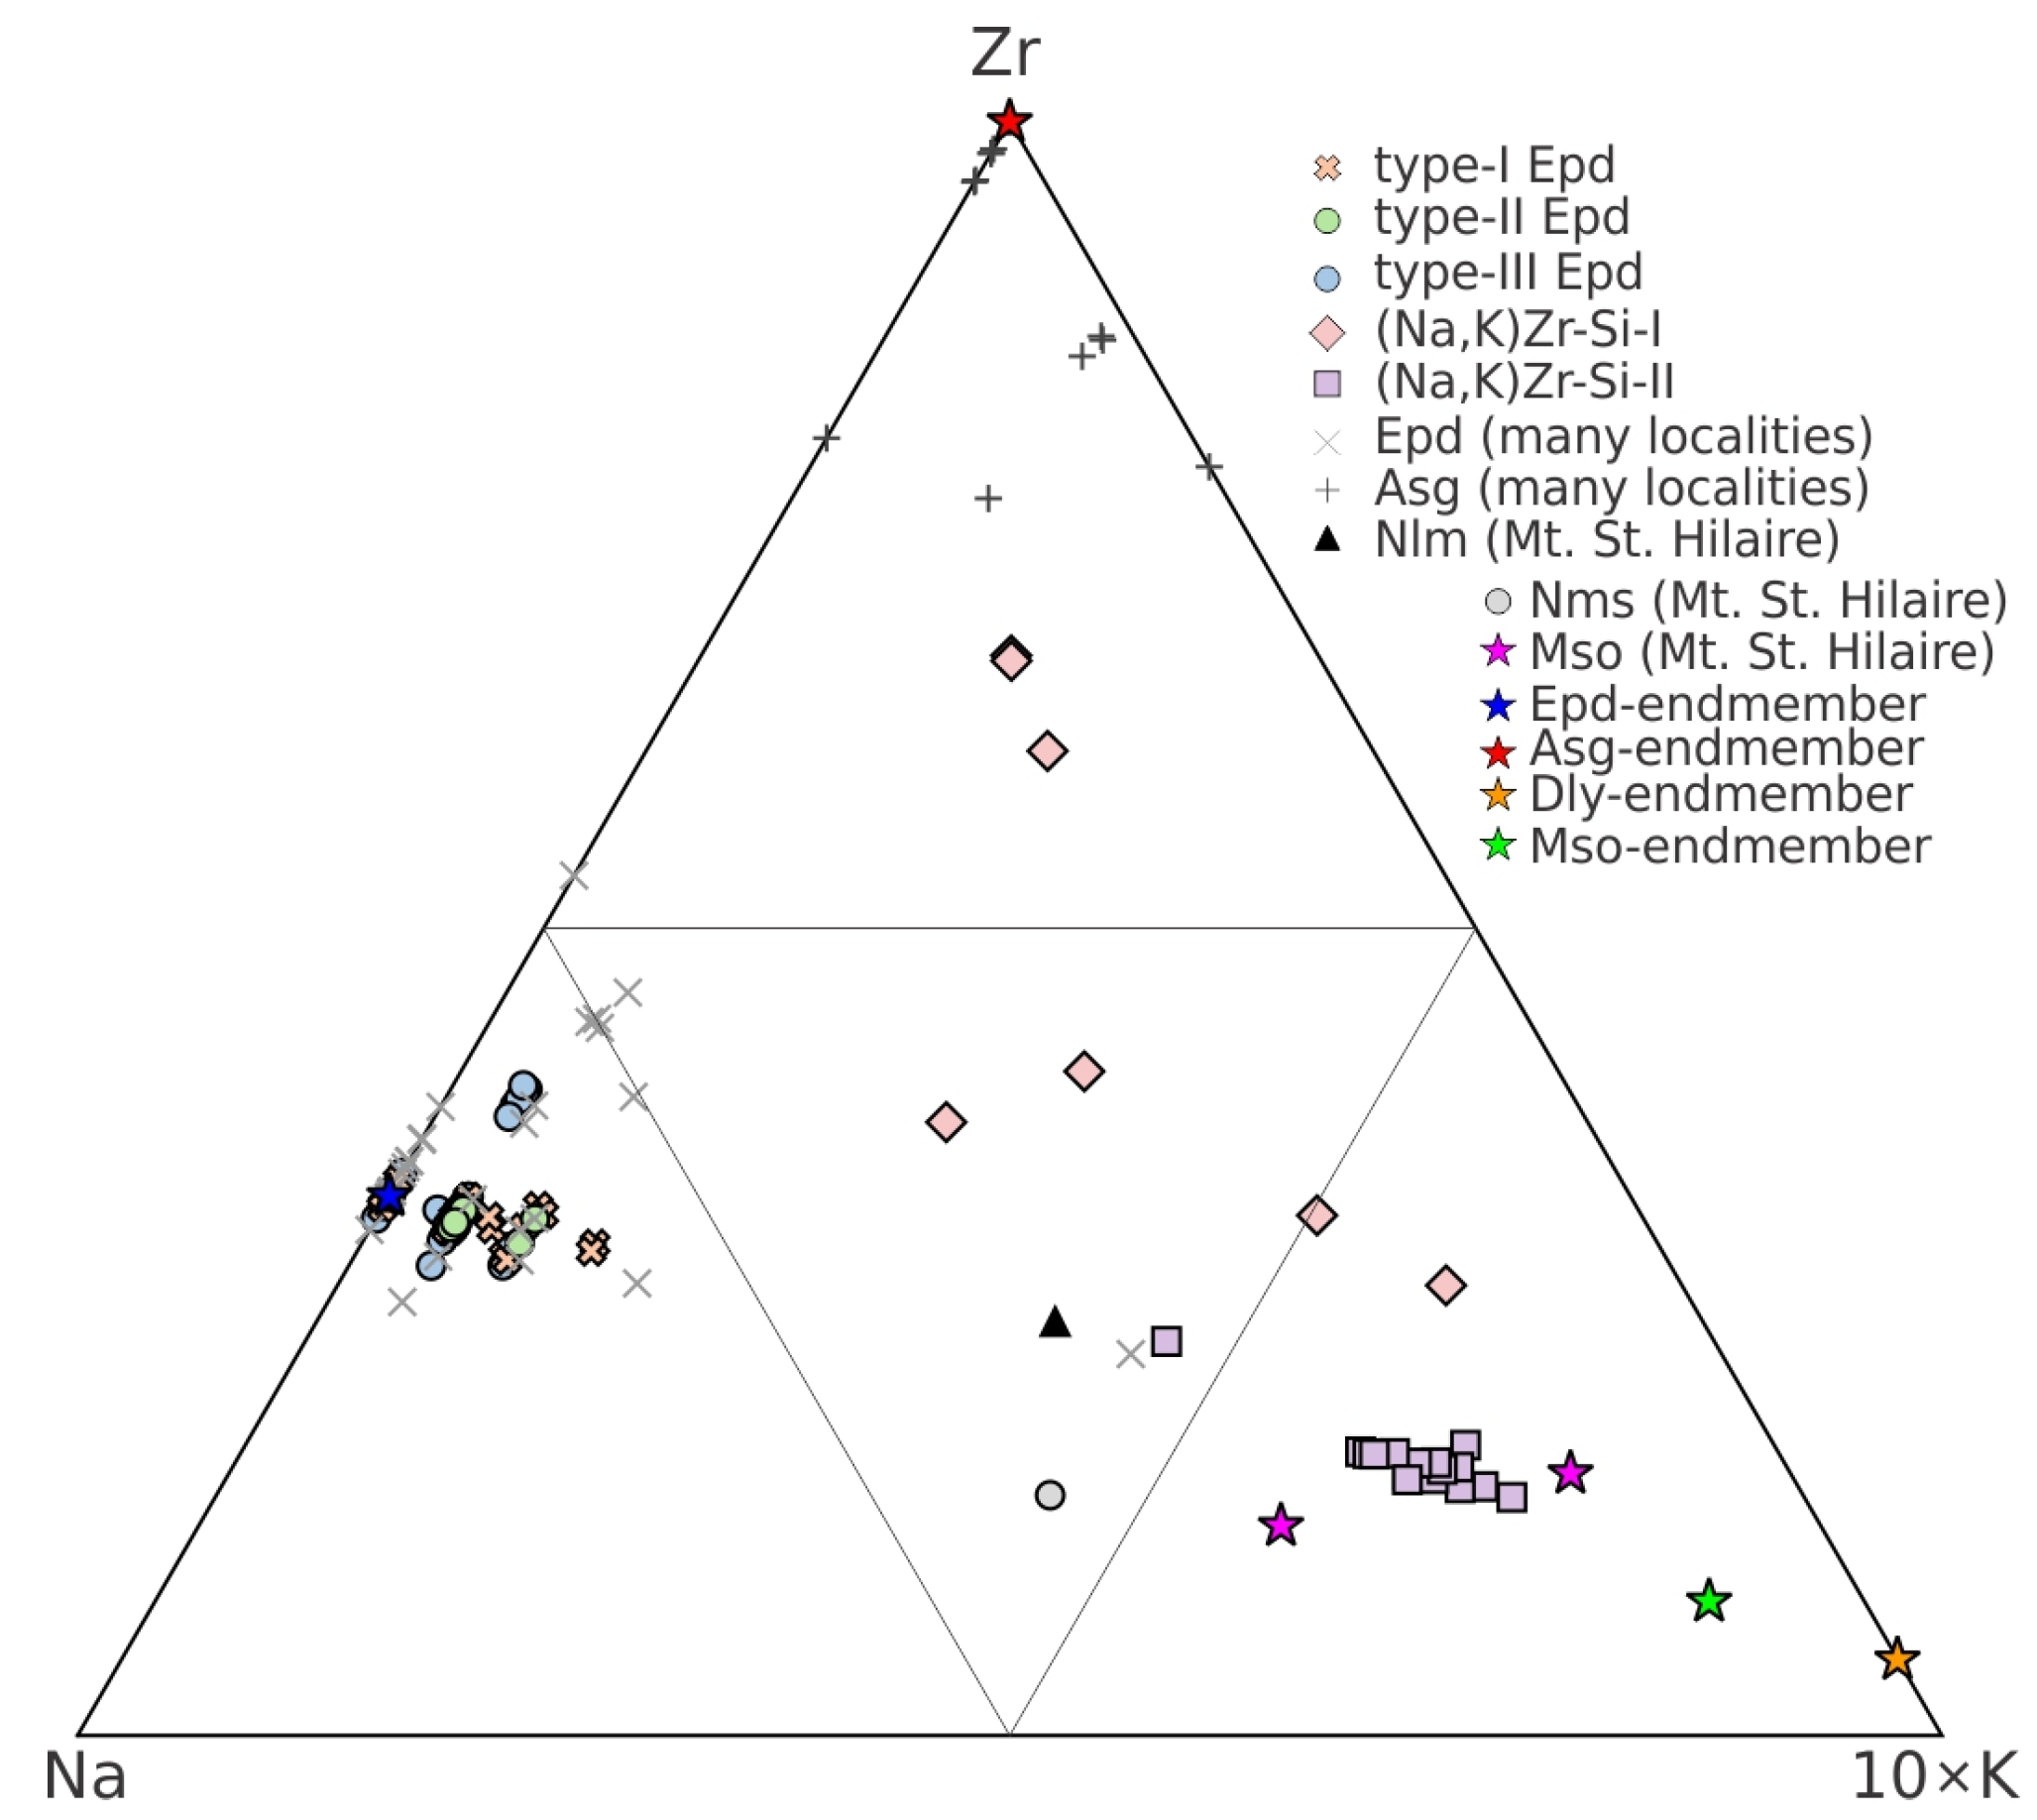
(Na,K)Zr-Si-I preserves the elpidite framework (Si/Zr ≈ 6.2) despite losing ~70% of its alkalis, while (Na,K)Zr-Si-II shows both moderate alkali depletion and 35% Si enrichment (Si/Zr ≈ 8.05), corresponding to the melansonite stoichiometry [44]. The Na–10 × K–Zr ternary diagram (Figure 7) depicts these chemical trends: elpidite clusters near the Na-rich corner, (Na,K)Zr-Si-I samples scatter along a discrete K-enrichment trajectory, and (Na,K)Zr-Si-II forming a concentrated cluster in the K-rich field overlapping known melansonite compositions.

4.2. Trace Element Systematics

4.2.1. REE Content and Distribution Patterns

LA-ICP-MS analysis successfully discriminated the three elpidite textural varieties, revealing that the REE patterns correlate with deformation intensity rather than the crystallization sequence. The total REE concentrations vary systematically among the textural groups but do not follow a clear crystallization sequence. In a simple crystallization sequence, trace element concentrations would increase systematically from early- to late-formed minerals due to incompatible element enrichment in residual melts. Instead, deformation appears to have significantly influenced REE enrichment. The chondrite-normalized REE patterns for the three elpidite types are shown in Figure 8.
Euhedral crystals (type-I, Figure 8A) consistently show the lowest REE concentrations (median = 539 ppm; MAD = 36 ppm; Supplementary Material S2), characterized by flattened HREE patterns (median Yb/GdN = 4.10 ± 0.73) and the most consistent, pronounced positive Eu anomalies (Eu/Eu* = EuN/√(SmN × GdN); 0.646 ± 0.047).
Vein-like aggregates (type-II, Figure 8C), closely associated with deformation and aligned parallel to the protomylonitic foliation, exhibit the highest and most variable REE concentrations (median = 1919 ppm; median absolute deviation—MAD = 1138 ppm), ranging from 415 to 7609 ppm (Supplementary Material S2). These aggregates display extreme REE fractionation, characterized by strong depletion of light REE (LREE; median LaN = 22.4) and substantial enrichment in heavy REE (HREE; median DyN = 1654.4). Consequently, they present the lowest (La/Yb)N ratios (0.021 ± 0.008) and moderate, variable negative europium (Eu) anomalies (Eu/Eu* = 0.228 ± 0.103).
Granular aggregates (Type-III, Figure 8E) contain intermediate REE levels (median = 1382 ppm; MAD = 358 ppm; Supplementary Material S2), with moderately elevated LREE (median LaN = 73.7) and significant HREE enrichment (median DyN = 463) values. These samples exhibit higher (La/Yb)N ratios (0.191 ± 0.145) and variable positive Eu anomalies (Eu/Eu* = 0.406 ± 0.134).

4.2.2. Trace Element Patterns and Element Correlations

Multi-element diagrams (Figure 8; see also Supplementary Material S2) reveal distinctive trace element distributions that mirror the REE trends across the three elpidite types. Euhedral crystals exhibit the lowest trace element concentrations, characterized by subtle HFSE enrichment and a distinct positive Eu anomaly, along with moderate Ba, Pb, and Sr enrichment (Figure 8B). In contrast, vein-like aggregates exhibit the most pronounced enrichment in trace elements, particularly HFSE such as Nb, Ta, Th, and U (Figure 8D). These samples display striking positive anomalies for Ta, Hf, and Th—up to four orders of magnitude above chondritic values—while showing notable depletions in Ba, Pb, and Sr. Granular aggregates occupy an intermediate position, with moderate HFSE enrichment and relatively higher concentrations of Ba, Pb, and Sr than those observed in vein-like aggregates (Figure 8F).
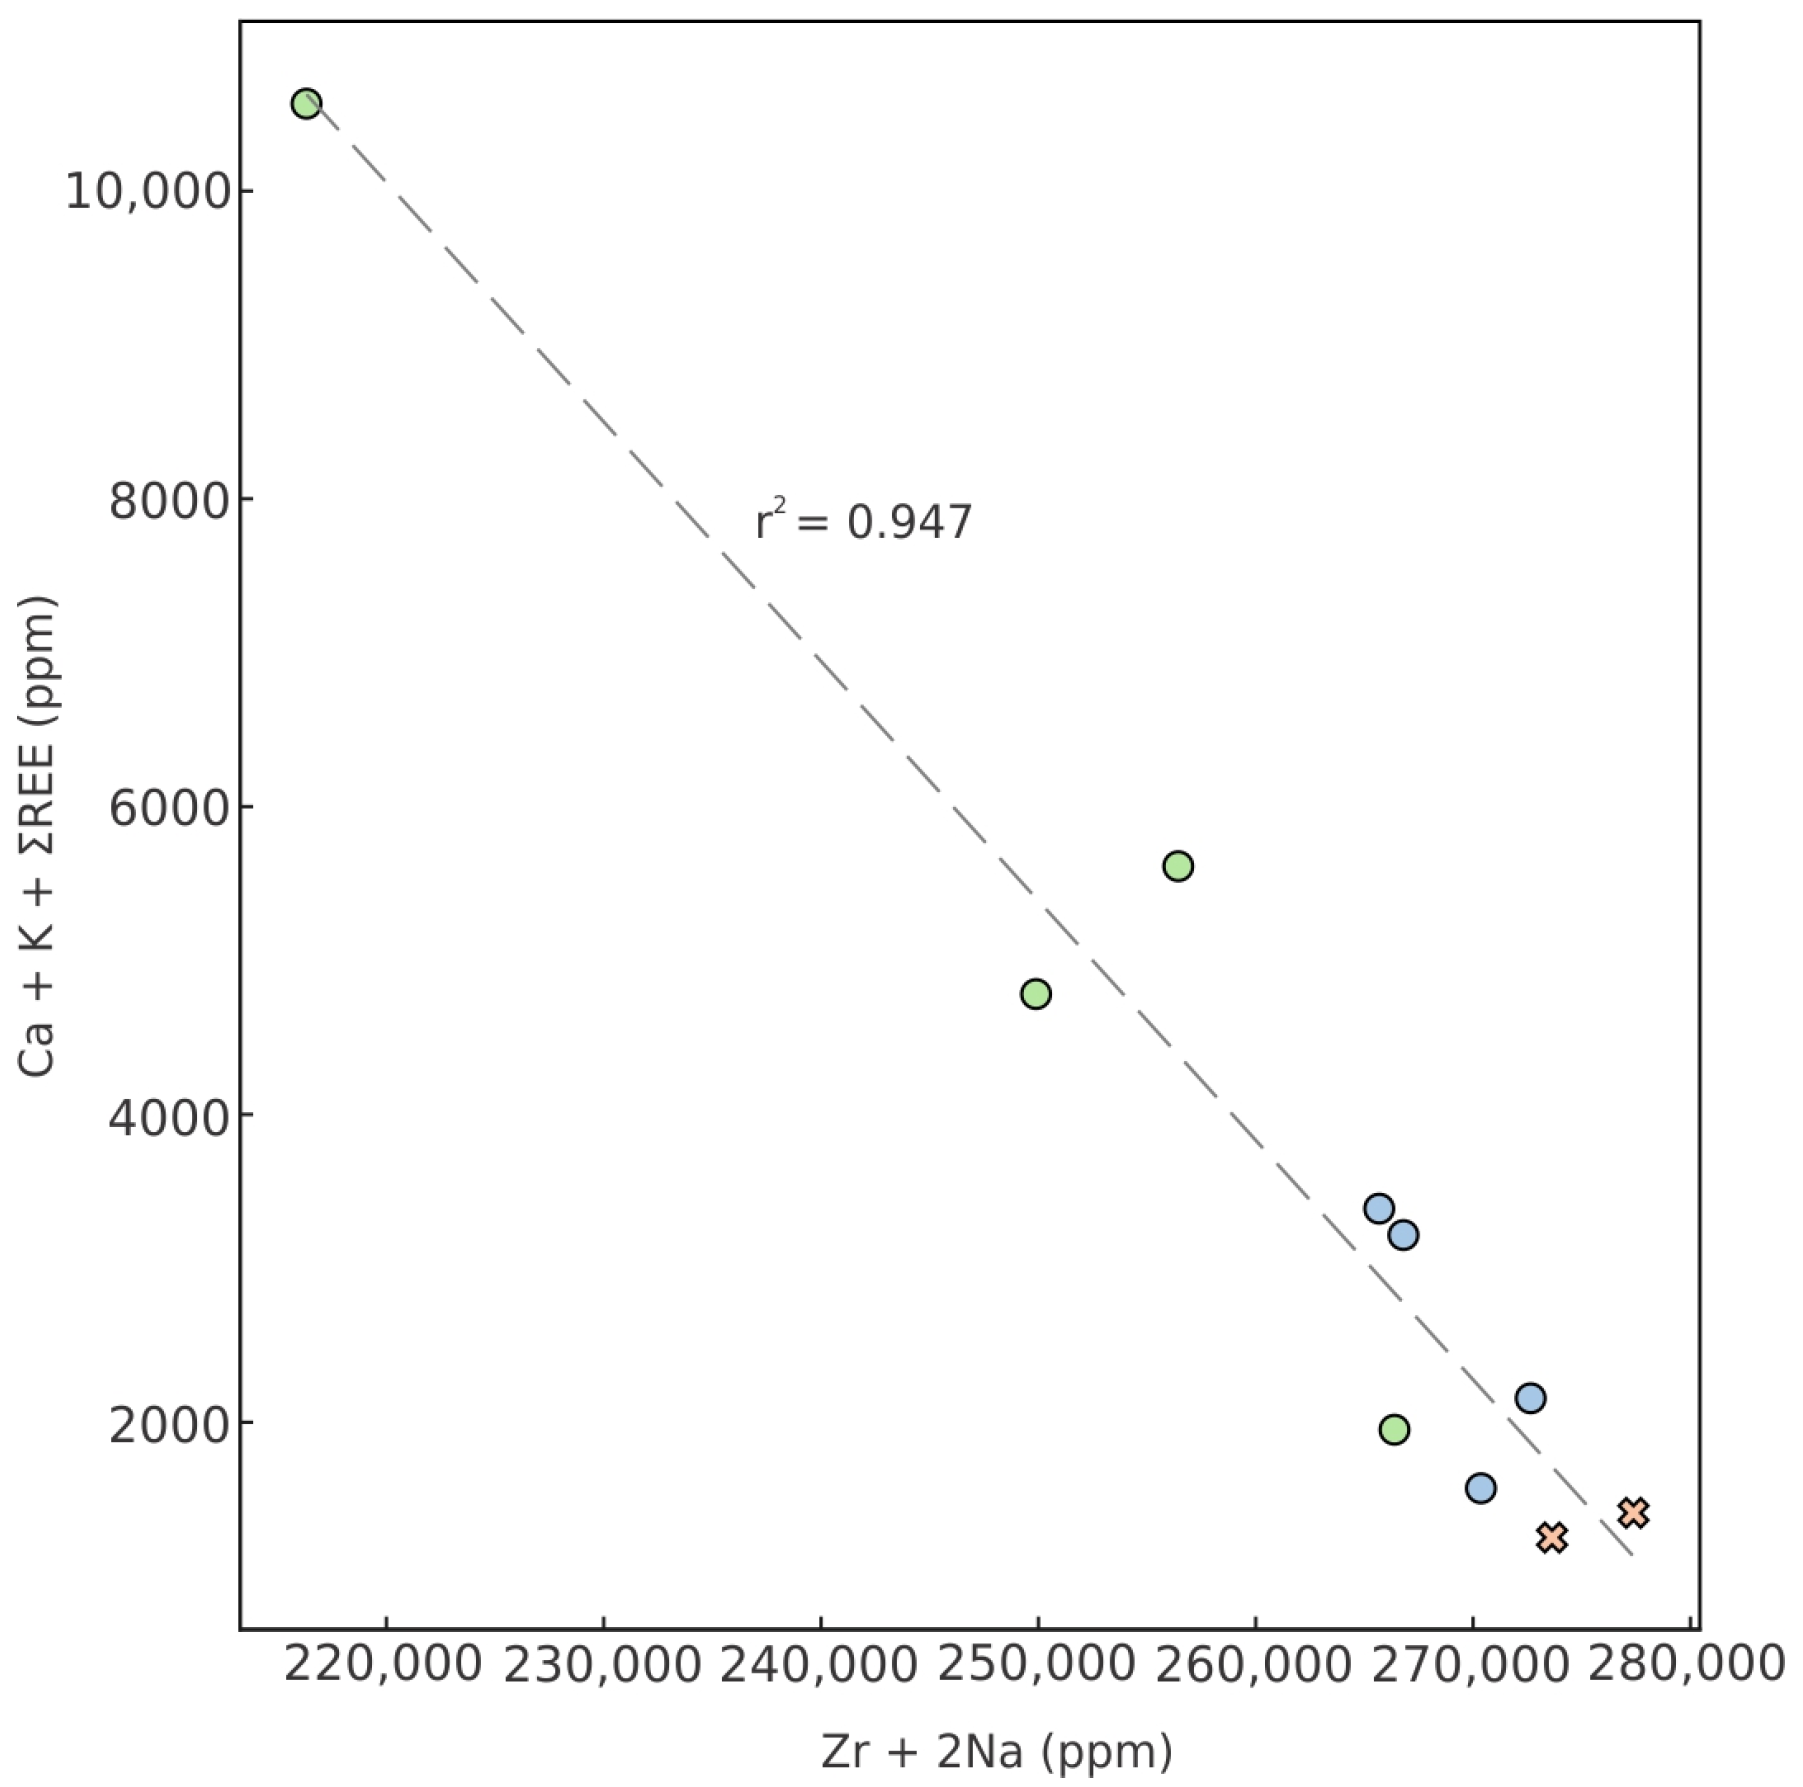
Correlation analyses further highlight the geochemical differences among the elpidite textural types. Heavy REE contents are positively correlated with Ca (r = 0.795, p < 0.05; where r refers to the Pearson correlation coefficient) and K (r = 0.796, p < 0.05) and negatively correlated with Na (r = −0.797, p < 0.05) and Zr (r = −0.632, p < 0.10). These trends are consistent with the proposed substitution mechanism of the form Zr4+ + 2Na+ ↔ Ca2+ + K+ + REE3+, supported by a statistically significant negative correlation (r = −0.783, p < 0.05; r2 = 0.947) between the sum of the reactants and products. Figure 9 illustrates this substitution mechanism and the varying correlation strengths among textural types: strongest in vein-like aggregates (r = −0.923, p = 0.15), moderate in granular aggregates (r = −0.315), and weakest in euhedral crystals (r = −0.150).

5. Discussion

5.1. Facies Dichotomy: Causes and Significance

The Papanduva Pluton exhibits a striking mineralogical dichotomy: the foliated facies contains diverse zirconosilicates (elpidite and two (Na,K)-varieties), while the massive facies contains only zircon. This fundamental contrast provides critical insights into the conditions that control the transition between miaskitic (zircon-dominated) and agpaitic (zirconosilicate-dominated) crystallization pathways [2].
The restriction of zirconosilicates to the foliated facies demonstrates that specific physicochemical conditions control Zr mineralization pathways. Our data, combined with previous work on these facies and similar systems, indicate that the transition from miaskitic to agpaitic assemblages correlates with increasing oxygen fugacity (ƒO2), peralkalinity, fluorine activity, and 18O enrichment [2,24,29,37]. Under these oxidizing, highly peralkaline conditions, excess alkalis maintain Zr4+ as a network modifier in the melt structure, preventing the formation of zircon and instead stabilizing elpidite as the primary Zr phase [1]. This network-modifier behavior of Zr fundamentally alters the distribution and mobility of HFSE and REE between the two facies. Furthermore, ref. [56] demonstrated that fluorine preferentially forms complexes with K over Na in silicate melts, and its presence can suppress the formation of K-zirconosilicates while favoring Na-zirconosilicates. This relationship provides an additional physicochemical control that may explain the initial Na-dominated crystallization in our system, with K-enrichment potentially occurring as F depletion occurred during late-stage evolution.
Importantly, the foliated facies represents not only a more evolved magmatic composition but also records a higher degree of deformation [25], creating a complex interplay between magmatic evolution and structural controls. This connection between structural deformation and mineralogical evolution emerges as a fundamental control in the Papanduva system, explaining both the facies-level dichotomy and mineralogical diversity within the foliated facies.

5.2. Compositional Architecture and Structural Controls

Our quantitative classification framework establishes a robust basis for understanding the diversity of zirconosilicates in the Papanduva Pluton. PCA (Figure 5) reveals two principal compositional trends that clearly distinguish three compositional groups: Na-rich elpidite, Na-poor (Na,K)Zr-Si-I, and silica-rich (Na,K)Zr-Si-II. When placed in a global context, the Papanduva elpidite textural variants cluster relatively tightly around Si/Zr ≈ 5.9–6.2 and (Na+K)/Zr ≈ 1.8–2.1 (Figure 6). However, elpidite compositions from other localities, such as Khan Bogd, Strange Lake, Evisa, and Ilímaussaq complexes [5,9,10,19,47], show more significant variation in (Na+K)/Zr values (~1.1 to ~2.6), suggesting that the alkali content is more susceptible to post-crystallization modification than the silicate framework structure.
(Na,K)-zirconosilicates exhibit distinct compositional fields that reflect different structural modifications. (Na,K)Zr-Si-I maintains a silicate framework of elpidite (Si/Zr ≈ 6.2, Si6O15 stoichiometry), despite severe alkali depletion [(Na+K)/Zr ≈ 0.6], but crystallizes in the monoclinic system rather than orthorhombic system. This is scattered in the Na–10K–Zr ternary diagram (Figure 7), reflecting a non-equilibrium cation exchange. Conversely, (Na,K)Zr-Si-II shows complete structural reorganization, with higher Si/Zr ratios (≈8.1, Si8O19 stoichiometry), and forms a discrete cluster in the ternary diagram of Figure 7 that approaches melansonite compositions, indicating equilibrium recrystallization under K-dominated conditions.
The correlation analysis in our results section provides quantitative support for the proposed substitution mechanism. The statistically significant negative correlation (r = −0.783, p < 0.05; r2 = 0.947) between Zr4+ + 2Na+ and Ca2+ + K+ + REE3+ (Figure 9) demonstrates that element mobility followed systematic exchange patterns rather than random alterations. The contrasting compositional fields thus reflect two distinct alteration mechanisms operating in the system: selective cation exchange and more comprehensive structural reorganization.

5.3. Deformation as a Primary Control

The trace element data reveal that the REE enrichment patterns do not follow a simple crystallization sequence. Despite crystallizing later, granular elpidite aggregates (Type-III) contain intermediate REE levels, while earlier-formed vein-like aggregates (Type-II) show significantly higher and more variable REE concentrations (Figure 8). This apparent paradox is resolved when the spatial relationship between mineral textures and deformation features is considered.
Three lines of evidence establish that deformation-controlled fluid pathways, rather than the crystallization sequence, determine REE enrichment.
  • Spatial association: Vein-like aggregates (highest REE; median = 1919 ppm) occur exclusively along deformation features (Figure 3D), while euhedral crystals (lowest REE; median = 539 ppm) show no association with deformation (Figure 3A,B).
  • Correlation strength gradients: The correlation between substitution components Zr4+ + 2Na+ and Ca2+ + K+ + REE3+ (Figure 9) varies directly with deformation intensity, being strongest in vein-like aggregates (r = −0.923; r2 = 0.947), intermediate in granular aggregates (r = −0.315), and weakest in euhedral crystals (r = −0.150).
  • Variable Eu anomalies: The progressive weakening of positive Eu anomalies from euhedral crystals (Eu/Eu* = 0.646) to vein-like aggregates (Eu/Eu* = 0.228) indicates increasing fluid–rock interaction under progressively more reducing conditions along deformation-controlled pathways (Figure 8).
This spatial control on REE distribution represents a distinctive feature of the Papanduva granites, demonstrating how submagmatic deformation governs trace element redistribution in zirconosilicate minerals. These relationships establish deformation as the primary control on the spatial distribution and intensity of fluid–mineral interactions. By creating microfractures that served as preferential fluid pathways, submagmatic deformation created microfractures that served as preferential fluid pathways, resulting in spatially heterogeneous alteration patterns that explain the coexistence of variably altered minerals within the same samples.

5.4. Integrated Evolutionary Model

Based on the textural, compositional, and structural evidence, we propose a three-stage evolutionary model for elpidite and associated zirconosilicates, as illustrated in Figure 10:
I.
Stage 1—Primary magmatic crystallization: Located in the high µNa2O, low µK2O region of the diagram, this stage represents the initial magmatic crystallization under highly peralkaline conditions. Euhedral elpidite formed during the late-magmatic stage from highly peralkaline, zircon-undersaturated residual melt. The occasional inclusion of albite laths in euhedral elpidite indicates co-precipitation, confirming its primary late-magmatic origin. Positive Eu anomalies in euhedral crystals (Eu/Eu* = 0.646) reflect crystallization from magmatic melts with minimal fluid interaction.
II.
Stage 2— Deformation-enhanced fluid interaction: As the system evolved toward moderate K2O and still-high µNa2O, submagmatic deformation created microfractures that served as preferential fluid pathways. This stage produces two distinct alteration patterns:
a.
Foliation-controlled REE enrichment: Vein-like elpidite aggregates formed along deformation features, characterized by extreme HREE enrichment (median DyN = 1654.4) coupled with significant Na-leaching, as indicated by the strong negative correlation between the Na and REE contents in these samples.
b.
Pervasive alkali exchange: (Na,K)Zr-Si-I formed through preferential Na removal with minimal framework disruption, maintaining Si/Zr ≈ 6.2 while showing severe alkali depletion [(Na + K)/Zr ≈ 0.6].
III.
Stage 3—Late-stage recrystallization: The final stage occurred under high µK2O and low µNa2O conditions, representing the final phase of the system evolution. Two divergent pathways were developed:
a.
Framework-modifying recrystallization: (Na,K)Zr-Si-II formed through interactions with K-rich, Si-saturated fluids, resulting in both modified alkali content [(Na + K)/Zr ≈ 1.6] and elevated Si/Zr ratios (≈8.1).
b.
Hydrothermal elpidite precipitation: Granular elpidite aggregates crystallized under waning hydrothermal activity, showing intermediate REE levels (median = 1382 ppm) and higher (La/Yb)N ratios (0.191) than vein-like aggregates.
This model resolves the apparent paradox of non-sequential REE enrichment by recognizing that spatial proximity to fluid pathways, rather than the crystallization sequence, controls alteration intensity. The evolution was spatially heterogeneous rather than uniformly progressive, explaining the coexistence of variably altered minerals within the same sample.
Figure 10. Three-stage evolutionary model for elpidite and (Na,K)-zirconosilicates in the Papanduva Pluton. Stage 1 represents the formation of euhedral elpidite (type I) from a Na-rich, late-magmatic peralkaline melt characterized by strong Eu anomalies. Stage 2 corresponds to deformation–enhanced fluid interaction, producing vein-like elpidite aggregates (type II) with high HREE contents (stage 2a) and pseudomorphic (Na,K)Zr-Si-I phases marked by significant Na depletion (stage 2b). Stage 3 depicts late-stage recrystallization pathways, including the crystallization of K-rich (Na,K)Zr-Si-II with elevated Si:Zr ratios and the formation of granular elpidite aggregates (type III) during waning of hydrothermal activity. The base of the diagram summarizes fluid evolution from Na-rich to K-enriched conditions, with REE enrichment patterns driven primarily by deformation-related fluid pathways rather than the crystallization sequence.
Minerals 15 00667 g010

5.5. Reaction Mechanisms and Stability Fields

The three-stage evolutionary model illustrated in Figure 10 can be further refined into a detailed reaction sequence that provides a mechanistic basis for the mineralogical transformations observed in the Papanduva Pluton. These reactions correspond to specific regions within the petrogenetic grid shown in Figure 11, which illustrates the mineral stability fields and reaction boundaries in μNa2O–μK2O space. This grid was constructed using a Schreinemakers analysis of nine key reactions (R0–R8), considering ideal endmembers:
  • Stage 1 Reactions (High µNa2O region):
    R0: Zircon + Na-rich fluid → Euhedral elpidite + Arfvedsonite
    ZrSiO4 + Na-rich fluid → Na2ZrSi6O15·3H2O + Na-amphibole
    R1: Arfvedsonite + O2 → Aegirine + Na2O + H2O
    Na3Fe52+Fe23+Si8O22(OH)2 + 3O2 → 5NaFe3+Si2O6 + Na2O + 2H2O
    R2: Na2O + TiO2 + 4SiO2 → Narsarsukite
    2Na2O + TiO2 + 4SiO2 → Na2(Ti,Fe3+)Si4(O,F)11
    R3: Formation of euhedral elpidite
    Na2O + ZrO2 + 6SiO2 + 3H2O → Na2ZrSi6O15·3H2O
These reactions reflect the transition from miaskitic to agpaitic assemblages under conditions of increasing oxygen fugacity and peralkalinity during late-magmatic crystallization.
  • Stage 2 Reactions (Transition to intermediate µNa2O and µK2O):
    R4: Fluid-mediated crystallization along deformation features (vein-like elpidite)
    Na2O + ZrO2 + 6SiO2 + 3H2O + (REE,Ca,K) → (Na,K)2ZrSi6O15·3H2O
    R5: Euhedral elpidite + K-rich fluid → (Na,K)Zr-Si-I + Na-rich fluid
    Na2ZrSi6O15·3H2O + K,Ca-rich fluid → (Na,Ca,K)0.66ZrSi6O15·nH2O + Na+
These reactions represent the two distinct alteration patterns identified in Stage 2, which occur as the system transitions from high Na2O to intermediate Na2O-K2O chemical potentials.
  • Stage 3 Reactions (High µK2O, low µNa2O region):
    R6: Euhedral elpidite + K-rich fluid + silica → (Na,K)Zr-Si-II + Na-rich fluid
    Na2ZrSi6O15·3H2O + K+ + 2SiO2 → (Na,K)1.5ZrSi8O19·nH2O + Na+
    R7: narsarsukite + Zr-rich fluid + K-rich fluid → (Na,K)Zr-Si-II + Al-bearing narsarsukite rim
    Na2(Ti,Fe3+)Si4(O,F)11 + Zr4+ + K+ + 2SiO2 → (Na,K)1.5ZrSi8O19·nH2O + Al-bearing narsarsukite rim
    R8: Formation of granular elpidite
    Na2O + ZrO2 + 6SiO2 + K+ + Ca2+ + 3H2O → (Na,K)2ZrSi6O15·3H2O
Recent work by [29] on narsarsukite [Na2(Ti,Fe3+)Si4(O,F)11] in the Papanduva foliated facies provides evidence supporting our reaction framework. The observed intergrowth between narsarsukite and a Na-K-rich zirconosilicate, likely corresponding to (Na,K)Zr-Si-II, confirms the operation of reaction R7.
Figure 11. Petrogenetic grid for zirconosilicate minerals in the Papanduva Pluton. Schreinemakers analysis of nine key reactions (R0–R8) in the μNa2O–μK2O space, illustrating three evolutionary stages. Stage 1: Late-magmatic transformation of zircon to euhedral elpidite (R0, R3), with associated aegirine (R1) and narsarsukite (R2) formation under high μNa2O conditions. Stage 2: Deformation-enhanced vein-like elpidite formation (R4) and development of (Na,K)-zirconosilicate-I (R5) during deformation–enhanced fluid interaction. Stage 3: Late-stage recrystallization forming (Na,K)-zirconosilicate-II via elpidite (R6) and narsarsukite (R7) pathways and granular elpidite precipitation (R8). Colored stability fields represent: Stage 1 primary magmatic assemblages (red), Stage 2 deformation-enhanced assemblages (blue), Stage 3a ZrS-II formation via elpidite (green), Stage 3b ZrS-II formation via narsarsukite (purple), and granular elpidite precipitation (orange). The invariant points (I1–I7) indicate critical transitions. Dashed arrows trace the paragenetic sequence from Na-rich to K-enriched conditions.
Minerals 15 00667 g011
These reaction sequences align with the experimentally determined stability limits of elpidite (<600 °C at 100 MPa) and estimated temperature conditions for the late-magmatic (<650 °C) and post-magmatic (<500 °C) stages in the foliated facies based on amphibole and clinopyroxene compositions [37]. Experimental studies support our temperature-controlled evolutionary model: [57] synthesized elpidite analogs at 350–500 °C, whereas [58] produced the K-rich analog (umbite) at 200 °C. This 150–300 °C temperature difference confirms that K-rich zirconosilicates form at lower temperatures, consistent with their late-stage crystallization in the proposed Stage 3 evolution.

5.6. Sources and Evolution of Potassium

The compositional data reveal a shift from Na-dominated to increasingly K-rich fluids during the submagmatic to hydrothermal transition (Figure 10), corresponding to the trajectory across the petrogenetic grid from high µNa2O to high µK2O (Figure 11). This evolution was spatially heterogeneous rather than uniformly progressive, explaining the coexistence of variably altered minerals within the same sample.
Observable mechanisms that contribute to increasing K/Na ratios include the following:
  • Primary magmatic enrichment: The foliated facies represents a more evolved magmatic composition than the massive facies, with higher initial K/Na ratios documented in whole-rock analyses [25]. As crystallization progressed, potassium became concentrated in the residual melts, whereas sodium-rich minerals preferentially crystallized [37].
  • Autometasomatic processes: The crystallization sequence from Na-rich minerals (aegirine and arfvedsonite) to K-bearing zirconosilicates demonstrates systematic Na depletion from residual fluids, creating progressively higher K/Na ratios recorded in the mineral compositions.
  • Structural control on fluid pathways: Submagmatic deformation created preferential fluid pathways along structural discontinuities, as evidenced by the occurrence of (Na,K)Zr-Si-I phases associated with deformation features.
The additional processes documented in our samples are as follows:
4.
Fluid-rock interactions: Textural evidence for replacement and vein-like growth indicates interaction with K-bearing fluids. Experimental studies have shown that K is readily partitioned into hydrothermal fluids during fluid–rock interactions [5,7,59].
5.
Ion-exchange processes: Experimental studies have demonstrated that elpidite exhibits high K+ exchangeability even at low temperatures (90–150 °C), with K+ preferentially occupying water molecule sites [60]. This mechanism explains the compositional evolution observed in our samples: the (Na,K)Zr-Si-I phase shows selective cation exchange with minimal framework disruption, whereas extensive exchange (>50% of Na+) causes severe framework distortion. This provides a mechanistic basis for the transition to (Na,K)Zr-Si-II, characterized by both modified alkali content and elevated Si/Zr ratios.
A comparable ion-exchange mechanism operates at Mont Saint-Hilaire, where melansonite, (Na,□)□2KZrSi8O19·5H2O, forms by selective exchange within a similar framework [44]. However, this demonstrates that K-enrichment can proceed without the strong deformation control that characterizes the Papanduva system.
In summary, the documented K-enrichment patterns (Figure 10 and Figure 11) in the Papanduva Pluton resulted from the combined effects of magmatic differentiation, autometasomatism, deformation–enhanced fluid circulation, and ion-exchange processes within a closed system. The association of (Na,K)Zr-Si-I with deformation features demonstrates structural control on fluid–rock interaction, while the progressive compositional evolution to (Na,K)Zr-Si-II reflects the integrated operation of multiple K-enrichment mechanisms.

5.7. Broader Implications and Comparative Context

5.7.1. Mineralogical and Textural Comparisons

The Papanduva Pluton shares textural features with other alkaline complexes [5,9,10,18,19,47], while showing distinct compositional evolution. Both Papanduva and Khan Bogd (Mongolia) display zircon-rich versus elpidite-rich facies, but their alteration pathways diverge: Papanduva exhibits K-dominated evolution while Khan Bogd shows Ca-dominated pathways [10]. The compositional differences reflect contrasting fluid compositions rather than mineral reactivity differences, as experimental studies have demonstrated similar K+ exchange capacities in elpidite from both localities [60].
The documented mineral assemblages demonstrate these contrasting pathways: the Papanduva system lacks Ca-rich zirconosilicates (e.g., armstrongite and gittinsite) found at Khan Bogd [10,49], despite significant Ca in contemporaneous phases such as turkestanite (CaO ~6–9 wt%), nacareniobsite-(Ce) (CaO ~17–19 wt%), and britholite-(Ce) (CaO ~3–5 wt%) [24,39]. The documented Ca distribution explains why Papanduva zirconosilicates evolved toward K-enrichment rather than the Ca-enrichment observed at Khan Bogd.

5.7.2. Trace Element Patterns and Mineral Competition

The more evolved foliated facies of the Papanduva pluton are characterized by REE and HFSE enrichment, along with increasing peralkalinity during late-magmatic stages [25]. These trends suggest that mechanisms beyond fractional crystallization contributed to the observed geochemical signatures of this enrichment process. Similar trends in evolved A-type granites, such as enrichments in Zr and Nb, flattening of REE patterns, and Eu anomalies, have been linked to the crystallization of REE-rich accessory minerals and HFSE complexing with fluorine [61,62]. These analogs support the interpretation that mineral competition and melt complexing also influenced the zirconosilicate compositions at Papanduva.
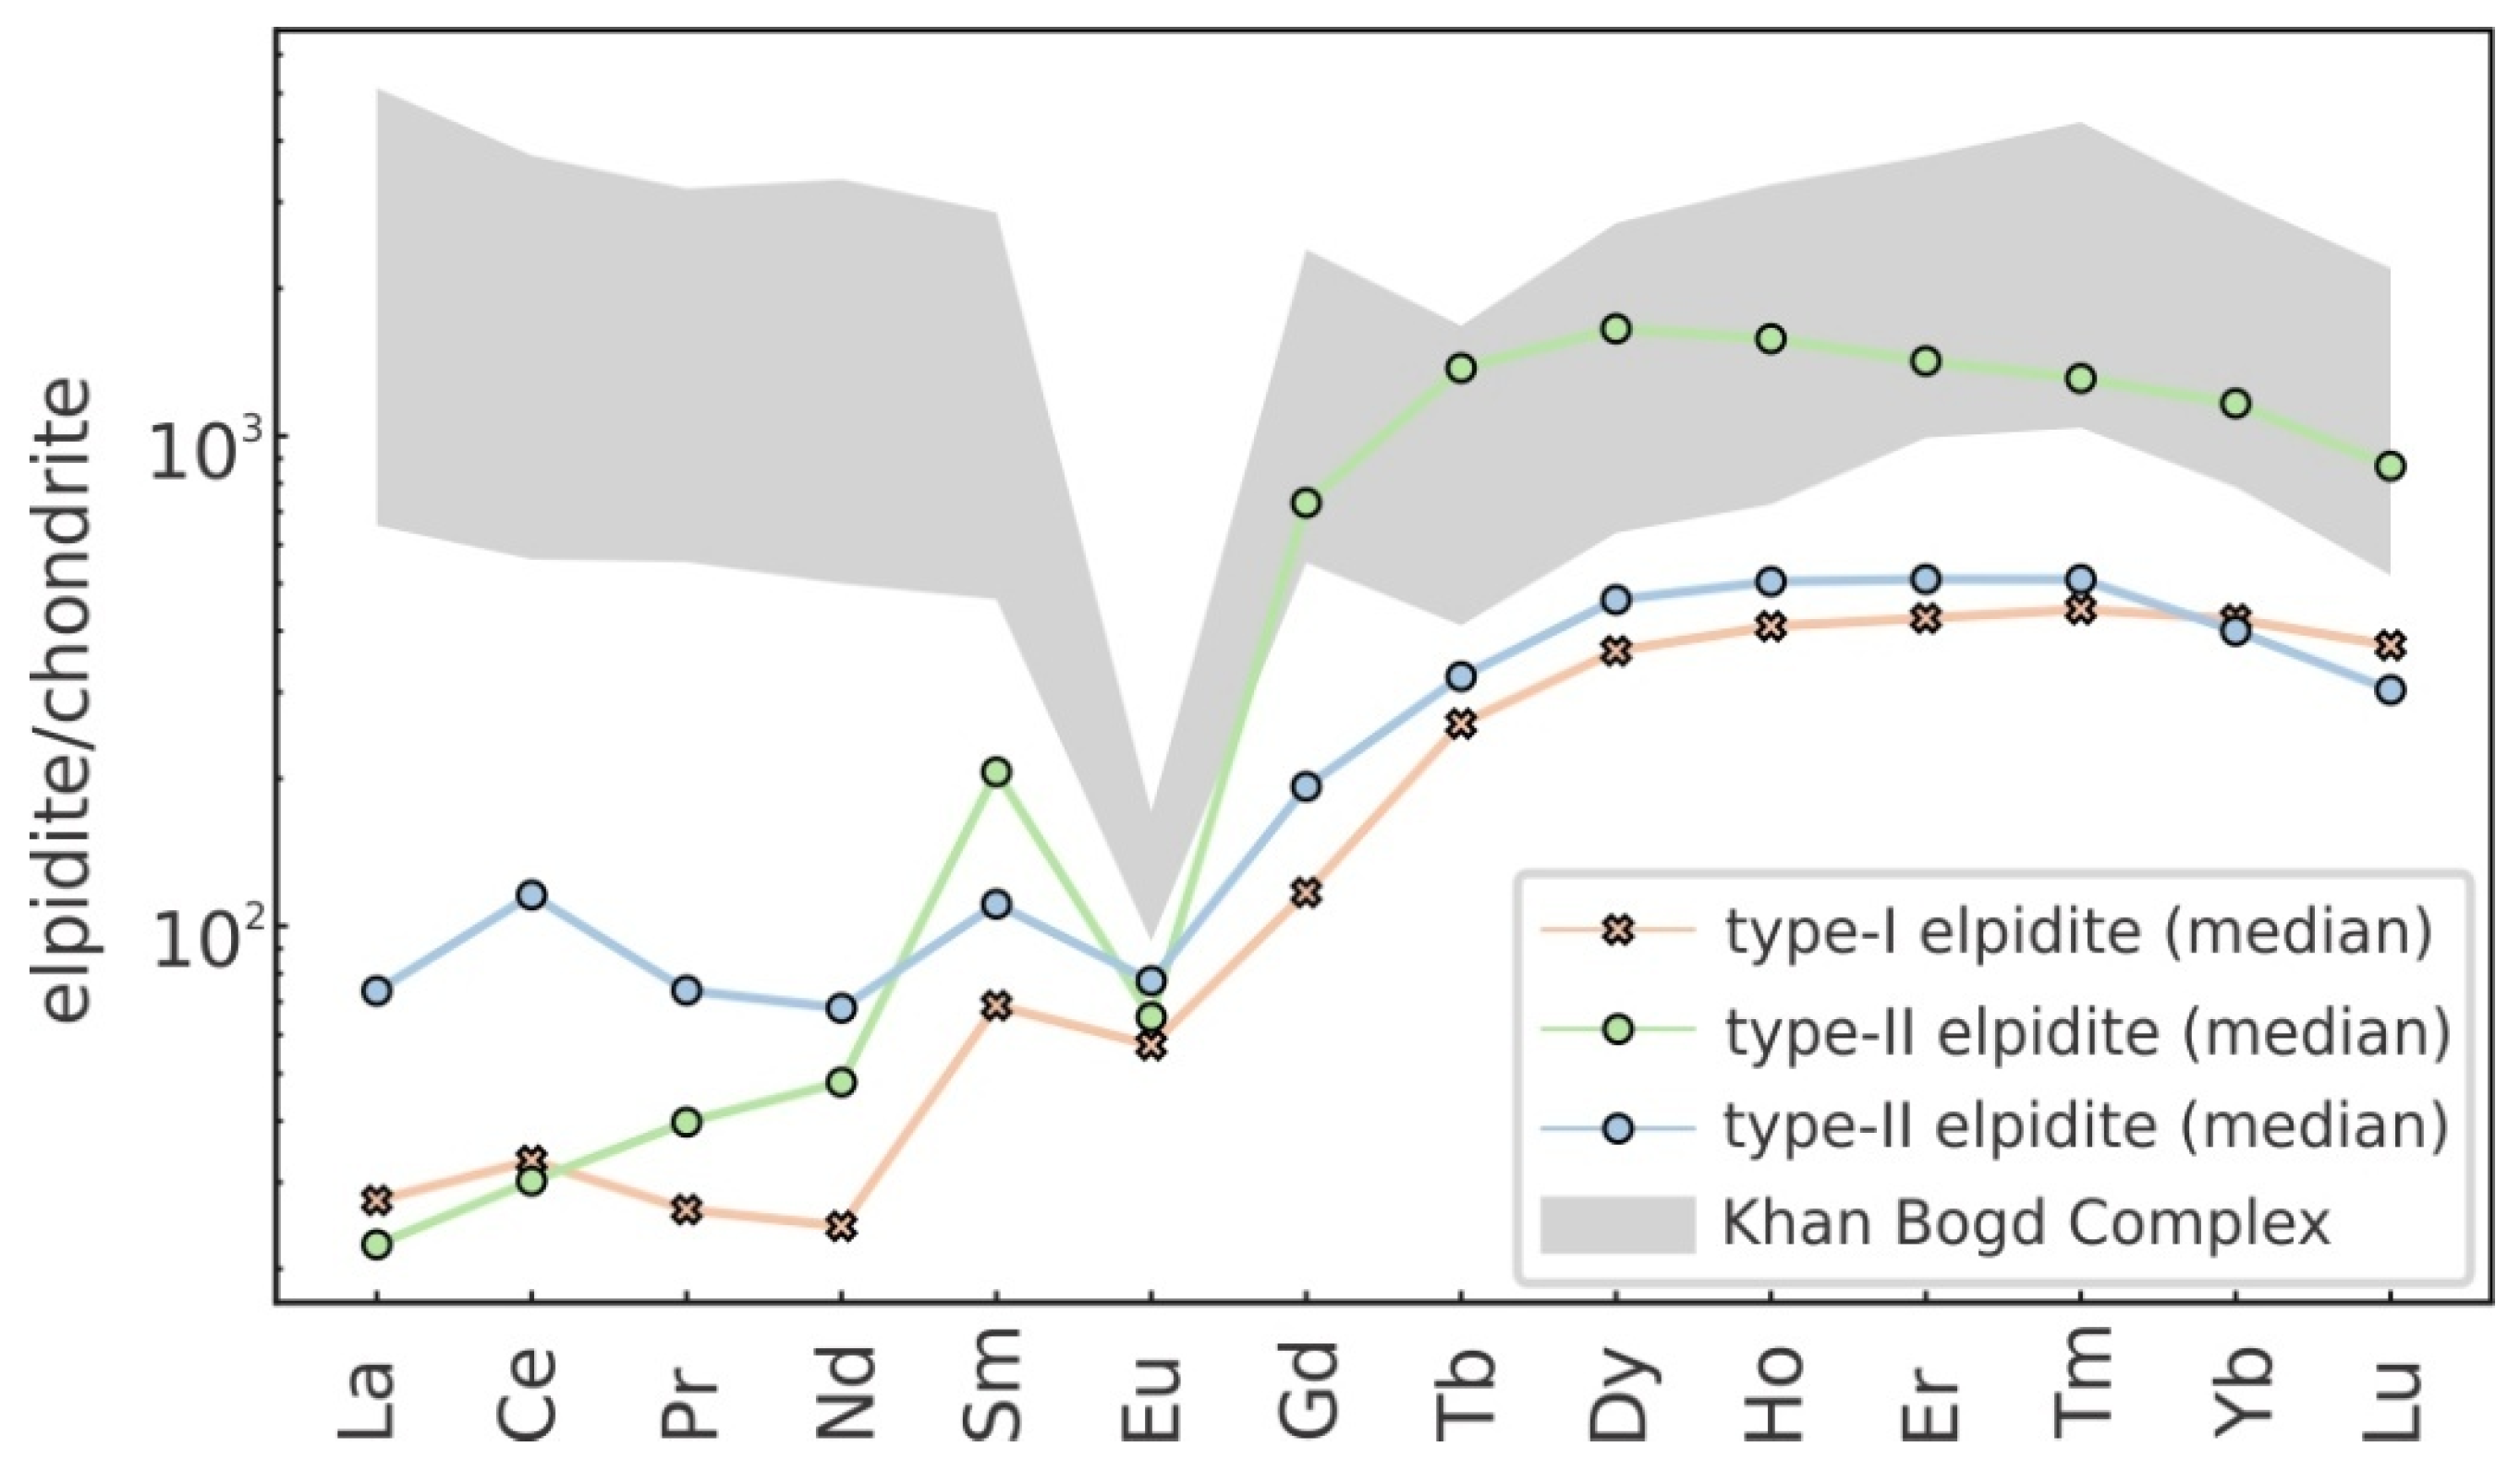
Compared to elpidite from the Khan Bogd Complex, Papanduva elpidite exhibits lower LREE across all textural types (Figure 12), likely reflecting the early removal of LREE by co-crystallizing accessory phases such as astrophyllite, nacareniobsite, and chevkinite, which crystallized prior to or contemporaneously with elpidite [24,29,63]. Papanduva elpidite also displays relative HREE depletion compared with primary zircon (Figure 8). This pattern correlates with the presence of HREE-bearing minerals, including arfvedsonite (124 ppm HREE), aegirine (138 ppm HREE), and gerenite-(Y) (up to 823 ppm; [24]), which crystallized during the late to post-magmatic stages.
Collectively, these observations indicate that the REE budget of zirconosilicates at Papanduva was primarily controlled by mineral competition rather than by limited REE availability. The resulting signatures reflect the selective partitioning of REEs among coexisting accessory phases during the magmatic evolution. Although the specific mineral assemblages may vary across systems, the underlying processes of mineral segregation and element complexing appear to be consistent among evolved alkaline rocks.
While mineral competition governs initial REE partitioning, the overprint of structurally controlled fluid pathways is essential to explain their spatial redistribution.

5.7.3. Structural Controls: A Distinctive Feature

The spatial correlation between deformation features and REE distribution observed at Papanduva has not been reported in other elpidite-bearing localities [5,9,10]. This underscores the critical role of structural controls in localizing fluid–mineral interactions and enhancing the mobility of elements.
Experimental studies on ion exchange mechanisms [60] provide a framework for understanding how deformation enhances the redistribution of elements. Microfractures generated by submagmatic deformation facilitate infiltration into the zirconosilicate framework, promoting the exchange of Na+ for K+ and other cations along these pathways. This establishes a mechanistic connection between the structural features and the ion exchange processes.
A comparison with Mont Saint-Hilaire further illustrates this. Although melansonite at that locality forms via similar ion-exchange reactions [44], the absence of pronounced deformation features suggests that structural discontinuities at Papanduva significantly accelerate such exchanges.
Although fluid-driven alteration is common in other alkaline systems [4,5,10,17,21], the correlation between deformation features and zones of extreme REE enrichment at Papanduva provides a novel perspective. Quantitative data support this interpretation: the strength of substitutional relationships between major and trace elements increases proportionally with deformation intensity (strongest in vein-like aggregates: r = −0.923 vs. weakest in euhedral crystals: r = −0.150; Figure 9), reinforcing the role of structural control.
This mechanism also accounts for the non-sequential REE enrichment observed in different elpidite varieties. Rather than following a straightforward magmatic crystallization sequence, elemental mobility appears to have been controlled by proximity to deformation-guided fluid conduits. Consequently, the resulting alteration pattern is spatially heterogeneous and cannot be attributed solely to magmatic processes.
A comparative analysis with other alkaline systems underscores the distinctive role of structural controls at Papanduva. At Mont Saint-Hilaire, cation exchange and ion substitution occur within microporous zirconosilicate frameworks; however, in the absence of significant deformation, these processes appear more diffusional and less spatially localized [44].
Taken together, these observations demonstrate that while mineral competition governs the initial REE distribution during crystallization, structurally controlled fluid pathways play a key role in post-magmatic redistribution. Further comparative studies on other agpaitic systems are required to evaluate the broader applicability of this mechanism.

6. Conclusions

Our results show that elpidite and two chemically distinct (Na,K)-zirconosilicates record a three-stage evolution of the Papanduva Pluton, from Na-rich magmatic crystallization, through deformation-driven fluid interaction, to late-stage K-rich ion-exchange. This sequence explains the contrast between zircon-bearing massive facies and zirconosilicate-dominated foliated facies and clarifies why REE enrichment is spatially associated with deformation zones rather than being controlled by magmatic crystallization sequences. The strong negative correlation between deformation intensity and REE content (r = –0.923 for vein-like aggregates vs. r = –0.150 for euhedral crystals) provides quantitative evidence for the structural control of element redistribution. Furthermore, in contrast to other elpidite-bearing systems, Papanduva exhibits K-dominated, rather than Ca-dominated, alteration pathways.
These findings demonstrate that submagmatic deformation can exert a significant influence on HFSE and REE mobility in peralkaline granitic systems, refining current models of miaskitic-to-agpaitic transitions. They also highlight zirconosilicates as sensitive tracers of late-stage structural and geochemical processes in alkaline granite evolution.

Supplementary Materials

The following supporting information can be downloaded at: https://www.mdpi.com/article/10.3390/min15070667/s1. Supplementary Material S1—Complete EPMA dataset; Supplementary Material S2—Complete LA-ICP-MS dataset; Supplementary Material S3—Cathodoluminescence element mapping for a (Na,K)Zr-Si-II crystal from sample MR-38.

Author Contributions

Conceptualization, F.C.J.V., S.R.F.V. and L.P.G.; methodology, F.C.J.V., S.R.F.V. and L.P.G.; software, L.P.G. and F.C.J.V.; validation, L.P.G., F.C.J.V. and S.R.F.V.; formal analysis, L.P.G., F.C.J.V., S.R.F.V. and A.L.S.d.O.; investigation, L.P.G., A.L.S.d.O. and F.C.J.V.; resources, S.R.F.V. and F.C.J.V.; data curation, F.C.J.V., S.R.F.V. and L.P.G.; writing—original draft preparation, L.P.G. and F.C.J.V.; writing—review and editing, L.P.G., F.C.J.V., S.R.F.V., and A.L.S.d.O.; visualization, L.P.G. and F.C.J.V.; supervision, F.C.J.V. and S.R.F.V.; project administration, S.R.F.V.; funding acquisition, S.R.F.V. All authors have read and agreed to the published version of the manuscript.

Funding

This research was funded by the São Paulo Research Foundation (FAPESP) under grant numbers 08-00562-0 and 19-117343-4.

Data Availability Statement

The original contributions presented in this study are included in the article/Supplementary Material. Further inquiries can be directed to the corresponding author.

Acknowledgments

The authors thank the Graduate Program in Geodynamics and Geophysics, Federal University of Rio Grande do Norte (PPGG/UFRN) for academic, logistical, and financial support. L.P.G. acknowledges the Brazilian National Council for Scientific and Technological Development (CNPq) for a master’s scholarship (process 130482/2023-4). A.L.S.d.O. acknowledges the São Paulo Research Foundation (FAPESP) for a doctoral scholarship (process 2023/17675-2). We are grateful to the technical staff of the GeoAnalítica-USP Core Facility for their assistance with the analytical procedures. We also thank the three anonymous reviewers for their valuable comments and suggestions that improved this work and Hana Huang for her careful editorial handling.

Conflicts of Interest

The authors declare no conflicts of interest.

References

  1. Linthout, K. Alkali-Zirconosilicates in Peralkaline Rocks. Contrib. Mineral. Petrol. 1984, 86, 155–158. [Google Scholar] [CrossRef]
  2. Marks, M.A.W.; Hettmann, K.; Schilling, J.; Frost, B.R.; Markl, G. The Mineralogical Diversity of Alkaline Igneous Rocks: Critical Factors for the Transition from Miaskitic to Agpaitic Phase Assemblages. J. Petrol. 2011, 52, 439–455. [Google Scholar] [CrossRef]
  3. Andersen, T.; Erambert, M.; Larsen, A.O.; Selbekk, R.S. Petrology of Nepheline Syenite Pegmatites in the Oslo Rift, Norway: Zirconium Silicate Mineral Assemblages as Indicators of Alkalinity and Volatile Fugacity in Mildly Agpaitic Magma. J. Petrol. 2010, 51, 2303–2325. [Google Scholar] [CrossRef]
  4. Gysi, A.P.; Williams-Jones, A.E.; Collins, P. Lithogeochemical Vectors for Hydrothermal Processes in the Strange Lake Peralkaline Granitic REE-Zr-Nb Deposit. Econ. Geol. 2016, 111, 1241–1276. [Google Scholar] [CrossRef]
  5. Salvi, S.; Williams-jones, A.E. Zirconosilicate Phase Relations in the Strange Lake (Lac Brisson) Pluton, Quebec-Labrador, Canada. Am. Mineral. 1995, 80, 1031–1040. [Google Scholar] [CrossRef]
  6. Marks, M.A.W.; Markl, G. A Global Review on Agpaitic Rocks. Earth-Sci. Rev. 2017, 173, 229–258. [Google Scholar] [CrossRef]
  7. Aja, S.U.; Wood, S.A.; Williams-Jones, A.E. The Solubility of Some Alkali-Bearing Zr Minerals in Hydrothermal Solutions. MRS Proc. 1996, 432, 69. [Google Scholar] [CrossRef]
  8. Roelofsen, J.N.; Veblen, D.R. Relationships among Zirconosilicates: Examination by Cathodoluminescence and Transmission Electron Microscopy. Mineral. Petrol. 1999, 67, 71–84. [Google Scholar] [CrossRef]
  9. Cegiełka, M.; Bagiński, B.; Macdonald, R.; Belkin, H.E.; Kotowski, J.; Upton, B.G.J. Zirconium Silicates in a Peralkaline Granite: A Record of the Interplay of Magmatic and Hydrothermal Processes (Ilímaussaq complex, Greenland). Acta Geol. Pol. 2022, 72, 235–245. [Google Scholar] [CrossRef]
  10. Kynicky, J.; Chakhmouradian, A.R.; Xu, C.; Krmicek, L.; Galiova, M. Distribution and Evolution of Zirconium Mineralization in Peralkaline Granites and Associated Pegmatites of the Khan Bogd Complex, Southern Mongolia. Can. Mineral. 2011, 49, 947–965. [Google Scholar] [CrossRef]
  11. Paterson, S.R.; Vernon, R.H.; Tobisch, O.T. A Review of Criteria for the Identification of Magmatic and Tectonic Foliations in Granitoids. J. Struct. Geol. 1989, 1, 349–363. [Google Scholar] [CrossRef]
  12. Bouchez, J.L.; Delas, C.; Gleizes, G.; Nédélec, A.; Cuney, M. Submagmatic Microfractures in Granites. Geology 1992, 20, 35. [Google Scholar] [CrossRef]
  13. Blenkinsop, T.G. Deformation Microstructures and Mechanisms in Minerals and Rocks; Kluwer Academic Publishers: Dordrecht, The Netherlands, 2000; ISBN 978-0-412-73480-9. [Google Scholar]
  14. Cannillo, E.; Rossi, G.; Ungaretti, L. The Crystal Structure of Elpidite. Am. Mineral. 1973, 58, 106–109. [Google Scholar]
  15. Day, M.C.; Hawthorne, F.C. A Structure Hierarchy for Silicate Minerals: Chain, Ribbon, and Tube Silicates. Mineral. Mag. 2020, 84, 165–244. [Google Scholar] [CrossRef]
  16. Zubkova, N.V.; Nikolova, R.P.; Chukanov, N.V.; Kostov-Kytin, V.V.; Pekov, I.V.; Varlamov, D.A.; Larikova, T.S.; Kazheva, O.N.; Chervonnaya, N.A.; Shilov, G.V.; et al. Crystal Chemistry and Properties of Elpidite and Its Ag-Exchanged Forms. Minerals 2019, 9, 420. [Google Scholar] [CrossRef]
  17. Bogdanov, A.; Kaneva, E.; Shendrik, R. New Insights into the Crystal Chemistry of Elpidite, Na2Zr[Si6O15]·3H2O and (Na1+YCax1−X−Y)Σ=2Zr[Si6O15]·(3−X)H2O, and Ab Initio Modeling of IR Spectra. Materials 2021, 14, 2160. [Google Scholar] [CrossRef]
  18. Bernard, C. Concentration and Fractionation of Rare Earth Elements in Alkaline Complexes: The Role of Fluids. Ph.D. Thesis, Université Paul Sabatier—Toulouse III, Toulouse, France, 2020. [Google Scholar]
  19. Bonin, B. Peralkaline Granites in Corsica: Some Petrological and Geochemical Constraints. Rendiconti Della Soc. Ital. Mineral. E Petrol. 1988, 43, 281–306. [Google Scholar]
  20. Elliott, J.E. Peralkaline and Peraluminous Granites and Related Mineral Deposits of the Arabian Shield, Kingdom of Saudi Arabia; USGS: Reston, VA, USA, 1983; p. 37. [Google Scholar]
  21. Zubkova, N.V.; Pekov, I.V.; Chukanov, N.V.; Yapaskurt, V.O.; Turchkova, A.G.; Larikova, T.S.; Pushcharovsky, D.Y. A Highly Hydrated Variety of Elpidite from the Khibiny Alkaline Complex, Kola Peninsula, Russia. Mineral. Mag. 2021, 85, 627–633. [Google Scholar] [CrossRef]
  22. Mondal, S.; Upadhyay, D.; Banerjee, A. REE Mineralization in Siwana Peralkaline Granite, Western India-Role of Fractional Crystallization, Hydrothermal Remobilization, and Feldspar-Fluid Interaction. Lithos 2021, 396–397, 106240. [Google Scholar] [CrossRef]
  23. Buch, T. Caracterização mineralógica e geoquímica de ocorrências de elementos terras raras no maciço granítico Ouro Fino, Rondônia, Brasil. Master’s Thesis, Universidade de Brasília, Brasília, Brazil, 2018. [Google Scholar]
  24. Vilalva, F.C.J.; Vlach, S.R.F.; Simonetti, A. Nacareniobsite-(Ce) and britholite-(Ce) in Peralkaline Granites from the Morro Redondo Complex, Graciosa Province, Southern Brazil: Occurrence and Compositional data. Can. Mineral. 2013, 51, 313–332. [Google Scholar] [CrossRef]
  25. Vilalva, F.C.J.; Vlach, S.R.F. Geology, Petrography and Geochemistry of the A-Type Granites from the Morro Redondo Complex (PR-SC), Southern Brazil, Graciosa Province. An. Acad. Bras. Ciênc. 2014, 86, 85–116. [Google Scholar] [CrossRef]
  26. Vilalva, F.C.J. Petrografia e Mineralogia de Granitos Peralcalinos: O Plúton Papanduva, Complexo Morro Redondo (PR/SC). Master’s Thesis, Universidade de São Paulo, São Paulo, Brazil, 2007. [Google Scholar] [CrossRef]
  27. Oliveira, A.L.S.D. Elpidita, um Álcali-Zirconossilicato do Plúton Papanduva (PR-SC): Aspectos Texturais, Quimismo e Implicações Petrológicas. Bachelor’s Thesis, Universidade Federal do Rio Grande do Norte, Natal, Brazil, 2019. [Google Scholar]
  28. Grangeiro, L.P. Texturas e Química Mineral de Zirconosilicatos em Granitos Peralcalinos do Pluton Papanduva, PR-SC. Ph.D. Thesis, Universidade Federal do Rio Grande do Norte, Natal, Brazil, 2024. [Google Scholar]
  29. Vlach, S.R.F.; Vilalva, F.C.J. Narsarsukite in Peralkaline Granites from the Papanduva Pluton, Graciosa Province, South Brazil: Insights from Textural and Compositional Features. Mineral. Mag. 2023, 87, 896–907. [Google Scholar] [CrossRef]
  30. Gualda, G.A.R.; Vlach, S.R.F. The Serra da Graciosa A-Type Granites and Syenites, Southern Brazil. Part 1: Regional Setting and Geological Characterization. An. Acad. Bras. Ciênc. 2007, 79, 405–430. [Google Scholar] [CrossRef]
  31. Vlach, S.R.F.; Siga, O.; Harara, O.M.M.; Gualda, G.A.R.; Basei, M.A.S.; Vilalva, F.C.J. Crystallization Ages of the A-Type Magmatism of the Graciosa Province (Southern Brazil): Constraints from Zircon U-Pb (ID-TIMS) Dating of Coeval K-rich Gabbro-dioritic Rocks. J. S. Am. Earth Sci. 2011, 32, 407–415. [Google Scholar] [CrossRef]
  32. Hueck, M.; Oriolo, S.; Basei, M.A.S.; Oyhantçabal, P.; Heller, B.M.; Wemmer, K.; Siegesmund, S. Archean to Early Neoproterozoic Crustal Growth of the Southern South American Platform and its Wide-Reaching “African” Origins. Precambrian Res. 2022, 369, 106532. [Google Scholar] [CrossRef]
  33. Heller, B.M.; Hueck, M.; Passarelli, C.R.; Basei, M.A.S. Zircon U-Pb Geochronology and Hf Isotopes of the Luís Alves Terrane: Archean to Paleoproterozoic Evolution and Neoproterozoic Overprint. J. S. Am. Earth Sci. 2021, 106, 103008. [Google Scholar] [CrossRef]
  34. Basei, M.A.S.; Nutman, A.; Siga, O.; Passarelli, C.R.; Drukas, C.O. Chapter 7.2 The Evolution and Tectonic Setting of the Luis Alves Microplate of Southeastern Brazil: An Exotic Terrane during the Assembly of Western Gondwana. In Developments in Precambrian Geology; Elsevier: Amsterdam, The Netherlands, 2009; Volume 16, pp. 273–291, ISBN 978-0-444-53249-7. [Google Scholar]
  35. Basei, M.A.S.; Neves, B.B.B.; Siga, O.; Babinski, M.; Pimentel, M.M.; Gaeta Tassinari, C.C.; Hollanda, M.H.B.; Nutman, A.; Cordani, U.G. Contribution of SHRIMP U–Pb Zircon Geochronology to Unravelling the Evolution of Brazilian Neoproterozoic Fold Belts. Precambrian Res. 2010, 183, 112–144. [Google Scholar] [CrossRef]
  36. Vilalva, F.C.J.; Simonetti, A.; Vlach, S.R.F. Insights on the origin of the Graciosa A-Type Granites and Syenites (Southern Brazil) from Zircon U-Pb Geochronology, Chemistry, and Hf and O Isotope Compositions. Lithos 2019, 340–341, 20–33. [Google Scholar] [CrossRef]
  37. Vilalva, F.C.J.; Vlach, S.R.F.; Simonetti, A. Chemical and O-Isotope Compositions of Amphiboles and Clinopyroxenes from A-Type Granites of the Papanduva Pluton, South Brazil: Insights into Late- to Post-Magmatic Evolution of Peralkaline Systems. Chem. Geol. 2016, 420, 186–199. [Google Scholar] [CrossRef]
  38. Siachoque, A.; Santos, C.A.; Vlach, S.R.F. Amphiboles and Phyllosilicates in the A-Type Mandira Granite Massif, Graciosa Province, SE Brazil: Textures, Composition and Crystallisation Conditions. Mineral. Mag. 2021, 85, 784–807. [Google Scholar] [CrossRef]
  39. Vilalva, F.C.J.; Vlach, S.R.F. Major- and Trace-Element Composition of REE -Rich Turkestanite from Peralkaline Granites of the Morro Redondo Complex, Graciosa Province, South Brazil. Mineral. Mag. 2010, 74, 645–658. [Google Scholar] [CrossRef]
  40. Vilalva, F.C.J.; Vlach, S.R.F.; Peternell, M. Estimativa de temperatura de deformação em granitos peralcalinos do complexo Morro Redondo, província Graciosa, PR-SC por meio de análise quantitativa digital de texturas. In Anais do 46° Congresso Brasileiro de Geologia; SBG: Santos, Brazil, 2012. [Google Scholar]
  41. Vernon, R.H. Review of Microstructural Evidence of Magmatic and Solid-State Flow. Vis. Geosci. 2000, 5, 1–23. [Google Scholar] [CrossRef]
  42. Fazio, E.; Fiannacca, P.; Russo, D.; Cirrincione, R. Submagmatic to Solid-State Deformation Microstructures Recorded in Cooling Granitoids during Exhumation of Late-Variscan Crust in North-Eastern Sicily. Geosciences 2020, 10, 311. [Google Scholar] [CrossRef]
  43. Zubkova, N.V.; Ksenofontov, D.A.; Chukanov, N.V.; Pekov, I.V.; Artamonova, A.A.; Koshlyakova, N.N.; Bychkov, A.Y.; Pushcharovsky, D.Y. Crystal Chemistry of the Microporous Zirconosilicate Na6Zr3[Si9O27], a Product of High-Temperature Transformation of Catapleiite, and Its Ag-Exchanged Form. Minerals 2020, 10, 243. [Google Scholar] [CrossRef]
  44. Gore, T.E.; McDonald, A.M. Melansonite, (Na,□)□2KZrSi8O19·5H2O, a New Member of the Rhodesite Group, from Mont Saint-Hilaire, Québec, Canada: Characterization, Crystal-Structure Determination, and Origin. Can. J. Mineral. Petrol. 2023, 61, 387–400. [Google Scholar] [CrossRef]
  45. Andrade, S. Análises por LA-ICPMS em Zircões de Rochas Graníticas da Faixa Ribeira no Estado de São Paulo—SE do Brasil: Implicações Genéticas e Geocronológicas. Ph.D. Thesis, Universidade de São Paulo, São Paulo, Brazil, 2016. [Google Scholar] [CrossRef]
  46. Griffin, W.; Powell, W.; Pearson, N.J.; O’Reilly, S. GLITTER: Data reduction software for laser ablation ICP-MS. In Laser Ablation ICP-MS in the Earth Sciences: Current Practices and Outstanding Issue; Sylvester, P.J., Ed.; Mineralogical Association of Canada Short Cours; Mineralogical Association of Canada: Vancouver, BC, Canada, 2008; pp. 308–311. [Google Scholar]
  47. Birkett, T.C.; Miller, R.R.; Roberts, A.C.; Mariano, A.N. Zirconium-Bearing Minerals of the Strange Lake Intrusive Complex, Quebec-Labrador. Can. Mineral. 1992, 30, 191–205. [Google Scholar]
  48. Cametti, G.; Armbruster, T.; Nagashima, M. Dehydration and Thermal Stability of Elpidite: An in-Situ Single Crystal X-ray Diffraction Study. Microporous Mesoporous Mater. 2016, 227, 81–87. [Google Scholar] [CrossRef]
  49. Mesto, E.; Kaneva, E.; Schingaro, E.; Vladykin, N.; Lacalamita, M.; Scordari, F. Armstrongite from Khan Bogdo (Mongolia): Crystal Structure Determination and Implications for Zeolite-Like Cation Exchange Properties. Am. Mineral. 2014, 99, 2424–2432. [Google Scholar] [CrossRef]
  50. Vladykin, N.V.; Kovalenko, V.I.; Kashaev, A.A.; Sapozhnikov, A.N.; Pisarskaya, V.A. A New Silicate of Calcium and Zirconium—Armstrongite. Dokl. Akad. Nauk SSSR 1973, 209, 1185–1188. [Google Scholar]
  51. Vladykin, N.; Kovalenko, V.I. Zirconium Silicates. Armstrongite. In Minerals of Mongolia; Novgorodova, M.I., Ed.; Fersman Mineralogical Museum of the Russian Academy of Sciences: Moscow, Russia, 2006; pp. 250–256. [Google Scholar]
  52. Jambor, J.L.; Roberts, A.C.; Grice, J.D. Armstrongite from the Strange Lake Alkalic Complex, on the Quebec—Labrador Boundary, Canada. Powder Diffr. 1987, 2, 2–4. [Google Scholar] [CrossRef]
  53. Lykova, I.; Rowe, R.; Poirier, G.; Friis, H.; Barnes, S. Natromelansonite, Na3 Zr[Si7 AlO19 ]⋅4–5H2 O, a New Member of the Rhodesite Mero-Plesiotype Series from Mont Saint-Hilaire, Quebec, Canada. Mineral. Mag. 2024, 88, 195–202. [Google Scholar] [CrossRef]
  54. McDonald, A.M.; Chao, G.Y. Natrolemoynite, a New Hydrated Sodium Zirconosilicate from MONT Saint-Hilaire, Quebec: Description and Structure Determination. Can. Mineral. 2001, 39, 1295–1306. [Google Scholar] [CrossRef]
  55. McDonough, W.F.; Sun, S.-s. The Composition of the Earth. Chem. Geol. 1995, 120, 223–253. [Google Scholar] [CrossRef]
  56. Marr, R.A.; Baker, D.R.; Williams-Jones, A.E. Alkali Zirconosilicate Speciation in Halogen-Rich, Felsic, Peralkaline Magmas. Mineral. Mag. 1994, 58A, 559–560. [Google Scholar] [CrossRef]
  57. Ferreira, P.; Ferreira, A.; Rocha, J.; Soares, M.R. Synthesis and Structural Characterization of Zirconium Silicates. Chem. Mater. 2001, 13, 355–363. [Google Scholar] [CrossRef]
  58. Jale, S.R.; Ojo, A.; Fitch, F.R. Synthesis of Microporous Zirconosilicates Containing ZrO6 Octahedra and SiO4 Tetrahedra. Chem. Commun. 1999, 411–412. [Google Scholar] [CrossRef]
  59. Delbove, F. Étude expérimentale de la distribution des alcalins K, Rb, Cs et des alcalino-terreux Ca, Sr, Ba, entre albite cristallisée et fondue et solution saline hydrothermale. Bull. Minéralogie 1978, 101, 317–333. [Google Scholar] [CrossRef]
  60. Grigor’eva, A.A.; Zubkova, N.V.; Pekov, I.V.; Kolitsch, U.; Pushcharovsky, D.Y.; Vigasina, M.F.; Giester, G.; Dordević, T.; Tillmanns, E.; Chukanov, N.V. Crystal Chemistry of Elpidite from Khan Bogdo (Mongolia) and Its K- and Rb-Exchanged Forms. Crystallogr. Rep. 2011, 56, 832–841. [Google Scholar] [CrossRef]
  61. Charoy, B.; Raimbault, L. Zr-, Th-, and REE-Rich Biotite Differentiates in the A-type Granite Pluton of Suzhou (Eastern China): The Key Role of Fluorine. J. Petrol. 1994, 35, 919–962. [Google Scholar] [CrossRef]
  62. Abdel-Rahman, A.-F.M.; El-Kibbi, M.M. Anorogenic Magmatism: Chemical Evolution of the Mount El-Sibai A-Type Complex (Egypt), and Implications for the Origin of Within-Plate Felsic Magmas. Geol. Mag. 2001, 138, 67–85. [Google Scholar] [CrossRef]
  63. Vlach, S.R.F.; Gualda, G.A.R. Allanite and Chevkinite in A-Type Granites and Syenites of the Graciosa Province, Southern Brazil. Lithos 2007, 97, 98–121. [Google Scholar] [CrossRef]
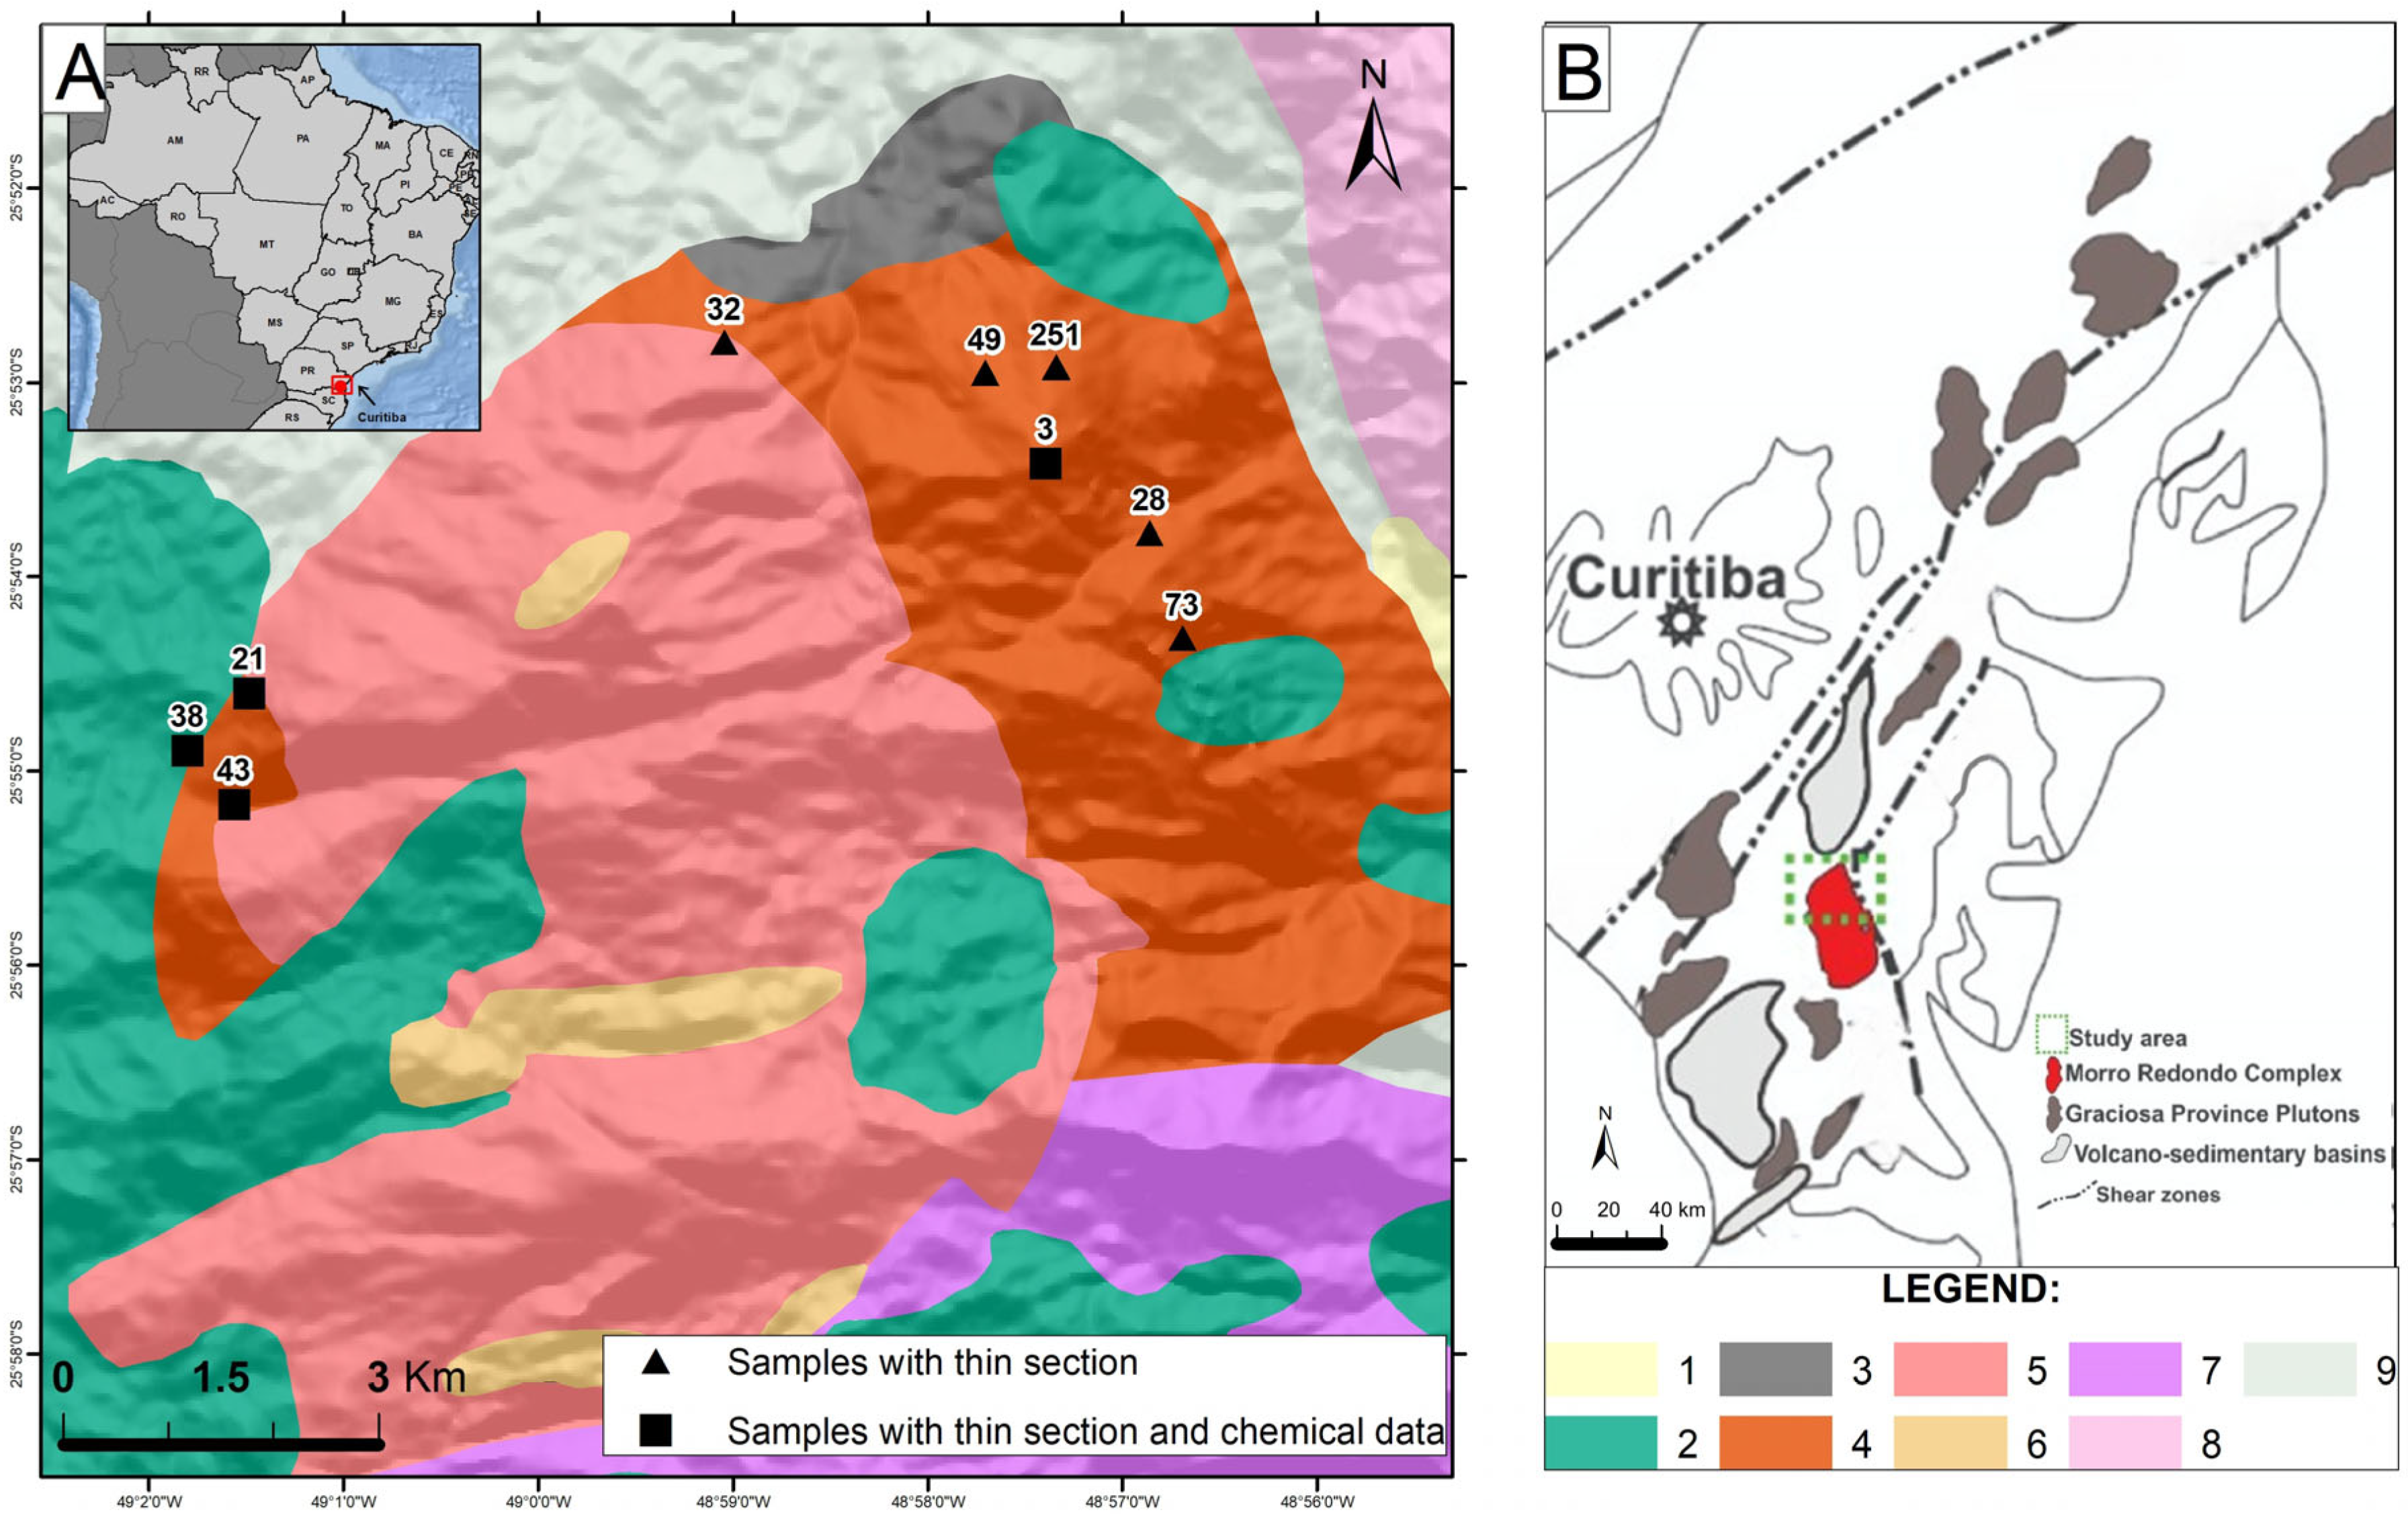
Figure 1. Geological setting of the study area. (A) Geological map of the Papanduva Pluton and the surrounding units. Triangles indicate samples analyzed in thin sections; squares represent samples with both thin sections and mineral chemical data. (B) Regional location of the Morro Redondo Complex in Graciosa Province, southern Brazil. The green rectangle outlines the Papanduva Pluton. Adapted from [25]. Geological units: 1—alluvial–colluvial deposits; 2—contemporaneous bimodal volcanic rocks; 3—Papanduva Deformed Facies; 4—Panpanduva Foliated Facies; 5—Papanduva Massive Facies; 6—Papanduva Microgranitic Facies; 7—Quiriri Pluton (metaluminous to peraluminous biotite granites); 8—Neoproterozoic granites (Canavieiras–Estrela Suite) of the Paranaguá Terrain; 9—Archean to Paleoproterozoic granulites and migmatitic gneisses of the Luis Alves Terrain.
Minerals 15 00667 g001
Figure 2. Macroscopic features of the foliated facies of the Papanduva Pluton. (A,B) Protomylonitic textures in samples MR-03 and MR-21, respectively, characterized by arfvedsonite porphyroclasts and vein-like aggregates of elpidite within a fine-grained quartz–feldspathic matrix containing accessory narsarsukite. (C) Deformed sample MR-28 exhibits a porphyroclastic texture with arfvedsonite and alkali feldspar porphyroclasts, interstitial crystals, and aggregates of elpidite and narsarsukite. Yellow- to orange-colored minerals in (A,C) are narsarsukite. Mineral abbreviations: Epd—elpidite; Qz—quartz; Afs—alkali feldspar; Arf—arfvedsonite; Nrs—narsarsukite. Yellow scale bars equal to 1.0 cm.
Minerals 15 00667 g002
Figure 5. Principal component analysis of zirconosilicate minerals in the Papanduva Pluton (PC1: 65.20% variance and PC2: 34.80% variance). Three distinct clusters are identified: Elpidite (Epd) group (types-I, II and III), (Na,K)Zr-Si-I, and (Na,K)Zr-Si-II. Loading vectors show PC1 correlates with Na2O (0.6839) and ZrO2 (0.4785), while PC2 correlates with K2O (0.5733) and ZrO2 (0.4893). Stars represent end-member compositions.
Minerals 15 00667 g005
Figure 6. (Na + K)/Zr versus Si/Zr compositional variation diagram for elpidite (Epd) and (Na,K)-zirconosilicates (Zr-Si) from the foliated facies of the Papanduva Pluton. For comparison, compositions of elpidite and armstrongite (Asg) from many localities (e.g., Strange Lake, Ilímaussaq, Evisa, Khan Bogd, and Lovozero complexes), along with natrolemoynite (Nlm), melansonite (Mso), and natromelansonite (Nms) from Mont Saint-Hilaire are plotted. Elpidite and armstrongite data sources: [4,5,8,9,10,18,19,47,48,49,50,51,52]. Melansonite and natromelansonite data sources: [44,53]. Natrolemoynite data source: [54].
Minerals 15 00667 g006
Figure 7. Na–10×K–Zr ternary cationic diagram for elpidite (Epd) and (Na,K)-zirconosilicates from the foliated facies of the Papanduva Pluton. For comparison, the published compositions of elpidite and armstrongite from various localities, as well as those of natrolemoynite, melansonite, and natromelansonite, are included. The end-member compositions of elpidite, armstrongite, dalyite, and melansonite are also plotted. The localities and data sources are the same as those in Figure 6. Mineral abbreviations: Epd—elpidite; Zr-Si—(Na,K)-zirconosilicates; Asg—armstrongite; Nlm—natrolemoynite; Mso—melansonite; Nms—natromelansonite; Dly—dalyite.
Minerals 15 00667 g007
Figure 8. Chondrite-normalized rare earth element (REE) patterns and trace element (TE) multielement diagrams for elpidite variants from the foliated facies of the Papanduva Pluton. (A,B) Type-I elpidite; (C,D) Type-II elpidite; (E,F) Type-III elpidite. The left panels (A,C,E) show REE patterns, while the right panels (B,D,F) show extended TE multi-element diagrams. For comparison, the trace element pattern of zircon from the massive facies is plotted as a thick gray line in each panel (data from [36]). Chondrite normalization values from [55]. Symbols as in Figure 5.
Minerals 15 00667 g008
Figure 9. Zr + 2Na versus Ca + K + ΣREE binary diagram illustrating the proposed substitution mechanism Zr4+ + 2Na+ ↔ Ca2+ + K+ + REE3+ for elpidite types from the Papanduva Pluton. The negative correlation demonstrates systematic element exchange, with the correlation strength varying according to the deformation intensity. Symbols as in Figure 5.
Minerals 15 00667 g009
Figure 12. Chondrite-normalized REE patterns for elpidite types from the Papanduva Pluton compared with those of elpidite from the Khan Bogd Complex (Mongolia). The median values for Type-I, Type-II, and Type-III elpidite are shown. The shaded field represents the compositional range of elpidite from the Khan Bogd Complex (data from [10]). Chondrite normalization values from [55].
Minerals 15 00667 g012
Disclaimer/Publisher’s Note: The statements, opinions and data contained in all publications are solely those of the individual author(s) and contributor(s) and not of MDPI and/or the editor(s). MDPI and/or the editor(s) disclaim responsibility for any injury to people or property resulting from any ideas, methods, instructions or products referred to in the content.