

Ore Genesis of the Huanggang Iron-Tin-Polymetallic Deposit, Inner Mongolia: Constraints from Fluid Inclusions, H–O–C Isotopes, and U-Pb Dating of Garnet and Zircon

Abstract
1. Introduction
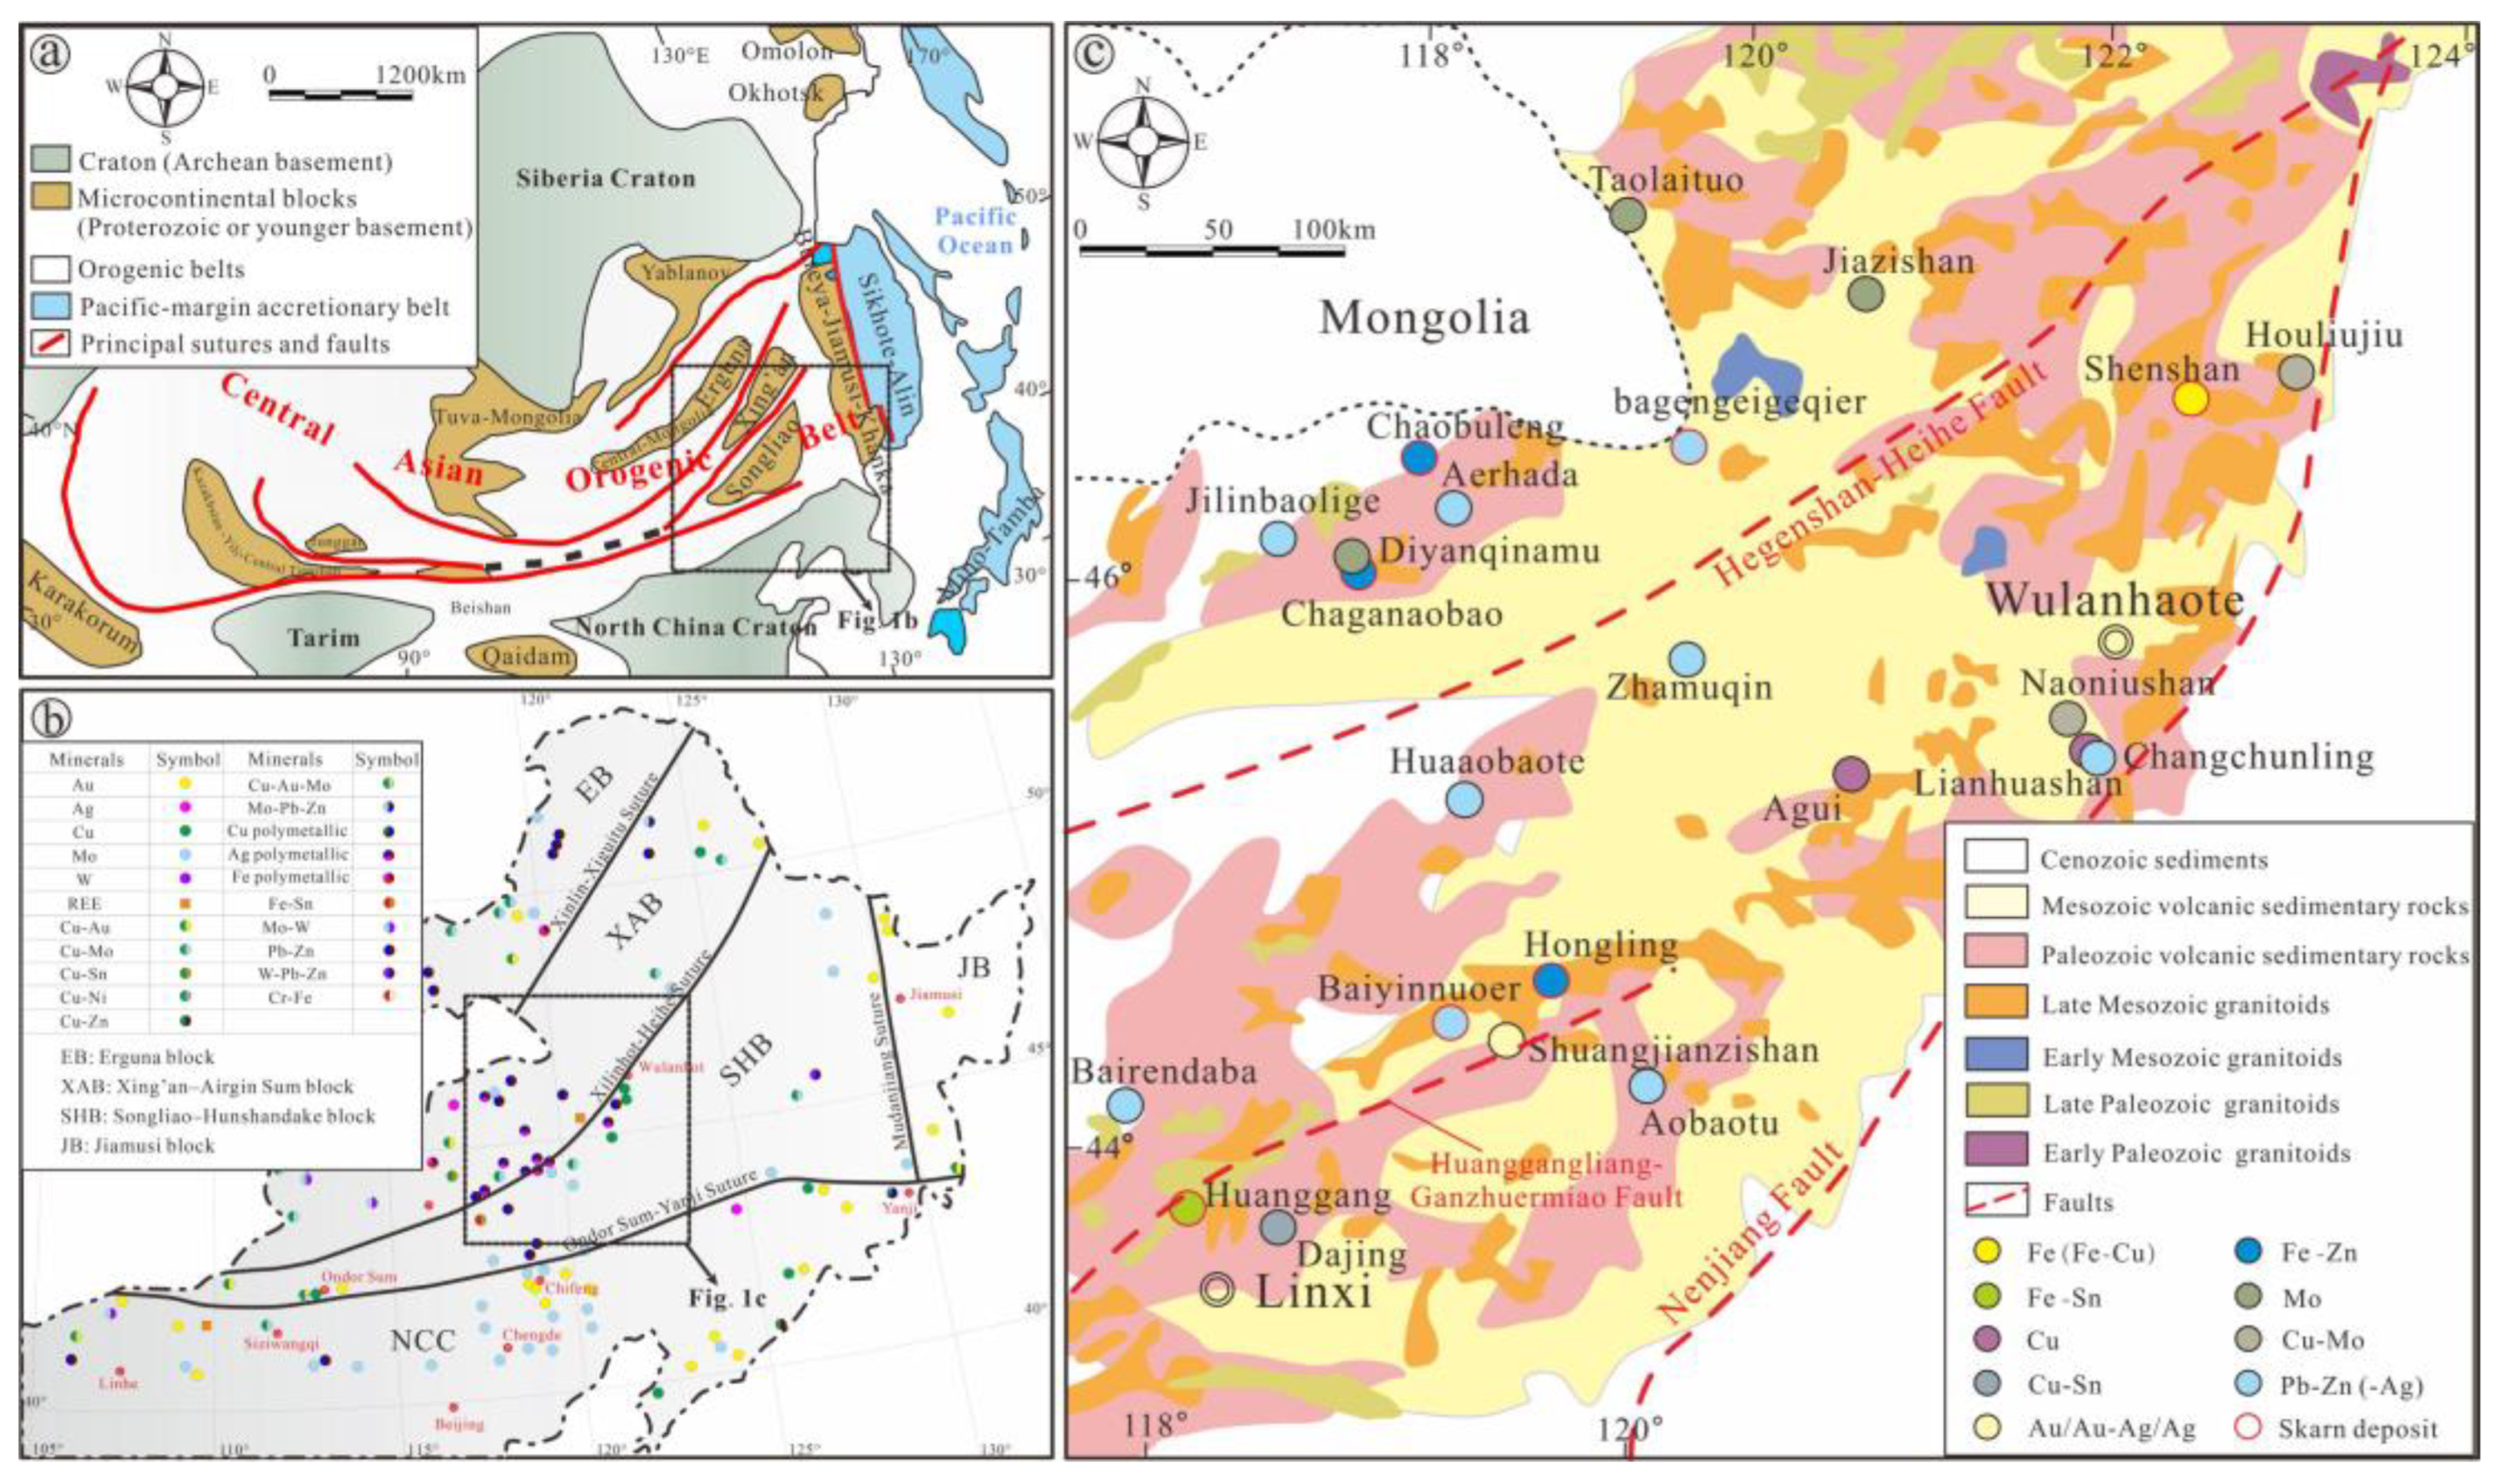
2. Regional Geological Characteristics
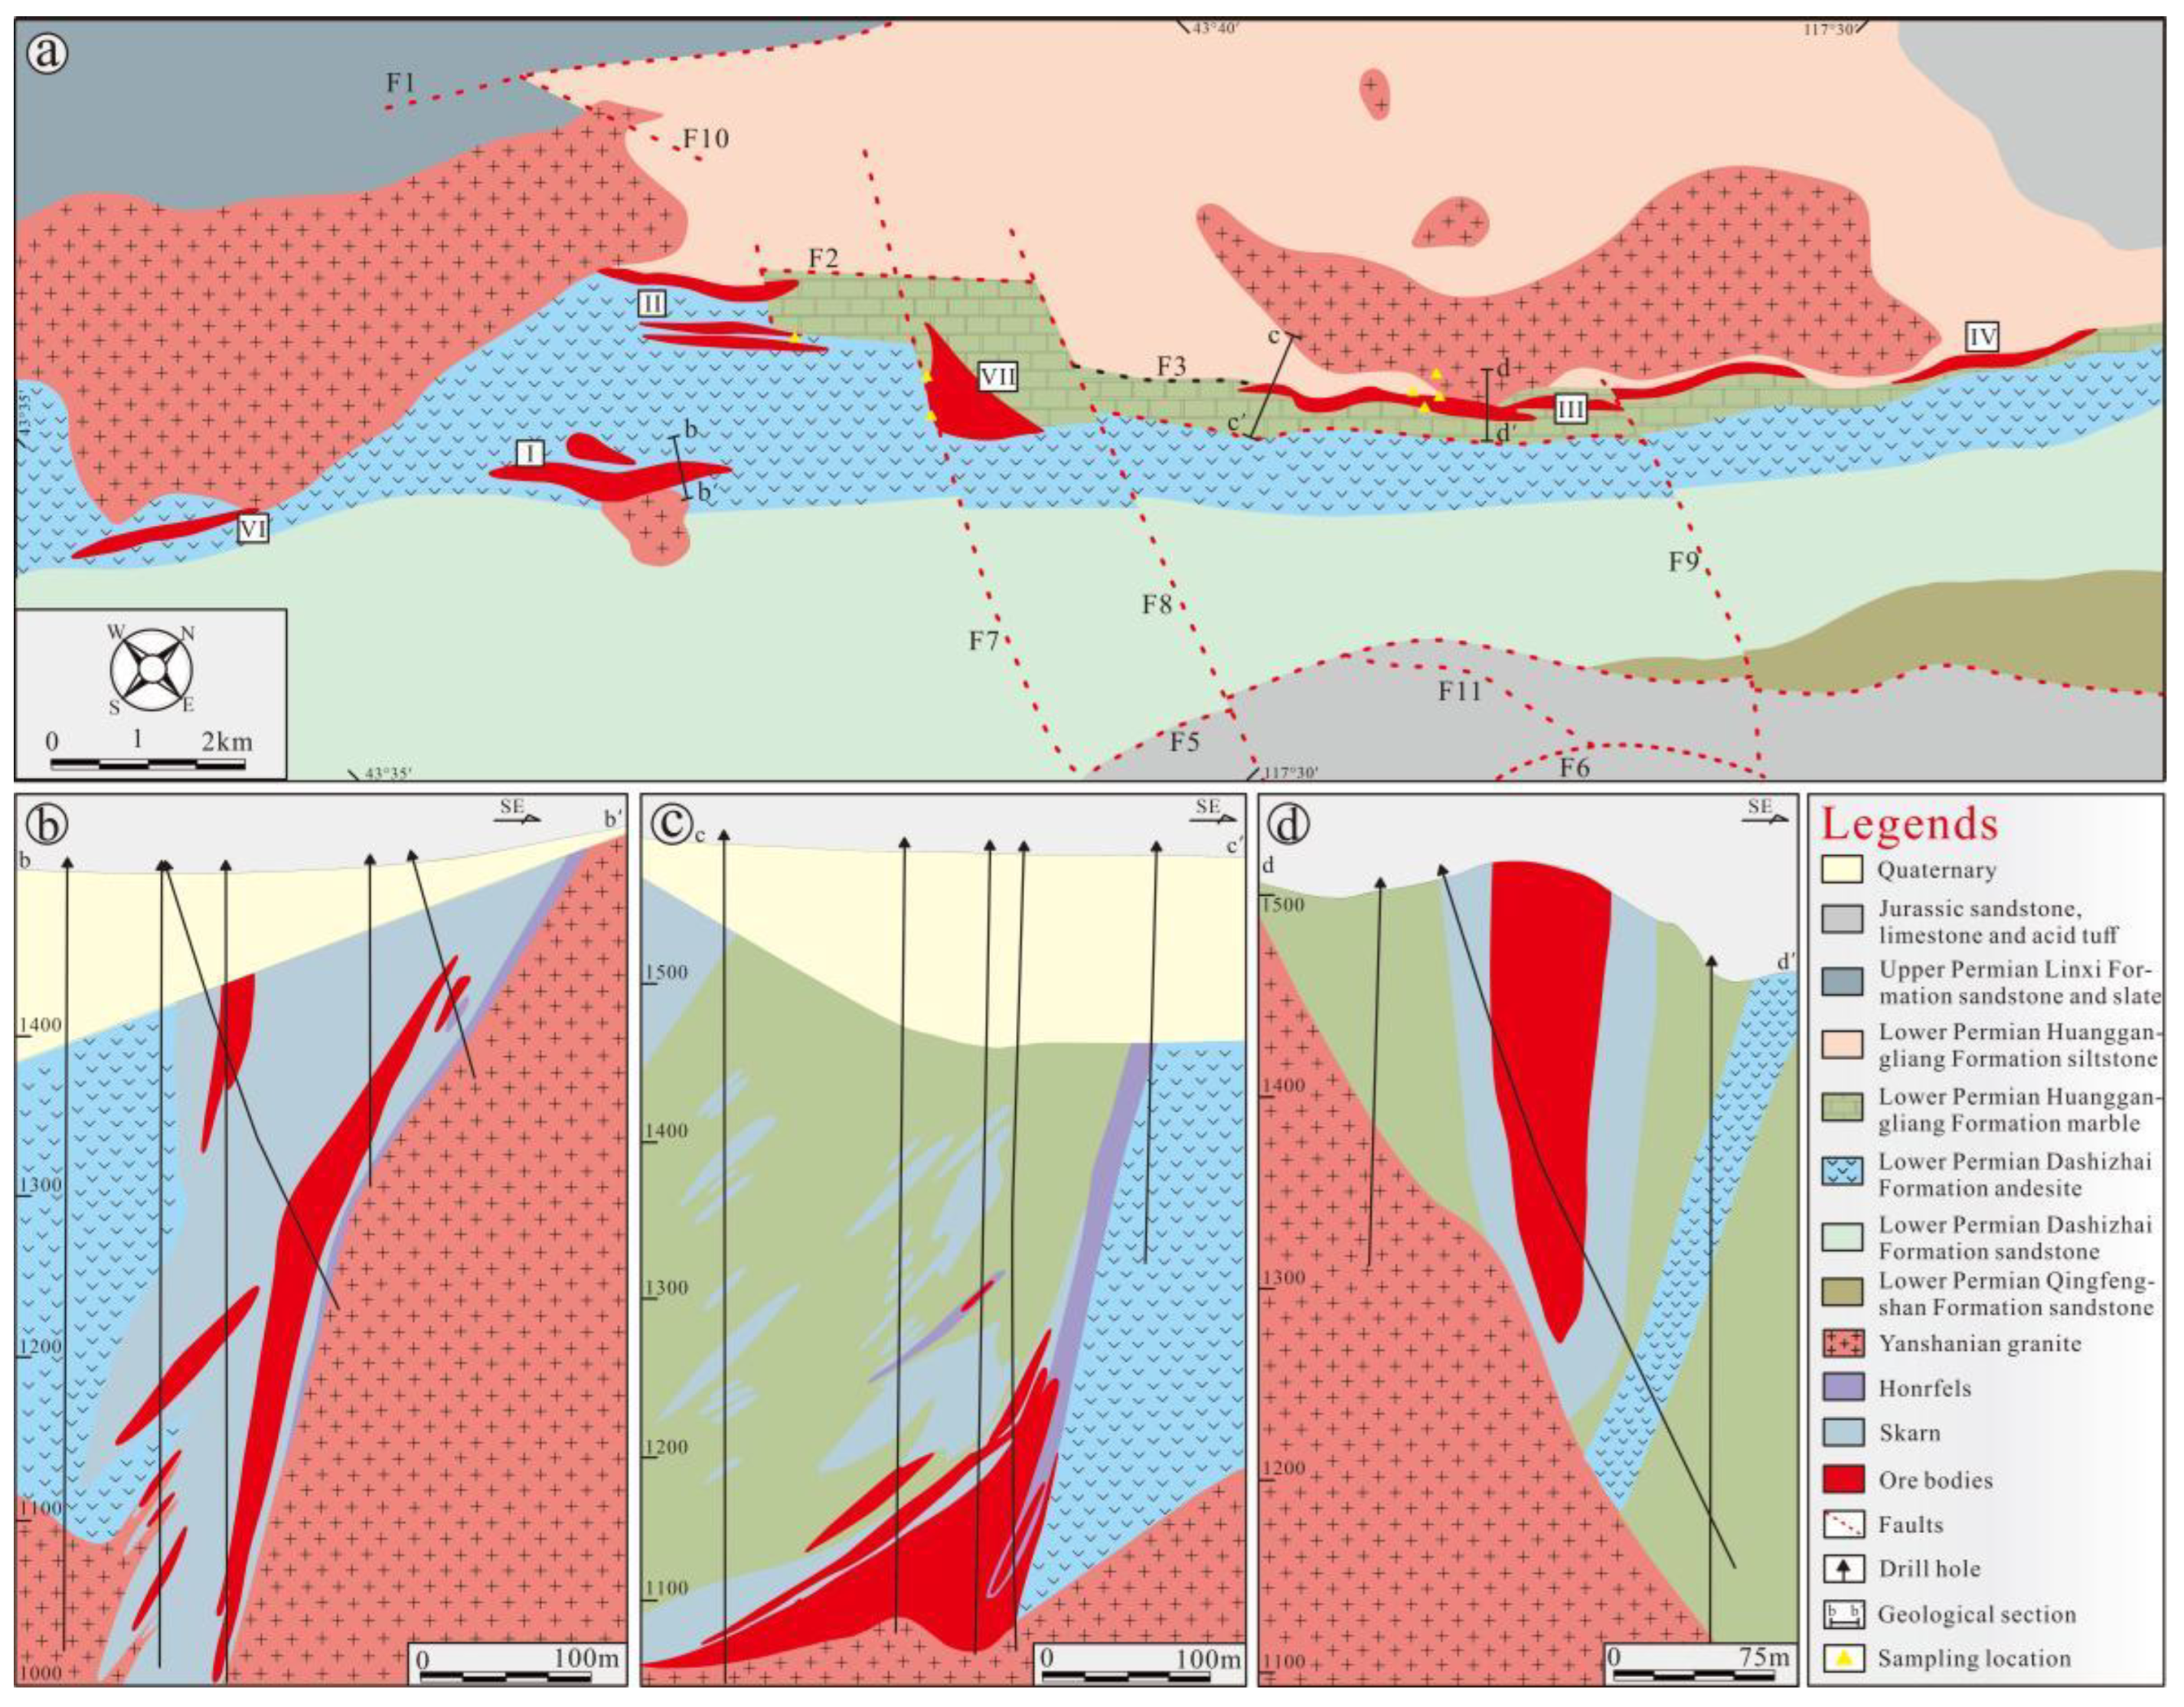
3. Ore Deposit Geological Characteristics
4. Samples and Methods
4.1. FI Analysis
4.2. Isotope Analysis
4.3. Garnet and Zircon LA–ICP–MS U-Pb Dating
5. Results
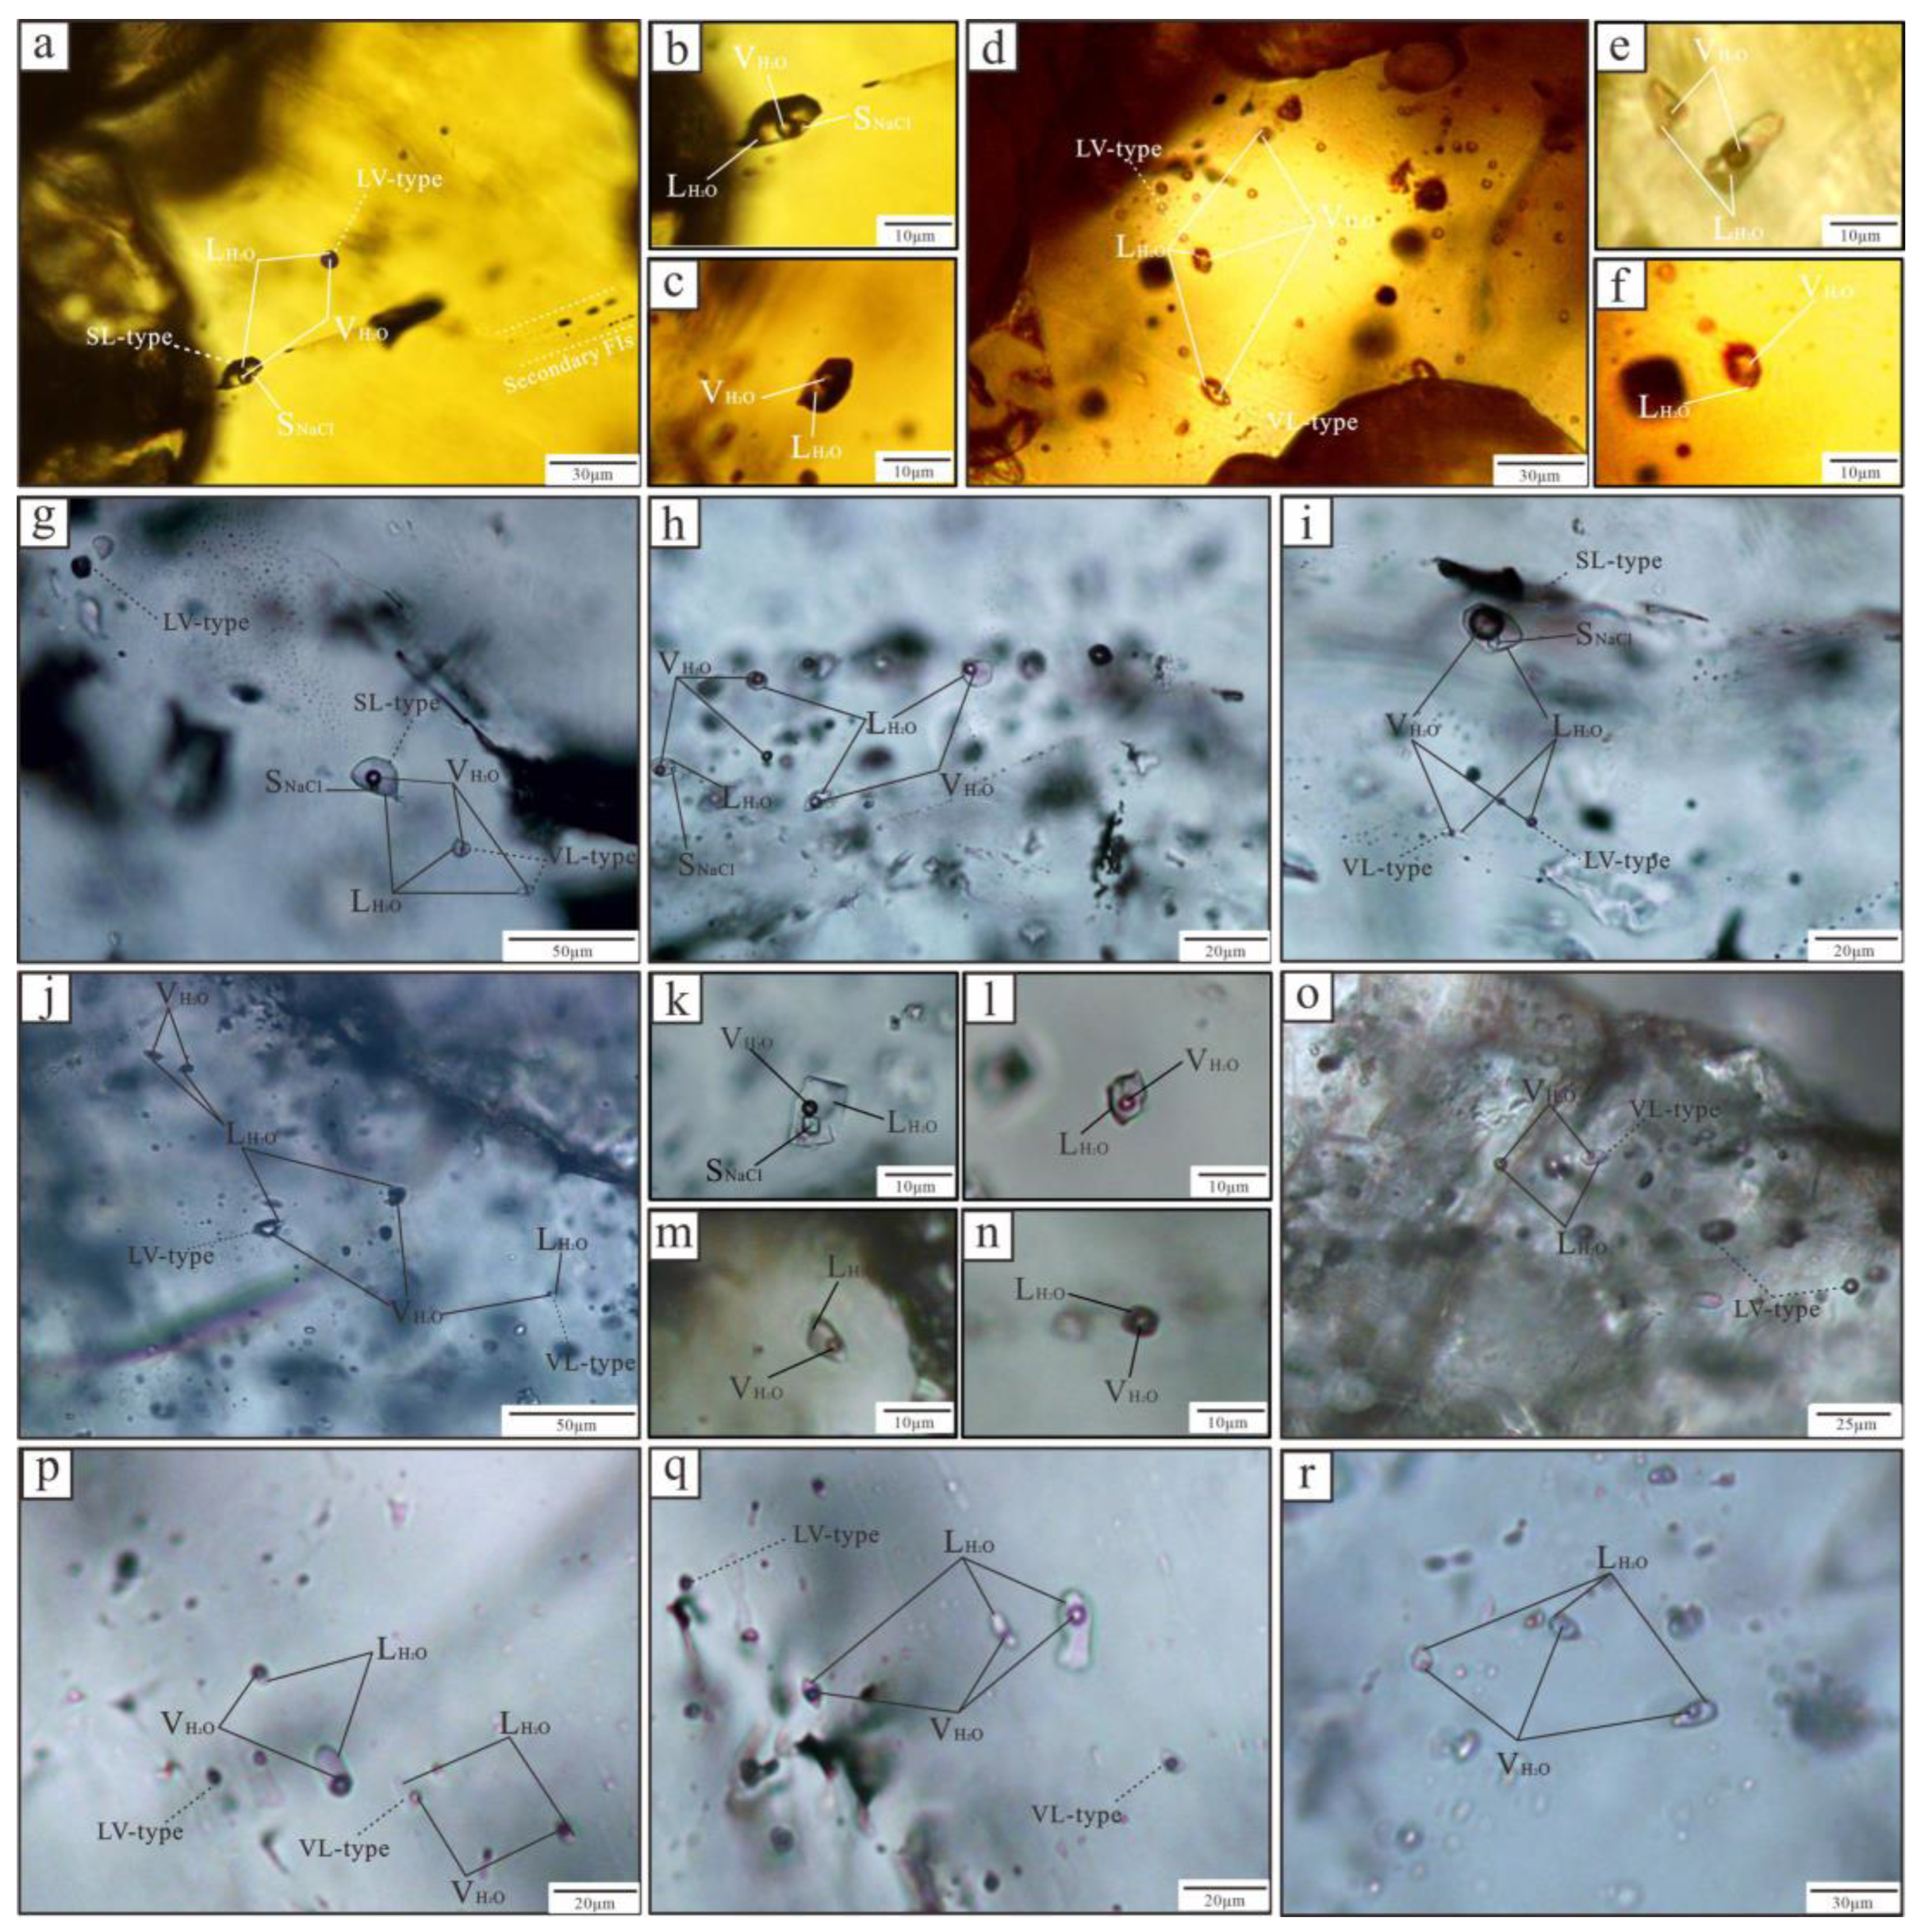
5.1. FI Types
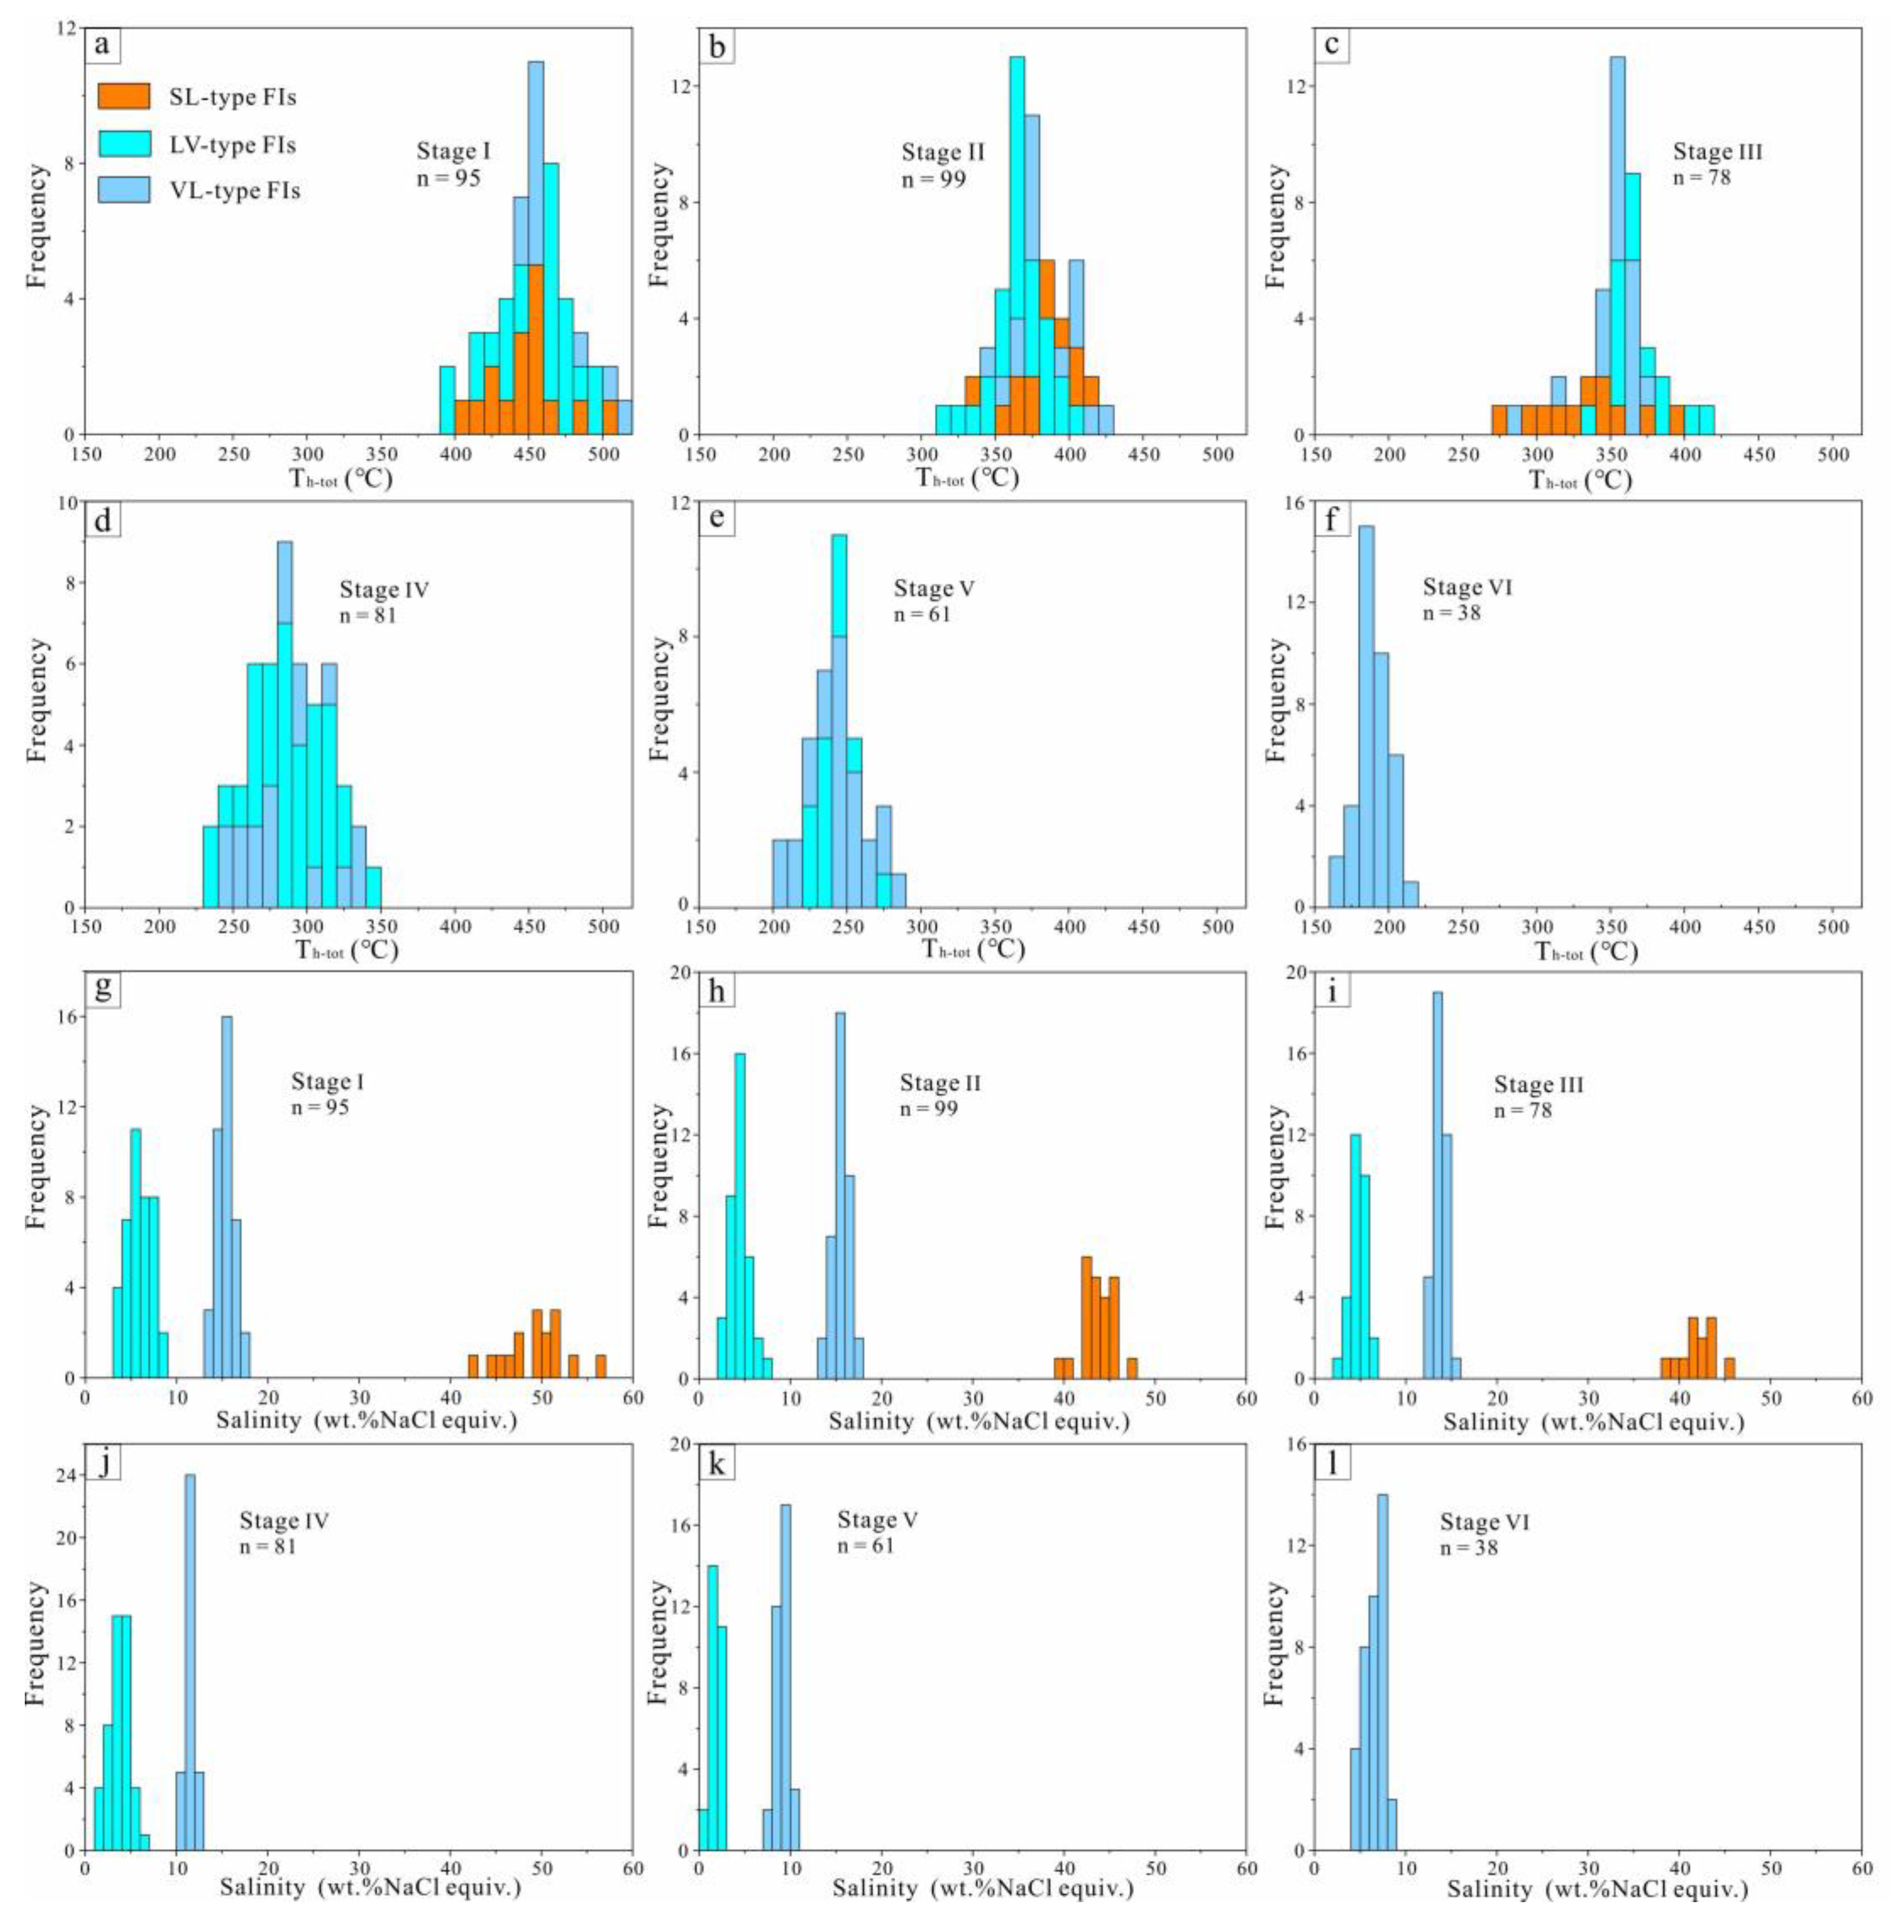
5.2. FI Microthermometric Data
5.3. Stable Isotopes
5.3.1. H–O Isotopes
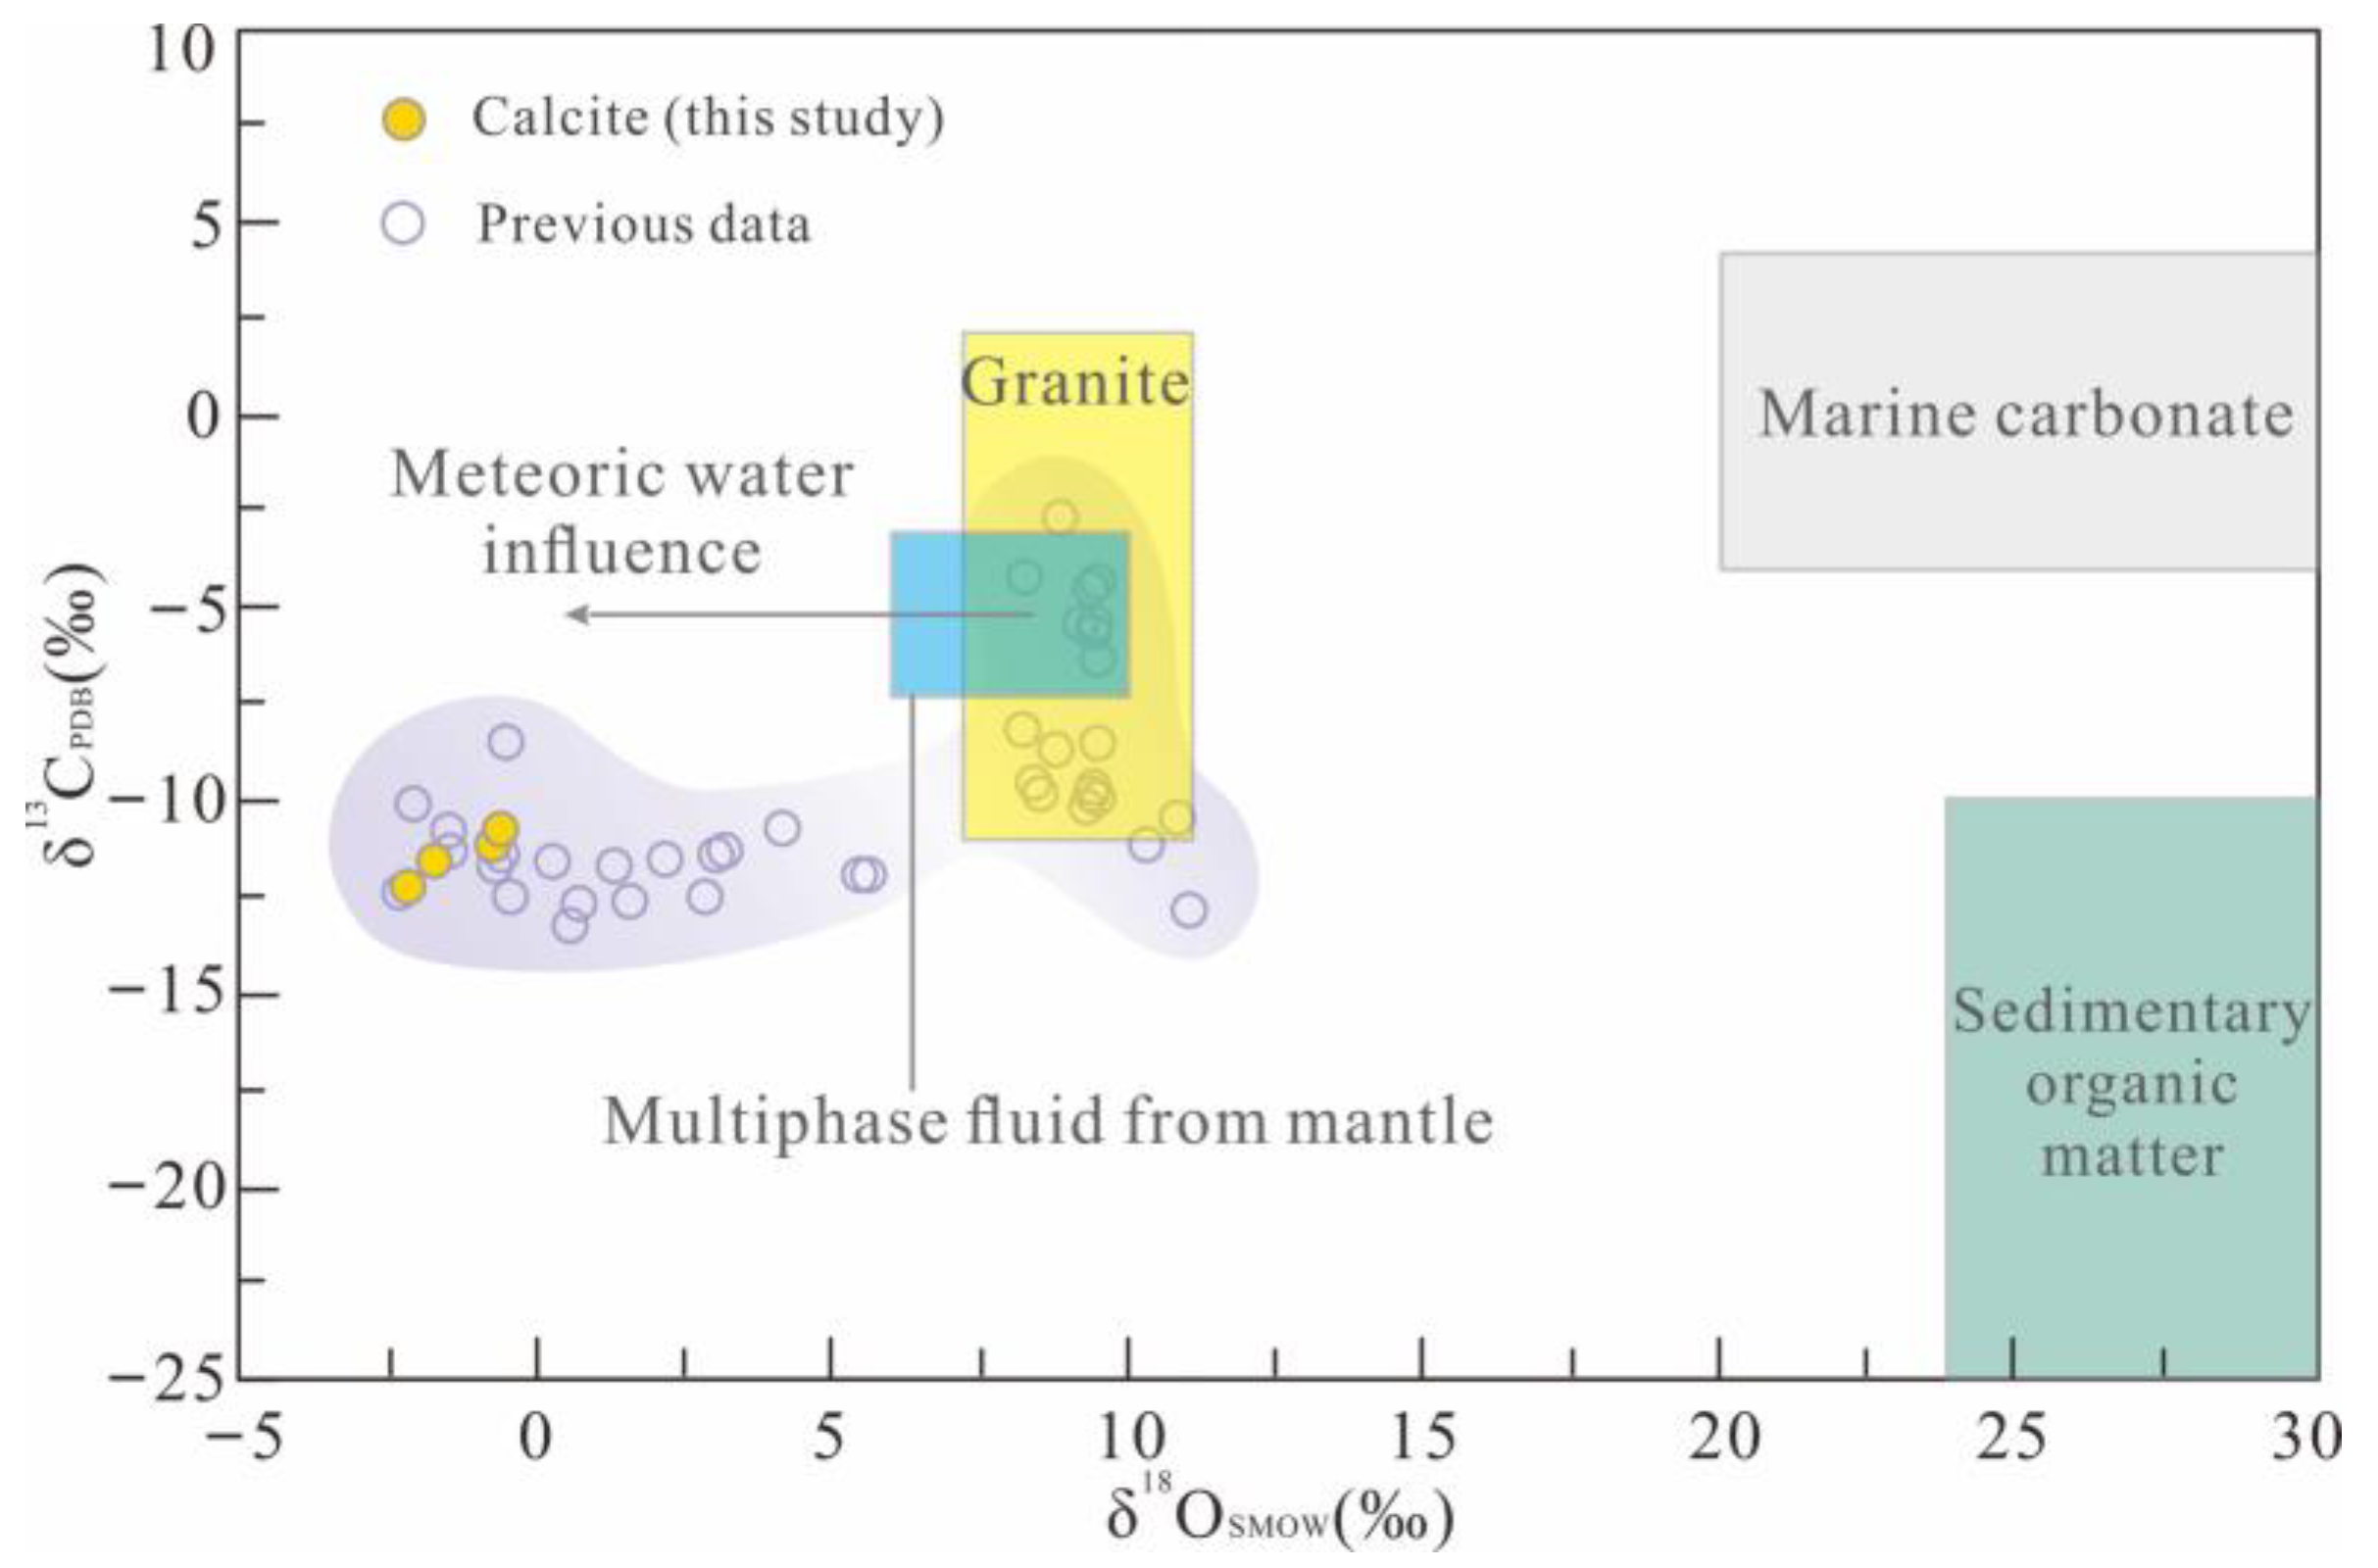
5.3.2. C–O Isotopes
5.4. Geochronological Data
5.4.1. Garnet U-Pb Age Data
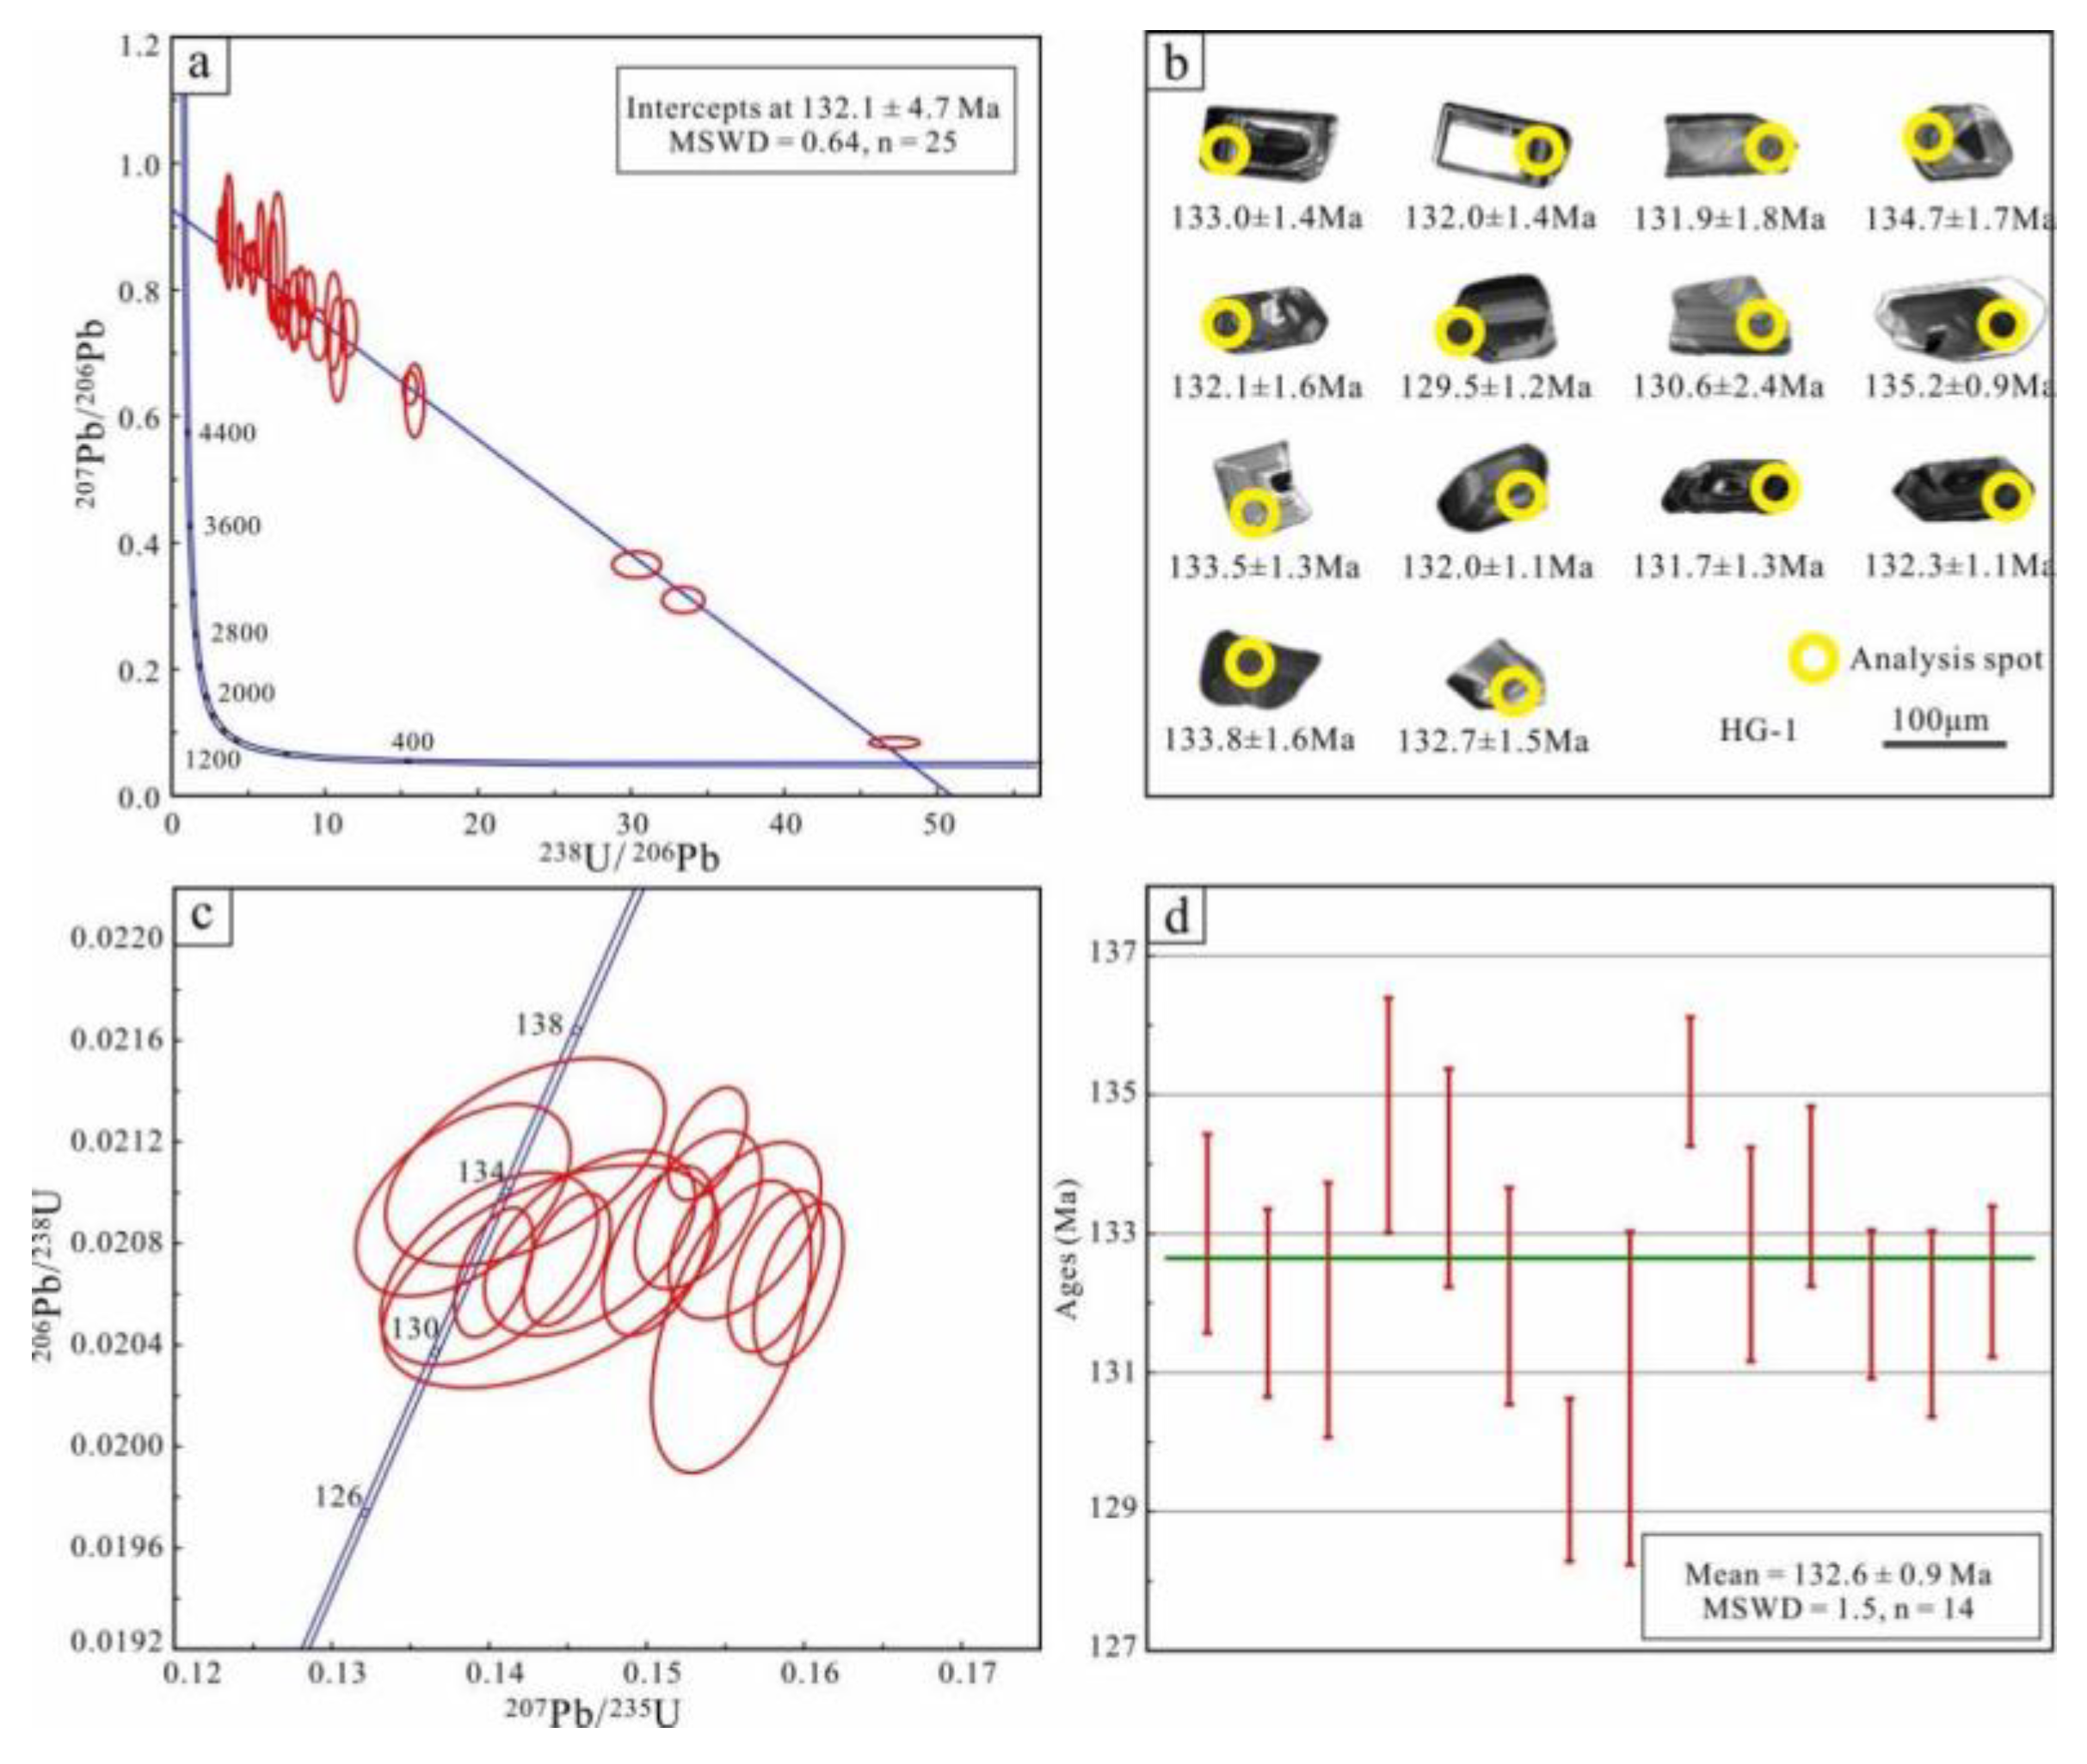
5.4.2. Zircon U-Pb Age Data
6. Discussion
6.1. Source of Ore-Forming Fluids
6.2. Fluid Evolution
6.3. Timing of Magmatic-Hydrothermal Activity
6.4. Ore Genesis
7. Conclusions
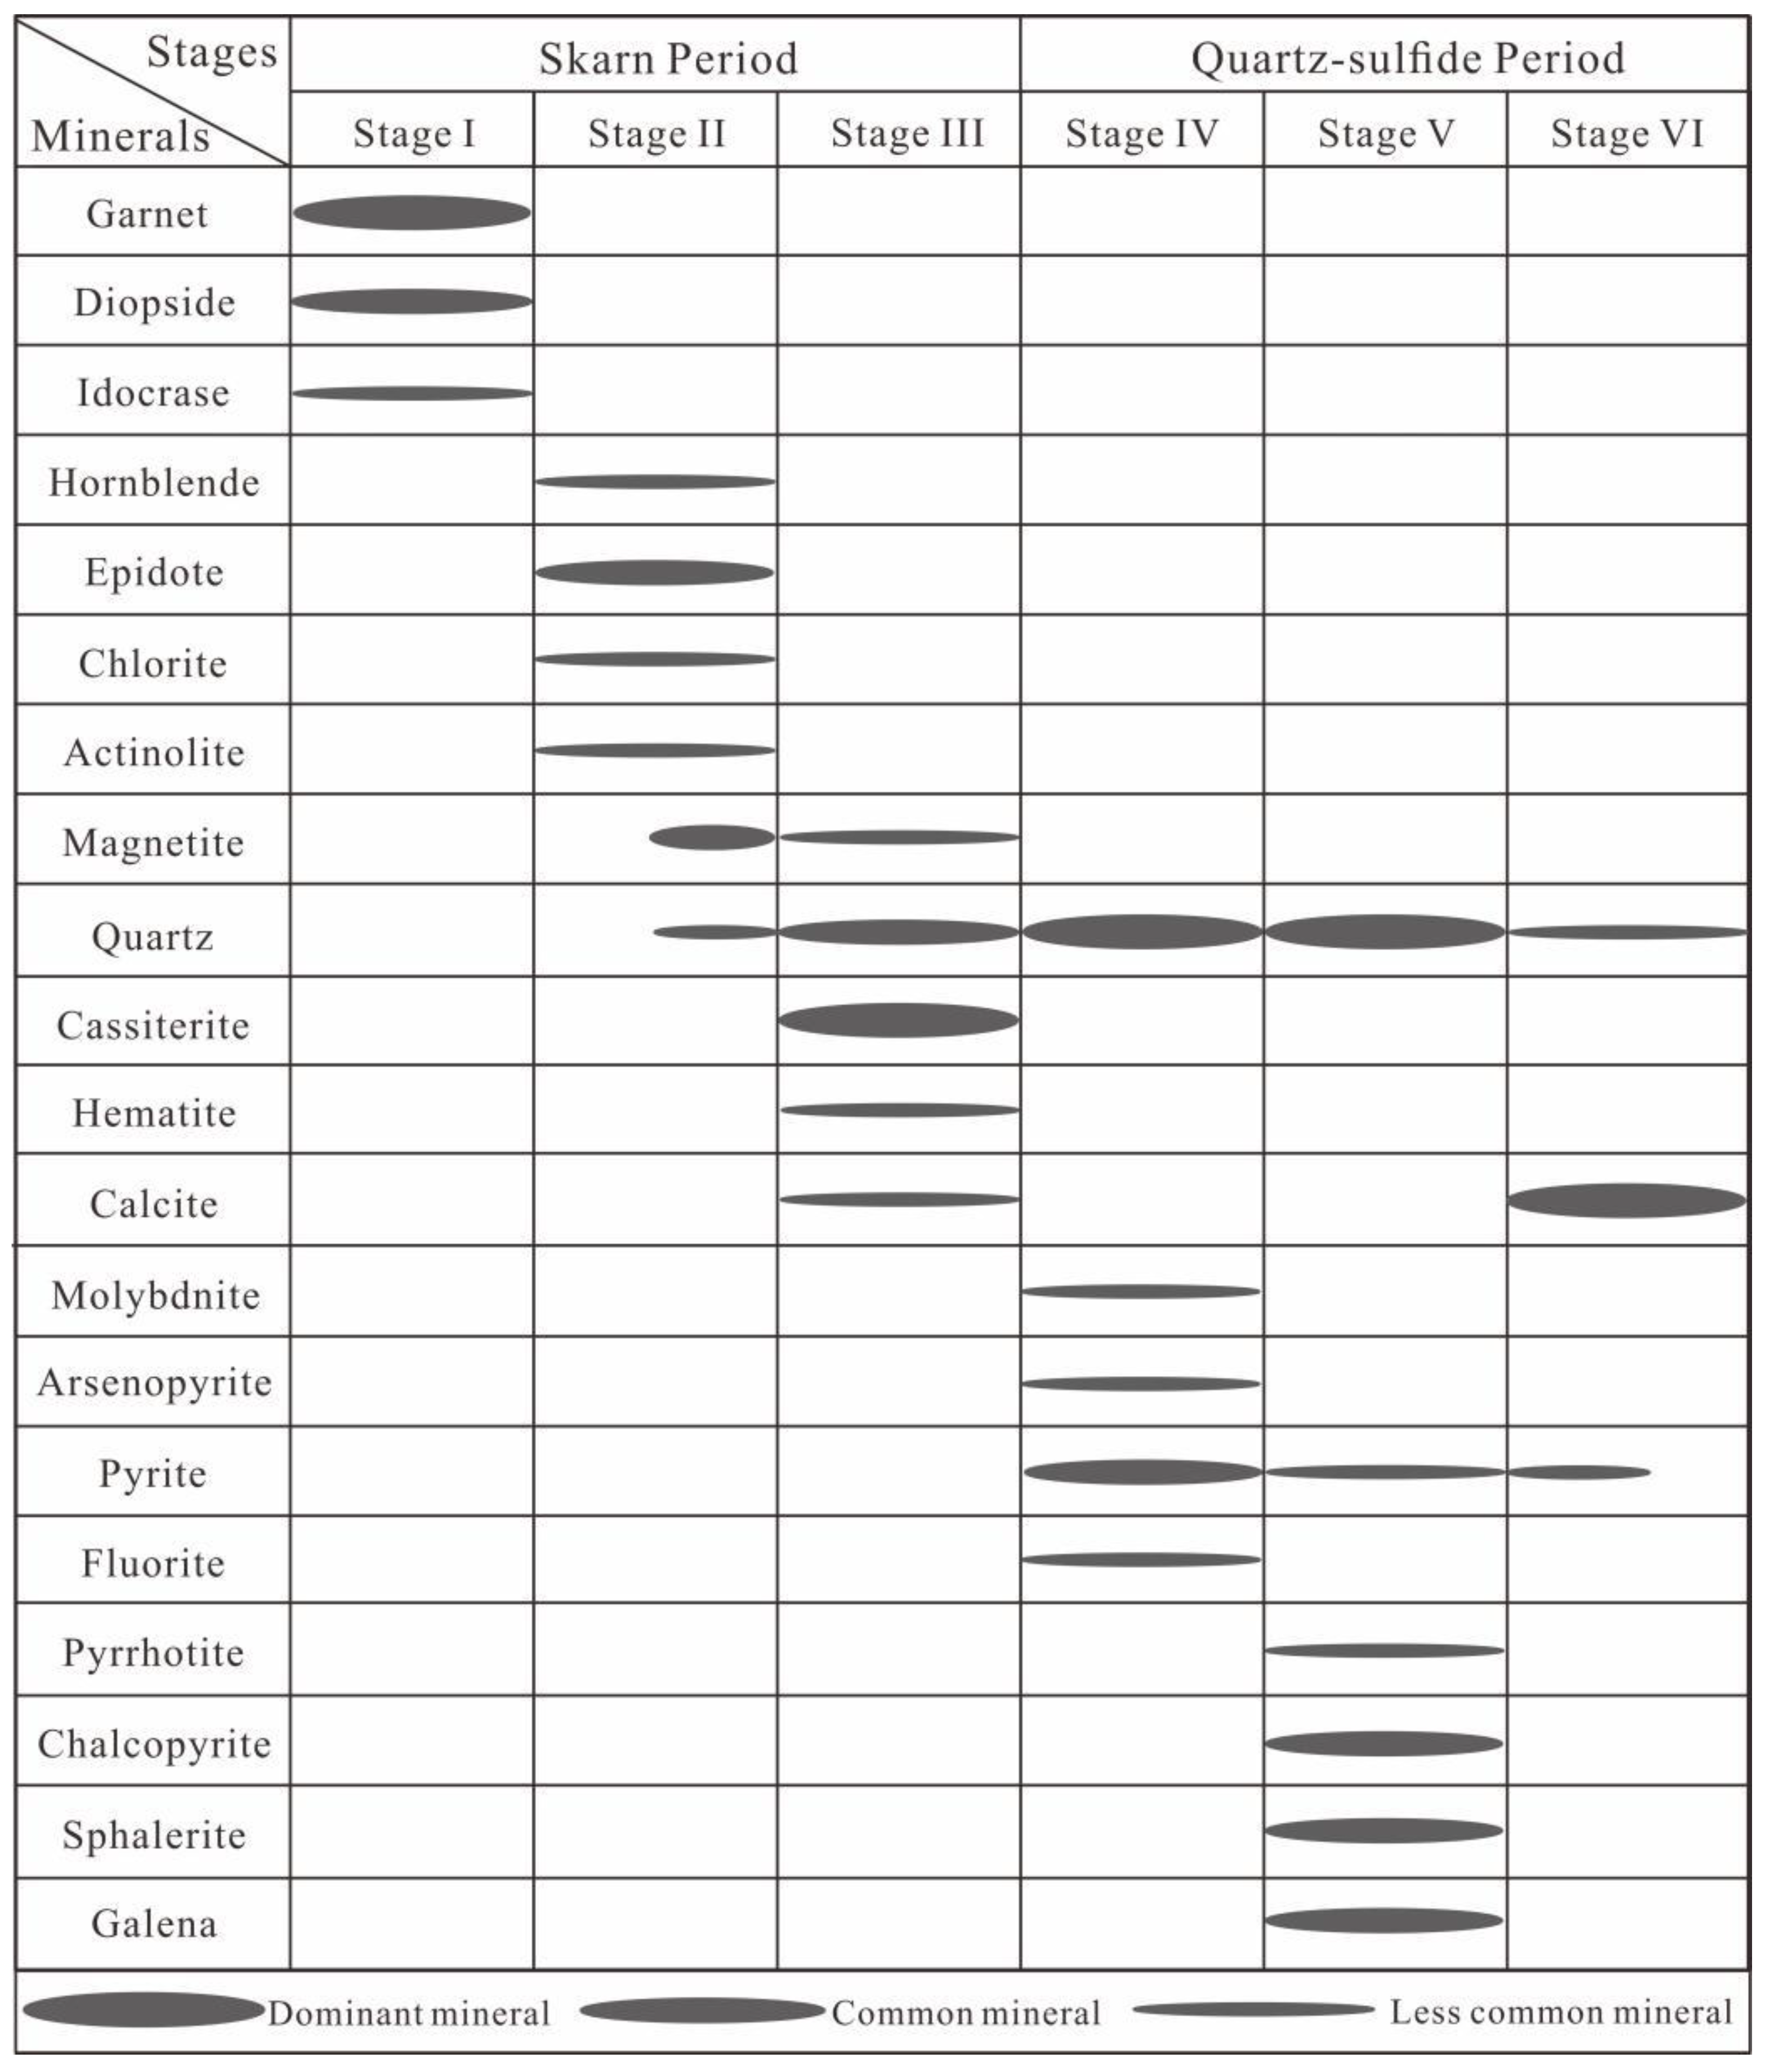
- The Huanggang skarn-type iron-tin deposit comprises seven stages of mineralization: (I) anhydrous skarn, (II) hydrous skarn, (III) cassiterite-quartz-calcite, (IV) pyrite-arsenopyrite-quartz-fluorite, (V) polymetallic sulfides-quartz, and (VI) carbonate stages.
- Fluid inclusion and C–H–O isotopic evidence suggests that the ore-forming fluids were initially a high-temperature high-salinity magmatic-derived system with intense boiling and changed to a medium-to-low-temperature, low-salinity NaCl–H2O system in the later stages with meteoric water mixing.
- The precipitation of magnetite and cassiterite was closely related to the joint effects of fluid boiling caused by decompression and fluid mixing induced by the adding of a certain amount of meteoric water.
- U-Pb dating of garnet and zircon yields a lower-intercept age of 132.1 ± 4.7 Ma and a weighted mean age of 132.6 ± 0.9 Ma, respectively, corresponding to the timing of skarn formation and crystallization of K-feldspar granite.
Author Contributions
Funding
Data Availability Statement
Acknowledgments
Conflicts of Interest
Appendix A

| Stage | Mineral | Fis Type | Frequency | Size (μm) | Tm-ice (°C) | Tm-NaCl (°C) | Th-tot (°C) | Salinity (wt% NaCl Equiv.) |
|---|---|---|---|---|---|---|---|---|
| I | Garnet | LV | 40 | 5 to 15 | −5.4 to −1.8 | 411 to 513 | 3.05 to 8.40 | |
| VL | 39 | 3 to 15 | −13.2 to −9.2 | 392 to 497 | 13.33 to 17.19 | |||
| SL | 16 | 5 to 12 | 351 to 475 | 401 to 501 | 42.50 to 56.44 | |||
| II | Quartz | LV | 37 | 5 to 15 | −4.6 to −1.5 | 336 to 429 | 2.56 to 7.30 | |
| VL | 39 | 3 to 15 | −13.6 to −10.0 | 317 to 426 | 13.99 to 17.56 | |||
| SL | 23 | 5 to 12 | 314 to 403 | 332 to 420 | 39.27 to 47.77 | |||
| III | Quartz | LV | 29 | 5 to 15 | −4.0 to −1.7 | 292 to 418 | 2.89 to 6.43 | |
| VL | 37 | 3 to 15 | −11.1 to −8.7 | 286 to 411 | 12.54 to 15.15 | |||
| SL | 12 | 5 to 12 | 301 to 385 | 272 to 396 | 38.24 to 45.85 | |||
| IV | Quartz | LV | 24 | 5 to 12 | −3.5 to −0.8 | 231 to 327 | 1.39 to 5.70 | |
| VL | 19 | 3 to 12 | −8.6 to −7.1 | 224 to 318 | 10.62 to 12.42 | |||
| Fluorite | LV | 23 | 5 to 12 | −3.8 to −0.9 | 255 to 347 | 1.56 to 6.14 | ||
| VL | 15 | 3 to 12 | −8.4 to −7.3 | 243 to 331 | 10.87 to 12.19 | |||
| V | Quartz | LV | 27 | 5 to 12 | −1.5 to −0.5 | 223 to 274 | 0.87 to 2.56 | |
| VL | 34 | 3 to 12 | −7.1 to −4.9 | 201 to 281 | 7.72 to 10.62 | |||
| VI | Calcite | VL | 38 | 3 to 10 | −5.5 to −2.7 | 169 to 213 | 4.48 to 8.54 |
| Sample | Stage | Mineral | δ18OV-SMOW (‰) | δD (‰) | Th (°C) | δ18OH2O (‰) |
|---|---|---|---|---|---|---|
| HG-1-1 | I | Garnet | 3.8 | −92.3 | 453 | 5.0 |
| HG-1-2 | I | Garnet | 3.8 | −101.2 | 453 | 5.0 |
| HG-2-1 | I | Garnet | 4.8 | −91.4 | 453 | 6.0 |
| HG-3-1 | I | Garnet | 4.2 | −96.6 | 453 | 5.4 |
| HG-5-1 | II | Quartz | 9.5 | −106.3 | 376 | 4.9 |
| HG-5-2 | II | Quartz | 8.9 | −104.7 | 376 | 4.3 |
| HG-7-1 | III | Quartz | 9.2 | −106.2 | 353 | 4.0 |
| HG-8-1 | IV | Quartz | 7.6 | −108.6 | 288 | 0.3 |
| HG-9-2 | IV | Quartz | 6.1 | −117.4 | 288 | −1.2 |
| HG-10-1 | V | Quartz | 5.9 | −114.3 | 243 | −3.4 |
| Sample | Mineralization Stages | Mineral | δ13CV-PDB (‰) | δ18OV-PDB (‰) | δ18OV-SMOW (‰) |
|---|---|---|---|---|---|
| HG-7 | VI | Calcite | −11.1 | −30.9 | −0.9 |
| HG-12-1 | VI | Calcite | −11.5 | −31.9 | −1.9 |
| HG-7-1 | VI | Calcite | −10.9 | −30.7 | −0.7 |
| HG-13-1 | VI | Calcite | −12.2 | −32.1 | −2.2 |
| Samples | Th | U | Th/U | Isotopic Ratios | |||||
|---|---|---|---|---|---|---|---|---|---|
| ppm | ppm | 206Pb/238U | 1σ | 207Pb/235U | 1σ | 207Pb/206Pb | 1σ | ||
| HG-1 | 0.87 | 2.01 | 0.43 | 0.0630 | 0.0016 | 6.054 | 0.1976 | 0.6244 | 0.0383 |
| HG-2 | 1.23 | 2.63 | 0.47 | 0.1184 | 0.0026 | 13.014 | 0.3314 | 0.7973 | 0.0257 |
| HG-3 | 0.33 | 0.95 | 0.35 | 0.1885 | 0.0041 | 21.678 | 0.5510 | 0.8341 | 0.0275 |
| HG-4 | 0.49 | 2.14 | 0.23 | 0.2858 | 0.0083 | 34.925 | 1.0865 | 0.8863 | 0.0453 |
| HG-5 | 0.31 | 0.74 | 0.42 | 0.0212 | 0.0005 | 2.395 | 0.0508 | 0.0835 | 0.0055 |
| HG-6 | 0.85 | 1.73 | 0.49 | 0.0299 | 0.0008 | 3.382 | 0.1745 | 0.3093 | 0.0135 |
| HG-7 | 1.77 | 2.21 | 0.80 | 0.0329 | 0.0011 | 3.747 | 0.1138 | 0.3651 | 0.0136 |
| HG-8 | 0.63 | 1.58 | 0.40 | 0.1112 | 0.0029 | 12.085 | 0.4862 | 0.7884 | 0.0260 |
| HG-9 | 0.55 | 2.57 | 0.21 | 0.2242 | 0.0062 | 26.412 | 1.6145 | 0.8543 | 0.0334 |
| HG-10 | 0.31 | 0.88 | 0.35 | 0.2683 | 0.0133 | 32.980 | 1.9301 | 0.8916 | 0.0596 |
| HG-11 | 0.74 | 2.19 | 0.34 | 0.1246 | 0.0034 | 12.843 | 0.4170 | 0.7476 | 0.0223 |
| HG-12 | 0.71 | 2.97 | 0.24 | 0.1158 | 0.0028 | 12.046 | 0.3725 | 0.7546 | 0.0215 |
| HG-13 | 1.41 | 3.51 | 0.40 | 0.1518 | 0.0050 | 17.385 | 0.7369 | 0.8305 | 0.0531 |
| HG-14 | 0.76 | 1.23 | 0.62 | 0.1999 | 0.0041 | 23.362 | 0.3878 | 0.8478 | 0.0159 |
| HG-15 | 0.98 | 2.26 | 0.43 | 0.0642 | 0.0013 | 7.467 | 0.1917 | 0.6437 | 0.0169 |
| HG-16 | 0.33 | 0.96 | 0.34 | 0.1445 | 0.0063 | 16.862 | 0.8729 | 0.8463 | 0.0706 |
| HG-17 | 0.79 | 3.21 | 0.25 | 0.1045 | 0.0041 | 10.495 | 0.5164 | 0.7286 | 0.0263 |
| HG-18 | 0.28 | 1.44 | 0.19 | 0.1720 | 0.0043 | 20.857 | 0.6284 | 0.8794 | 0.0387 |
| HG-19 | 1.01 | 2.31 | 0.44 | 0.1252 | 0.0040 | 13.224 | 0.5320 | 0.7661 | 0.0412 |
| HG-20 | 0.42 | 0.89 | 0.47 | 0.1340 | 0.0032 | 14.325 | 0.4402 | 0.7751 | 0.0262 |
| HG-21 | 0.64 | 1.02 | 0.63 | 0.1386 | 0.0042 | 14.478 | 0.5420 | 0.7574 | 0.0231 |
| HG-22 | 0.75 | 2.63 | 0.29 | 0.0865 | 0.0026 | 8.819 | 0.3127 | 0.7390 | 0.0296 |
| HG-23 | 1.23 | 2.37 | 0.52 | 0.3161 | 0.0085 | 38.561 | 1.3332 | 0.8848 | 0.0284 |
| HG-24 | 1.35 | 2.86 | 0.47 | 0.0946 | 0.0031 | 9.786 | 0.4235 | 0.7503 | 0.0510 |
| HG-25 | 0.73 | 2.4 | 0.30 | 0.0923 | 0.0030 | 8.969 | 0.3640 | 0.7050 | 0.0541 |
| Samples | Content | Isotopic Ratios | Isotopic Age Values (Ma) | ||||||||||||
|---|---|---|---|---|---|---|---|---|---|---|---|---|---|---|---|
| Th ppm | U ppm | Th/U | 207Pb/206Pb | 1σ | 207Pb/235U | 1σ | 206Pb/238U | 1σ | 207Pb/206Pb | 1σ | 207Pb/235U | 1σ | 206Pb/238U | 1σ | |
| HG-1-1 | 1347.3 | 8426.5 | 0.16 | 0.05037 | 0.00094 | 0.15625 | 0.00319 | 0.02085 | 0.00023 | 212.2 | 42.75 | 147.4 | 2.8 | 133.0 | 1.4 |
| HG-1-2 | 1898.2 | 10,293.0 | 0.18 | 0.05194 | 0.00062 | 0.1582 | 0.002 | 0.02069 | 0.00021 | 282.8 | 27.12 | 149.1 | 1.8 | 132.0 | 1.4 |
| HG-1-3 | 4042.2 | 12,729.4 | 0.32 | 0.04928 | 0.00219 | 0.14391 | 0.00704 | 0.02067 | 0.00029 | 161.2 | 100.71 | 136.5 | 6.3 | 131.9 | 1.8 |
| HG-1-4 | 544.1 | 1497.1 | 0.36 | 0.04948 | 0.00188 | 0.1423 | 0.00586 | 0.02112 | 0.00027 | 170.9 | 86.26 | 135.1 | 5.2 | 134.7 | 1.7 |
| HG-1-5 | 1035.2 | 6655.9 | 0.16 | 0.04805 | 0.00143 | 0.13836 | 0.00449 | 0.02097 | 0.00025 | 101.6 | 69.08 | 131.6 | 4.0 | 133.8 | 1.6 |
| HG-1-6 | 1106.2 | 2769.6 | 0.40 | 0.04848 | 0.00145 | 0.14002 | 0.00455 | 0.0207 | 0.00025 | 122.9 | 68.74 | 133.1 | 4.1 | 132.1 | 1.6 |
| HG-1-7 | 504.6 | 4015.5 | 0.13 | 0.04929 | 0.00071 | 0.15076 | 0.00234 | 0.02077 | 0.00022 | 198 | 31 | 133 | 1.7 | 129.5 | 1.2 |
| HG-1-8 | 3915.4 | 6824.9 | 0.57 | 0.0549 | 0.0007 | 0.1554 | 0.0034 | 0.0205 | 0.0004 | 406 | 23 | 147 | 2.9 | 130.6 | 2.4 |
| HG-1-9 | 2073.5 | 9005.6 | 0.23 | 0.0525 | 0.0005 | 0.1539 | 0.0017 | 0.0212 | 0.0001 | 309 | 24 | 145 | 1.5 | 135.2 | 0.9 |
| HG-1-10 | 227.8 | 445.6 | 0.51 | 0.05124 | 0.00141 | 0.14641 | 0.00442 | 0.0208 | 0.00024 | 251.6 | 62.29 | 138.7 | 3.9 | 132.7 | 1.5 |
| HG-1-11 | 90.9 | 1690.4 | 0.05 | 0.0528 | 0.0007 | 0.1533 | 0.0026 | 0.0209 | 0.0002 | 320 | 25 | 145 | 2.3 | 133.5 | 1.3 |
| HG-1-12 | 1061.9 | 7061.0 | 0.15 | 0.0491 | 0.0005 | 0.1403 | 0.0017 | 0.0207 | 0.0002 | 150 | 24 | 133 | 1.5 | 132.0 | 1.1 |
| HG-1-13 | 1839.2 | 10,368.3 | 0.18 | 0.05283 | 0.00059 | 0.15964 | 0.00187 | 0.02064 | 0.00021 | 321.4 | 25.19 | 150.4 | 1.6 | 131.7 | 1.3 |
| HG-1-14 | 454.9 | 6221.5 | 0.07 | 0.0506 | 0.0005 | 0.1450 | 0.0018 | 0.0207 | 0.0002 | 220 | 22 | 137 | 1.6 | 132.3 | 1.1 |
References
- John, R. Hydrothermal ore deposits I: Magmatic and orogenic environments. In Ore Deposit Geology; Cambridge University Press: New York, NY, USA, 2013; pp. 135–147. [Google Scholar]
- Zhao, Y.M.; Lin, W.W.; Bi, C.E.; Li, D.X. Basic geological characteristics of skarn deposits of China. Bull. Chin. Acad. Geol. Sci. 1986, 14, 59–87. (In Chinese) [Google Scholar]
- Einaudi, M.T.; Meinert, L.D.; Newberry, R.J. Skarn Deposits; Economic Geology Publishing Company: Littleton, CO, USA, 1981; Volume 75th Anniversary, pp. 317–391. [Google Scholar]
- Meinert, L.D. Mineralogy and petrology of iron skarns in western British Columbia, Canada. Econ. Geol. 1984, 79, 869–882. [Google Scholar] [CrossRef]
- Zhao, Y.M. Some new important advances in study of skarn deposits. Miner. Depos. 2012, 21, 113–136, (In Chinese with English Abstract). [Google Scholar]
- Meinert, L.D.; Dipple, G.M.; Nicolescu, S. World Skarn Deposits; Society of Economic Geologists: Littleton, CO, USA, 2005; Volume 100th Anniversary, pp. 236–299. [Google Scholar]
- Chen, Y.; Zhang, Z.C. Study on source, transport and the enrichment mechanism of iron in iron skarn deposits. Rock Miner. Anal. 2012, 31, 889–897. [Google Scholar]
- Yao, Y. Magnesian and Calcic Skarn Type Tin-Polymetallic Mineralization in the Nanling Range: Case Study from Hehuaping and Xitian. Ph.D. Thesis, Nanjing University, Nanjing, China, 2012. (In Chinese with English Abstract). [Google Scholar]
- Audetat, A.; Gunther, D.; Heinrich, C.A. Formation of a magmatic–hydrothermal ore deposit: Insights with LA–ICP–MS analysis of fluid inclusions. Science 1998, 279, 2091–2094. [Google Scholar] [CrossRef] [PubMed]
- Duan, Z. The Mineralization and Mechanism of the Iron Skarn Deposits in Laiwu District, Shandong Province. Ph.D. Thesis, China University of Geosciences, Wuhan, China, 2019. (In Chinese with English Abstract). [Google Scholar]
- Liu, X.C.; Yu, P.P.; Xiao, C.H. Tin transport and cassiterite precipitation from hydrothermal fluids. Geosci. Front. 2023, 14, 101624. [Google Scholar] [CrossRef]
- Sun, M.G.; Mathur, R.; Gao, C.H.; Chen, Y.J.; Yuan, S.D. Equilibrium Sn isotope fractionation between aqueous Sn and Sn-bearing minerals: Constrained by first-principles calculations. Am. Miner. 2024, 109, 265–273. [Google Scholar] [CrossRef]
- Sengor, A.M.C.; Natal’in, B.A.; Burtman, V.S. Evolution of the Altaid tectonic collage and Paleozoic crustal growth in Eurasia. Nature 1993, 364, 299–307. [Google Scholar] [CrossRef]
- Xiao, W.J.; Windley, B.F.; Hao, J.J.; Zhai, M.G. Accretion leading to collision and the Permian Solonker suture, Inner Mongolia, China: Termination of the central Asian orogenic belt. Tectonics 2003, 22, 1–20. [Google Scholar] [CrossRef]
- Wu, F.Y.; Sun, D.Y.; Ge, W.C.; Zhang, Y.B.; Grant, M.L.; Wilde, S.A.; Jahn, B.M. Geochronology of the Phanerozoic granitoids in northeastern China. J. Asian Earth Sci. 2011, 41, 1–30. [Google Scholar] [CrossRef]
- Xu, W.L.; Wang, F.; Pei, F.P.; Meng, E.; Tang, J.; Xu, M.J.; Wang, W. Mesozoic tectonic regimes and regional ore-forming background in NE China: Constraints from spatial and temporal variations of Mesozoic volcanic rock associations. Acta Petrol. Sin. 2013, 29, 339–353, (In Chinese with English Abstract). [Google Scholar]
- Ren, Y.S.; Hao, Y.J.; Zhao, H.L.; Chen, C.; Yang, Q.; Duan, M.X.; Sun, Q. Paleozoic mineralization and typical deposits in the eastern segment of Xingmeng orogenic belt. Miner. Deposits 2014, 33, 125–126, (In Chinese with English Abstract). [Google Scholar]
- Zhang, C.; Quan, J.Y.; Zhang, Y.J.; Liu, Z.H.; Li, W.; Wang, Y.; Qian, C.; Zhang, L.; Ge, J.T. Late Mesozoic tectonic evolution of the southern Great Xing’an Range, NE China: Evidence from whole–rock geochemistry, and zircon U-Pb ages and Hf isotopes from volcanic rocks. Lithos 2022, 362–363, 105409. [Google Scholar] [CrossRef]
- Wang, M.; Fan, J.Z.; Wang, Z.W.; Ma, Y.Y. Comprehensive prospecting model for Lead–Zinc deposit of Huanggang– Ganzhuermiao metallogenic belt, Inner Mongolia. Earth Sci. Front. 2009, 16, 318–324. [Google Scholar] [CrossRef]
- Wang, C.Y. Lead–Zinc Polymetallic Metallogenic Series and Prospecting Direction of Huanggangliang–Ganzhuermiao Metallogenic Belt, Inner Mongolia. Ph.D. Thesis, Jilin University, Changchun, China, 2015. (In Chinese with English Abstract). [Google Scholar]
- Wang, C.M. Carbon and Oxygen Isotopic Composition and Its Genetic Significance in the Dajing Deposit, Inner Mongolia, China. J. Jilin Univ. Earth Sci. Ed. 2010, 40, 810–820. [Google Scholar]
- Shu, Q.H.; Lai, Y.; Sun, Y.; Wang, C.; Meng, S. Ore genesis and hydrothermal evolution of the Baiyinnuo’er zinc-lead skarn deposit, Northeast China: Evidence from isotopes (S, Pb) and fluid inclusions. Econ. Geol. 2013, 108, 835–860. [Google Scholar] [CrossRef]
- Li, J.F. Mineralization and Periphery Metallogenic Prediction of the Hongling Pb–Zn Polymetallic Deposit in Chifeng, Inner Mongolia. Ph.D. Thesis, Jilin University, Changchun, China, 2015. (In Chinese with English Abstract). [Google Scholar]
- Wang, C.Y.; Li, J.F.; Wang, K.Y.; Yu, Q.; Liu, G.H. Geology, Fluid Inclusion, and Stable Isotope Study of the Skarn–Related Pb–Zn (Cu-Fe-Sn) Polymetallic Deposits in the Southern Great Xing’an Range, China: Implications for Deposit Type and Metallogenesis. Arab. J. Geosci. 2018, 11, 88. [Google Scholar] [CrossRef]
- Zhang, H.Y.; Zhai, D.G.; Liu, J.L.; Li, P.L.; Li, K.; Sun, H.J. Fluid inclusion and stable (H–O–C) isotope studies of the giant Shuangjianzishan epithermal Ag-Pb-Zn deposit, Inner Mongolia, NE China. Ore Geol. Rev. 2019, 115, 103170. [Google Scholar] [CrossRef]
- Shi, J.P.; Wu, G.; Chen, G.Z.; Yang, F.; Zhang, T. Genesis of the Supergiant Shuangjianzishan Ag–Pb–Zn Deposit in the Southern Great Xing’an Range, NE China: Constraints from Geochronology, Isotope Geochemistry, and Fluid Inclusion. Minerals 2024, 14, 60. [Google Scholar] [CrossRef]
- Safonova, I.Y.; Santosh, M. Accretionary complexes in the Asia-Pacific region: Tracing archives of ocean plate stratigraphy and tracking mantle plumes. Gondwana Res. 2014, 25, 126–158. [Google Scholar] [CrossRef]
- Ma, X.L.; Wang, K.Y.; Zhou, H.Y.; Li, S.D.; Li, J.; Shi, K.T.; Wang, Z.G.; Yang, H.; Lai, C.K. Genesis and tectonic setting of Shenshan Fe-Cu deposit in Inner Mongolia, Northeast China: Constraints from geochemistry, U-Pb and Re–Os geochronology, and Hf isotopes. Ore Geol. Rev. 2019, 112, 103046. [Google Scholar] [CrossRef]
- Zhou, Z.H. Geology and Geochemistry of Huanggang Sn-Fe Deposit, Inner Mongolia. Ph.D. Thesis, Chinese Academy of Geological Sciences, Beijing, China, 2011. (In Chinese with English Abstract). [Google Scholar]
- Zhou, Z.H.; Mao, J.W.; Lyckberg, P. Geochronology and isotopic geochemistry of the A–type granites from the Huanggang Sn-Fe deposit, southern Great Hinggan Range, NE China: Implication for their origin and tectonic setting. J. Asian Earth Sci. 2012, 49, 272–286. [Google Scholar] [CrossRef]
- Mei, W.; Lv, X.B.; Gao, X.F.; Liu, Z.; Zhao, Y.; Ai, Z.L.; Tang, R.K.; Abfaua, M.M. Ore genesis and hydrothermal evolution of the Huanggang skarn iron–tin polymetallic deposit, southern Great Xing’an Range: Evidence from fluid inclusions and isotope analyses. Ore Geol. Rev. 2015, 64, 239–252. [Google Scholar] [CrossRef]
- Wang, C.; Shao, Y.J.; Zhang, X.; Dick, J.; Liu, Z.F. Trace Element Geochemistry of Magnetite: Implications for Ore Genesis of the Huanggangliang Sn-Fe Deposit, Inner Mongolia, Northeastern China. Minerals 2018, 8, 195. [Google Scholar] [CrossRef]
- Jiang, L.; Chen, Z.; Liu, Y.X. The chemical composition of trapiche–like quartz from Huanggangliang area, Inner Mongolia, China. Crystals 2022, 12, 122. [Google Scholar] [CrossRef]
- Xiao, W.; Windley, B.F.; Allen, M.B.; Han, C. Paleozoic multiple accretionary and collisional tectonics of the Chinese Tianshan orogenic collage. Gondwana Res. 2013, 23, 1316–1341. [Google Scholar] [CrossRef]
- Ouyang, H.G.; Mao, J.W.; Zhou, Z.H.; Su, H.M. Late Mesozoic metallogeny and intracontinental magmatism, southern Great Xing’an Range, northeastern China. Gondwana Res. 2015, 27, 1153–1172. [Google Scholar] [CrossRef]
- Ouyang, H.G. Metallogenesis of Bairendaba−Weilasituo Silver-Polymetallic Deposit and Its Geodynamic Setting, in the Southern Segment of Great Xing’an Range, NE China. Ph.D. Thesis, China University of Geosciences, Beijing, China, 2013. (In Chinese with English Abstract). [Google Scholar]
- Jiang, B.; Wang, D.H.; Chen, Y.C.; Zhang, T.; Pu, X.L.; Ma, W.W.; Wang, Y.; Wu, G.; Wu, L.W.; Zhang, T.; et al. Classification, metallogenesis and exploration of silver deposits in Daxing’anling of Inner Mongolia and its adjacent areas. China Geol. 2022, 5, 1–19. [Google Scholar] [CrossRef]
- Li, Y.S.; Liu, Z.F.; Shao, Y.J.; Chen, K.; Zhang, J.K.; Zhang, Y.C.; Zhang, T.D. Genesis of the Huanggangliang Fe-Sn polymetallic deposit in the southern Da Hinggan Range, NE China: Constraints from geochronology and cassiterite trace element geochemistry. Ore Geol. Rev. 2022, 151, 105226. [Google Scholar] [CrossRef]
- Wang, L.J.; Shimazaki, H.; Shiga, Y. Skarns and genesis of the Huanggang Fe-Sn deposit, Inner Mongolia, China. Resour. Geol. 2001, 51, 359–376. [Google Scholar] [CrossRef]
- Zhai, D.G.; Liu, J.J.; Zhang, H.Y.; Mao, M.J.; Wang, J.P.; Yang, Y.Q. S–Pb isotopic geochemistry, U-Pb and Re–Os geochronology of the Huanggangliang Fe-Sn deposit, Inner Mongolia, NE China. Ore Geol. Rev. 2014, 59, 109–122. [Google Scholar] [CrossRef]
- Hou, Z.X.; Liu, Z.N.; Han, W.; Wang, W.C. The Occurrence State of Tin and Beryllium in Polymetallic Ore from Huanggangliang Area, Hexigten County, Inner Mongolia, China. Acta Geol. Sin. 2017, 37, 807–812, (In Chinese with English Abstract). [Google Scholar]
- Clayton, R.N.; Mayeda, T.K. The use of bromine pentafluoride in the extraction of oxygen from oxides and silicates for isotopic analysis. Geochim. Cosmochim. Acta 1963, 27, 43–52. [Google Scholar] [CrossRef]
- Clayton, R.N.; O’Neil, J.R.; Mayeda, T.K. Oxygen isotope exchange between quartz and water. J. Geophys. Res. 1972, 77, 3057–3067. [Google Scholar] [CrossRef]
- Bottinga, V.; Javoy, M. Oxygen isotope partitioning among the minerals in igneous and metamorphic rocks. Rev. Geophys. Space Phys. 1975, 13, 401–418. [Google Scholar] [CrossRef]
- Lichtenstein, U.; Hoernes, S. Oxygen isotope fractionation between grossilar-spessarine garnet and water: An experimental investigation. Eur. J. Miner. 1992, 4, 239–249. [Google Scholar] [CrossRef]
- Gonfiantini, R.; Stichler, W.; Rozanski, K. Standards and Intercomparison Materials Distributed by the International Atomic Energy Agency for Stable Isotope Measurements. In Reference and Intercomparison Materials for Stable Isotopes of Light Elements; IAEA: Vienna, Austria, 1995; pp. 13–29. [Google Scholar]
- Liu, Y.S.; Gao, S.; Hu, Z.C.; Gao, C.G.; Zong, K.Q.; Wang, D.B. Continental and oceanic crust recycling-induced melt-peridotite interactions in the Trans–North China Orogen: U-Pb dating, Hf isotopes and trace elements in zircons of mantle xenoliths. J. Petrol. 2010, 51, 537–571. [Google Scholar] [CrossRef]
- Liu, Y.S.; Hu, Z.C.; Zong, K.Q.; Gao, C.G.; Gao, G.; Xu, J.; Chen, H.H. Reappraisement and refinement of zircon U-Pb isotope and trace element analyses by LA–ICP–MS. Chin. Sci. Bull. 2010, 55, 1535–1546. [Google Scholar] [CrossRef]
- Ludwig, K.R. ISOPLOT 3.0: A Geochronological Toolkit for Microsoft Excel; Berkeley Geochronology Center Special Publication: Berkeley, CA, USA, 2003; p. 70. [Google Scholar]
- Ludwig, K.R. User’s manual for Isoplot 3.75: A Geochronological toolkit for Microsoft Excel; Berkeley Geochronology Center Special Publication: Berkeley, CA, USA, 2012; pp. 1–70. [Google Scholar]
- Roedder, E. Fluid inclusions. Rev. Mineral. 1984, 12, 644. [Google Scholar]
- Taylor, H.P. The application of oxygen and hydrogen isotope studies to problems of hydrothermal alteration and ore deposition. Econ. Geol. 1974, 69, 843–883. [Google Scholar] [CrossRef]
- Hoefs, J. Stable Isotope Geochemistry, 7th ed.; Springer International Publishing: Cham, Switzerland, 2015. [Google Scholar]
- Zhou, Z.H.; Wang, A.S.; Li, T. Fluid inclusion characteristics and metallogenic mechanism of Huanggang Sn-Fe deposit in Inner Mongolia. Miner. Depos. 2011, 30, 867–889, (In Chinese with English Abstract). [Google Scholar]
- Zhao, Y.M. Ore-Controlling Factors and Ore-Prospecting Models for Copper Polymetallic Ore Deposits in Southeastern Inner Mongolia; Seismological Press: Beijing, China, 1994; p. 191. (In Chinese) [Google Scholar]
- Feng, J.Z. The isotopic characteristics of polymetallic deposits from Huanggangliang to Meng’en, Eastern Inner Mogolia. Liaoning Geol. 1992, 2, 117–126, (In Chinese with English Abstract). [Google Scholar]
- Wang, L.J.; Shimazaki, H.; Wang, J.B.; Wang, Y.Z. Ore-forming fluid and metallization of the Huanggangliang skarn Fe-Sn deposit, Inner Mongolia. Sci. China 2001, 44, 735–747. [Google Scholar] [CrossRef]
- Wang, C.M.; Zhang, S.T.; Deng, J.; Liu, J.M. The exhalative genesis of the stratabound skarn in the Huanggangliang Sn-Fe polymetallic deposit of Inner Mongolia. Acta Petrol. Mineral. 2007, 26, 409–417, (In Chinese with English Abstract). [Google Scholar]
- Meinert, L.D.; Hedenquist, J.W.; Satoh, H.; Matsuhisa, Y. Formation of anhydrous and hydrous skarn in Cu–Au ore deposits by magmatic fluids. Econ. Geol. 2003, 98, 147–156. [Google Scholar] [CrossRef]
- Giggenbach, W.F. Magma degassing and mineral deposition in hydrothermal systems along convergent plate boundaries. Econ. Geol. 1992, 87, 1927–1944. [Google Scholar]
- Taylor, H.P. Oxygen and hydrogen isotope relationships in hydrothermal mineral deposits. In Geochemistry of Hydrothermal Ore Deposit; Barnes, H.L., Ed.; John Wiley & Sons Inc.: New York, NY, USA, 1997; pp. 229–302. [Google Scholar]
- Hedenquist, J.W.; Arribas, A.; Reynolds, T.J. Evolution of an intrusion-centered hydrothermal system: Far Southeast–Lepanto porphyry and epithermal Cu–Au deposits, Philippines. Econ. Geol. 1998, 93, 373–404. [Google Scholar] [CrossRef]
- Yang, T.L.; Ni, P.; Pan, J.Y.; Chi, Z.; Ding, J.Y.; Wang, Q. Episodic fluid evolution in the formation of the large scale Luoyang Fe deposit, Fujian, eastern China. Ore Geol. Rev. 2020, 120, 103412. [Google Scholar] [CrossRef]
- Harris, A.C.; Golding, S.D. New evidence of magmatic–fluid–related phyllic alteration: Implications for the genesis of porphyry Cu deposits. Geology 2002, 30, 335–338. [Google Scholar] [CrossRef]
- Rye, R.O. The evolution of magmatic fluids in the epithermal environment; the stable isotope perspective. Econ. Geol. 1993, 88, 733–752. [Google Scholar] [CrossRef]
- Shmulovich, K.I.; Landwehr, D.; Simon, K.; Heinrich, W. Stable isotope fractionation between liquid and vapour in water–salt systems up to 600 °C. Chem. Geol. 1999, 157, 343–354. [Google Scholar] [CrossRef]
- Guo, X.G.; Gao, J.J.; Zhang, D.H.; Li, J.W.; Xiang, A.P.; Li, C.J.; Wang, S.Y.; Jiao, T.L.; Ren, C.H. Genesis of the Erdaohe skarn Pb–Zn–Ag deposit in the Great Hinggan Range, NE China: Evidence from geology, fluid inclusions, and H–O–S isotope systematics. Ore Geol. Rev. 2022, 140, 104414. [Google Scholar] [CrossRef]
- Lu, H.Z.; Fan, H.R.; Ni, P.; Ou, G.X.; Shen, K.; Zhang, W.H. Fluid Inclusions; Science Press: Beijing, China, 2004; pp. 1–487. (In Chinese) [Google Scholar]
- Sterner, S.M.; Bodnar, R.J. Synthetic fluid inclusions in natural quartz. I. Compositional types synthesized and applications to experimental geochemistry. Geochim. Cosmochim. Acta 1984, 48, 2659–2668. [Google Scholar] [CrossRef]
- Ren, L. Study on the Diagenesis Mechanisms and Metallogenic Model of Skarn-Type Fe-Cu (Mo) Polymetallic Deposit in the Lesser Xing’an Range, NE China. Ph.D. Thesis, Jilin University, Changchun, China, 2017. (In Chinese with English Abstract). [Google Scholar]
- Ramboz, C.; Pichavant, M.; Weisbrod, A. Fluid immiscibility in natural processes: Use and misuse of fluid inclusion data II: Interpretation of fluid inclusion data in terms of immiscibility. Chem. Geol. 1982, 37, 29–48. [Google Scholar] [CrossRef]
- Wilkinson, J.J. Fluid inclusions in hydrothermal ore deposits. Lithos 2001, 55, 229–272. [Google Scholar] [CrossRef]
- Roedder, E.; Bodnar, R.J. Geologic pressure determinations from fluid inclusion studies. Annu. Rev. Earth Plant. Sci. 1980, 8, 263–301. [Google Scholar] [CrossRef]
- Brown, P.E.; Hagemann, S.G. MacFlincor and its application to fluids in Archean lode–gold deposits. Geochim. Cosmochim. Acta 1995, 59, 3943–3952. [Google Scholar] [CrossRef]
- Driesner, T.; Heinrich, C.A. The system H2O–NaCl. Part I: Correlation formulae for phase relations in temperature–pressure– composition space from 0 to 1000 °C, 0 to 5000 bar, and 0 to 1 X NaCl. Geochim. Cosmochim. Acta. 2007, 71, 4880–4901. [Google Scholar] [CrossRef]
- Zhou, Z.H.; Mao, J.W. Metallogenic patterns and ore deposit model of the tin polymetallic deposits in the southern segment of Great Xing’an Range. Earth Sci. Front. 2022, 29, 176–199, (In Chinese with English Abstract). [Google Scholar]
- Zhang, B.H.; Cao, H.; Liu, F.Y.; Wang, F.X. Granite age and petrogeochemistry of skarn–type iron–tin deposits in the southern Great Khingan Mountains. Geol. Bull. China 2023. (In Chinese with English Abstract). [Google Scholar]
- Zhou, Z.H.; Lv, L.S.; Feng, J.R.; Li, C.; Li, T. Molybdenite Re–Os ages of Huanggang skarn Sn-Fe deposit and their geological significance, Inner Mongolia. Acta Geol. Sin. 2010, 26, 667–679, (In Chinese with English Abstract). [Google Scholar]
- Yao, M.J.; Gao, Y.; Liu, J.J.; Zhai, D.G. Isotope age of Re–Os in molybdenite and genetic implication of Huanggangliang Fe-Sn deposit in Inner Mongolia. Miner. Explor. 2016, 7, 399–403. [Google Scholar]
- Baker, T.; Lang, J.R. Reconciling fluid inclusion types, fluid processes, and fluid sources in skarns: An example from the Bismark Deposit, Mexico. Miner. Depos. 2003, 38, 474–495. [Google Scholar] [CrossRef]
- Baker, T.; Vanachterberg, E.; Ryan, C.G.; Lang, J.R. Composition and evolution of ore fluids in a magmatic–hydrothermal skarn deposit. Geology 2004, 32, 117–120. [Google Scholar] [CrossRef]
- Sun, Q.F.; Wang, K.Y.; Wang, Y.C.; Yang, H.; Li, J.; Ma, X.L. Fluid evolution and ore genesis of the Chaobuleng skarn Fe-Zn polymetallic deposit, Northeast China: Evidence from fluid inclusions, C–O–S–Pb isotopes, and geochronology. J. Geochem. Explor. 2021, 227, 106796. [Google Scholar] [CrossRef]
- Wang, R.L. Metallogenic Mechanism of the Baiyinnuoer Pb-Zn Deposit in the Southern Great Xing’an Range. Ph.D. Thesis, China University of Geosciences, Beijing, China, 2023. (In Chinese with English Abstract). [Google Scholar]
- Wang, F.; Zhou, X.H.; Zhang, L.C.; Ying, J.F.; Zhang, Y.T.; Wu, F.Y.; Zhu, R.X. Late Mesozoic volcanism in the Great Xing’an Range (NE China): Timing and implications for the dynamic setting of NE Asia. Earth Planet. Sci. Lett. 2006, 251, 179–198. [Google Scholar] [CrossRef]
- Ma, X.L. Study on the Mineralization of Copper Polymetallic Deposits in the East Slope of Southern Great Xing’an Range. Ph.D. Thesis, Jilin University, Changchun, China, 2020. (In Chinese with English Abstract). [Google Scholar]
- Qin, T. The Geochemical and Petrogenetic Studies on Late Mesozoic Volcanic Rocks in the Central Segment of Great Xing’an Range. Ph.D. Thesis, Jilin University, Changchun, China, 2022. (In Chinese with English Abstract). [Google Scholar]
- Sun, Q.F. Study of Pb-Zn Polymetallic Mineralization in the Southern Section of the Tianshan-Tuquan Metallogenic Subzone of the Great Xing’an Range. Ph.D. Thesis, Jilin University, Changchun, China, 2023. (In Chinese with English Abstract). [Google Scholar]
- Zhao, C.T.; Sun, J.G.; Chu, X.L.; Qin, K.Z.; Ren, L.; Xu, Z.K.; Liu, Y.; Han, J.L.; Bai, C.L.; Shu, W. Metallogeny of the Ergu Fe-Zn polymetallic deposit, central Lesser Xing’an Range, NE China: Evidence from skarn mineralogy, fluid inclusions and H–O–S–Pb isotopes. Ore Geol. Rev. 2021, 135, 104227. [Google Scholar] [CrossRef]
- Zhao, C.T. Mineralization, Metallogenic Model and Geodynamic Setting of Skarn type Au-Fe-Cu Polymetallic Deposits in the Central of Heilongjiang Province. Ph.D. Thesis, Jilin University, Changchun, China, 2021. (In Chinese with English Abstract). [Google Scholar]
- Jackson, K.J.; Helgeson, H.C. Chemical and thermodynamic constraints on the hydrothermal transport and deposition of tin: I. Calculation of the solubility of cassiterite at high pressures and temperatures. Geochim. Cosmochim. Acta 1985, 49, 1–22. [Google Scholar] [CrossRef]
- Heinrich, C.A. The chemistry of hydrothermal tin(-tungsten) ore deposition. Econ. Geol. 1990, 85, 457–481. [Google Scholar] [CrossRef]
- Halter, W.E.; Williams-Jones, A.E.; Kontak, D.J. Modeling fluid–rock interaction during greisenization at the East Kemptville tin deposit: Implications for mineralization. Chem. Geol. 1998, 150, 1–17. [Google Scholar] [CrossRef]


Disclaimer/Publisher’s Note: The statements, opinions and data contained in all publications are solely those of the individual author(s) and contributor(s) and not of MDPI and/or the editor(s). MDPI and/or the editor(s) disclaim responsibility for any injury to people or property resulting from any ideas, methods, instructions or products referred to in the content. |
© 2025 by the authors. Licensee MDPI, Basel, Switzerland. This article is an open access article distributed under the terms and conditions of the Creative Commons Attribution (CC BY) license (https://creativecommons.org/licenses/by/4.0/).
Share and Cite
Xue, H.; Wang, K.; Sun, Q.; Chen, J.; Wang, X.; Li, H. Ore Genesis of the Huanggang Iron-Tin-Polymetallic Deposit, Inner Mongolia: Constraints from Fluid Inclusions, H–O–C Isotopes, and U-Pb Dating of Garnet and Zircon. Minerals 2025, 15, 518. https://doi.org/10.3390/min15050518
Xue H, Wang K, Sun Q, Chen J, Wang X, Li H. Ore Genesis of the Huanggang Iron-Tin-Polymetallic Deposit, Inner Mongolia: Constraints from Fluid Inclusions, H–O–C Isotopes, and U-Pb Dating of Garnet and Zircon. Minerals. 2025; 15(5):518. https://doi.org/10.3390/min15050518
Chicago/Turabian StyleXue, Hanwen, Keyong Wang, Qingfei Sun, Junchi Chen, Xue Wang, and Haoming Li. 2025. "Ore Genesis of the Huanggang Iron-Tin-Polymetallic Deposit, Inner Mongolia: Constraints from Fluid Inclusions, H–O–C Isotopes, and U-Pb Dating of Garnet and Zircon" Minerals 15, no. 5: 518. https://doi.org/10.3390/min15050518
APA StyleXue, H., Wang, K., Sun, Q., Chen, J., Wang, X., & Li, H. (2025). Ore Genesis of the Huanggang Iron-Tin-Polymetallic Deposit, Inner Mongolia: Constraints from Fluid Inclusions, H–O–C Isotopes, and U-Pb Dating of Garnet and Zircon. Minerals, 15(5), 518. https://doi.org/10.3390/min15050518