
The Geochemical Characteristics of Ore-Forming Fluids in the Jebel Stah Fluorite Deposit in Northeast Tunisia: Insights from LA-ICP-MS and Sr Isotope Analyses

 , ,
, ,  , ,
, ,  ,
,  ,
, 
Abstract
1. Introduction

| Locality | Fluorite Generation | Mean Th ± 5 (°C) | Mean Salinity ± 1 (wt% eq. NaCl) | Reference |
|---|---|---|---|---|
| Jebel Stah | 1 | 130 | 19.5 | [25,27] |
| 2 | 175 | 10 | ||
| Hammam Zriba | 1 | 125 | 13 | [24] |
| 2 | 135 | 15 | ||
| 3 | 170 | 17 | ||
| Sidi Taya | - | 130 | 19.5 | [25] |
| Jebel Mecella | - | 138 | 18.75 | [30] |
| Jebel Oust | - | 202 | 32 | [25] |
| Oued M’tak | - | 120–140 | 14–17 | [30] |
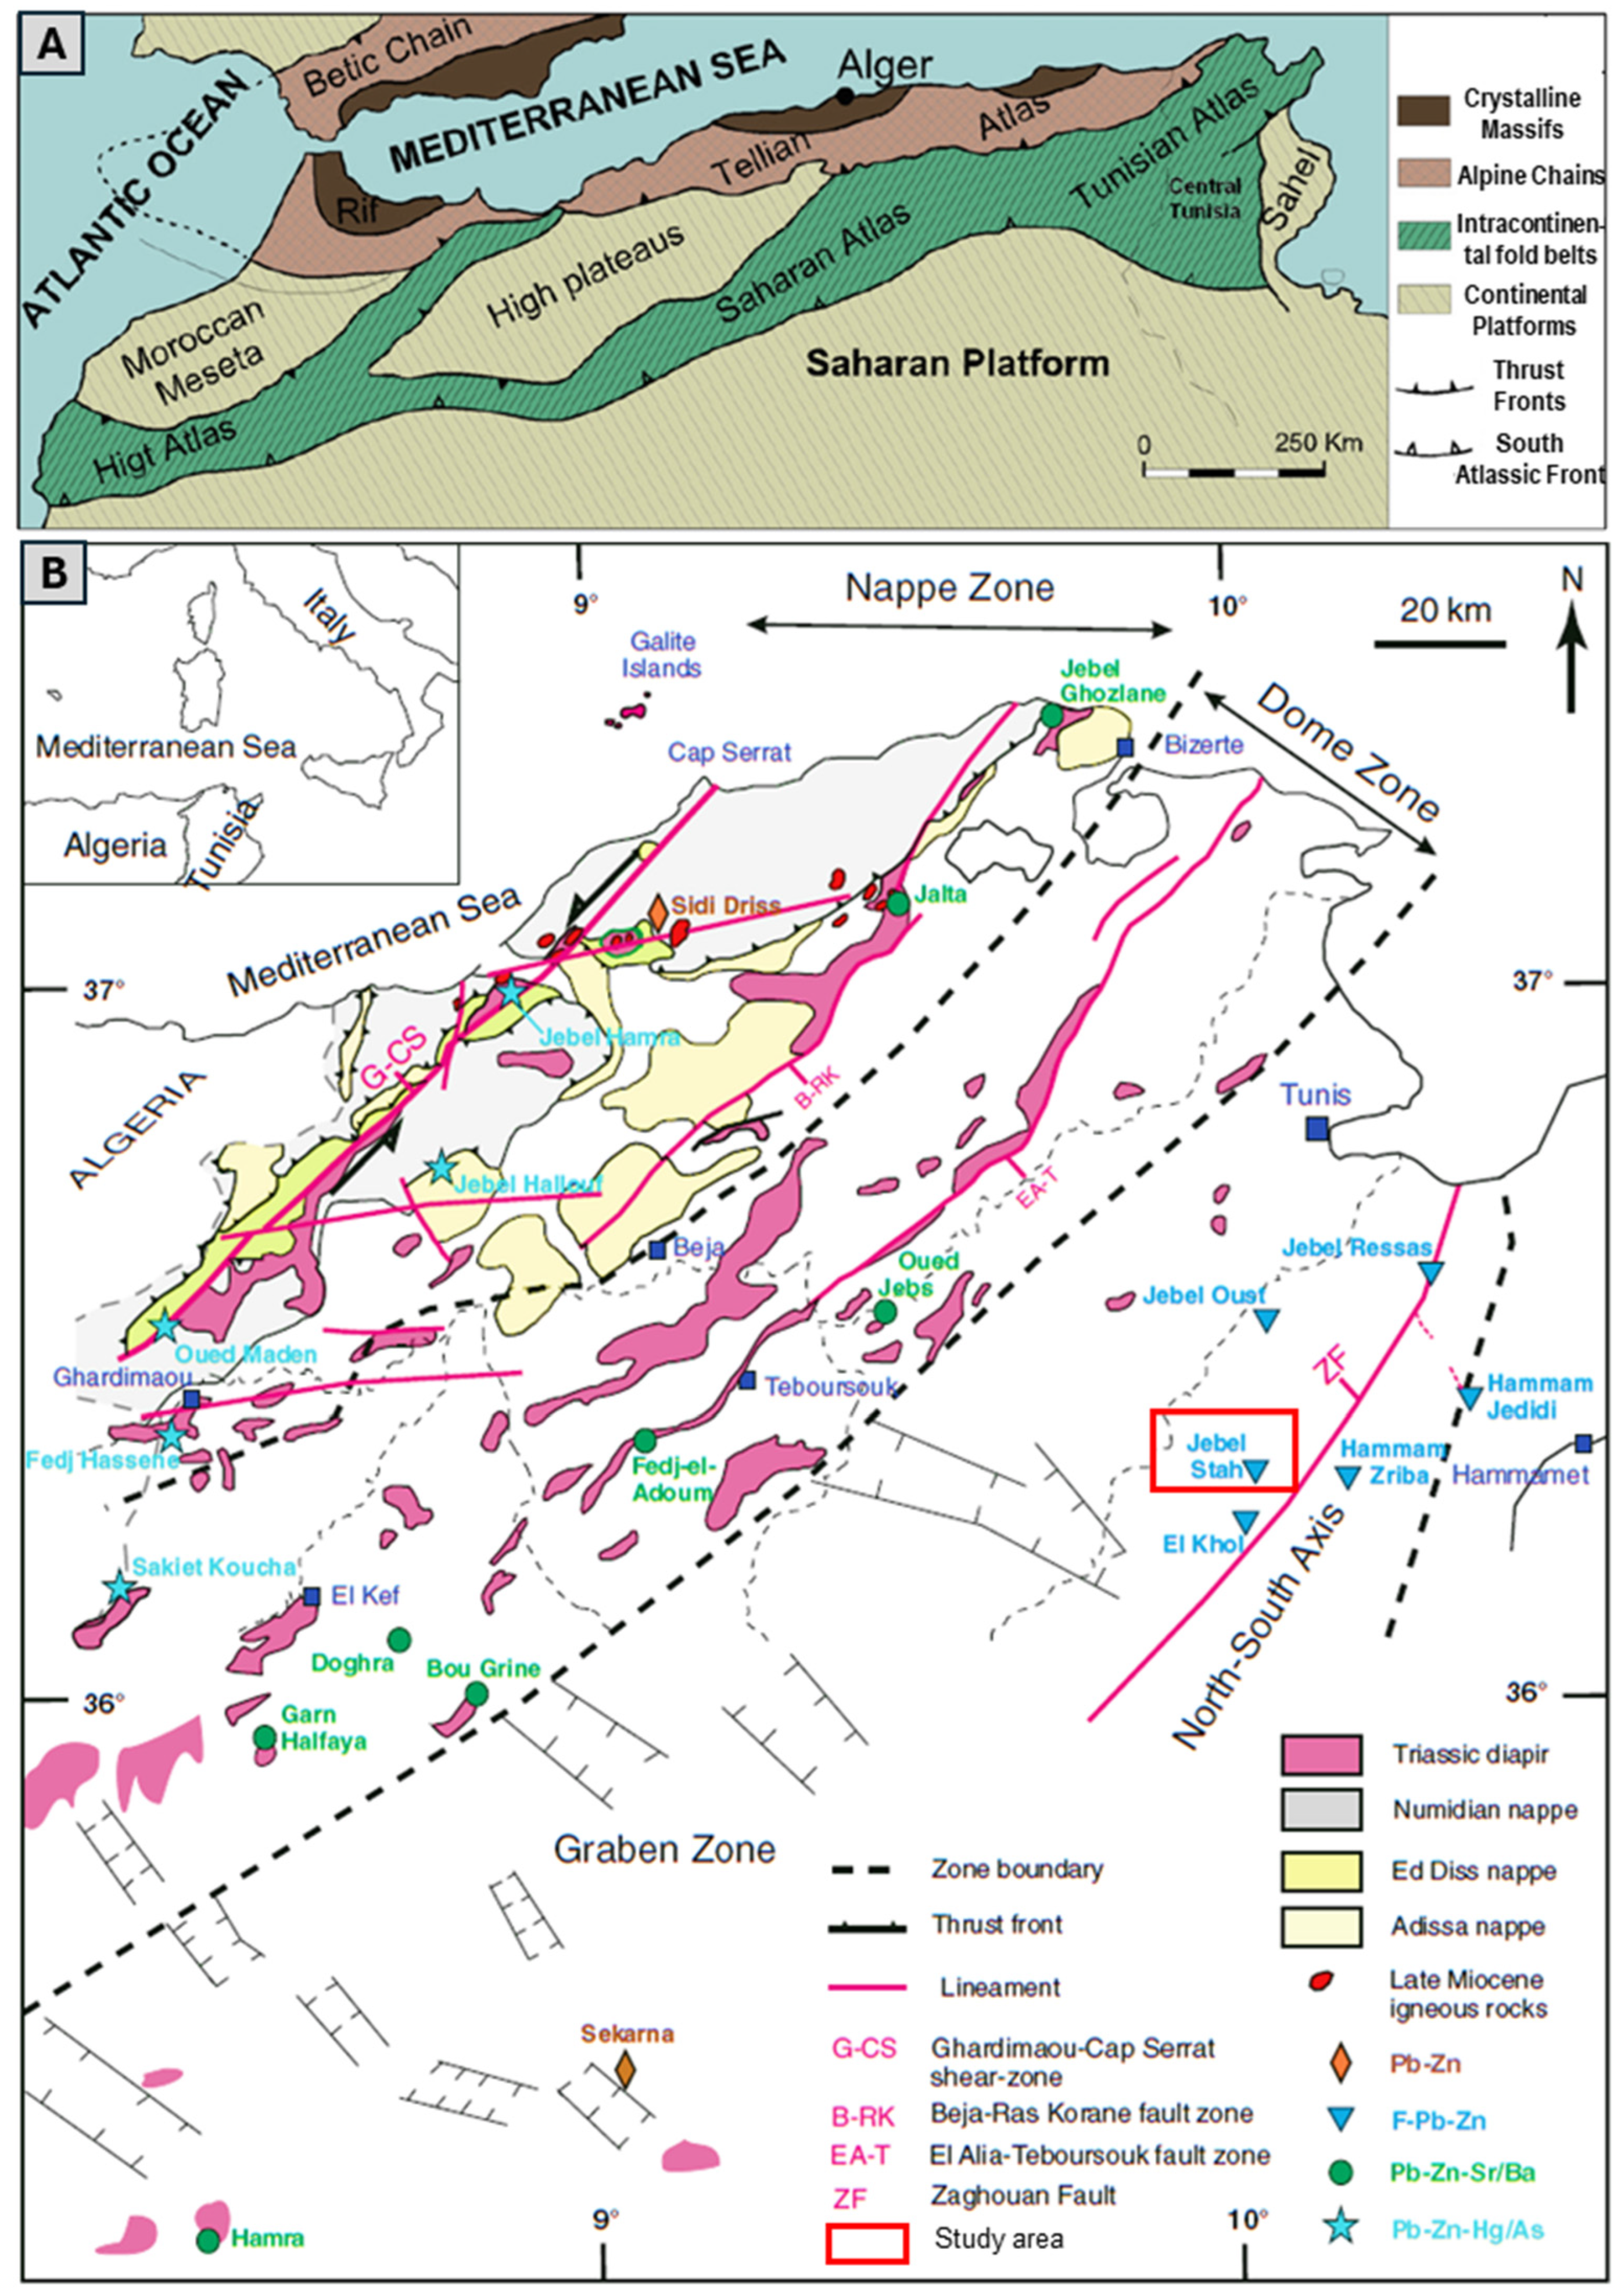

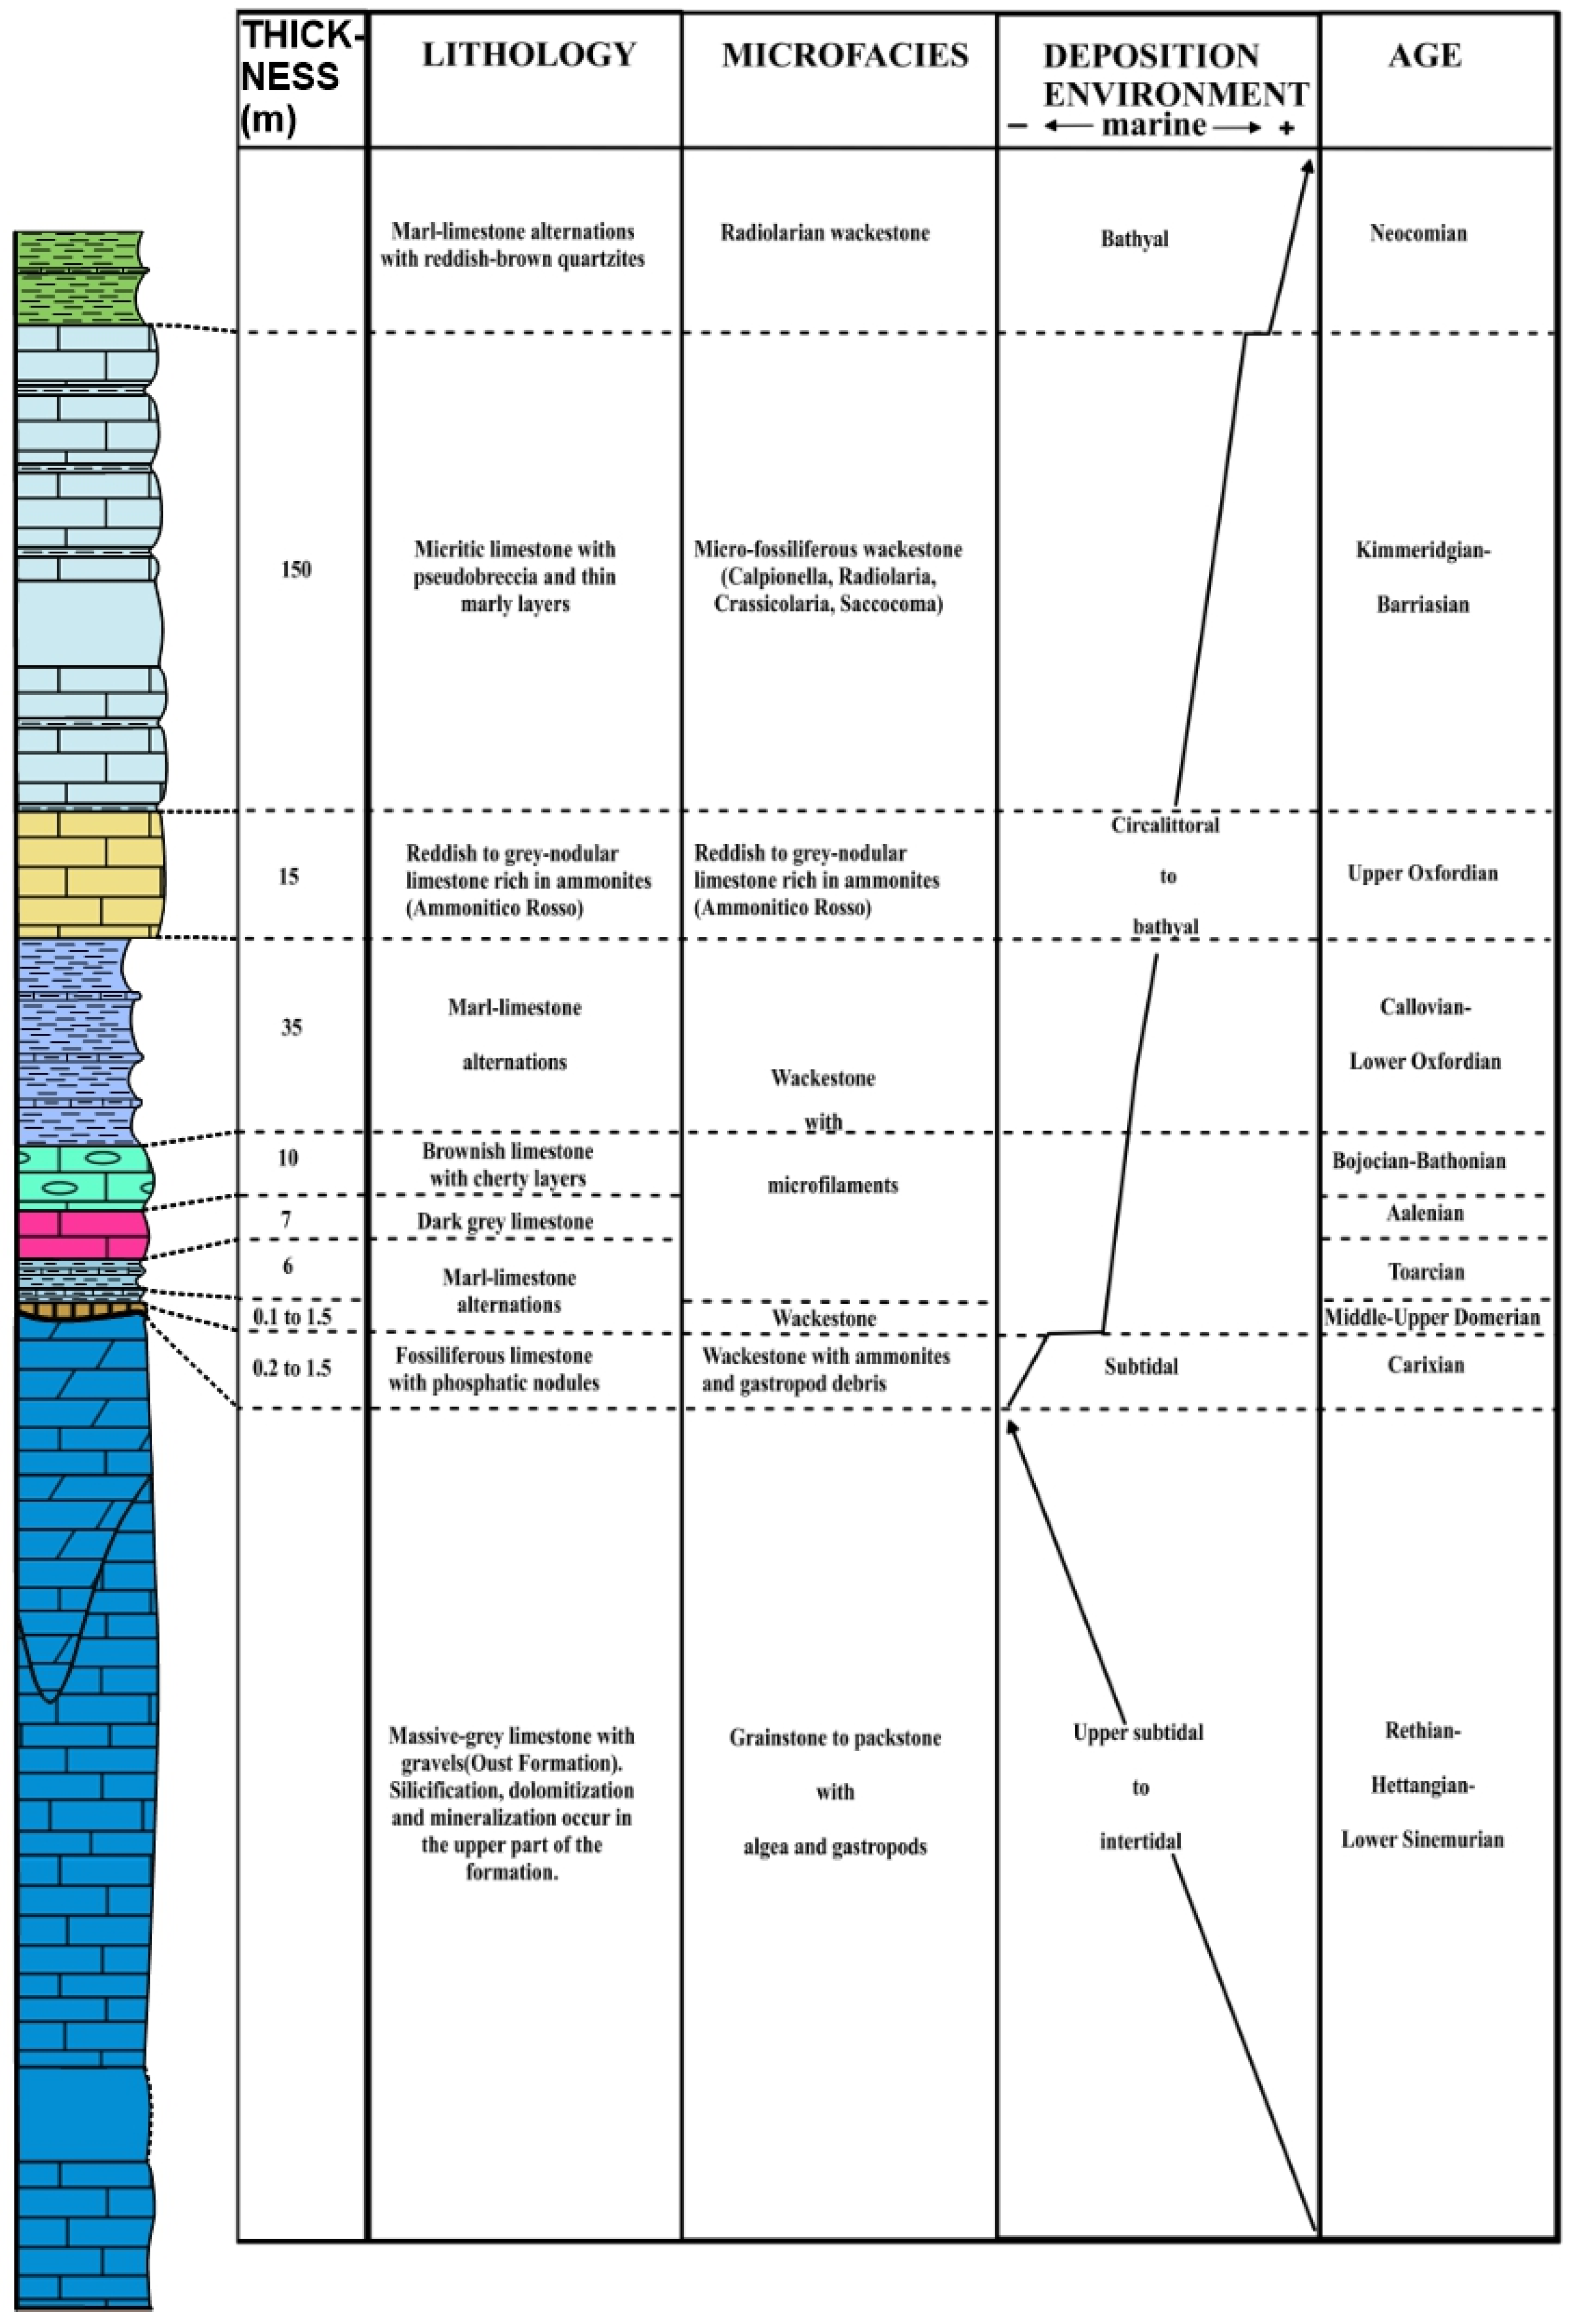
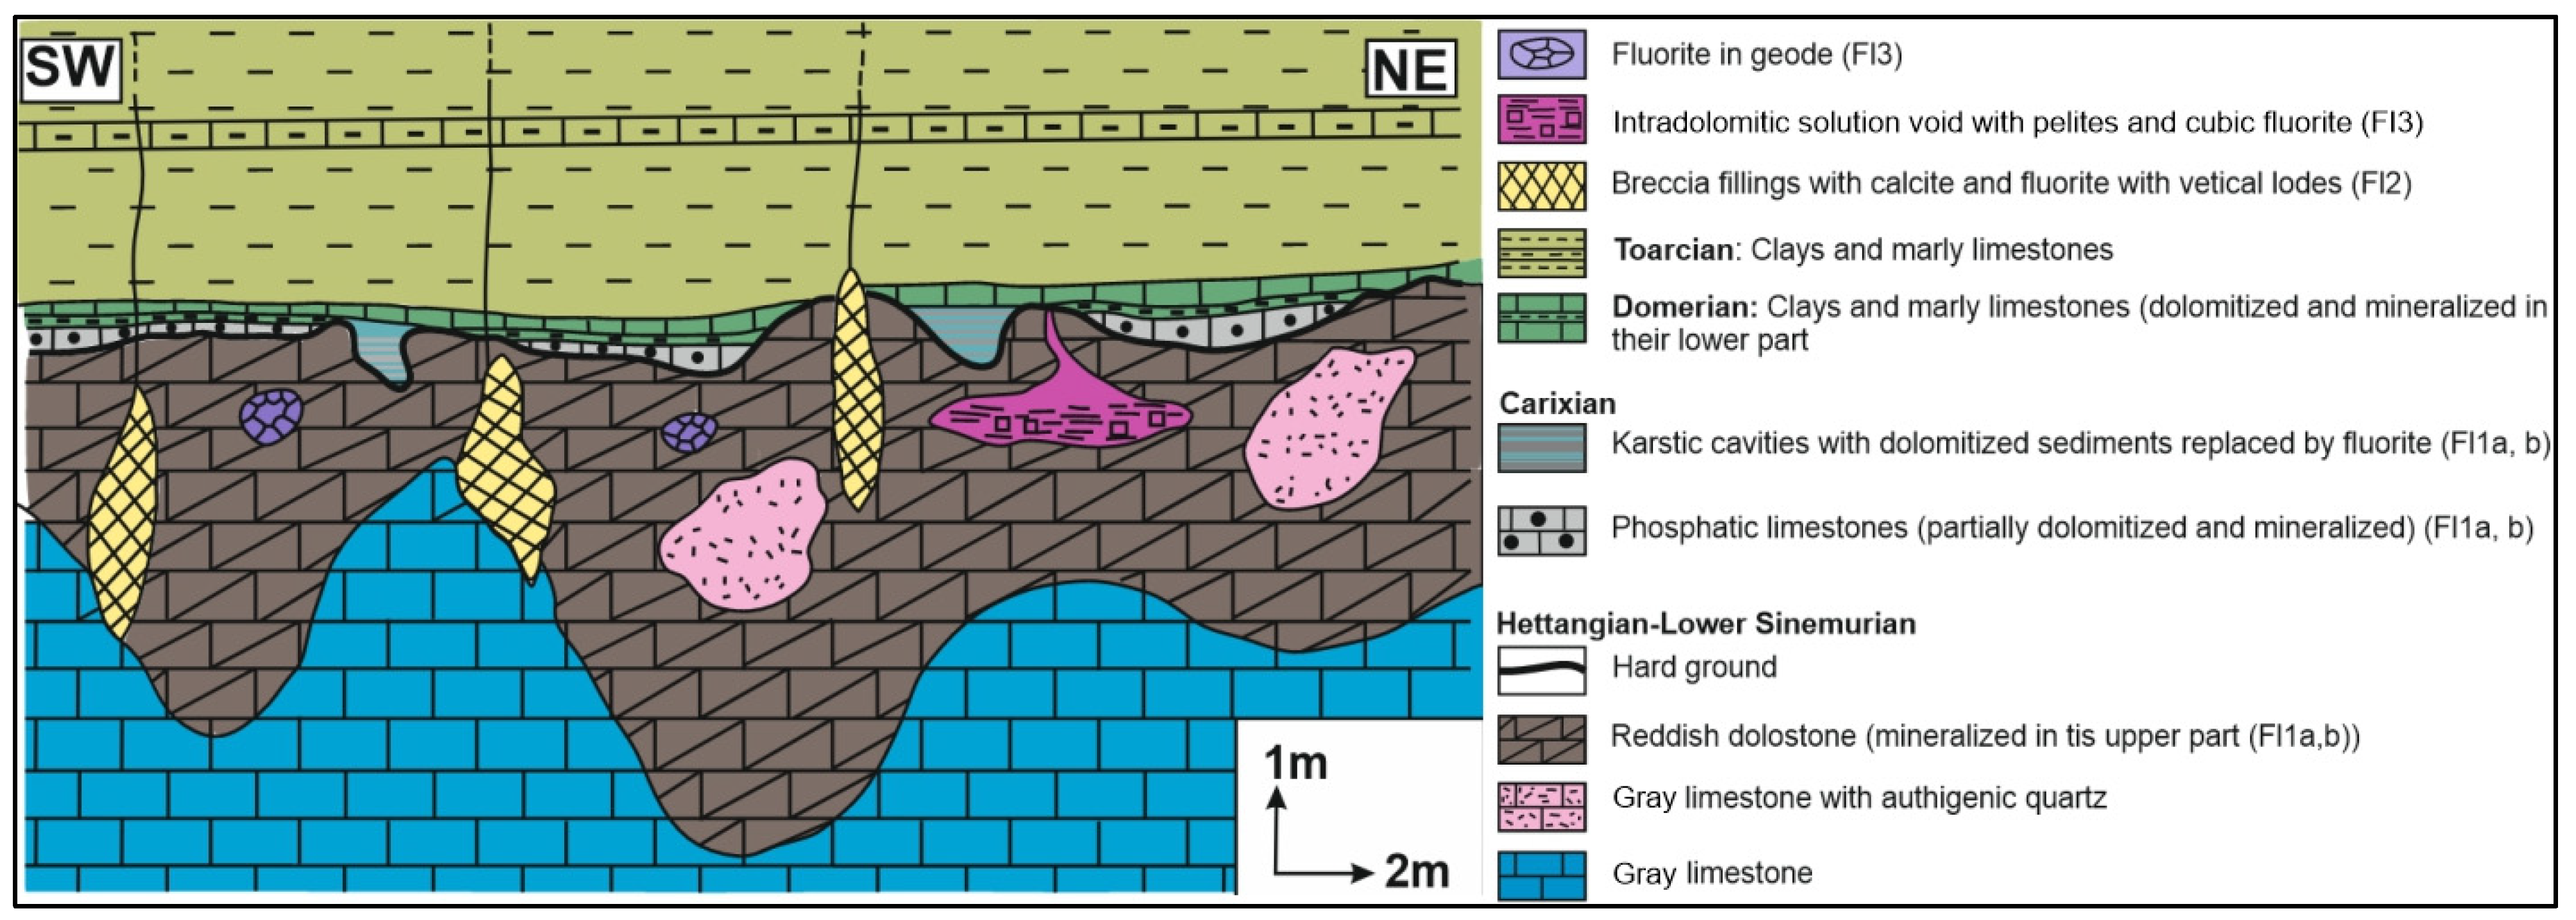
2. Lithostratigraphy and Main Syngenetic/Epigenetic Events
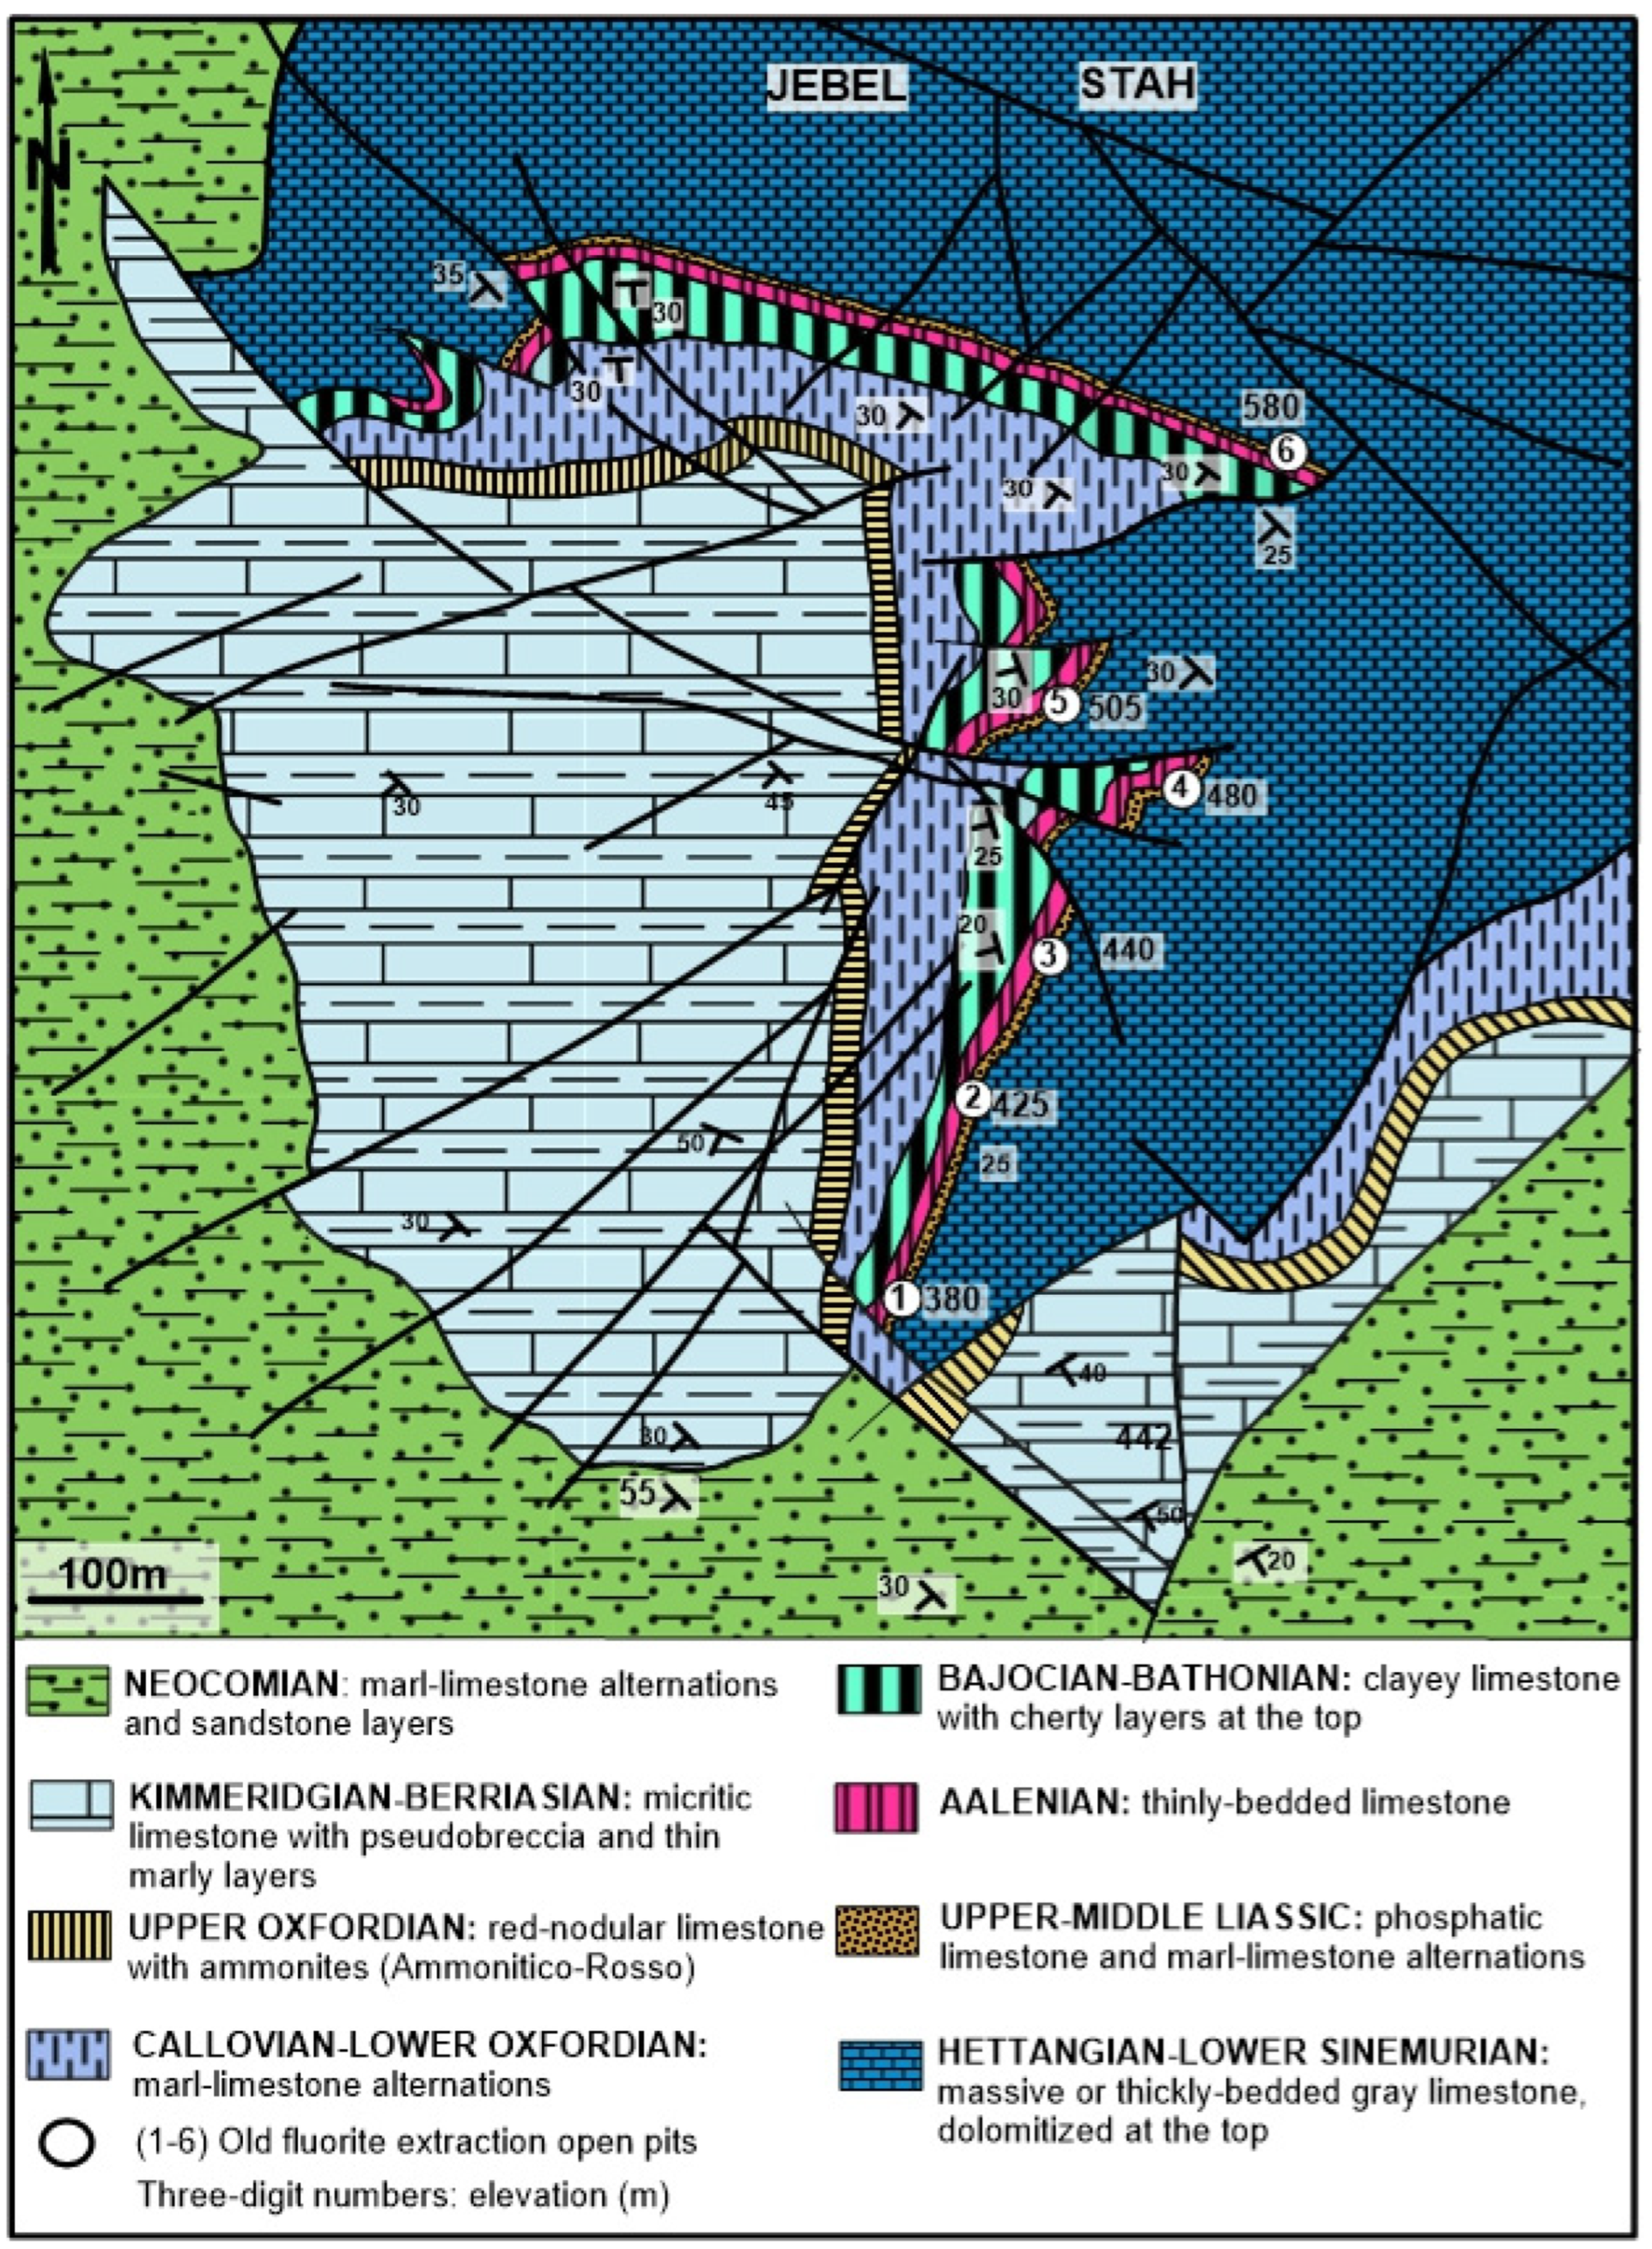
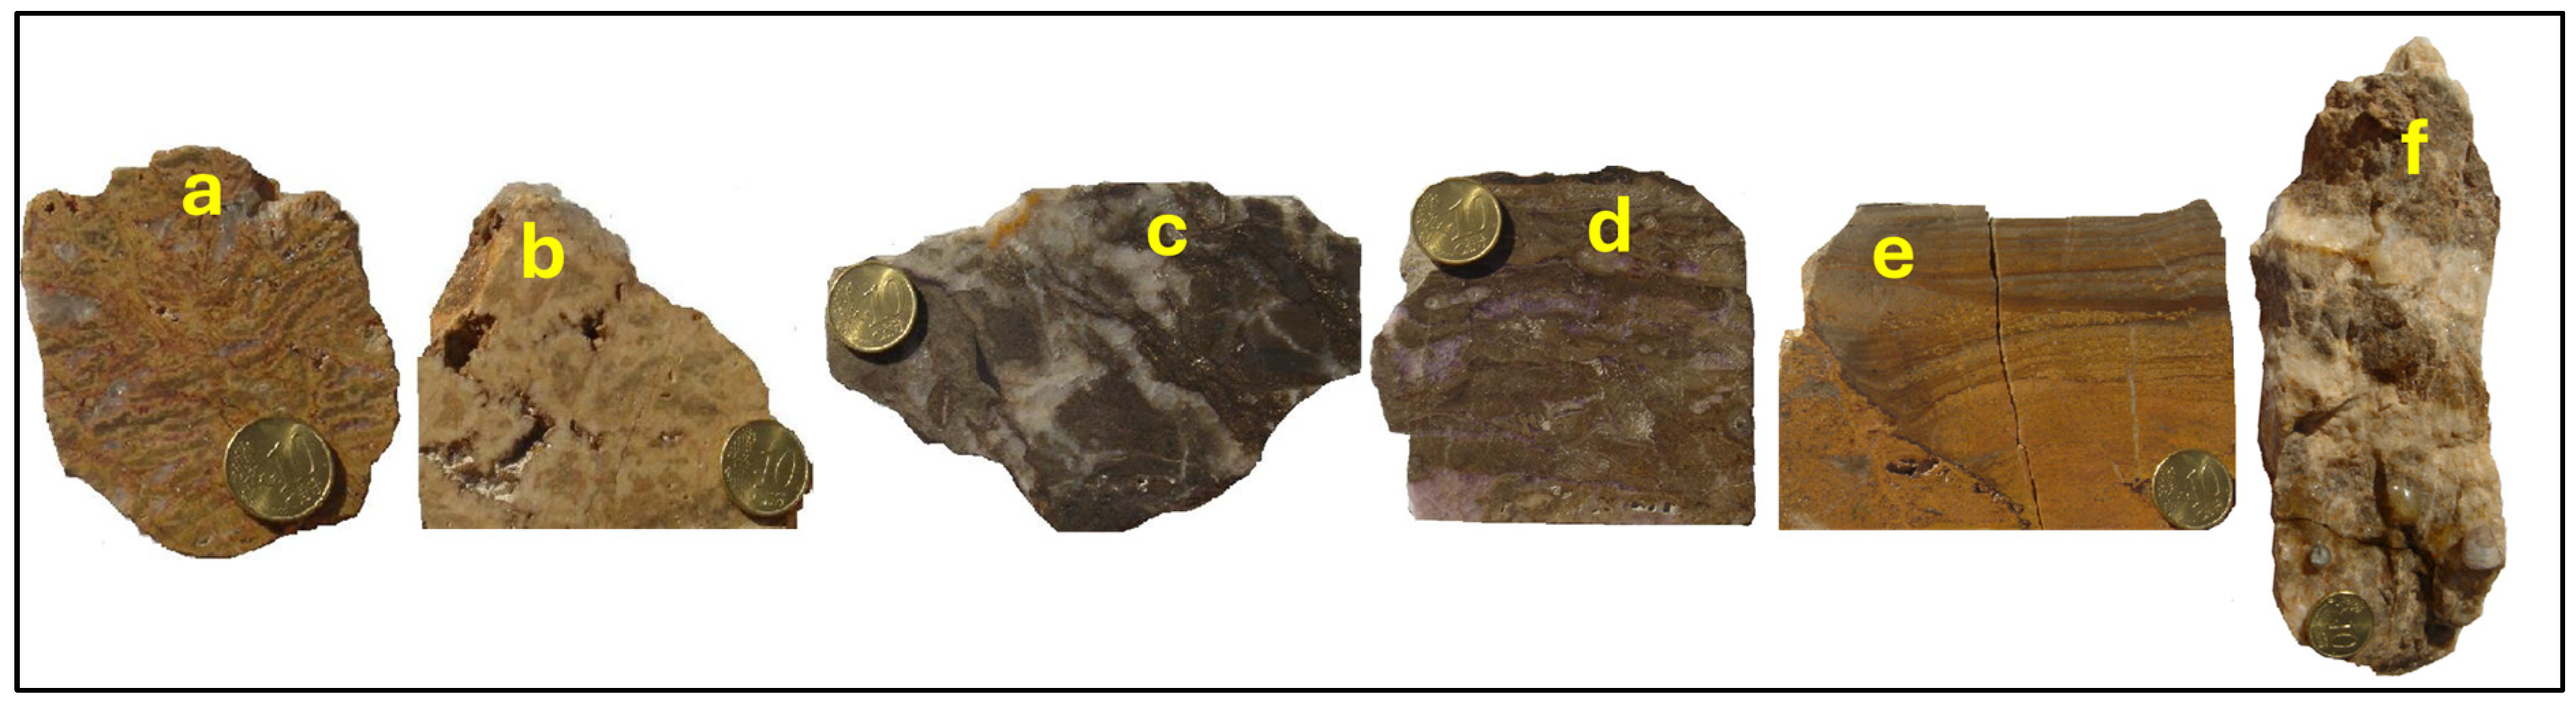
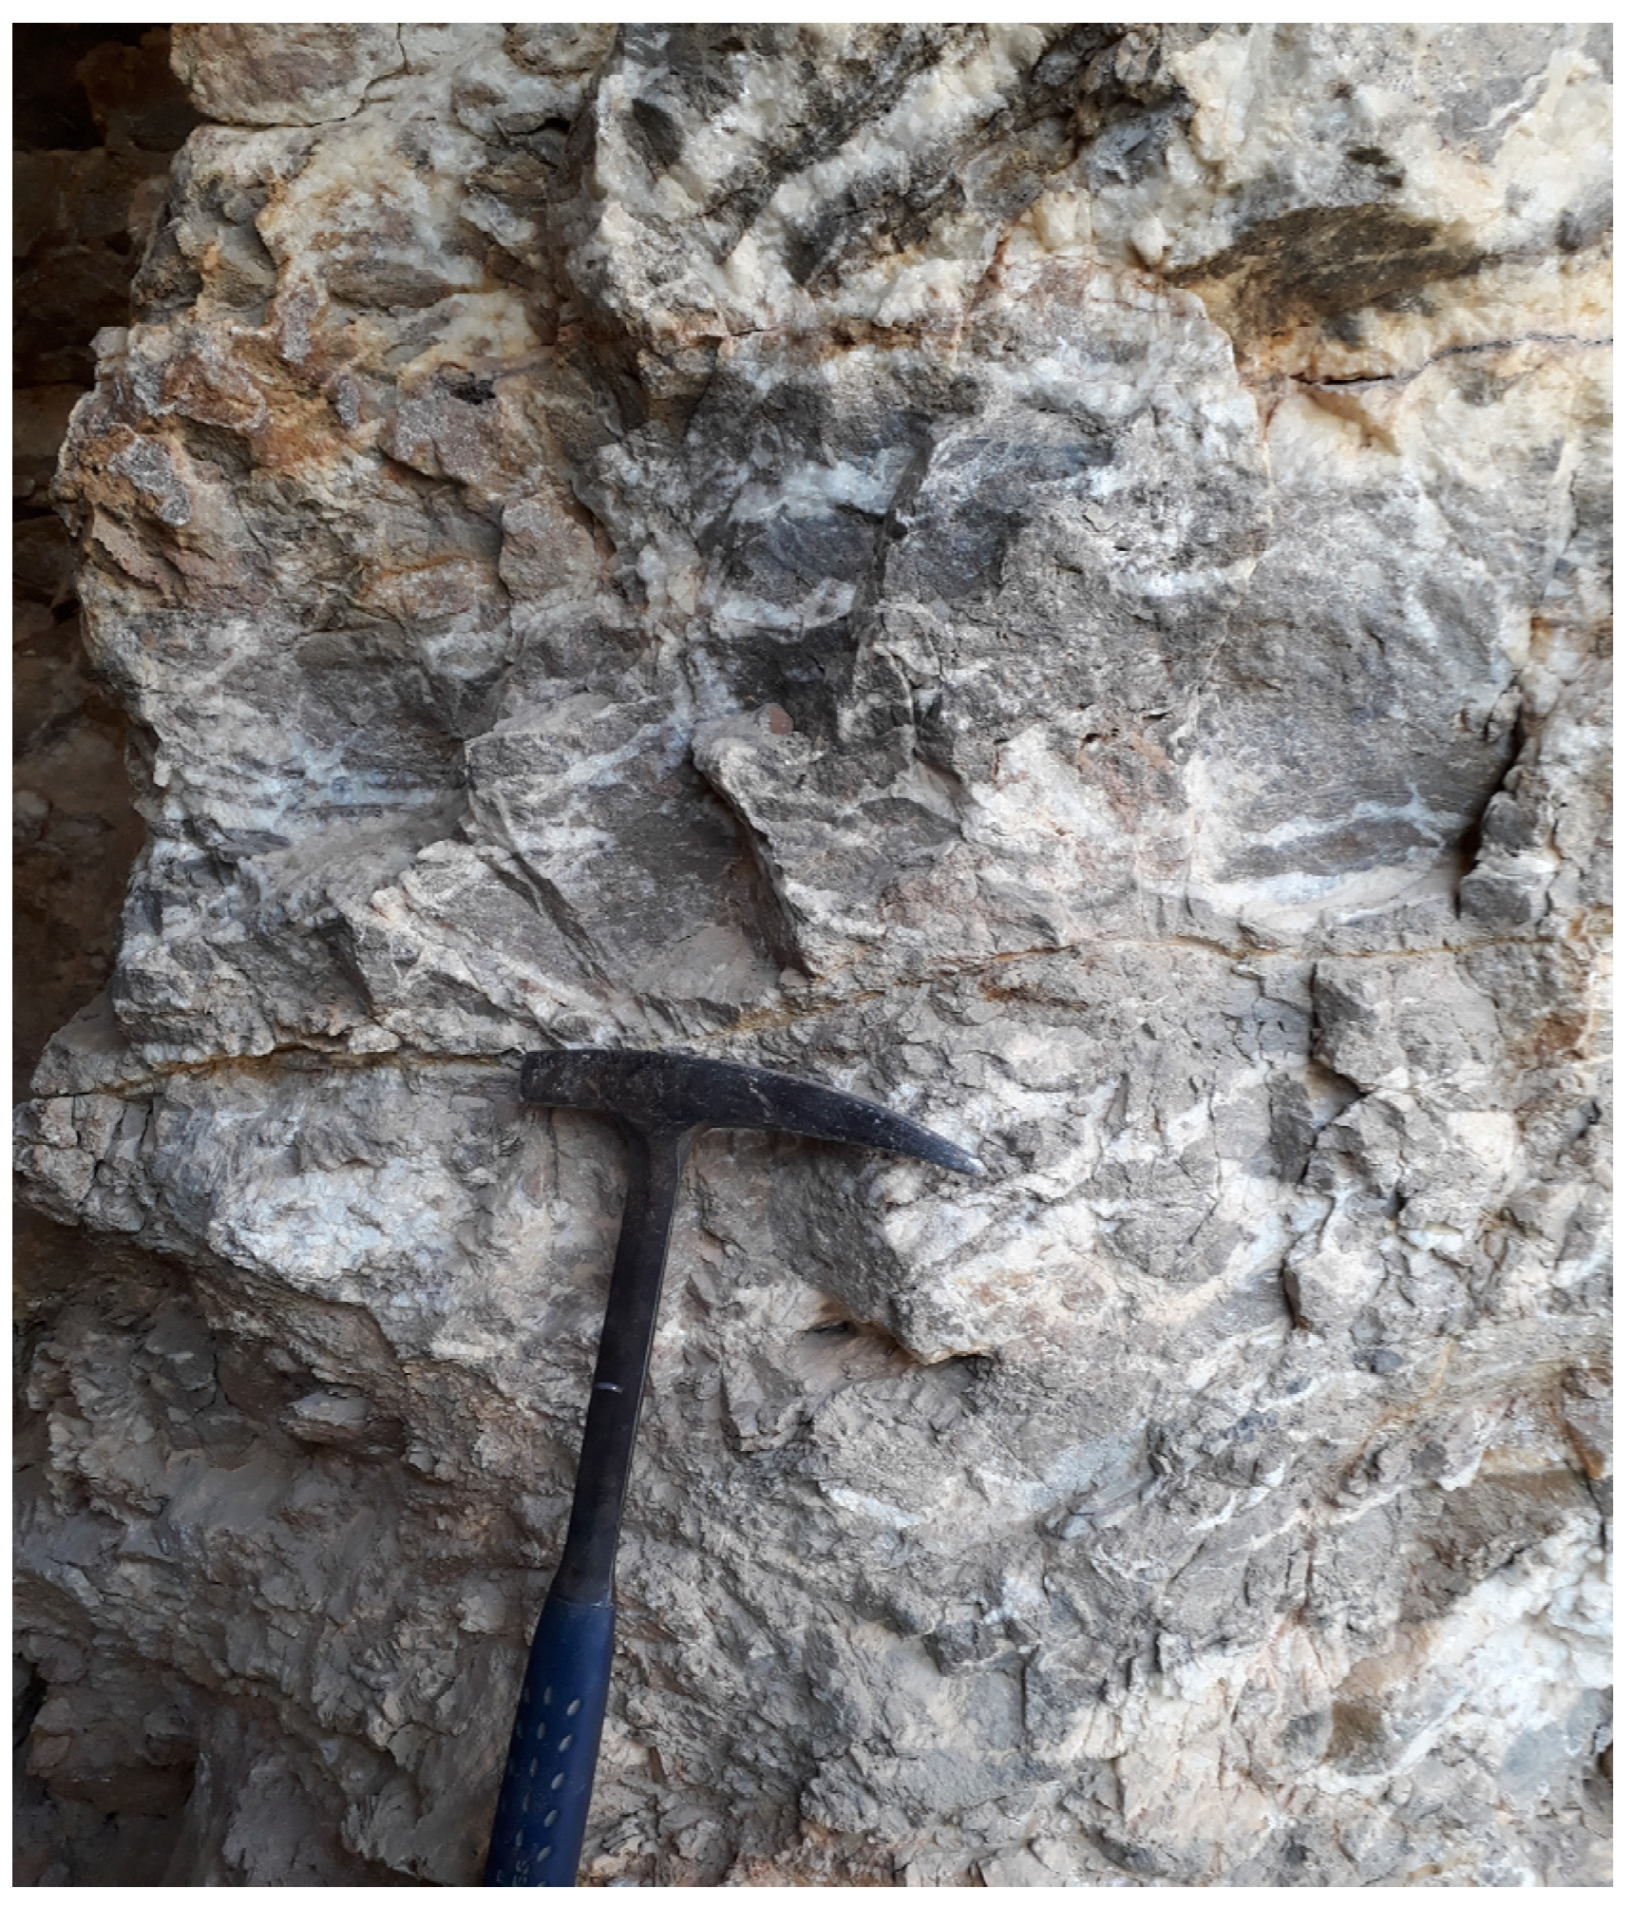
3. Ore Deposit Morphology and Petrography
4. Sampling and Analytical Techniques
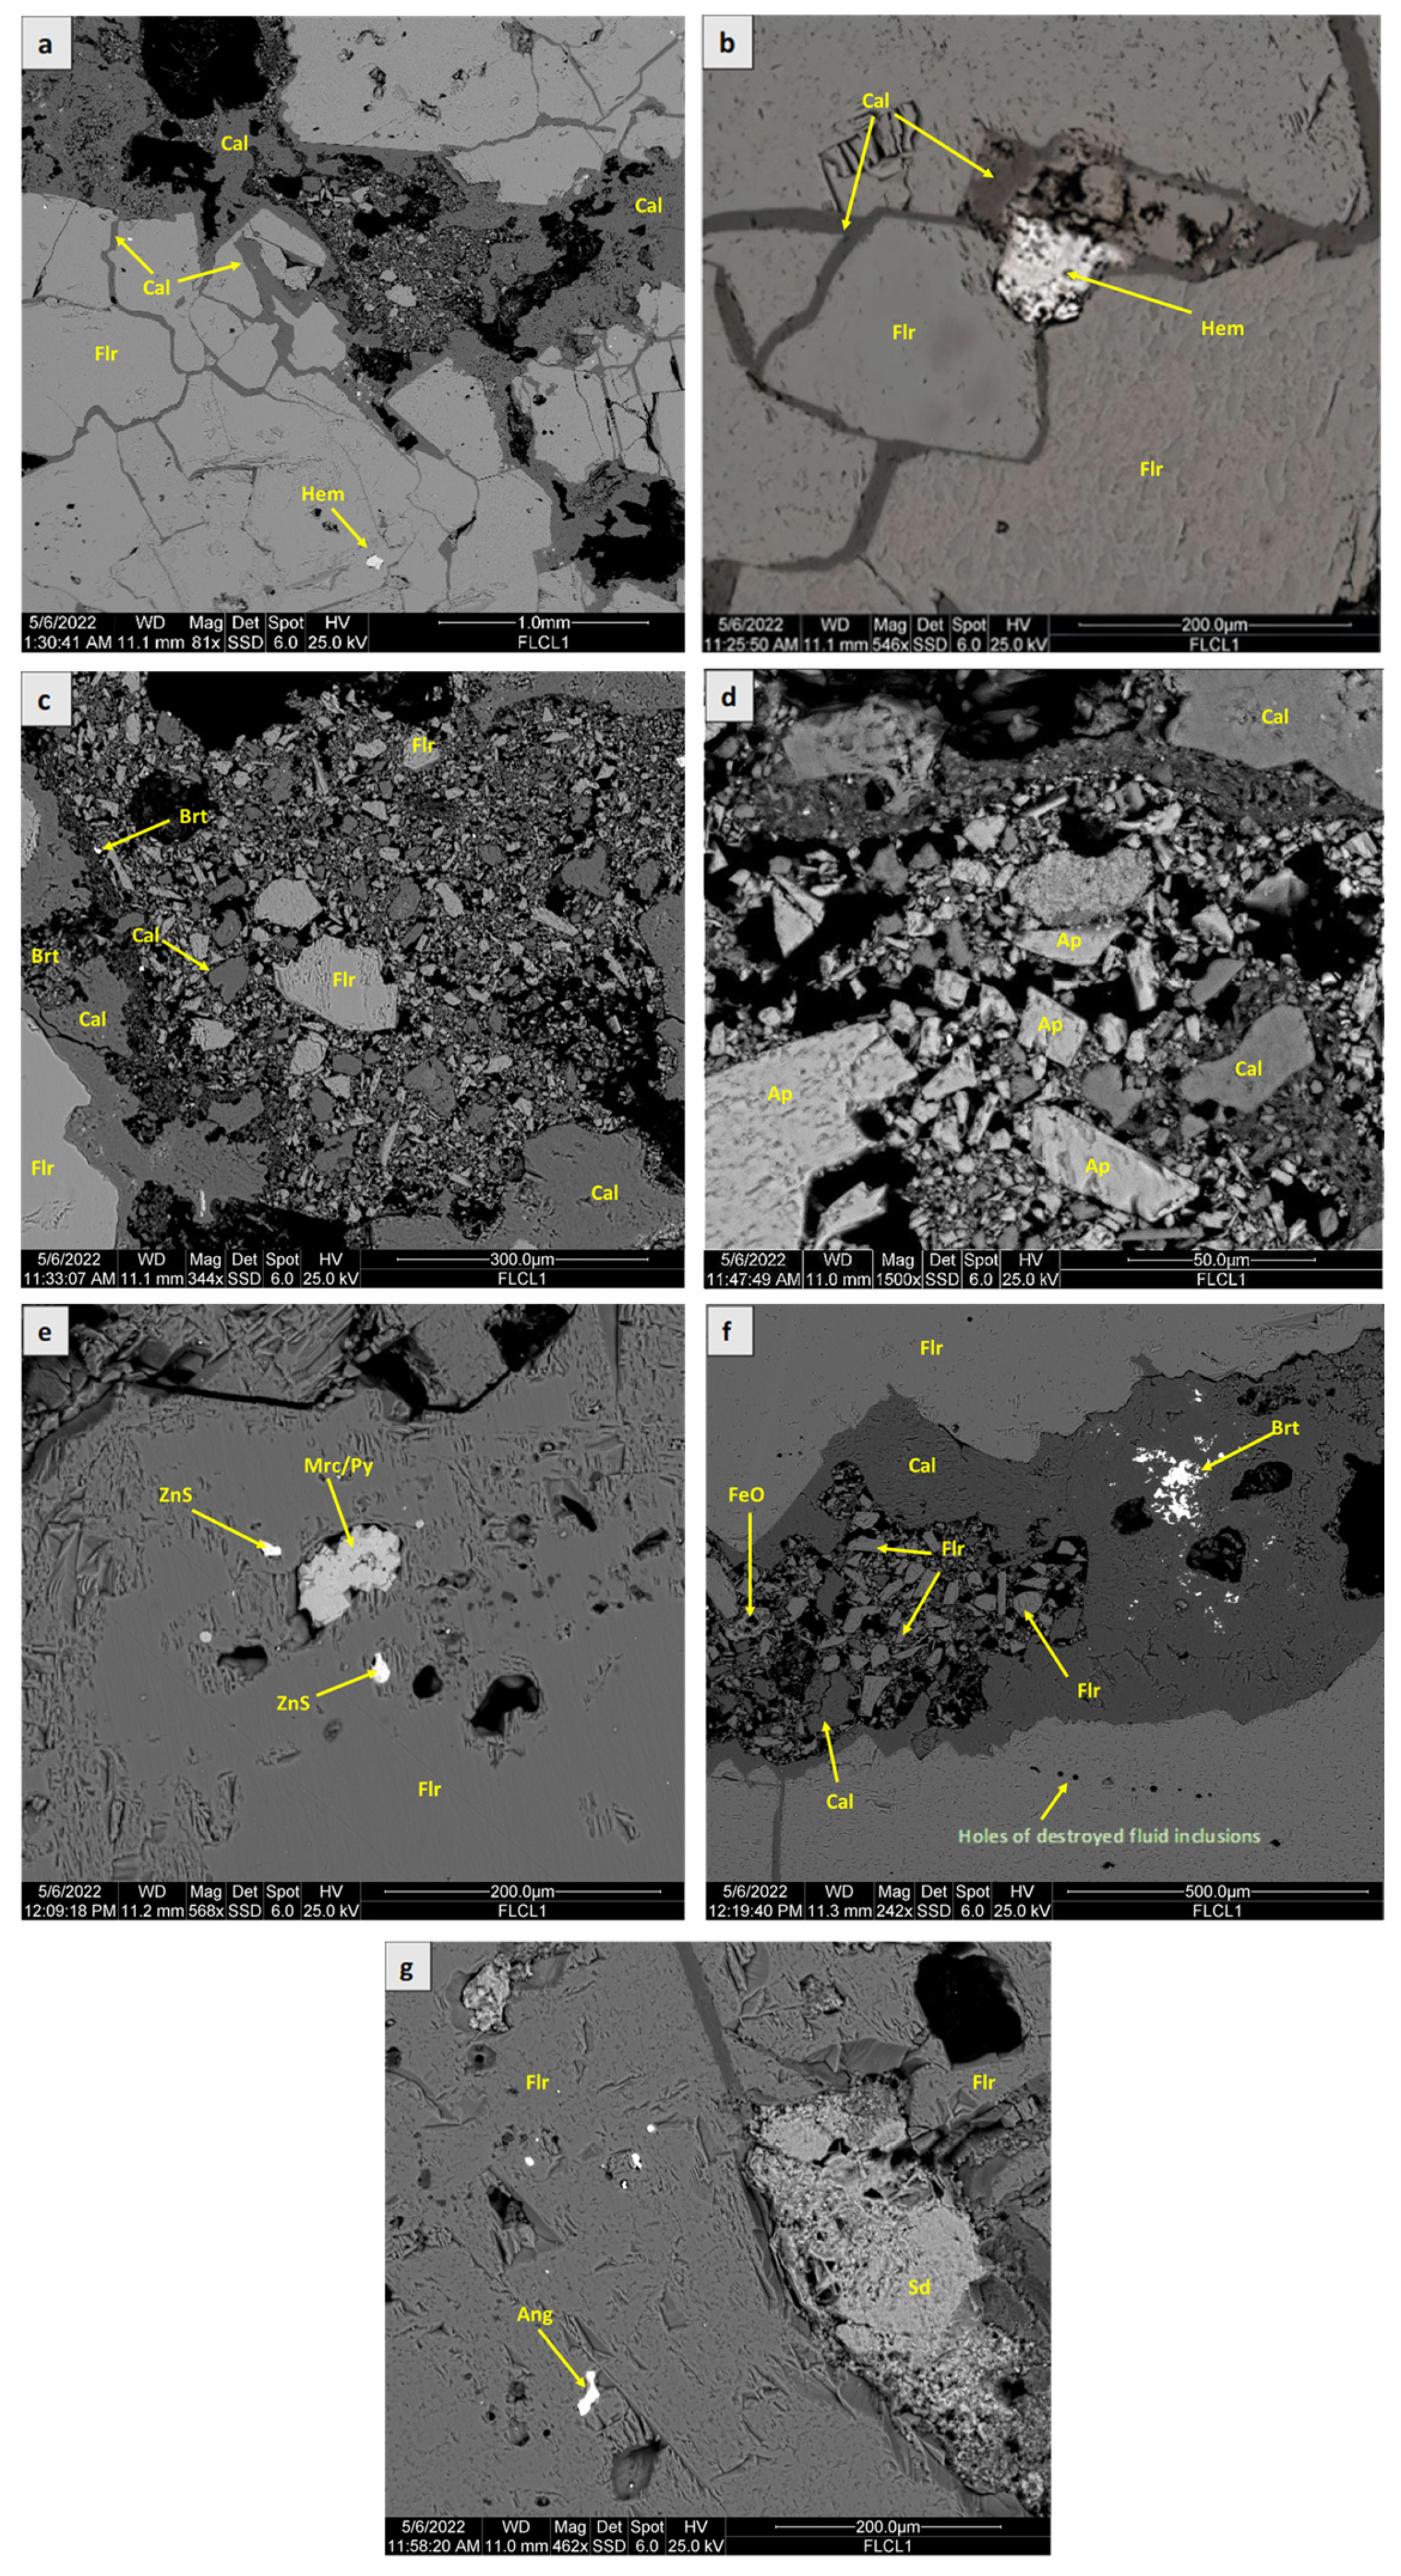
4.1. SEM-EDS Analysis
4.2. LA-ICP-MS for REE Analysis
4.3. TIMS for Sr Isotope Analysis
5. Results
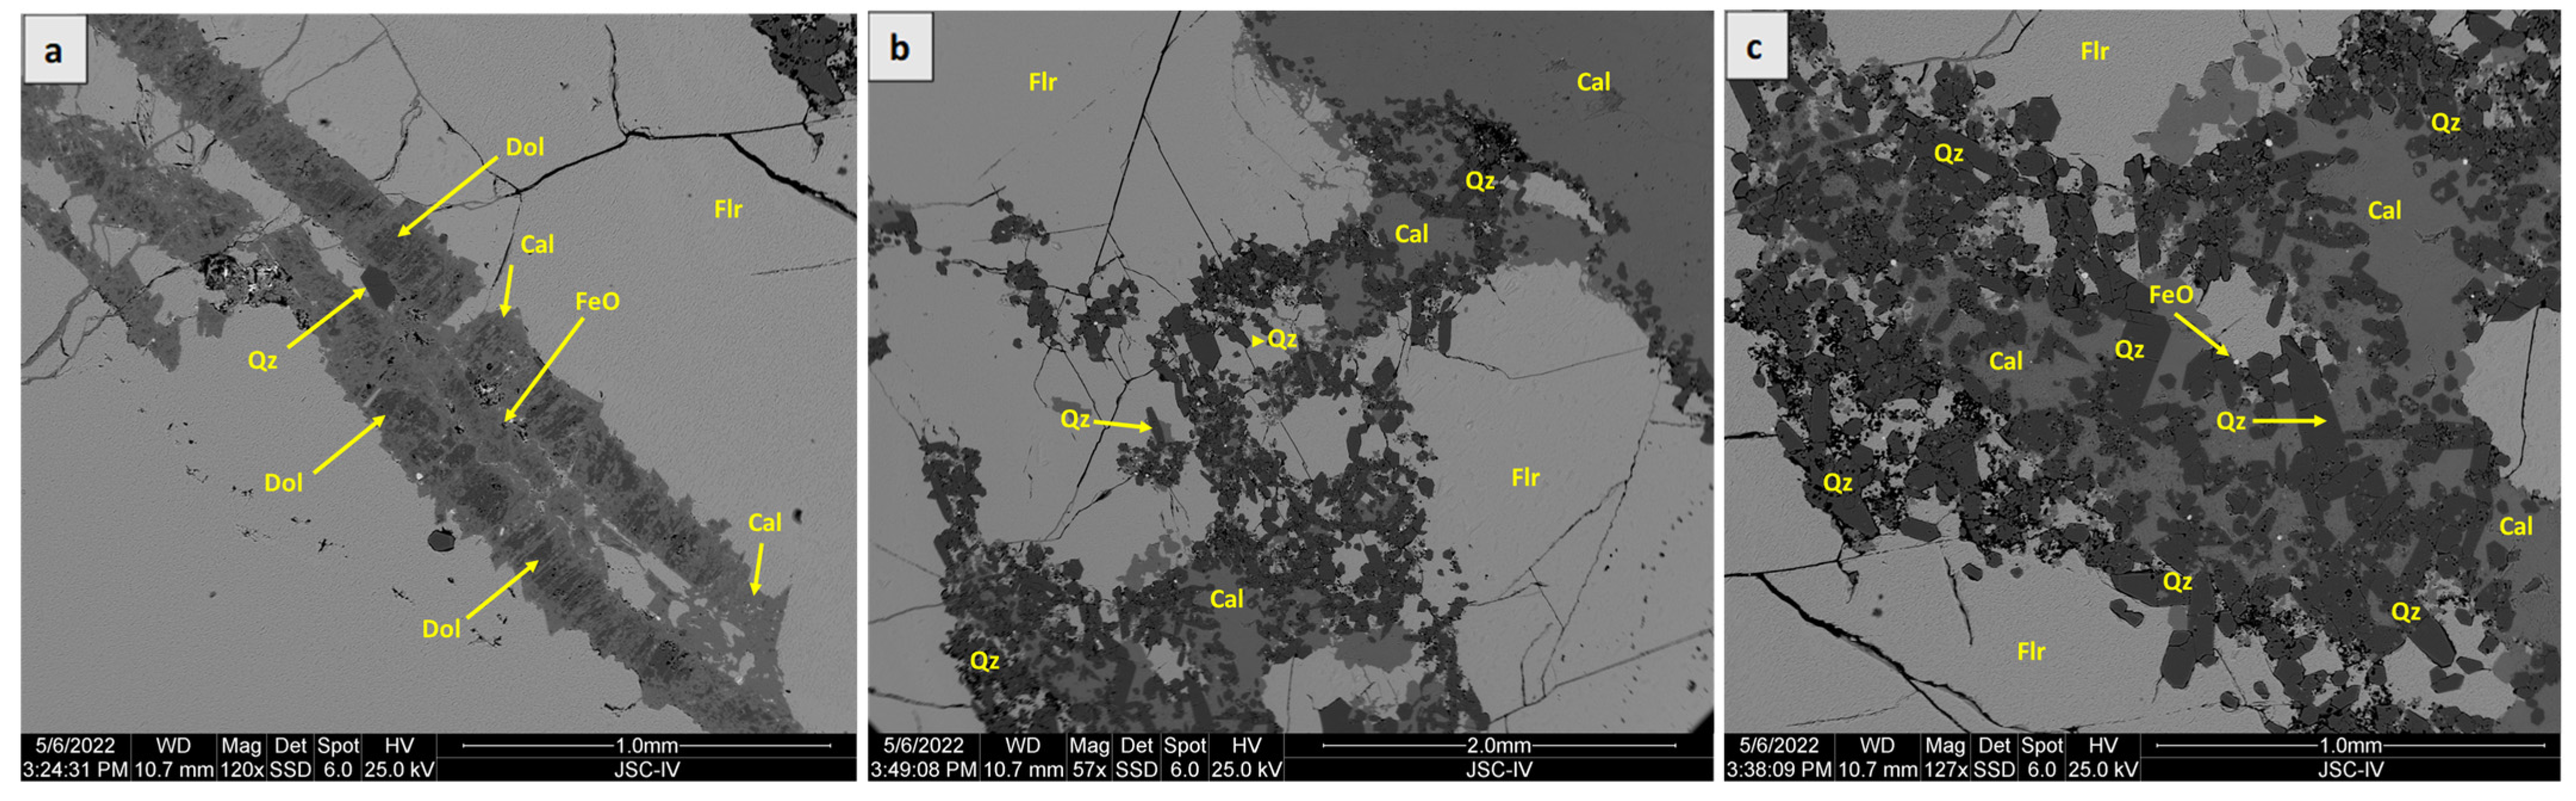
5.1. Ore Mineralogy
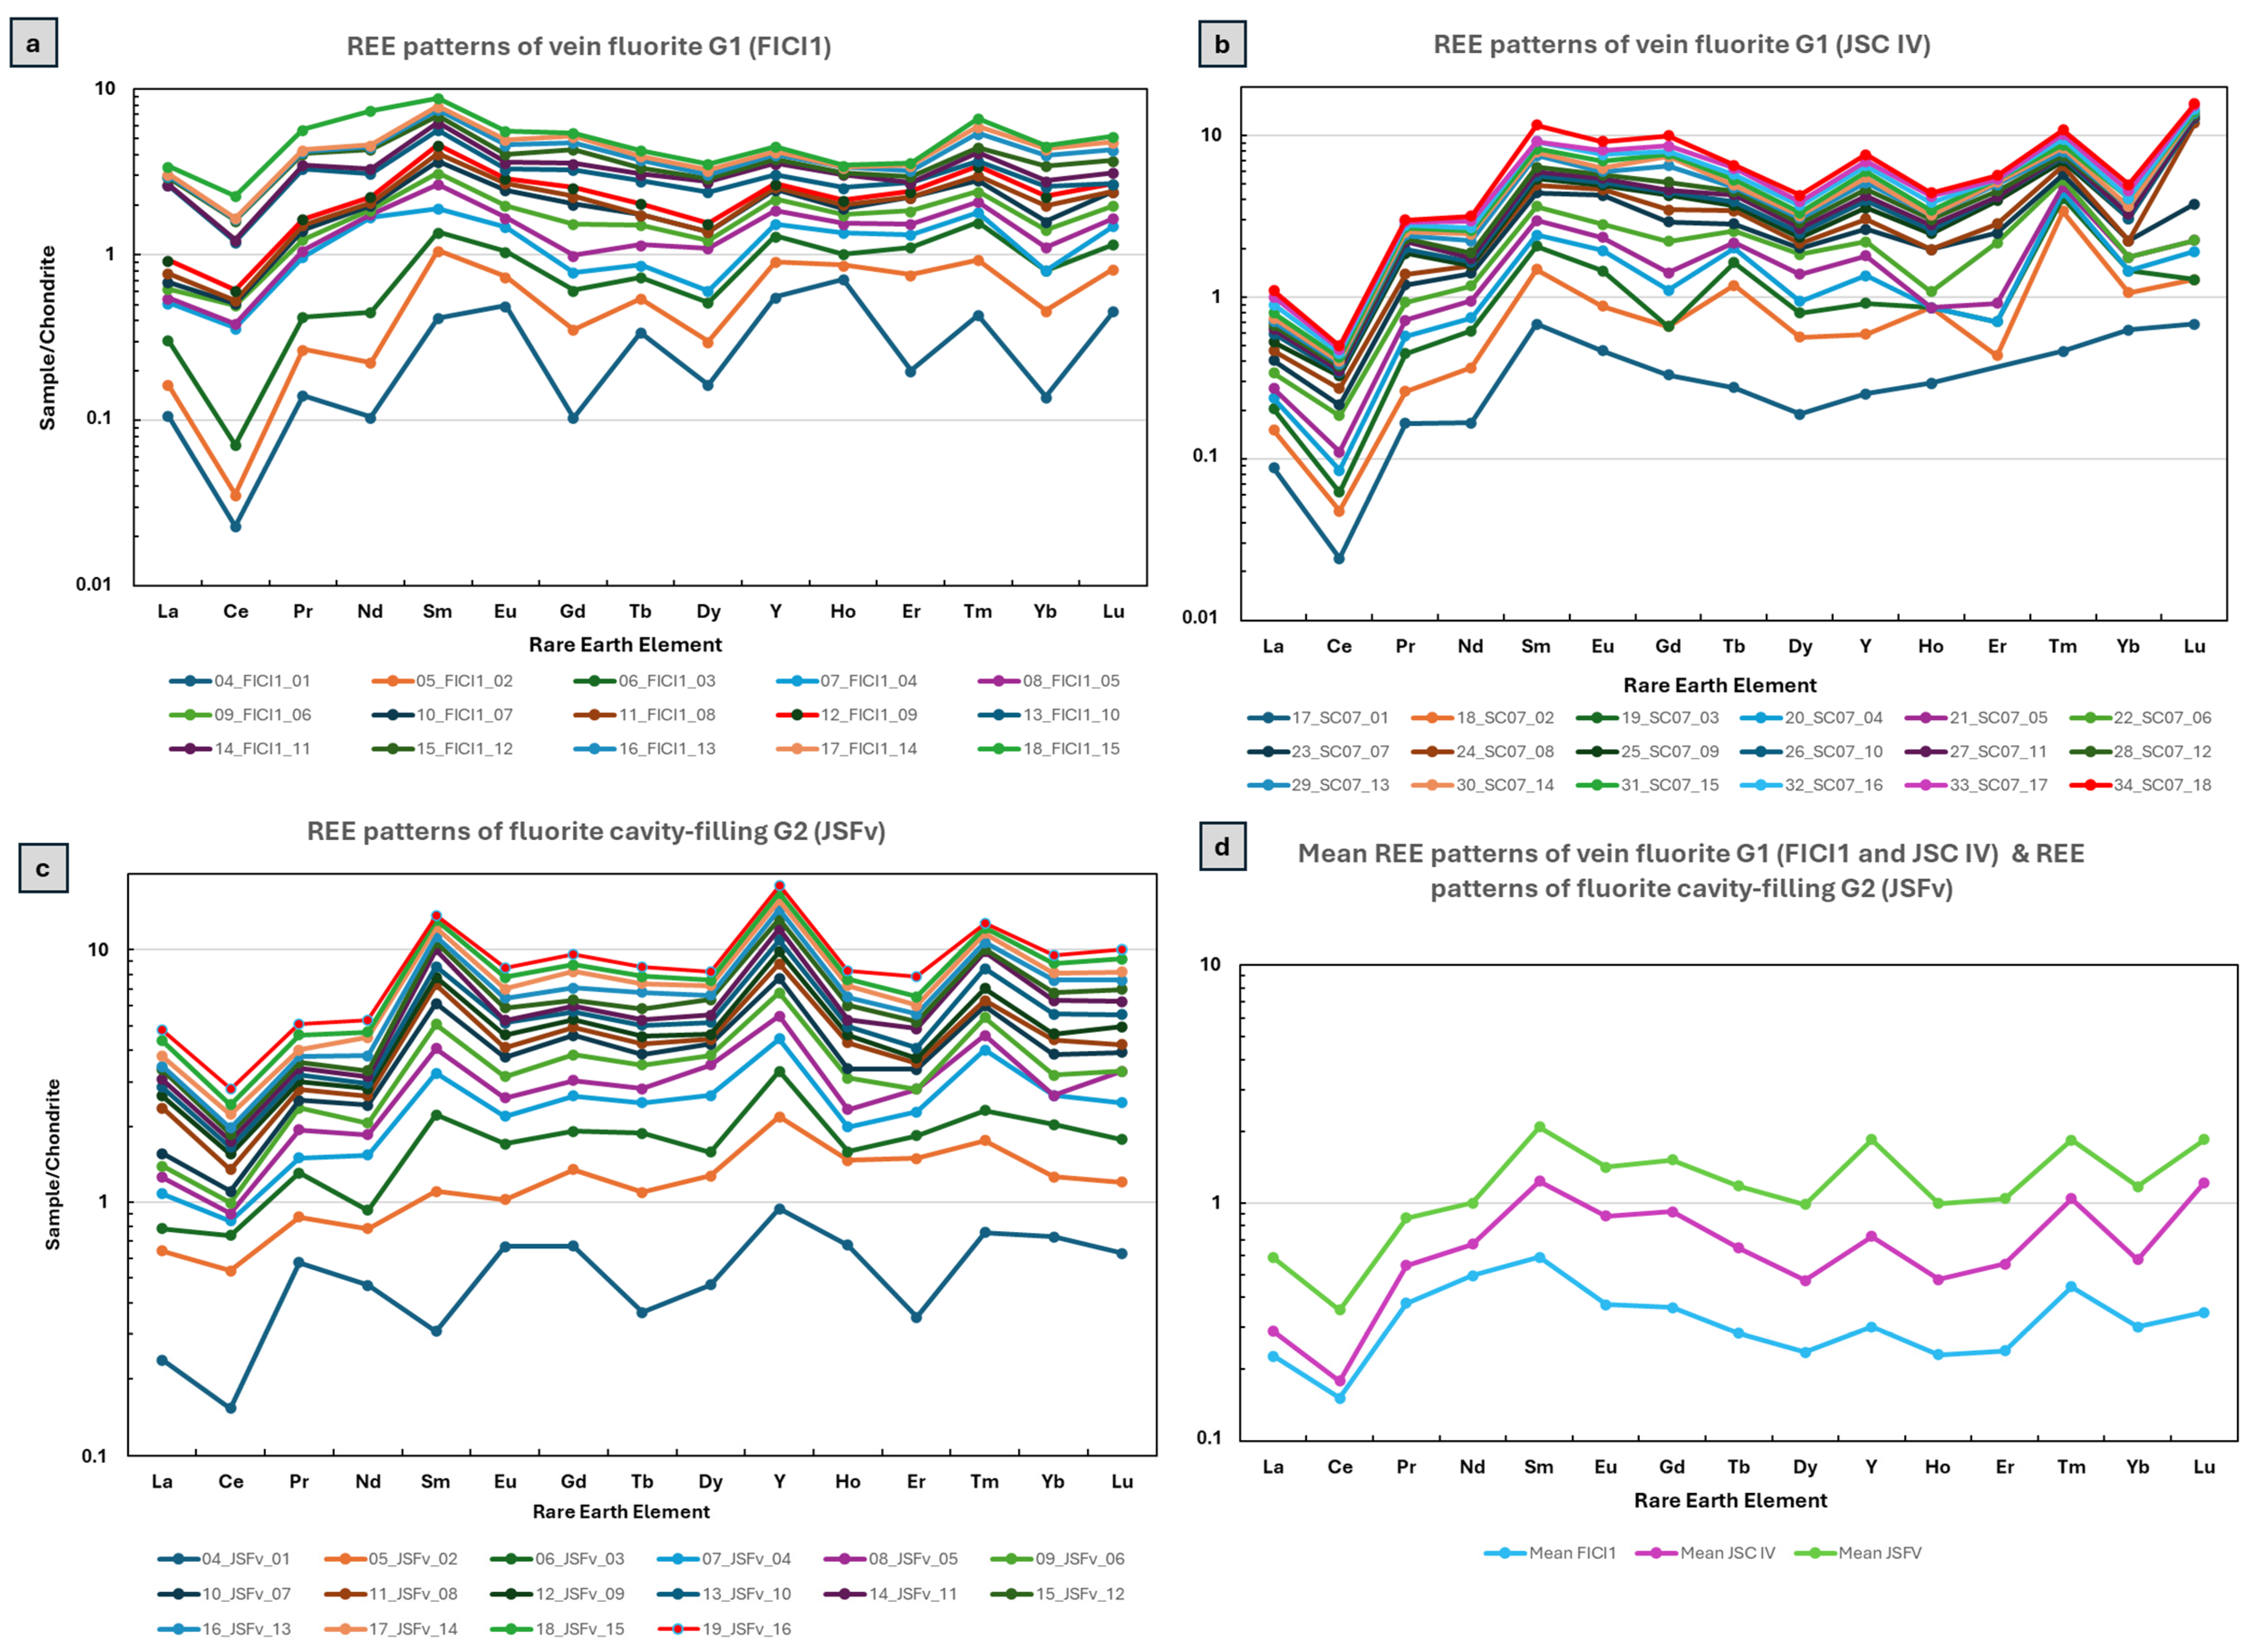
5.2. REE + Y Geochemistry of Fluorites
5.3. Rb and Sr Elemental and Isotopic Data
6. Discussion
6.1. Physicochemical Regime of REE + Y-Bearing Fluids
6.2. Potential Factors for Ce, Eu, and Y Anomalies
6.2.1. Ce Anomaly
6.2.2. Eu Anomaly
- (a)
- At high temperatures (>250 °C), Eu2+ tends to dominate in hydrothermal fluids, even under acidic and weakly reducing conditions [81]. Under reducing conditions, Eu2+ can be preferentially mobilized over other trivalent REEs, leading to the separation of Eu from the rest of the lanthanide series [82]. When Eu3+ is reduced to Eu2+, the resulting Eu2+ ion is too large to be incorporated into the fluorite lattice. This leads to a crystallographically controlled fractionation process during fluorite deposition that ultimately results in the observed negative Eu anomaly [75].
- (b)
- Taking into consideration that at Jebel Stah, the fluorite ore has occurred at temperatures below 200 °C [19,27,28], only organic matter could have been involved as a reducing agent of Eu, as long as the accumulation of organic matter in carbonate sediments requires a high oxygen deficiency and reflects anoxic conditions [83]. This may explain the observed negative Eu anomaly due to the crystallographically controlled fractionation process during fluorite deposition at Jebel Stah under the experienced low temperature (130–175 °C) conditions. The decomposition of organic matter can produce organic acids, creating an acidic environment favorable for fluorite precipitation with low REE content and negative Eu anomalies. Therefore, it can be deduced that the lack of Eu in the fluorite-forming fluid is the primary factor of the Eu depletion in fluorites G1 and G2.
- (c)
- The negative Eu anomaly in fluorite REE + Y patterns can occur if Eu2+ was stable during fluid migration [80]. This anomaly reflects the presence of Eu2+ rather than Eu3+ in the hydrothermal fluid during fluorite crystallization [84,85]. At temperatures above 200 °C, Eu2+ does not replace Ca2+ in the fluorite structure due to the difference in ionic radius, leading to Eu depletion in the fluorite [5,7,61]. Such fluids precipitate fluorite as temperatures decreases or fO2 increases. When acidic, fluorine-rich fluids interact with carbonate host rocks, they dissolve CaCO3 and form fluorite with low total REE concentrations and a negative Eu anomaly.
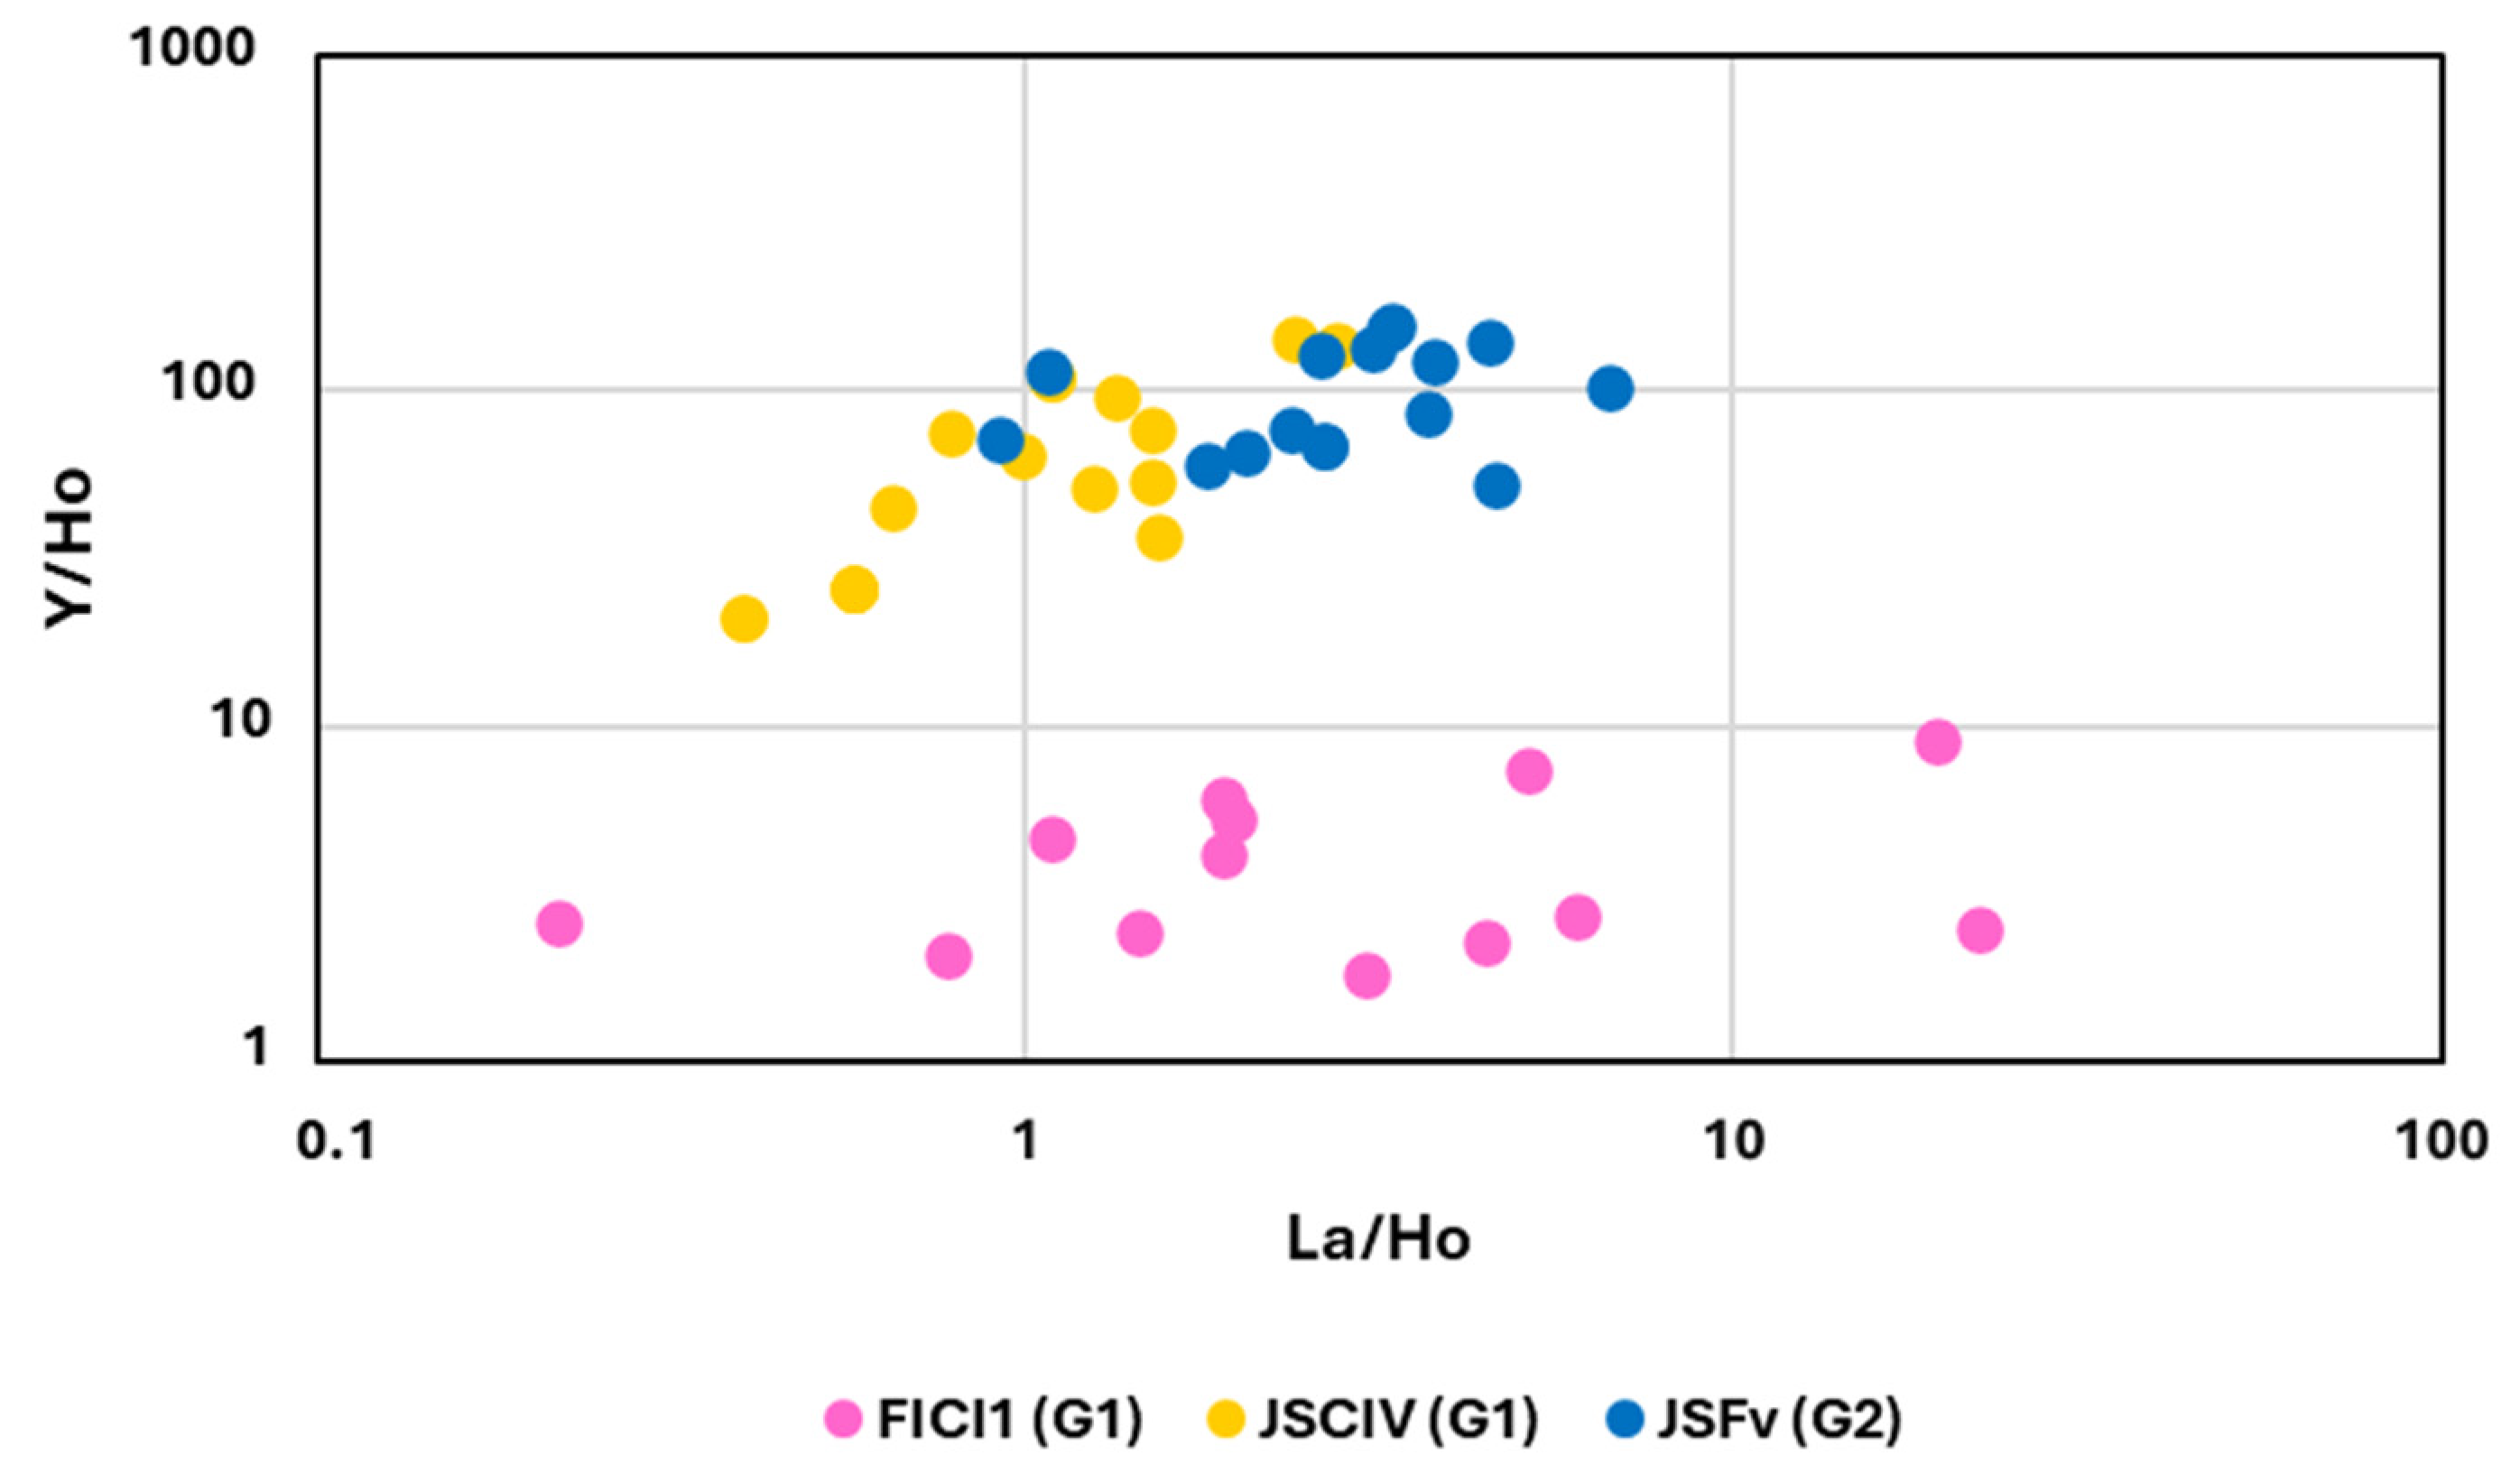
6.3. Y Anomaly and Y/Ho vs. La/Ho Diagram
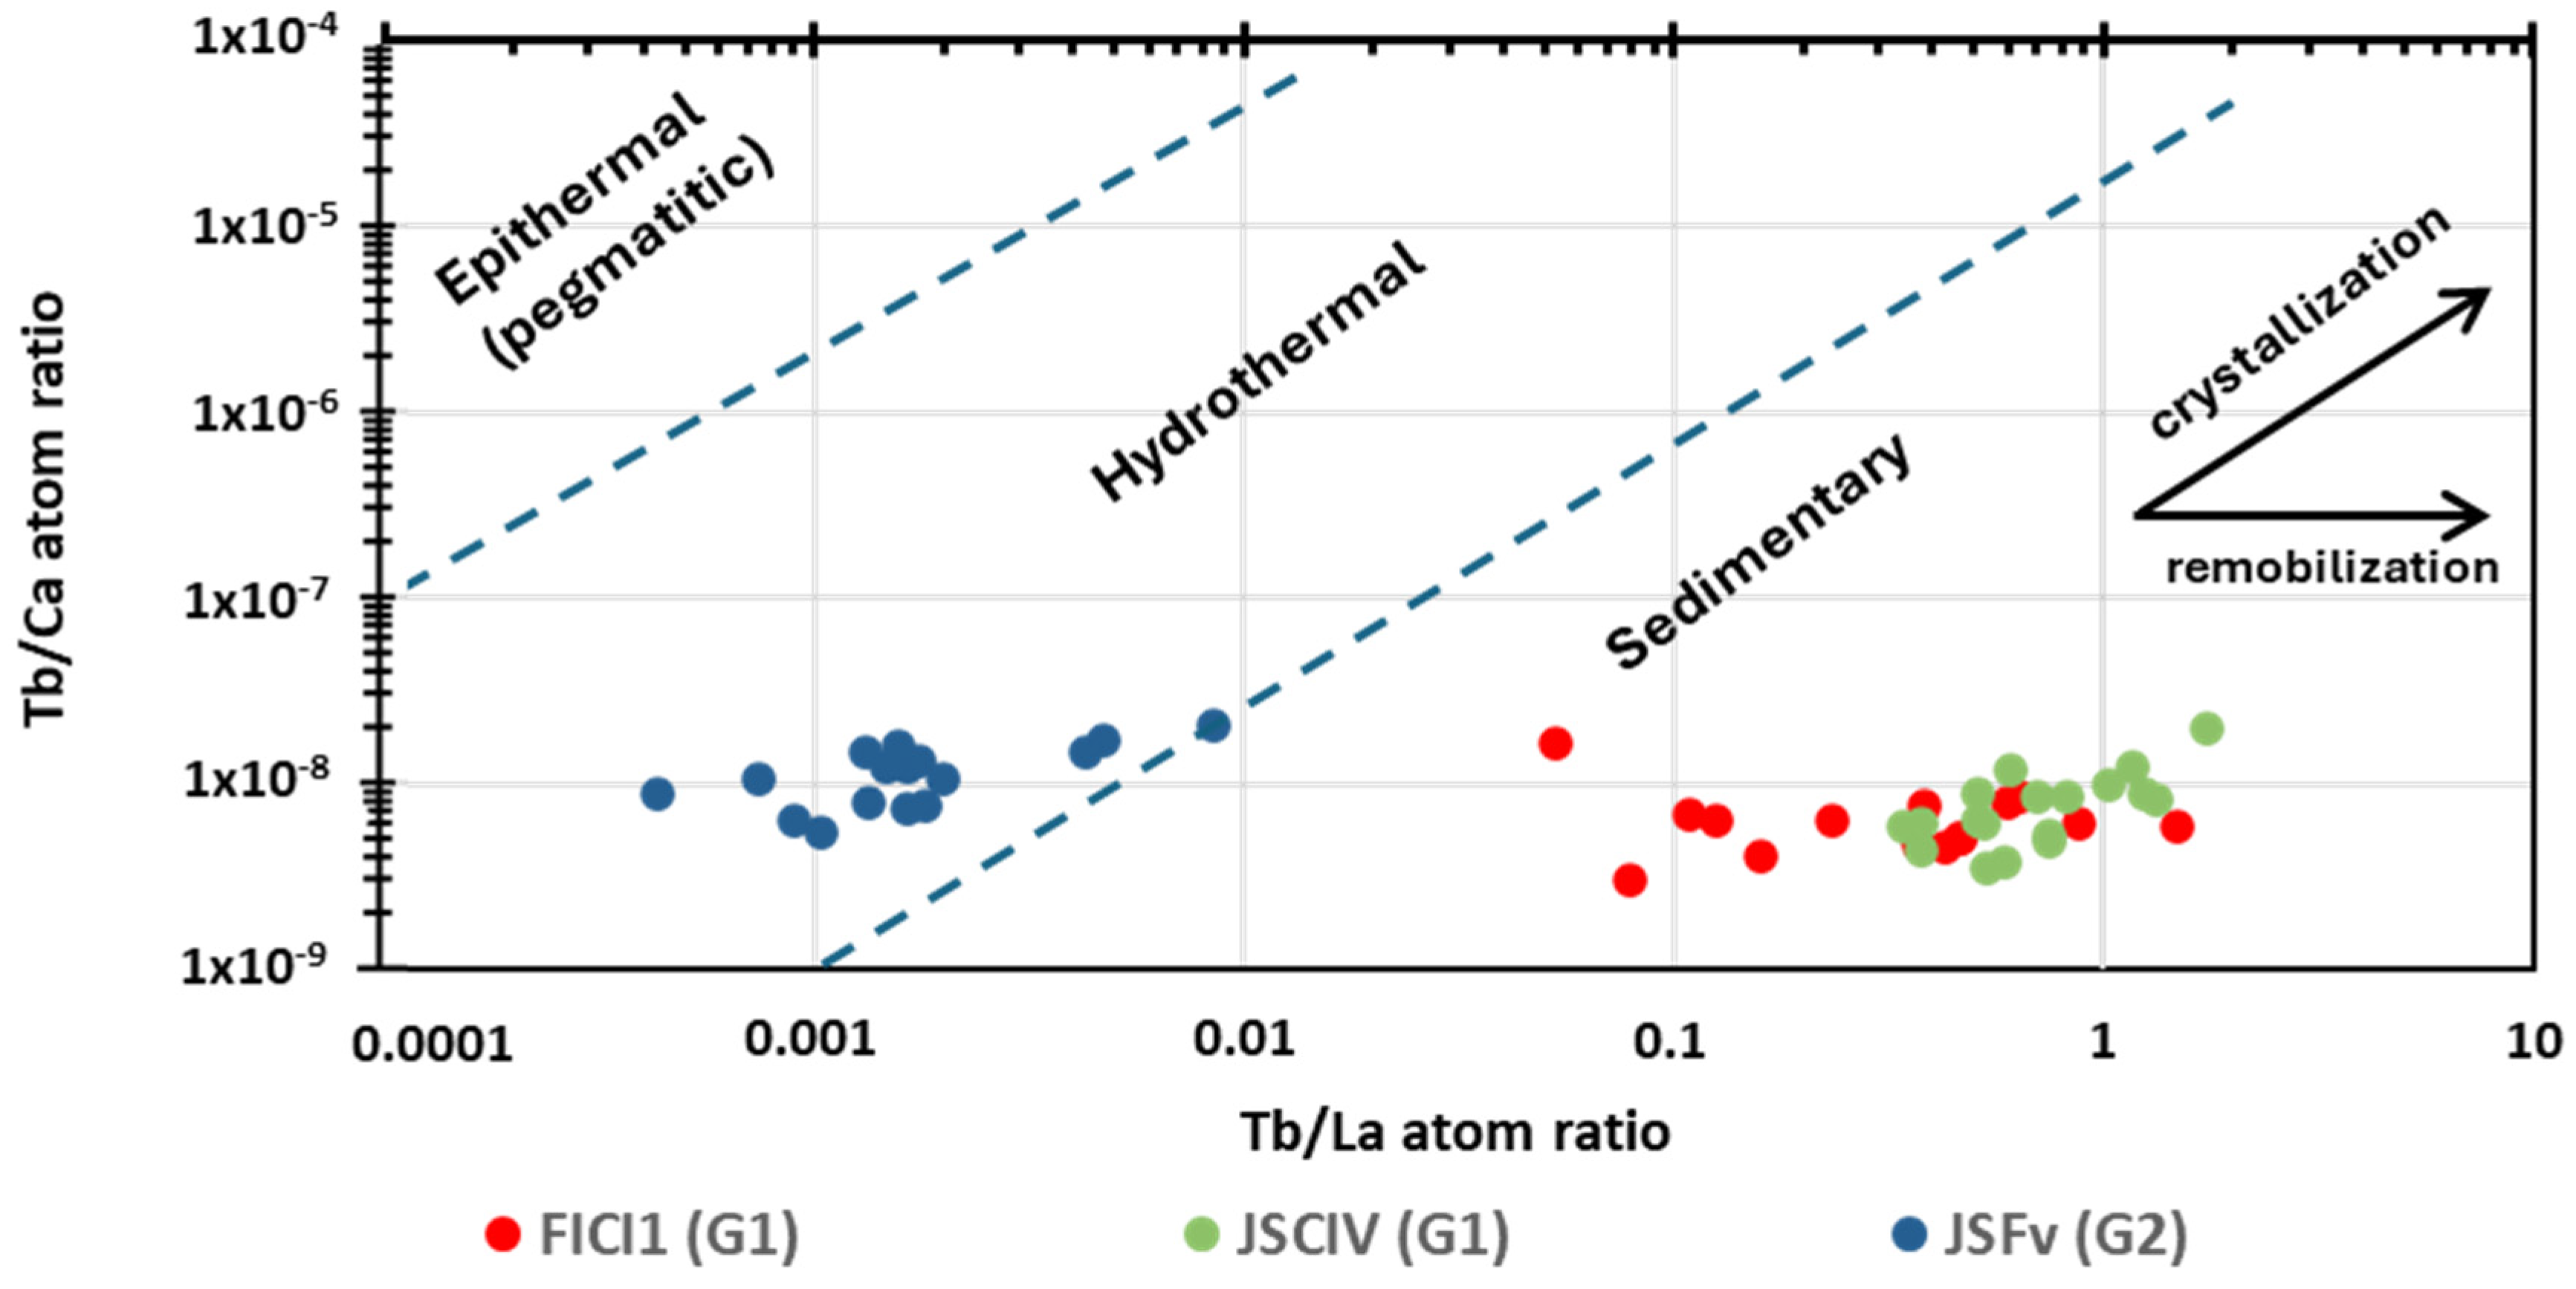
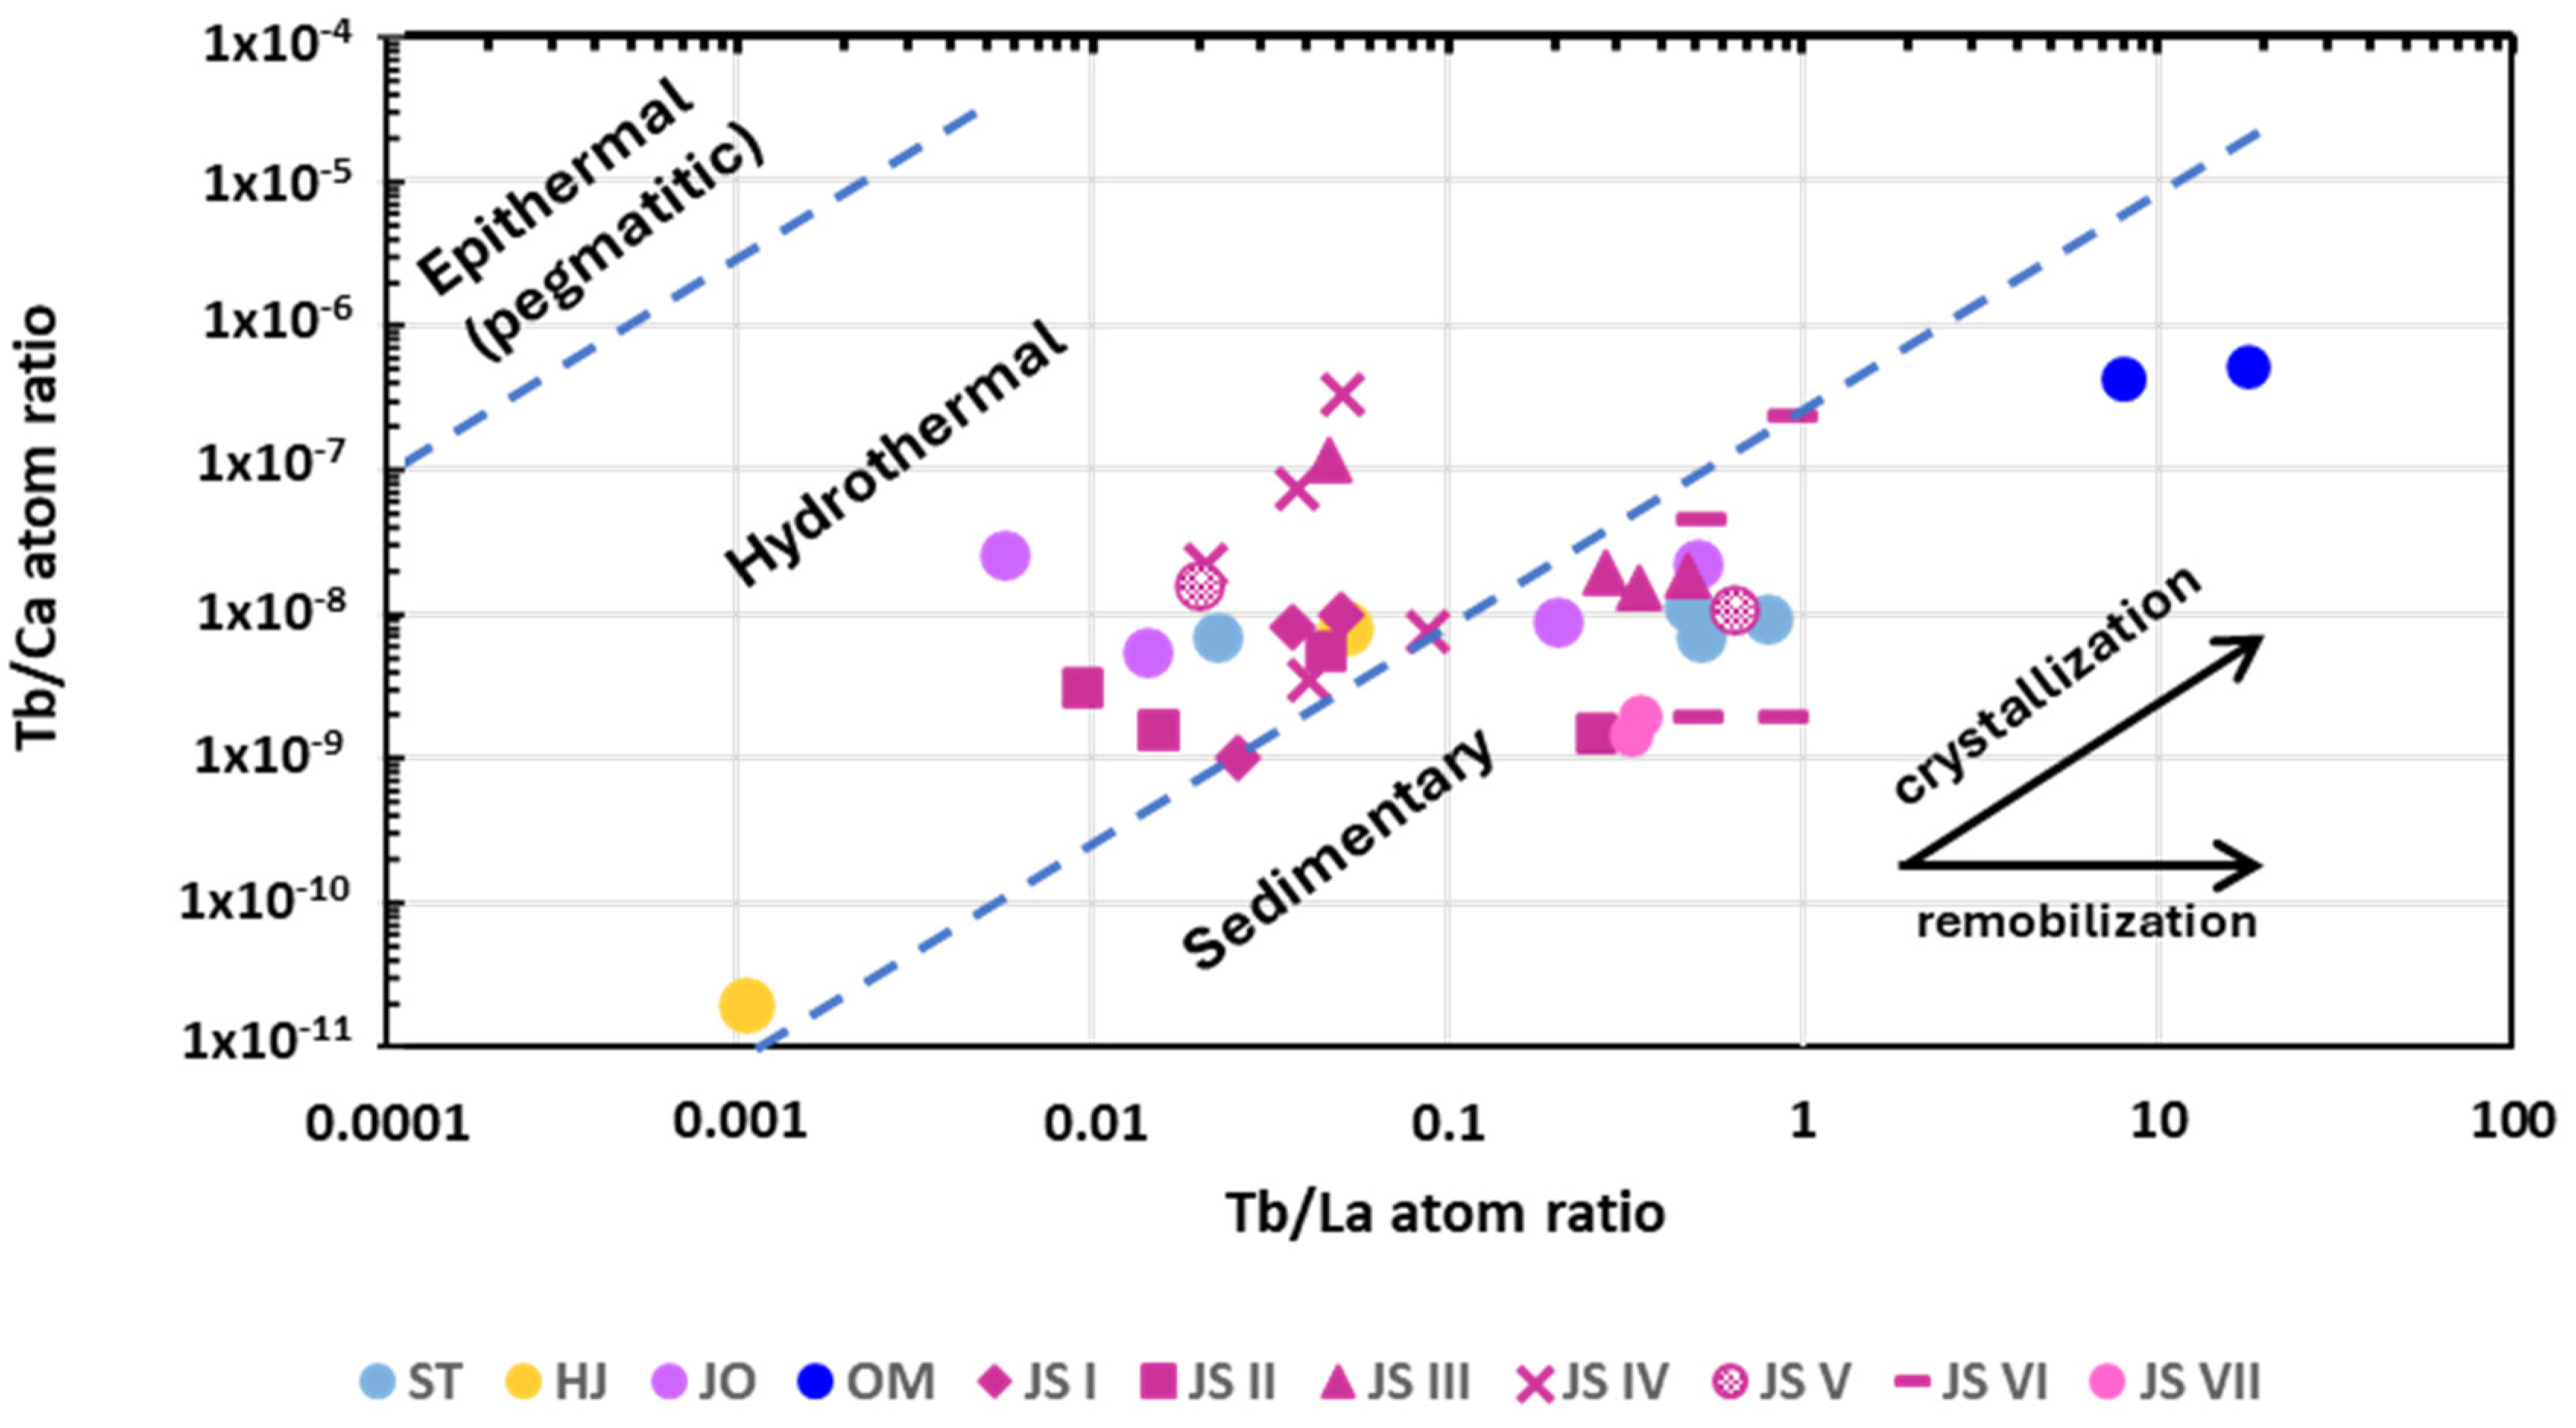
6.4. The Tb/Ca vs. Tb/La Diagram
6.5. Strontium Isotope Tracing

7. Conclusions
Supplementary Materials
Author Contributions
Funding
Data Availability Statement
Acknowledgments
Conflicts of Interest
Appendix A
| Sample | Orebody | Host Rocks | Ore Description | Petrographic Type of Fluorite | Fluorite Gene- Ration |
|---|---|---|---|---|---|
| FlCI1 | Vein | Topmost HLS * (Oust) Formation-Carixian series | Fluorite, colorless to purple, in coarse crystals | 2 | I |
| JSCIV | Fluorite, massive, colorless to white | I | |||
| JSFv | Cavity fillings | Topmost HLS * (Oust) Formation | Fluorire, colorless to purple fluorite in coarse crystals (2 m below the Carixian phosphatic condensed layer). | 3 | II |
| Petrographic Group | Lithology/Ore Facies/Orebody | Age of Layer/Ore- Bearing Layer(s) | Sample | Petrographic Description | Petrographic Type of Fluorite | Mineralogy |
|---|---|---|---|---|---|---|
| I: Limestone and authigenic quartz | Backreef limestones | Lower Sinemurian | L6-5 | Gray limestones | - | Calcite |
| L6-30 | Gray limestones with authigenic quartz | - | Calcite, Quartz | |||
| L6-30Q | Authigenic quartz | - | Quartz | |||
| II: Dolostones and associated fluorite | Dolostones (Upper part of the Oust Formation) | L5-3 | Massive yellow dolosparite | - | Dolomite | |
| DZ6-G | Gray dolosparite of the pseudo-brecciated facies | - | ||||
| DZ6-J | White sparry dolosparite of antipolar growth of the pseudo-brecciated facies | - | ||||
| DZ6-F | Colorless fluorite filling voids in the pseudo-brecciated dolostone facies | Fl3 | Fluorite | |||
| III: Phosphatic limestone and associated fluorite | Phosphatic limestone | Carixian | JS1-6P | Nodular gray phosphate | - | Apatite, calcite |
| Macrocrystalline fluorite associated with the phosphatic limestone | CC3-3 | Macrogranular purple fluorite | Fl1b | Fluorite | ||
| CC3-2 | ||||||
| JS1-6F | Macrogranular white fluorite | |||||
| IV: Finely laminated dolostones and associated fluorite | Finely laminated karst deposits | L3-21D | Dolomicrite | - | Dolomite, quartz s | |
| L3-21F | Microgranular fluorite replacing the carbonated matrix | Fl1a | Fluorite, dolomite s quartz m | |||
| L5-16 | Microgranular black fluorite with remains of matrix | |||||
| L5-15F | Microgranular fluorite rich in matrix remains | Fluorite, quartz s, dolomite s, calcite s, apatite m | ||||
| L5-15G | Mesogranular-purple fluorite layers alternating with sample L5-15F | Fl1b | ||||
| V: Banded ore | FZ-5N | Microgranular fluorite with matrix remains | Fl1a | |||
| FZ-5B | Macrogranular-white fluorite | Fl1b | Fluorite, quartz s | |||
| VI: Megacrystalline fluorite and calcite in lodes | Sinemurian to Lower Toarcian | JS5-F | Cm-sized fluorite crystals | Fl2 | Fluorite | |
| JS6-F | ||||||
| JS5-C | Cm- to dm-sized rhombohedral calcite crystals | - | Calcite | |||
| JS6-C | ||||||
| VII: Fluorite in cavities | Intradolomitic pockets filled with residual clays | Lower Sinemurian | L4-2 | Cm- to dm-sized, cubic blue and purple fluorite | Fl3 | Fluorite |
| Geode | Carixian | JS3-5 | Cm-sized cubic fluorite | |||
| Petrographic Group | Lithology/Ore Facies/Orebody | Layer/Ore Bearing Layer(s) Age | Sample | Petrographic Description (Petrographic Type of Fluorite) | Mineralogy |
|---|---|---|---|---|---|
| Limestone | Backreef limestones | Uppermost Jurassic | ST9 | Gray limestones | Calcite |
| Fluorite in lodes | Veins cutting the Ressas Formation | ST42-5 | White to smoky massive fluorite | Fluorite | |
| STIII-5 | |||||
| ST50-2 | |||||
| Fluorite in lodes with calcite | Lodes cutting the Oust Formation | Lowermost Jurassic | HJ-2F | Colorless to white megacrystalline fluorite | |
| Celestite in lodes | HJ-1Sr | Colorless megacrystalline celestite | Celestite | ||
| Fluorite with calcite in lodes trending N 90–110° E, N 160–180° E or N 30–60° E | Lodes cutting the Oust Formation and its Upper Jurassic (marl-limestone) cover | Lowermost Jurassic–Upper Jurassic | JOIII-10 | White massive fluorite | Fluorite |
| JO2-1 | |||||
| JO-F | White megacrystalline fluorite | ||||
| JO-FC | Onyx-like calcite associated with fluorite (JO-F) | Calcite | |||
| Veins cutting the Lower Miocene sandstone layer | Burdigalian | OM1 | Colorless megacrystalline fluorite | Fluorite | |
| OM-FC | White megacrystalline calcite associated with fluorite (OM1) | Calcite |
| Laser Spots Fluorite Vein (G1) | |||||||||||||||||||||
|---|---|---|---|---|---|---|---|---|---|---|---|---|---|---|---|---|---|---|---|---|---|
| Element | 01_NIST612_01 | 02_NIST612_02 | 03_NIST612_03 | 04_FlCI1_01 | 05_FlCI1_02 | 06_FlCI1_03 | 07_FlCI1_04 | 08_FlCI1_05 | 09_FlCI1_06 | 10_FlCI1_07 | 11_FlCI1_08 | 12_FlCI1_09 | 13_FlCI1_10 | 14_FlCI1_11 | 15_FlCI1_12 | 16_FlCI1_13 | 17_FlCI1_14 | 18_FlCI1_15 | 19_NIST612_04 | 20_NIST612_05 | 21_NIST612_06 |
| Sc | 41.66 | 42.33 | 40.93 | 0.54 | 0.5 | 0.49 | 0.4 | 0.85 | 1.18 | 0.57 | 0.5 | 0.68 | 0.44 | 0.61 | 0.61 | 1.02 | 0.47 | 0.52 | 39.34 | 41.30 | 39.80 |
| Y | 39.42 | 39.38 | 37.19 | 1.5 | 0.953 | 1.054 | 0.642 | 0.844 | 0.827 | 0.847 | 0.238 | 0.354 | 0.984 | 1.34 | 0.657 | 0.633 | 0.409 | 0.89 | 38.53 | 39.42 | 35.89 |
| La | 36.42 | 35.75 | 35.08 | 0.034 | 0.018 | 0.045 | 0.066 | 0.012 | 0.023 | 0.019 | 0.029 | 0.0482 | 0.546 | 0.007 | 0.087 | 0.023 | 0.022 | 0.11 | 36.06 | 36.55 | 35.31 |
| Ce | 39.26 | 38.11 | 37.65 | 0.018 | 0.010 | 0.029 | 0.234 | 0.02 | 0.09 | 0.011 | 0.016 | 0.066 | 0.471 | 0.03 | 0.31 | 0.020 | 0.022 | 0.492 | 38.05 | 39.71 | 37.92 |
| Pr | 37.94 | 36.99 | 36.76 | 0.016 | 0.015 | 0.018 | 0.065 | 0.010 | 0.021 | 0.02 | 0.013 | 0.015 | 0.196 | 0.022 | 0.069 | 0.013 | 0.013 | 0.163 | 37.10 | 37.59 | 36.66 |
| Nd | 35.91 | 35.18 | 34.27 | 0.063 | 0.071 | 0.136 | 0.739 | 0.043 | 0.066 | 0.074 | 0.049 | 0.098 | 0.513 | 0.136 | 0.609 | 0.08 | 0.076 | 1.69 | 34.23 | 37.53 | 35.40 |
| Sm | 35.13 | 37.48 | 35.67 | 0.081 | 0.126 | 0.06 | 0.103 | 0.15 | 0.088 | 0.107 | 0.077 | 0.103 | 0.206 | 0.117 | 0.125 | 0.125 | 0.069 | 0.189 | 39.05 | 38.82 | 36.93 |
| Eu | 35.85 | 34.56 | 33.46 | 0.037 | 0.018 | 0.023 | 0.032 | 0.015 | 0.023 | 0.036 | 0.017 | 0.0151 | 0.029 | 0.024 | 0.034 | 0.04 | 0.027 | 0.048 | 34.39 | 35.16 | 33.56 |
| Gd | 38.75 | 36.85 | 35.41 | 0.027 | 0.065 | 0.067 | 0.045 | 0.053 | 0.141 | 0.128 | 0.061 | 0.076 | 0.183 | 0.08 | 0.201 | 0.106 | 0.115 | 0.067 | 37.42 | 37.88 | 36.34 |
| Tb | 37.05 | 36.37 | 34.78 | 0.015 | 0.009 | 0.008 | 0.006 | 0.012 | 0.016 | 0.010 | 0 | 0.013 | 0.033 | 0.012 | 0.012 | 0.017 | 0.009 | 0.0137 | 36.20 | 36.57 | 35.14 |
| Dy | 38.09 | 36.18 | 34.26 | 0.046 | 0.038 | 0.06 | 0.0254 | 0.138 | 0.035 | 0.044 | 0 | 0.045 | 0.237 | 0.101 | 0.042 | 0.042 | 0.056 | 0.081 | 35.78 | 37.29 | 35.09 |
| Ho | 39.17 | 38.00 | 37.02 | 0.044 | 0.009 | 0.009 | 0.0219 | 0.011 | 0.012 | 0.01 | 0.006 | 0.008 | 0.024 | 0.032 | 0.004 | 0.016 | 0 | 0.0051 | 38.54 | 38.16 | 36.65 |
| Er | 39.77 | 37.39 | 35.77 | 0.036 | 0.1 | 0.064 | 0.039 | 0.038 | 0.054 | 0.068 | 0 | 0.035 | 0.054 | 0 | 0.046 | 0.046 | 0.043 | 0.022 | 38.94 | 37.82 | 35.88 |
| Tm | 39.08 | 37.89 | 36.53 | 0.011 | 0.013 | 0.017 | 0.006 | 0.008 | 0.008 | 0.011 | 0.005 | 0.011 | 0.007 | 0.012 | 0.009 | 0.025 | 0.014 | 0.020 | 37.31 | 38.63 | 36.17 |
| Yb | 39.30 | 39.15 | 40.37 | 0.025 | 0.058 | 0.062 | 0 | 0.055 | 0.054 | 0.031 | 0.071 | 0.05 | 0.058 | 0.04 | 0.115 | 0.1 | 0.063 | 0.032 | 41.56 | 40.01 | 40.03 |
| Lu | 39.20 | 38.95 | 35.79 | 0.013 | 0.010 | 0.009 | 0.009 | 0.004 | 0.009 | 0.012 | 0 | 0.008 | 0 | 0.013 | 0.016 | 0.02 | 0.014 | 0.011 | 38.65 | 38.59 | 36.28 |
| Laser Spots Fluorite Vein (G1) | |||||||||||||||||||||||
|---|---|---|---|---|---|---|---|---|---|---|---|---|---|---|---|---|---|---|---|---|---|---|---|
| Element | 15_NIST612_04 | 16_NIST612_05 | 17-JSCIV-01 | 18-JSCIV-02 | 19-JSCIV-03 | 20-JSCIV-04 | 21-JSCIV-05 | 22-JSCIV-06 | 23-JSCIV-07 | 24-JSCIV-08 | 25-JSCIV-09 | 26-JSCIV-10 | 27-JSCIV-11 | 28-JSCIV-12 | 29-JSCIV-13 | 30-JSCIV-14 | 31-JSCIV-15 | 32-JSCIV-16 | 33-JSCIV-17 | 34-JSCIV-18 | 35_NIST612_06 | 36_NIST612_07 | 37_NIST612_08 |
| Sc | 4.81 | 5.02 | 0.44 | 0.41 | 0.37 | 0.32 | 0.3 | 0.43 | 0.4 | 0.37 | 0.4 | 0.21 | 0.21 | 0.33 | 0.28 | 0.25 | 0.32 | 0.41 | 0.45 | 0.39 | 4.64 | 4.83 | 4.63 |
| Y | 17.68 | 17.25 | 0.679 | 0.91 | 0.887 | 1.18 | 1.22 | 1.06 | 1.17 | 1.12 | 1.41 | 1.02 | 0.806 | 1.1 | 1.24 | 1.09 | 1.3 | 1.29 | 1.22 | 1.79 | 17.34 | 16.88 | 17.01 |
| La | 97.91 | 99.34 | 0.028 | 0.02 | 0.017 | 0.011 | 0.011 | 0.021 | 0.022 | 0.019 | 0.02 | 0.020 | 0.012 | 0.011 | 0.012 | 0.011 | 0.018 | 0.031 | 0.034 | 0.03 | 91.95 | 99.43 | 98.42 |
| Ce | 39.45 | 40.79 | 0.019 | 0.019 | 0.0119 | 0.018 | 0.021 | 0.06 | 0.025 | 0.046 | 0.043 | 0.012 | 0.008 | 0.018 | 0.012 | 0.011 | 0.018 | 0.022 | 0.02 | 0.019 | 37.10 | 42.25 | 40.62 |
| Pr | 270.77 | 278.09 | 0.019 | 0.011 | 0.022 | 0.015 | 0.017 | 0.024 | 0.031 | 0.023 | 0.057 | 0.013 | 0.025 | 0.011 | 0.014 | 0.014 | 0.02 | 0.01 | 0.016 | 0.011 | 258.92 | 276.01 | 276.61 |
| Nd | 48.98 | 52.18 | 0.1 | 0.12 | 0.151 | 0.075 | 0.124 | 0.132 | 0.143 | 0.094 | 0 | 0.051 | 0.053 | 0.08 | 0.219 | 0.135 | 0.071 | 0.064 | 0.159 | 0.135 | 48.01 | 50.74 | 50.64 |
| Sm | 158.58 | 161.70 | 0.133 | 0.156 | 0.114 | 0.07 | 0.107 | 0.131 | 0.149 | 0.099 | 0.091 | 0.047 | 0.069 | 0.074 | 0.22 | 0.08 | 0.07 | 0.177 | 0 | 0.47 | 148.06 | 155.76 | 165.10 |
| Eu | 387.09 | 399.85 | 0.035 | 0.031 | 0.043 | 0.037 | 0.029 | 0.037 | 0.108 | 0.026 | 0.024 | 0.0126 | 0.024 | 0.02 | 0.021 | 0.021 | 0.052 | 0.05 | 0.035 | 0.081 | 379.55 | 416.47 | 392.90 |
| Gd | 120.34 | 120.30 | 0.086 | 0.085 | 0 | 0.115 | 0.082 | 0.209 | 0.181 | 0.141 | 0.207 | 0.049 | 0.041 | 0.137 | 0.353 | 0.239 | 0.063 | 0.082 | 0.166 | 0.36 | 118.47 | 118.06 | 122.77 |
| Tb | 632.27 | 643.30 | 0.012 | 0.04 | 0.02 | 0.016 | 0.007 | 0.017 | 0.0129 | 0.025 | 0.011 | 0.009 | 0.0176 | 0.01 | 0.010 | 0.007 | 0.017 | 0.018 | 0.0238 | 0.012 | 592.06 | 627.26 | 616.36 |
| Dy | 98.57 | 98.42 | 0.053 | 0.105 | 0.065 | 0.04 | 0.124 | 0.129 | 0.048 | 0.04 | 0.053 | 0.039 | 0.051 | 0.06 | 0.055 | 0.033 | 0.037 | 0.103 | 0.054 | 0.102 | 89.04 | 94.75 | 96.36 |
| Ho | 439.36 | 468.51 | 0.018 | 0.035 | 0 | 0 | 0 | 0.014 | 0.055 | 0 | 0.031 | 0.007 | 0.012 | 0.015 | 0.011 | 0 | 0.013 | 0.025 | 0.022 | 0.0125 | 418.75 | 451.81 | 445.05 |
| Er | 150.86 | 161.12 | 0 | 0.078 | 0.05 | 0 | 0.038 | 0.225 | 0.059 | 0.061 | 0.203 | 0.041 | 0 | 0.063 | 0.077 | 0.032 | 0.04 | 0 | 0 | 0.054 | 139.73 | 154.27 | 150.80 |
| Tm | 1067.3 | 1084.7 | 0.012 | 0.079 | 0.02 | 0.009 | 0.010 | 0.013 | 0.011 | 0.020 | 0.012 | 0.009 | 0.005 | 0 | 0.011 | 0.013 | 0.009 | 0.02 | 0.018 | 0.017 | 1027.2 | 1048.4 | 1042.9 |
| Yb | 161.00 | 168.08 | 0.113 | 0.079 | 0.07 | 0 | 0.055 | 0 | 0.085 | 0 | 0.151 | 0 | 0.035 | 0.065 | 0 | 0 | 0.084 | 0 | 0.081 | 0.077 | 155.30 | 163.06 | 156.52 |
| Lu | 986.53 | 1026.9 | 0.019 | 0.017 | 0 | 0.017 | 0.009 | 0 | 0.043 | 0.228 | 0.0233 | 0 | 0.006 | 0.011 | 0.008 | 0.012 | 0 | 0.0131 | 0.019 | 0.013 | 941.89 | 1006.1 | 978.18 |
| Laser Spots | Cavity-Filling Fluorite (G2) | |||||||||||||||||||||
|---|---|---|---|---|---|---|---|---|---|---|---|---|---|---|---|---|---|---|---|---|---|---|
| Element | 01_NIST612_01 | 02_NIST612_02 | 03_NIST612_03 | 04-JSFv-01 | 05-JSFv-02 | 06-JSFv-03 | 07-JSFv-04 | 08-JSFv-05 | 09-JSFv-06 | 10-JSFv-07 | 11-JSFv-08 | 12-JSFv-09 | 13-JSFv-10 | 14-JSFv-11 | 15-JSFv-12 | 16-JSFv-13 | 17-JSFv-14 | 18-JSFv-15 | 19-JSFv-16 | 20_NIST612_04 | 21_NIST612_05 | 22_NIST612_06 |
| Sc | 41.36 | 40.51 | 41.32 | 0.52 | 0.68 | 0.51 | 0.65 | 0.53 | 0.48 | 0.85 | 0.45 | 0.46 | 0.52 | 0.35 | 0.43 | 0.54 | 0.5 | 0.51 | 0.52 | 40.94 | 41.70 | 40.70 |
| Y | 38.24 | 38.08 | 38.48 | 2.54 | 3.34 | 3.04 | 3.09 | 2.76 | 3.46 | 2.61 | 2.96 | 2.78 | 2.97 | 3.09 | 3.04 | 3.33 | 3.43 | 2.82 | 3.34 | 38.46 | 37.98 | 38.24 |
| La | 36.04 | 35.14 | 36.23 | 0.076 | 0.129 | 0.046 | 0.094 | 0.056 | 0.044 | 0.054 | 0.257 | 0.089 | 0.068 | 0.066 | 0.094 | 0.031 | 0.107 | 0.183 | 0.144 | 35.63 | 36.61 | 35.31 |
| Ce | 39.24 | 37.80 | 37.85 | 0.124 | 0.309 | 0.165 | 0.085 | 0.048 | 0.073 | 0.089 | 0.198 | 0.167 | 0.077 | 0.081 | 0.093 | 0.088 | 0.209 | 0.167 | 0.309 | 38.77 | 38.55 | 37.97 |
| Pr | 37.31 | 36.71 | 37.59 | 0.068 | 0.035 | 0.051 | 0.0227 | 0.052 | 0.05 | 0.021 | 0.03 | 0.025 | 0.024 | 0.021 | 0.022 | 0.026 | 0.027 | 0.068 | 0.056 | 36.13 | 37.92 | 37.58 |
| Nd | 34.72 | 35.28 | 35.96 | 0.281 | 0.191 | 0.085 | 0.366 | 0.189 | 0.122 | 0.22 | 0.128 | 0.107 | 0.085 | 0.118 | 0.102 | 0.287 | 0.425 | 0.126 | 0.34 | 35.04 | 35.28 | 35.28 |
| Sm | 36.88 | 35.65 | 37.97 | 0.06 | 0.155 | 0.218 | 0.201 | 0.16 | 0.193 | 0.21 | 0.226 | 0.098 | 0.155 | 0.278 | 0.132 | 0.119 | 0.188 | 0.163 | 0.111 | 36.22 | 38.12 | 36.15 |
| Eu | 34.37 | 34.33 | 34.67 | 0.05 | 0.027 | 0.051 | 0.036 | 0.0304 | 0.042 | 0.045 | 0.026 | 0.037 | 0.041 | 0.008 | 0.049 | 0.041 | 0.041 | 0.059 | 0.051 | 34.46 | 34.86 | 34.11 |
| Gd | 35.74 | 37.31 | 38.41 | 0.174 | 0.177 | 0.145 | 0.191 | 0.102 | 0.211 | 0.193 | 0.09 | 0.093 | 0.103 | 0.078 | 0.088 | 0.195 | 0.291 | 0.138 | 0.231 | 35.77 | 36.29 | 38.34 |
| Tb | 35.86 | 35.59 | 36.43 | 0.0161 | 0.032 | 0.034 | 0.0264 | 0.0148 | 0.03 | 0.0155 | 0.018 | 0.013 | 0.0215 | 0.011 | 0.024 | 0.042 | 0.025 | 0.0215 | 0.03 | 35.94 | 36.74 | 35.31 |
| Dy | 35.99 | 35.71 | 36.31 | 0.132 | 0.224 | 0.086 | 0.299 | 0.24 | 0.088 | 0.115 | 0.054 | 0.055 | 0.152 | 0.099 | 0.237 | 0.068 | 0.169 | 0.105 | 0.168 | 35.92 | 35.38 | 36.43 |
| Ho | 37.82 | 37.16 | 38.93 | 0.042 | 0.049 | 0.0073 | 0.025 | 0.0215 | 0.048 | 0.0165 | 0.056 | 0.02 | 0.022 | 0.020 | 0.046 | 0.029 | 0.045 | 0.027 | 0.039 | 37.50 | 38.74 | 37.52 |
| Er | 37.34 | 37.06 | 37.95 | 0.063 | 0.205 | 0.063 | 0.08 | 0.095 | 0 | 0.1 | 0.034 | 0.029 | 0.066 | 0.143 | 0.056 | 0.066 | 0.083 | 0.089 | 0.239 | 38.89 | 37.88 | 35.90 |
| Tm | 37.47 | 36.98 | 38.42 | 0.020 | 0.027 | 0.015 | 0.046 | 0.015 | 0.022 | 0.016 | 0.008 | 0.02 | 0.037 | 0.038 | 0.006 | 0.0165 | 0.025 | 0.016 | 0.013 | 37.73 | 37.94 | 37.06 |
| Yb | 40.52 | 38.74 | 40.80 | 0.131 | 0.096 | 0.139 | 0.111 | 0 | 0.1 | 0.119 | 0.099 | 0.042 | 0.166 | 0.135 | 0.082 | 0.148 | 0.095 | 0.129 | 0.129 | 40.43 | 39.37 | 39.95 |
| Lu | 37.93 | 36.76 | 38.72 | 0.017 | 0.016 | 0.016 | 0.0197 | 0.023 | 0 | 0.0173 | 0.008 | 0.021 | 0.016 | 0.019 | 0.0205 | 0.017 | 0.016 | 0.029 | 0.0231 | 37.15 | 39.28 | 37.12 |
| I | II | III | IV | V | VI | VII | ||||||||||||||||||
|---|---|---|---|---|---|---|---|---|---|---|---|---|---|---|---|---|---|---|---|---|---|---|---|---|
| L6-5 | L6-30 | L6-30Q | L5-3 | DZ6-G | DZ6-J | DZ6-F | JS1-6P | CC3-3 | CC3-2 | JS1-6F | L3-21D | L3-21F | L5-16 | L5-15F | L5-15G | FZ-5N | FZ-5B | JS5-F | JS6-HF | JS5-C | JS6-HC | L4-2 | JS3-5 | |
| La Ce Pr Nd Sm Eu Gd Tb Dy Ho Er Tm Yb Lu ΣREE | 0.384 0.47 0.09 0.444 0.107 0.05 0.129 0.016 0.094 0.018 0.054 0.007 0.037 0.006 1.91 | 0.35 0.42 0.08 0.39 0.1 0.05 0.13 0.02 0.11 0.02 0.06 0.01 0.05 0.01 1.8 | 0.068 0.109 0.019 0.075 0.019 0.006 0.019 0.002 0.013 0.003 0.007 0.001 0.006 0.001 0.35 | 0.17 0.24 0.034 0.146 0.024 0.011 0.025 0.003 0.018 0.004 0.013 0.001 0 0.001 0.69 | 0.56 0.73 0.11 0.38 0.037 0.007 0.034 0.006 0.034 0.009 0.031 0.005 0.04 0.007 1.99 | 0.21 0.3 0.06 0.28 0.061 0.015 0.075 0.011 0.066 0.015 0.047 0.007 0.055 0.01 1.212 | 0.01 0.01 0.0027 0.02 0.011 0.003 0.023 0.003 0.022 0.005 0.01 0.001 0.002 0.0002 0.12 | 4.354 4.717 1.313 6.618 1.506 0.609 1.752 0.23 1.394 0.284 0.744 0.085 0.262 0.064 23.9 | 0.12 0.2 0.05 0.31 0.104 0.03 0.229 0.038 0.253 0.056 0.154 0.017 0.091 0.012 1.66 | 0.068 0.122 0.036 0.224 0.088 0.051 0.232 0.037 0.244 0.054 0.146 0.016 0 0.012 1.33 | 0.076 0.144 0.04 0.237 0.08 0.042 0.197 0.03 0.197 0.043 0.114 0.012 0 0.009 1.221 | 0.15 0.22 0.03 0.13 0.028 0.008 0.044 0.007 0.045 0.011 0.033 0.004 0.022 0.003 0.74 | 0.149 0.256 0.048 0.237 0.057 0.016 0.106 0.015 0.1 0.022 0.06 0.006 0.031 0.004 1.107 | 1.792 2.32 0.372 1.562 0.249 0.099 0.302 0.043 0.272 0.059 0.157 0.018 0 0.015 7.26 | 11.5 14.8 3.32 16.9 4.79 1.06 5.18 0.67 3.47 0.643 1.629 0.19 1.08 0.163 65.4 | 3.36 4.23 0.856 3.89 0.946 0.217 1.09 0.146 0.766 0.145 0.377 0.043 0.251 0.035 16.4 | 1.41 1.95 0.27 0.95 0.15 0.043 0.202 0.032 0.218 0.049 0.134 0.016 0.093 0.013 5.53 | 0.03 0.07 0.02 0.13 0.051 0.017 0.129 0.022 0.153 0.032 0.091 0.009 0.05 0.006 0.81 | 0.007 0.02 0.004 0.022 0.014 0.006 0.029 0.004 0.024 0.005 0.01 0.001 0.004 0.001 0.151 | 0.004 0.012 0.004 0.023 0.012 0.004 0.032 0.004 0.019 0.004 0.008 0.001 0.006 0.001 0.13 | 0.154 0.73 0.218 1.37 0.54 0.138 0.62 0.091 0.491 0.09 0.23 0.028 0.17 0.022 4.892 | 0.458 1.83 0.61 4.06 2.14 0.64 2.92 0.486 2.59 0.46 1.13 0.129 0.789 0.109 18.4 | 0.008 0.017 0.003 0.024 0.01 0.005 0.021 0.003 0.014 0.003 0.006 0.0004 0.003 0.0005 0.12 | 0.01 0.01 0.0032 0.02 0.015 0.005 0.035 0.004 0.024 0.005 0.01 0.001 0.006 0.001 0.15 |
| Sidi Taya | Hammam Jedidi | Jebel Oust | Oued M’Tek | |||||||||
|---|---|---|---|---|---|---|---|---|---|---|---|---|
| ST9 | STIII-5 | ST42-5 | ST50-2F | HJ-2F | HJ-1Sr | JO2-1 | JOIII-10 | JO-F | JO-FC | OM1 | OM-FC | |
| La Ce Pr Nd Sm Eu Gd Tb Dy Ho Er Tm Yb Lu ΣREE | 0.544 0.627 0.107 0.47 0.092 0.039 0.099 0.014 0.085 0.018 0.057 0.008 0 0.006 2.166 | 0.024 0.039 0.009 0.063 0.034 0.011 0.084 0.014 0.084 0.017 0.048 0.005 0.025 0.003 0.46 | 0.021 0.037 0.011 0.086 0.049 0.018 0.124 0.019 0.122 0.025 0.066 0.007 0.038 0.005 0.628 | 0.042 0.095 0.015 0.094 0.055 0.378 0.21 0.023 0.189 0.04 0.102 0.011 0 0 1.254 | 0.274 0.464 0.063 0.281 0.085 0.022 0.114 0.016 0.107 0.017 0.053 0.006 0.037 0.005 1.55 | 0.033 0.067 0.005 0.015 0 0.025 0.0003 0.00004 0.0003 0 0.0006 0.0002 0.0005 0.0001 0.15 | 0.68 0.75 0.09 0.35 0.051 0.018 0.09 0.011 0.06 0.013 0.031 0.003 0.011 0.001 2.159 | 8.23 11.63 1.77 7.35 0.83 0.16 0.69 0.053 0.19 0.021 0.041 0.002 0.006 0.001 30.974 | 0.077 0.079 0.013 0.082 0.038 0.032 0.135 0.018 0.11 0.023 0.056 0.005 0 0.003 0.671 | 0.076 0.164 0.045 0.276 0.099 0.063 0.289 0.044 0.305 0.068 0.184 0.02 0.11 0.015 1.76 | 0.093 0.475 0.110 0.919 1.21 0.439 4.38 0.85 4.61 0.776 1.64 0.145 0.637 0.066 16.36 | 0.050 0.251 0.072 0.736 1.274 0.542 5.10 1.03 5.75 0.96 2.01 0.178 0.751 0.074 18.795 |
| Fluorite Type | Laser Spots | ΣREE + Y | ΣLREE | ΣHREE | ΣMREE | ||||
|---|---|---|---|---|---|---|---|---|---|
| Fluorite vein G1 | 04-FIlCI1-01 | 2.5082 | 0.8175 | 0.125 | 1.6907 | 2.801 | 0.796 | 0.897 | 2.005 |
| 05-FlCI1-02 | 2.0149 | 0.8237 | 0.1302 | 1.1912 | 1.7187 | 0.6607 | 0 | 1.058 | |
| 06-FlCI1-03 | 2.1522 | 0.8686 | 0.1585 | 1.2836 | 1.83 | 0.694 | 0.376 | 1.136 | |
| 07-FlCI1-04 | 2.4342 | 1.684 | 0.1084 | 0.7502 | 3.43 | 2.887 | 0.51 | 0.543 | |
| 08-FlCI1-05 | 2.2643 | 1.1532 | 0.2183 | 1.1111 | 2.191 | 0.749 | 0.573 | 1.442 | |
| 09-FlCI1-06 | 2.6486 | 1.6325 | 0.2153 | 1.0161 | 2.232 | 1.134 | 0.735 | 1.098 | |
| 10-FlCI1-07 | 1.9981 | 0.9653 | 0.2183 | 1.0328 | 0.7855 | 0.1685 | 0 | 0.617 | |
| 11-FlCI1-08 | 1.0829 | 0.7624 | 0.0783 | 0.3205 | 0.383 | 0.137 | 0 | 0.246 | |
| 12-FlCI1-09 | 1.6257 | 1.1017 | 0.149 | 0.524 | 1.334 | 0.969 | 0 | 0.365 | |
| 13-FlCI1-10 | 3.982 | 2.5842 | 0.4825 | 1.3978 | 8.386 | 6.013 | 2.136 | 2.373 | |
| 14-FlCI1-11 | 2.5758 | 1.0265 | 0.2167 | 1.5493 | 2.247 | 0.646 | 0.739 | 1.601 | |
| 15-FlCI1-12 | 2.9467 | 2.045 | 0.2895 | 0.9017 | 3.47 | 2.659 | 0.876 | 0.811 | |
| 16-FlCI1-13 | 2.324 | 1.4276 | 0.2049 | 0.8964 | 2.497 | 0.468 | 0.35 | 2.029 | |
| 17-FlCI1-14 | 1.4222 | 0.8141 | 0.2073 | 0.6081 | 0.922 | 0.38 | 0.38 | 0.542 | |
| 18-FlCI1-15 | 4.3519 | 3.279 | 0.2097 | 1.0729 | 7.417 | 5.974 | 0.982 | 1.443 | |
| Σ = 36.3317 | Σ = 20.9853 | Σ = 3.0119 | Σ = 15.3464 | Σ = 41.6442 | Σ = 24.335 | Σ = 8.554 | Σ = 17.309 | ||
| 17-JSCIV-01 | 1.768 | 0.861 | 0.1861 | 0.907 | 0.872 | 0.57 | 0 | 0.302 | |
| 18-JSCIV-02 | 2.195 | 0.852 | 0.261 | 1.343 | 4.805 | 0.36 | 1.32 | 4.445 | |
| 19-JSCIV-03 | 1.839 | 0.729 | 0.128 | 1.11 | 1.2464 | 0.512 | 0.34 | 0.734 | |
| 20-JSCIV-04 | 1.923 | 0.659 | 0.2082 | 1.263 | 1.172 | 0.37 | 0.65 | 0.802 | |
| 21-JSCIV-05 | 2.155 | 0.692 | 0.2421 | 1.463 | 1.505 | 0.226 | 0.448 | 1.279 | |
| 22-JSCIV-06 | 2.503 | 1.044 | 0.392 | 1.458 | 3.512 | 1.502 | 1.32 | 2.01 | |
| 23-JSCIV-07 | 2.543 | 1.059 | 0.3499 | 1.484 | 5.793 | 2.703 | 2.05 | 3.09 | |
| 24-JSCIV-08 | 2.313 | 0.819 | 0.2325 | 1.495 | 8.166 | 0.679 | 0.89 | 7.487 | |
| 25-JSCIV-09 | 2.738 | 0.842 | 0.296 | 1.896 | 3.563 | 1.135 | 0.68 | 2.428 | |
| 26-JSCIV-10 | 1.541 | 0.415 | 0.109 | 1.125 | 0.703 | 0.16 | 0.16 | 0.543 | |
| 27-JSCIV-11 | 1.377 | 0.443 | 0.133 | 0.934 | 1.427 | 0.317 | 0.569 | 1.11 | |
| 28-JSCIV-12 | 2.005 | 0.682 | 0.227 | 1.323 | 1.897 | 0.83 | 0.837 | 1.067 | |
| 29-JSCIV-13 | 2.545 | 1.132 | 0.439 | 1.413 | 3.413 | 2.407 | 1.295 | 1.006 | |
| 30-JSCIV-14 | 1.949 | 0.762 | 0.301 | 1.187 | 2.087 | 1.117 | 0.78 | 0.97 | |
| 31-JSCIV-15 | 2.130 | 0.629 | 0.169 | 1.501 | 1.835 | 0.701 | 0.998 | 1.134 | |
| 32-JSCIV-16 | 2.315 | 0.846 | 0.253 | 1.469 | 2.825 | 1.03 | 0.85 | 1.795 | |
| 33-JSCIV-17 | 2.319 | 0.880 | 0.279 | 1.439 | 1.584 | 0.632 | 0.95 | 0.952 | |
| 34-JSCIV-18 | 3.574 | 1.496 | 0.555 | 2.077 | 5.883 | 4.36 | 2.4 | 1.523 | |
| Σ = 39.733 | Σ = 14.842 | Σ = 4.762 | Σ = 24.891 | Σ = 52.289 | Σ = 19.612 | Σ = 16.537 | Σ = 32.677 | ||
| Fluorite Cavity fillings G2 | 04-JSFv-01 | 4.3152 | 1.353 | 0.3721 | 2.9622 | 4.765 | 2.058 | 1.2 | 2.707 |
| 05-JSFv-02 | 5.6921 | 1.703 | 0.46 | 3.9891 | 6.675 | 1.901 | 2.03 | 4.774 | |
| 06-JSFv-03 | 4.672 | 1.271 | 0.316 | 3.401 | 3.984 | 1.137 | 1.07 | 2.847 | |
| 07-JSFv-04 | 5.343 | 1.645 | 0.552 | 3.697 | 7.561 | 2.83 | 2.26 | 4.731 | |
| 08-JSFv-05 | 4.337 | 1.167 | 0.387 | 3.17 | 3.289 | 1.182 | 0.96 | 2.107 | |
| 09-JSFv-06 | 4.961 | 1.215 | 0.371 | 3.746 | 3.165 | 0.557 | 0.51 | 2.608 | |
| 10-JSFv-07 | 4.691 | 1.682 | 0.368 | 3.009 | 4.128 | 2.188 | 0.93 | 1.94 | |
| 11-JSFv-08 | 4.642 | 1.405 | 0.187 | 3.237 | 5.058 | 2.107 | 0 | 2.951 | |
| 12-JSFv-09 | 4.055 | 1.076 | 0.197 | 2.979 | 3.505 | 0.416 | 0.218 | 3.089 | |
| 13-JSFv-10 | 4.5241 | 1.073 | 0.317 | 3.451 | 4.016 | 0.605 | 1.11 | 3.411 | |
| 14-JSFv-11 | 4.556 | 1 | 0.196 | 3.556 | 6.231 | 1.971 | 0.802 | 4.26 | |
| 15-JSFv-12 | 4.522 | 1.01 | 0.398 | 3.512 | 4.724 | 1.075 | 1.6 | 3.649 | |
| 16-JSFv-13 | 5.044 | 1.327 | 0.346 | 3.717 | 3.504 | 1.046 | 1.19 | 2.458 | |
| 17-JSFv-14 | 5.676 | 1.788 | 0.526 | 3.888 | 5.603 | 2.059 | 1.39 | 3.544 | |
| 18-JSFv-15 | 4.651 | 1.414 | 0.323 | 3.2374 | 5.017 | 2.289 | 1.39 | 2.728 | |
| 19-JSFv-16 | 5.744 | 1.762 | 0.48 | 3.982 | 7.153 | 2.407 | 1.7 | 4.746 | |
| Σ = 77.4267 | Σ = 21.8922 | Σ = 5.801 | Σ = 55.534 | Σ = 78.378 | Σ = 25.828 | Σ = 18.36 | Σ = 52.55 |
| Fluorite Type | Laser Spots | Major Elements | ||||||
|---|---|---|---|---|---|---|---|---|
| Ca | Na | Mg | Al | Si | Rb | Sr | ||
| Fluorite vein G1 | 01_NIST612_01 | 85,262.52 | 104,750.09 | 73.46 | 11,469.85 | 342,876.16 | 32.86 | 77.16 |
| 02_NIST612_02 | 85,262.52 | 103,792.62 | 79.28 | 11,263.92 | 338,900.53 | 31.82 | 75.97 | |
| 03_NIST612_03 | 85,262.52 | 102,096.27 | 71.71 | 10,886.57 | 334,418.59 | 30.87 | 76.16 | |
| 04-FlCI1-01 | 513,369.75 | 12.57 | 1.64 | 24.45 | 364.27 | 0.058 | 46.75 | |
| 05-FlCI1-02 | 513,369.72 | 2.72 | 0.81 | 1.28 | 1601.92 | 0.054 | 42.72 | |
| 06-FlCI1-03 | 513,369.72 | 67.25 | 0.88 | 7.76 | 2484.1 | 0.067 | 44.59 | |
| 07-FlCI1-04 | 513,369.72 | 64.62 | 0.7 | 8.15 | 1631.22 | 0.063 | 43.62 | |
| 08-FlCI1-05 | 513,369.72 | 19.42 | 1.03 | 3.46 | 1980.85 | 0.122 | 38.58 | |
| 09-FlCI1-06 | 513,369.72 | 21.5 | 1 | 3.33 | 2160.93 | 0.057 | 41.32 | |
| 10-FlCI1-07 | 513,369.72 | 1.3 | 1.14 | 1.36 | 1982.41 | 0.089 | 38.91 | |
| 11-FlCI1-08 | 513,369.75 | 90.95 | 9.97 | 15.06 | 3434.06 | 0.045 | 22.52 | |
| 12-FlCI1-09 | 513,369.72 | 501.45 | 1.31 | 2.94 | 2606.88 | 0.065 | 3.1 | |
| 13-FlCI1-10 | 513,369.72 | 25.86 | 239.33 | 412.4 | 4112.35 | 0.409 | 19.53 | |
| 14-FlCI1-11 | 513,369.72 | 164.46 | 1.13 | 1.37 | 1622.99 | 0.074 | 43.23 | |
| 15-FlCI1-12 | 513,369.72 | 21.3 | 1 | 18.82 | 2623.79 | 0.073 | 44.74 | |
| 16-FlCI1-13 | 513,369.69 | 16.58 | 0.63 | 1.3 | 2399.2 | 0.092 | 39.25 | |
| 17-FlCI1-14 | 513,369.69 | 0.79 | 0.6 | 1.13 | 1924.19 | 0.062 | 40.61 | |
| 18-FlCI1-15 | 513,369.69 | 1.18 | 0.62 | 1.29 | 2313.33 | 0.077 | 44.16 | |
| 19_NIST612_04 | 85,262.51 | 104,032.79 | 81.74 | 11,140.96 | 330,369.06 | 31.87 | 76.64 | |
| 20_NIST612_05 | 85,262.51 | 107,011.46 | 92.34 | 11,474.85 | 337,018.63 | 31.49 | 76.66 | |
| 21_NIST612_06 | 85,262.51 | 102,465.41 | 80.10 | 10,895.44 | 328,093.16 | 30.90 | 73.86 | |
| 15_NIST612_04 | 6.32 | 14.14 | 0.00053 | 0.868 | 2.09 | 9.55 | 6.51 | |
| 16_NIST612_05 | 6.32 | 14.74 | 0.00055 | 0.893 | 2.11 | 8.98 | 6.62 | |
| 17-JSCIV-01 | 38.03 | 81.31 | 2.28 | 1.01 | 2953.16 | 0.084 | 15.61 | |
| 18-JSCIV-02 | 38.03 | 13.84 | 4.17 | 1.85 | 2985.04 | 0.052 | 13.81 | |
| 19-JSCIV-03 | 38.03 | 2.78 | 0.53 | 0.82 | 2624.46 | 0.057 | 14.71 | |
| 20-JSCIV-04 | 38.03 | 6.64 | 2.38 | 2.24 | 1959.84 | 0.045 | 14.54 | |
| 21-JSCIV-05 | 38.03 | 76.31 | 19.77 | 12.37 | 3734.2 | 0.105 | 20.25 | |
| 22-JSCIV-06 | 38.03 | 4.48 | 13.63 | 0.97 | 2776.13 | 0.088 | 12.15 | |
| 23-JSCIV-07 | 38.03 | 17.65 | 14.03 | 4.2 | 2620.21 | 0.068 | 22.2 | |
| 24-JSCIV-08 | 38.03 | 3.84 | 2.2 | 1.06 | 2492.42 | 0.085 | 18.47 | |
| 25-JSCIV-09 | 38.03 | 3.75 | 2.43 | 0.9 | 1753.37 | 0.054 | 13.26 | |
| 26-JSCIV-10 | 38.03 | 3.41 | 1.74 | 0.5 | 2075.22 | 0.042 | 12.8 | |
| 27-JSCIV-11 | 38.03 | 332.94 | 826.48 | 34.32 | 2316.11 | 0.115 | 24.57 | |
| 28-JSCIV-12 | 38.03 | 2230.76 | 308.41 | 12.72 | 2509.5 | 0.4 | 39.88 | |
| 29-JSCIV-13 | 38.03 | 138.08 | 2.96 | 2.54 | 2390.01 | 0.053 | 22.34 | |
| 30-JSCIV-14 | 38.03 | 10.3 | 2.78 | 2.7 | 2707.83 | 0.088 | 25.09 | |
| 31-JSCIV-15 | 38.03 | 293.3 | 9.49 | 1.49 | 2465.02 | 0.085 | 23.61 | |
| 32-JSCIV-16 | 38.03 | 186.1 | 5.62 | 0.96 | 2141.51 | 0.086 | 24.04 | |
| 33-JSCIV-17 | 38.03 | 4.53 | 1.35 | 0.94 | 3209.87 | 0.058 | 25.37 | |
| 38.03 | ||||||||
| 35_NIST612_06 | 6.32 | 13.30 | 0.00051 | 0.836 | 1.97 | 8.66 | 6.44 | |
| 36_NIST612_07 | 6.32 | 14.62 | 0.00057 | 0.873 | 2.18 | 9.14 | 6.50 | |
| 37_NIST612_08 | 6.32 | 14.58 | 0.00060 | 0.871 | 2.13 | 9.25 | 6.30 | |
| 38_NIST612_09 | 6.32 | 14.61 | 0.00051 | 0.866 | 2.11 | 9.47 | 6.26 | |
| Fluorite cavity fillings G2 | 01_NIST612_01 | 85,262.52 | 104,124.49 | 82.81 | 11,239.08 | 338,817.94 | 31.97 | 77.25 |
| 02_NIST612_02 | 85,262.41 | 102,799.94 | 72.30 | 10,966.10 | 335,126.28 | 31.92 | 74.87 | |
| 03_NIST612_03 | 85,262.53 | 104,387.88 | 77.67 | 11,329.59 | 333,216.16 | 30.87 | 76.33 | |
| 04_JSFv_01 | 513,369.78 | 1431.75 | 550.56 | 136.85 | 4031.50 | 0.136 | 164.22 | |
| 513,369.78 | ||||||||
| 06-JSFv-03 | 513,369.81 | 1467.01 | 506.31 | 157.15 | 6992.34 | 0.086 | 43.35 | |
| 07-JSFv-04 | 513,369.78 | 1422.21 | 407.51 | 121.53 | 7374.52 | 0.264 | 43.23 | |
| 08-JSFv-05 | 513,369.78 | 978.93 | 252.55 | 69.60 | 5002.42 | <0.109 | 46.65 | |
| 09-JSFv-06 | 513,369.78 | 844.21 | 213.26 | 59.27 | 4722.07 | <0.102 | 121.39 | |
| 10-JSFv-07 | 513,369.81 | 815.84 | 324.68 | 78.54 | 5324.23 | <0.120 | 40.63 | |
| 11-JSFv-08 | 513,369.78 | 1609.93 | 535.54 | 184.21 | 6992.11 | <0.109 | 4582.06 | |
| 12-JSFv-09 | 513,369.72 | 1000.24 | 326.62 | 101.94 | 6377.11 | 0.154 | 34.41 | |
| 13-JSFv-10 | 513,369.72 | 832.31 | 262.78 | 69.29 | 5139.72 | <0.112 | 45.21 | |
| 14-JSFv-11 | 513,369.75 | 693.34 | 185.77 | 54.77 | 4226.74 | <0.071 | 37.99 | |
| 15-JSFv-12 | 513,369.75 | 1256.30 | 442.28 | 127.45 | 6428.53 | <0.082 | 43.31 | |
| 16-JSFv-13 | 513,369.75 | 1545.58 | 517.89 | 127.98 | 7057.51 | 0.171 | 37.85 | |
| 17-JSFv-14 | 513,369.72 | 1664.82 | 554.88 | 176.50 | 8261.05 | <0.096 | 44.66 | |
| 18-JSFv-15 | 513,369.72 | 1787.36 | 615.04 | 183.03 | 8200.88 | 0.209 | 37.95 | |
| 513,369.72 | ||||||||
| 20_NIST612_04 | 85,262.52 | 104,124.49 | 73.39 | 11,149.42 | 330,768.38 | 30.75 | 75.25 | |
| 21_NIST612_05 | 85,262.52 | 102,799.94 | 83.81 | 11,239.94 | 341,675.63 | 31.45 | 78.46 | |
| 22_NIST612_06 | 85,262.52 | 104,387.88 | 77.56 | 11,119.97 | 337,126.47 | 32.71 | 75.49 | |
| REEs Ratios | |||||||||||
|---|---|---|---|---|---|---|---|---|---|---|---|
| Fluorite Type | Laser Spots | Y/Ho | La/Ho | Tb/Caatom ratio | Tb/Laatom ratio | Eu/Eu* | Ce/Ce* | ||||
| Fluorite vein G1 | 3.19 | 0.23 | 2.10 | 0.77 | 0.78 | 0.15 | 7.50 × 10⁻⁹ | 0.38 | 0 | 0 | |
| 3.58 | 0.16 | 6.15 | 1.91 | 2.28 | 0.37 | 4.50 × 10⁻⁹ | 0.43 | 0 | 0 | ||
| 1.33 | 0.42 | 7.43 | 5.11 | 2.75 | 0.99 | 4.10 × 10⁻⁹ | 0.16 | 0 | 0.24 | ||
| 0.66 | 0.60 | 1.82 | 3.01 | 0.67 | 0.58 | 3.00 × 10⁻⁹ | 0.08 | 1.40 | 0.83 | ||
| 7.27 | 0.23 | 4.63 | 1.09 | 1.72 | 0.21 | 6.15 × 10⁻⁹ | 0.87 | 0 | 0 | ||
| FlCI1 | 4.95 | 0.23 | 4.14 | 1.90 | 1.53 | 0.37 | 8.00 × 10⁻⁹ | 0.60 | 0 | 0 | |
| 3.84 | 0.15 | 5.30 | 1.97 | 1.96 | 0.38 | 5.15 × 10⁻⁹ | 0.46 | 0 | 0 | ||
| 0 | 0 | 2.27 | 4.46 | 0.84 | 0.86 | 0 | 0 | 0 | 0 | ||
| 1.95 | 0.53 | 2.74 | 6.03 | 1.02 | 1.17 | 6.45 × 10⁻⁹ | 0.23 | 0 | 0.57 | ||
| 0.44 | 0 | 2.49 | 22.29 | 0.92 | 4.32 | 1.67 × 10⁻⁸ | 0.05 | 0.47 | 0.34 | ||
| 12.26 | 0.05 | 2.60 | 0.22 | 0.96 | 0.04 | 5.90 × 10⁻⁹ | 1.47 | 0 | 0 | ||
| 1.04 | 0.48 | 9.05 | 19.33 | 3.35 | 3.75 | 6.25 × 10⁻⁹ | 0.13 | 0 | 0.93 | ||
| 5.34 | 0.12 | 2.45 | 1.44 | 0.91 | 0.28 | 8.45 × 10⁻⁹ | 0.64 | 0 | 0 | ||
| 3.07 | 0.14 | 0 | 0 | 0 | 0 | 4.65 × 10⁻⁹ | 0.37 | 0 | 0 | ||
| 0.91 | 0.88 | 10.80 | 21.57 | 4.00 | 4.18 | 6.85 × 10⁻⁹ | 0.11 | 1.29 | 0.86 | ||
| 3.14 | 0.13 | 37.31 | 1.54 | 0.86 | 0.30 | 6.05 × 10⁻⁹ | 0.38 | 0 | 0 | ||
| 14.55 | 0.10 | 26.00 | 0.57 | 0.60 | 0.11 | 2.00 × 10⁻⁸ | 1.75 | 0 | 0 | ||
| 8.56 | 0 | 0 | 0 | 0 | 0 | 1.00 × 10⁻⁸ | 1.03 | 0 | 0 | ||
| 11.01 | 0.05 | 0 | 0 | 0 | 0 | 8.10 × 10⁻⁹ | 1.32 | 0 | 0 | ||
| 4.49 | 0.11 | 0 | 0 | 0 | 0 | 3.55 × 10⁻⁹ | 0.54 | 0 | 0 | ||
| 5.89 | 0 | 76.26 | 1.51 | 1.75 | 0.29 | 8.50 × 10⁻⁹ | 0.71 | 0 | 0 | ||
| 4.26 | 0.04 | 21.27 | 0.40 | 0.49 | 0.08 | 6.45 × 10⁻⁹ | 0.51 | 2.00 | 0 | ||
| 9.67 | 0.01 | 0 | 0 | 0 | 0 | 1.25 × 10⁻⁸ | 1.16 | 0 | 0 | ||
| JSCIV | 4.40 | 0.08 | 45.48 | 0.65 | 1.04 | 0.13 | 6.05 × 10⁻⁹ | 0.53 | 0 | 0 | |
| 3.14 | 0 | 136.00 | 2.75 | 3.12 | 0.53 | 4.45 × 10⁻⁹ | 0.38 | 0 | 0 | ||
| 10.41 | 0.17 | 64.48 | 0.98 | 1.48 | 0.19 | 8.80 × 10⁻⁹ | 1.25 | 0 | 0 | ||
| 6.26 | 0.09 | 74.83 | 0.78 | 1.72 | 0.15 | 4.95 × 10⁻⁹ | 0.75 | 0 | 0 | ||
| 6.28 | 0.13 | 108.77 | 1.09 | 2.50 | 0.21 | 5.35 × 10⁻⁹ | 0.75 | 0 | 0 | ||
| 4.87 | 0.08 | 0 | 0 | 0 | 0 | 3.75 × 10⁻⁹ | 0.59 | 0 | 0.20 | ||
| 6.87 | 0 | 95.59 | 1.34 | 2.19 | 0.26 | 8.60 × 10⁻⁹ | 0.83 | 0 | 0 | ||
| 4.22 | 0.21 | 51.60 | 1.24 | 1.18 | 0.24 | 9.00 × 10⁻⁹ | 0.51 | 0 | 0 | ||
| 5.09 | 0.15 | 53.74 | 1.50 | 1.23 | 0.29 | 1.19 × 10⁻⁸ | 0.61 | 0 | 0 | ||
| 2.86 | 0.20 | 143.20 | 2.40 | 3.29 | 0.47 | 5.90 × 10⁻⁹ | 0.34 | 0.60 | 0 | ||
| 1.54 | 0.38 | 60.48 | 1.81 | 2.30 | 0.42 | 8.05 × 10⁻⁹ | 1.33 × 10⁻³ | 0 | 0.41 | ||
| Fluorite cavity fillings G2 | 1.80 | 0.70 | 68.16 | 2.63 | 2.56 | 0.61 | 1.60 × 10⁻⁸ | 1.56 × 10⁻³ | 0 | 1.07 | |
| 5.47 | 0.25 | - | 6.30 | 15.71 | 1.45 | 1.73 × 10⁻⁸ | 4.73 × 10⁻³ | 0 | 0.80 | ||
| 2.04 | 0.42 | 123.60 | 3.76 | 0 | 0 | 1.32 × 10⁻⁸ | 1.77 × 10⁻³ | 0.56 | 0 | ||
| 1.92 | 0.21 | 128.37 | 2.60 | 4.91 | 0.61 | 7.40 × 10⁻⁹ | 1.66 × 10⁻³ | 0 | 0.21 | ||
| 4.96 | 0 | 72.08 | 0.92 | 2.75 | 0.22 | 1.50 × 10⁻⁸ | 4.29 × 10⁻³ | 0 | 0.36 | ||
| JSFv | 2.09 | 0.27 | 158.18 | 3.27 | 0 | 0 | 7.50 × 10⁻⁹ | 0.38 | 0 | 0 | |
| 0.50 | 2.71 | 52.86 | 4.59 | 1.99 | 1.06 | 4.50 × 10⁻⁹ | 0.43 | 0 | 0 | ||
| 1.04 | 0.37 | 141.12 | 4.52 | 5.37 | 1.05 | 4.10 × 10⁻⁹ | 0.16 | 0 | 0.24 | ||
| 2.30 | 0.37 | 135.00 | 3.09 | 5.08 | 0.71 | 3.0 0× 10−9 | 0.08 | 1.40 | 0.83 | ||
| 1.20 | 0.30 | 152.97 | 3.27 | 5.78 | 0.75 | 6.15 × 10⁻⁹ | 0.87 | 0 | 0 | ||
| 1.90 | 0.40 | 66.09 | 2.04 | 2.50 | 0.47 | 8.00 × 10⁻⁹ | 0.60 | 0 | 0 | ||
| 9.85 | 0.16 | 114.83 | 1.07 | 0 | 0 | 5.15 × 10⁻⁹ | 0.46 | 0 | 0 | ||
| 1.70 | 0.59 | 76.22 | 2.38 | 2.88 | 0.55 | 0 | 0 | 0 | 0 | ||
| 0.85 | 0.54 | 102.55 | 6.65 | 3.87 | 1.54 | 6.45 × 10⁻⁹ | 0.23 | 0 | 0.57 | ||
References
- Directorate-General for Internal Market, Industry, Entrepreneurship and SMEs; Grohol, M.; Veeh, C. Study on the Critical Raw Materials for the EU 2023: Final Report; Publications Office of the European Union: Luxembourg, 2023; Available online: https://data.europa.eu/doi/10.2873/725585 (accessed on 12 March 2025).
- Bau, M.; Dulski, P. Comparing Yttrium and Rare Earths in Hydrothermal Fluids from the Mid-Atlantic Ridge: Implications for Y and REE Behaviour during Near-Vent Mixing and for the Y/Ho Ratio of Proterozoic Seawater. Chem. Geol. 1999, 155, 77–90. [Google Scholar] [CrossRef]
- Bau, M.; Romer, R.L.; Lüders, V.; Dulski, P. Tracing Element Sources of Hydrothermal Mineral Deposits: REE and Y Distribution and Sr-Nd-Pb Isotopes in Fluorite from MVT Deposits in the Pennine Orefield, England. Miner. Depos. 2003, 38, 992–1008. [Google Scholar] [CrossRef]
- Castorina, F.; Masi, U.; Gorello, I. Rare Earth Element and Sr-Nd Isotopic Evidence for the Origin of Fluorite from the Silius Vein Deposit (Southeastern Sardinia, Italy). J. Geochem. Explor. 2020, 215, 106535. [Google Scholar] [CrossRef]
- Sánchez, V.; Cardellach, E.; Corbella, M.; Vindel, E.; Martín-Crespo, T.; Boyce, A.J. Variability in Fluid Sources in the Fluorite Deposits from Asturias (N Spain): Further Evidences from REE, Radiogenic (Sr, Sm, Nd) and Stable (S, C, O) Isotope Data. Ore Geol. Rev. 2010, 37, 87–100. [Google Scholar] [CrossRef]
- Möller, P.; Bau, M.; Dulski, P.; Lüders, V. REE and Yttrium Fractionation in Fluorite and Their Bearing on Fluorite Formation. In Proc. 9th Quadr IAGOD Symp.; 1998; pp. 575–592. Available online: https://www.researchgate.net/profile/Peter-Moeller-3/publication/284696707_REE_and_yttrium_fractionation_in_fluorite_and_their_bearing_on_fluorite_formation/links/5c33608c92851c22a3624c19/REE-and-yttrium-fractionation-in-fluorite-and-their-bearing-on-fluorite-formation.pdf (accessed on 12 March 2025).
- Schwinn, G.; Markl, G. REE Systematics in Hydrothermal Fluorite. Chem. Geol. 2005, 216, 225–248. [Google Scholar] [CrossRef]
- Dill, H.G.; Nolte, N.; Hansen, B. Lithology, Mineralogy and Geochemical Characterizations of Sediment-Hosted Sr–F Deposits in the Eastern Neo-Tethyan Region—With Special Reference to Evaporation and Halokinesis in Tunisia. J. Afr. Earth Sci. 2014, 92, 76–96. [Google Scholar] [CrossRef]
- Mondillo, N.; Boni, M.; Balassone, G.; Spoleto, S.; Stellato, F.; Marino, A.; Santoro, L.; Spratt, J. Rare Earth Elements (REE)—Minerals in the Silius Fluorite Vein System (Sardinia, Italy). Ore Geol. Rev. 2016, 74, 211–224. [Google Scholar] [CrossRef]
- Redina, A.A.; Nikolenko, A.M.; Doroshkevich, A.G.; Prokopyev, I.R.; Wohlgemuth-Ueberwasser, C.; Vladykin, N.V. Conditions for the Crystallization of Fluorite in the Mushgai-Khudag Complex (Southern Mongolia): Evidence from Trace Element Geochemistry and Fluid Inclusions. Geochemistry 2020, 80, 125666. [Google Scholar] [CrossRef]
- Jia, L.; Cai, C.; Li, K.; Liu, L.; Chen, Z.; Tan, X. Impact of Fluorine-Bearing Hydrothermal Fluid on Deep Burial Carbonate Reservoirs: A Case Study from the Tazhong Area of Tarim Basin, Northwest China. Mar. Pet. Geol. 2022, 139, 105579. [Google Scholar] [CrossRef]
- Strong, D.F.; Fryer, B.J.; Kerrich, R. Genesis of the St. Lawrence Fluorspar Deposits as Indicated by Fluid Inclusion, Rare Earth Element, and Isotopic Data. Econ. Geol. 1984, 79, 1142–1158. [Google Scholar] [CrossRef]
- Magotra, R.; Namga, S.; Singh, P.; Arora, N.; Srivastava, P.K. A New Classification Scheme of Fluorite Deposits. Int. J. Geosci. 2017, 8, 599–610. [Google Scholar] [CrossRef]
- Schlegel, T.U.; Wagner, T.; Fusswinkel, T. Fluorite as Indicator Mineral in Iron Oxide-Copper-Gold Systems: Explaining the IOCG Deposit Diversity. Chem. Geol. 2020, 548, 119674. [Google Scholar] [CrossRef]
- Richardson, C.K.; Holland, H.D. Fluorite Deposition in Hydrothermal Systems. Geochim. Cosmochim. Acta 1979, 43, 1327–1335. [Google Scholar] [CrossRef]
- Camprubí, A.; González-Partida, E.; Richard, A.; Boiron, M.-C.; González-Ruiz, L.E.; Aguilar-Ramírez, C.F.; Fuentes-Guzmán, E.; González-Ruiz, D.; Legouix, C. MVT-Like Fluorite Deposits and Oligocene Magmatic-Hydrothermal Fluorite–Be–U–Mo–P–V Overprints in Northern Coahuila, Mexico. Minerals 2019, 9, 58. [Google Scholar] [CrossRef]
- Gottis, C.; Sainfeld, P. Monographies Régionales, 2e Série: Tunisie—N°2—Les Gîtes Métallifères Tunisiens; La Rapide (Imp.): Paris, France, 1952; 104p. [Google Scholar]
- Floridia, S. La Province Fluorée Tunisienne: Aperçu Géologique et Métallogénique. Ann. Mines Géol. Tunis 1973, 26, 477–479. [Google Scholar]
- Souissi, F.; Souissi, R.; Dandurand, J.-L. The Genesis of the Mississippi Valley-Type Fluorite Ore at Jebel Stah (Zaghouan District, North-Eastern Tunisia) Constrained by Thermal and Chemical Properties of Fluids and REE and Sr Isotope Geochemistry. In Geochemistry—Earth’s System Processes; IntechOpen: London, UK, 2012. [Google Scholar] [CrossRef]
- Souissi, F.; Jemmali, N.; Souissi, R.; Dandurand, J.L. REE and Isotope (Sr, S, and Pb) Geochemistry to Constrain the Genesis and Timing of the F–(Ba–Pb–Zn) Ores of the Zaghouan District (NE Tunisia). Ore Geol. Rev. 2013, 55, 1–12. [Google Scholar] [CrossRef]
- Thibieroz, J. Hammam Jedidi et Hammam Zriba: Étude Géologique et Minière de Deux Gisements Stratiformes Dans le Cadre de la Province Fluorée Tunisienne; L’Association des Concentrations Fluorées aux Surfaces d’Émersion. Ph.D. Thesis, Univer-sité Paris VI, Paris, Fance, 1974; 432p. [Google Scholar]
- Touhami, A. Contribution à l’Étude Géologique et Métallogénique de la Province Fluorée Tunisienne; Rôle de l’Altération Su-perficielle dans la Formation des Concentrations Fluorées. Ph.D. Thesis, Université de Tunis, Tunis, Tunisia, 1979. [Google Scholar]
- Souissi, F. Étude Gîtologique et Conditions de Formation des Gisements de Fluorine (Pb–Zn–Ba) du Jebel Zaghouan (J. Stah et Sidi Taya) et du Jebel Oust, Tunisie Nord Orientale. Thesis, Université Paul Sabatier, Toulouse III, France, 1987. [Google Scholar]
- Bouhlel, S.; Fortuné, J.P.; Guilhaumou, N.; Touray, J.C. Les Minéralisations Stratiformes à F-Ba de Hammam Zriba, Jebel Guébli (Tunisie Nord Orientale): L’Apport des Études d’Inclusions Fluides à la Modélisation Génétique. Miner. Depos. 1988, 23, 166–173. [Google Scholar] [CrossRef]
- Souissi, F.; Dandurand, J.L.; Fortuné, J.P. Thermal and Chemical Evolution of Fluids during Fluorite Deposition in the Zaghouan Province, North-Eastern Tunisia. Miner. Depos. 1997, 32, 257–270. [Google Scholar] [CrossRef]
- Souissi, F.; Fortuné, J.P.; Sassi, R.; Bouhlel, S. Le Gisement de Fluorine et de Galène de Sidi Taya (Province de Zaghouan, Tunisie Nord-Orientale): Minéralogie et Étude des Inclusions Fluides. Notes Serv. Géol. Tunis. 1997, 63, 83–102. [Google Scholar]
- Souissi, F.; Fortuné, J.P.; Sassi, R. La Minéralisation Fluorée de Type Mississippi Valley du Jebel Stah (Tunisie Nord-Orientale). Bull. Soc. Géol. Fr. 1998, 169, 163–175. [Google Scholar]
- Souissi, F.; Souissi, R.; Dandurand, J.-L. The Mississippi Valley-Type Fluorite Ore at Jebel Stah (Zaghouan District, North-East-ern Tunisia): Contribution of REE and Sr Isotope Geochemistries to the Genetic Model. Ore Geol. Rev. 2010, 37, 15–30. [Google Scholar] [CrossRef]
- Turki, M.M.; Delteil, J.; Truillet, R.; Yaich, C. Les Inversions Tectoniques de La Tunisie Centro-Septentrionale. Bull. Société Géologique Fr. 1988, IV, 399–406. [Google Scholar] [CrossRef]
- Bejaoui, J. Géologie, Minéralogie, Éléments en Traces, Inclusions Fluides, Isotopes et Modélisation Génétique des Gisements à Pb-Zn et/ou F, Ba de la Tunisie Centroseptentrionale (Fedj Hassène, Hamra, Ajered, Kohol, Mecella, Mokta et M’Tak). Ph.D. Thesis, Université de Tunis II, Tunis, Tunisia, 2012; 260p. [Google Scholar]
- González-Partida, E.; Carrillo-Chávez, A.; Grimmer, W.; Pironon, J. Petroleum-Rich Fluid Inclusions in Fluorite, Purisima Mine, Coahuila, Mexico. Int. Geol. Rev. 2002, 44, 755–764. [Google Scholar] [CrossRef]
- Levresse, G.; Tritlla, J.; Villareal, J.; Gonzalez-Partida, E. The “El Pilote” Fluorite Skarn: A Crucial Deposit in the Understanding and Interpretation of the Origin and Mobilization of F from Northern Mexico Deposits. J. Geochem. Explor. 2006, 89, 205–209. [Google Scholar] [CrossRef]
- Paradis, S.; Hannigan, P.; Dewing, K. Mississippi Valley-Type Lead-Zinc Deposits. Mineral Deposits of Canada: A Synthesis of Major Deposit-Types, District Metallogeny, the Evolution of Geological Provinces, and Exploration Methods. In Geological As-sociation of Canada, Mineral Deposits Division: Special Publication; Geological Association of Canada: St. John’s, NL, Canada, 2007; Volume 3, pp. 185–203. [Google Scholar]
- De Graaf, S.; Lüders, V.; Banks, D.; Sośnicka, M.; John, K.; Kaden, H.; Vonhof, H.B. Fluid Evolution and Ore Deposition in the Harz Mountains Revisited: Isotope and Crush-Leach Analyses of Fluid Inclusions. Miner. Depos. 2019, 55, 47–62. [Google Scholar] [CrossRef]
- Zouaghi, T.; Ferhi, I.; Bédir, M.; Youssef, M.B.; Gasmi, M.; Inoubli, M.H. Analysis of Cretaceous (Aptian) Strata in Central Tunisia, Using 2D Seismic Data and Well Logs. J. Afr. Earth Sci. 2011, 61, 38–61. [Google Scholar] [CrossRef]
- Perthuisot, V. L’Évolution Structurale d’un Diapir Tunisien: Le Djebel Ech Cheid. Rev. Géogr. Phys. Géol. Dynam. 1972, 14, 145–152. [Google Scholar]
- Rouvier, H.; Perthuisot, V.; Mansouri, A. Pb-Zn Deposits and Salt-Bearing Diapirs in Southern Europe and North Africa. Econ. Geol. 1985, 80, 666–687. [Google Scholar] [CrossRef]
- Burollet, P.F. Structures and Tectonics of Tunisia. Tectonophysics 1991, 195, 359–369. [Google Scholar] [CrossRef]
- Bouaziz, S.; Barrier, E.; Soussi, M.; Turki, M.M.; Zouari, H. Tectonic Evolution of the Northern African Margin in Tunisia from Paleostress Data and Sedimentary Record. Tectonophysics 2002, 357, 227–253. [Google Scholar] [CrossRef]
- Jemmali, N.; Souissi, F.; Villa, I.M.; Vennemann, T.W. Ore Genesis of Pb–Zn Deposits in the Nappe Zone of Northern Tunisia: Constraints from Pb–S–C–O Isotopic Systems. Ore Geol. Rev. 2011, 40, 41–53. [Google Scholar] [CrossRef]
- Zouaghi, T.; Bédir, M.; Melki, F.; Gabtni, H.; Gharsalli, R.; Bessioud, A.; Zargouni, F. Neogene Sediment Deformations and Tectonic Features of Northeastern Tunisia: Evidence for Paleoseismicity. Arab. J. Geosci. 2010, 4, 1301–1314. [Google Scholar] [CrossRef]
- Decrée, S.; Marignac, C.; Liégeois, J.-P.; Yans, J.; Abdallah, R.B.; Demaiffe, D. Miocene Magmatic Evolution in the Nefza District (Northern Tunisia) and Its Relationship with the Genesis of Polymetallic Mineralizations. Lithos 2014, 192–195, 240–258. [Google Scholar] [CrossRef]
- Bonnefous, J. Contribution à l’Étude Stratigraphique et Micro-Paléontologique du Jurassique de Tunisie (Tunisie Septentrionale et Centrale, Sahel, Zone des Chotts). Ph.D. Thesis, University of Paris, Paris, France, 1972. Volume VI. 397p. [Google Scholar]
- Bouhlel, S. Gîtologie, Minéralogie et Essai de Modélisation des Minéralisations à F-Ba-Sr-Pb-Zn-(S) Associées aux Carbonates (Jurassiques et Crétacées) et aux Diapirs Triasiques: Gisements de Stah-Kohol, Zriba-Guebli, Bou Jaber et Fedj-el-Adoum (Tu-nisie Septentrionale); Ph.D. Thesis, Université de Tunis, Tunis, Tunisia, 1993; 303p. [Google Scholar]
- Biely, A.; Rakus, M. Sur l’Âge de la Base de l’ “Ammonitico Rosso dans la Dorsale Tunisienne”. Notes Serv. Géol. Tunis 1969, 31, 37–39. [Google Scholar]
- Radke, B.; Mathis, R.L. On the Formation and Occurrence of Saddle Dolomite. J. Sediment. Res. 1980, 50, 1149–1168. [Google Scholar] [CrossRef]
- Beales, F.W. Cementation by White Sparry Dolomite. In Carbonate Cements; Bricker, O.P., Ed.; Johns Hopkins University Press: Baltimore, MD, USA, 1971; pp. 330–338. [Google Scholar]
- Choquette, R.W. Late Ferroan Dolomite Cement, Mississippian Carbonates, Illinois Basin, USA. In Carbonate Cements; Bricker, O.P., Ed.; Johns Hopkins University Press: Baltimore, MD, USA, 1971; pp. 339–346. [Google Scholar]
- Gregg, J.M.; Sibley, D.F. Epigenetic Dolomitization and the Origin of Xenotopic Dolomite Texture. J. Sediment. Petrol. 1984, 54, 908–931. [Google Scholar]
- Beales, F.W.; Hardy, J.L. Zenger, D.J., Dunham, J.B., Ethington, R.L., Eds.; Criteria for the Recognition of Diverse Dolomite Types with an Emphasis on Studies on Host Rock for Mississippi Valley-Type Ore Deposits. In Concepts and Models of Dolomitization; SEPM Special Publication No. 28; SEPM Society for Sedimentary Geology: Claremore, OK, USA, 1980; pp. 197–213. [Google Scholar]
- Fontbote, L.; Amstutz, G.C. Facies and Sequence Analysis of Diagenetic Crystallization Rythmites in Stratabound Pb-Zn-(Ba-F) Deposits of the Alps and the Alpine Epoch in Europe. In Mineral Deposits of the Alps and of the Alpine Epoch in Europe; Springer: Berlin/Heidelberg, Germany; New York, NY, USA, 1983; pp. 347–358. [Google Scholar]
- Fontbote, L. Self-Organization Fabrics in Carbonate-Hosted Ore Deposits: The Example of Diagenetic Crystallization Rythmites (DCRs). In Current Research in Geology Applied to Ore Deposits, Proceedings of the Second Biennial SGA Meeting, Granada, Spain, 9–11 September 1993; Fenoll Hach-Ali, P., Torres-Ruiz, J., Gervillas, F., Eds.; Society for Geology Applied to Mineral Deposits: Praha, Czech Republic, 1993; pp. 11–14. [Google Scholar]
- Fontbote, L.; Gorawski, H. Genesis of the Mississippi Valley-Type Zn-Pb Deposit of San Vicente, Central Peru: Geological and Isotopic (Sr, O, C, S) Evidences. Econ. Geol. 1990, 85, 1402–1437. [Google Scholar] [CrossRef]
- Boni, M.; Iannace, A. Epigenetic Dolomitization and Mineralization in SW Sardinia (Italy). In Proceedings of the Actes du Colloque International, Orléans, France, 28–30 March 1988; Bureau de Recherches Géologiques et Minières, Ed.; Document du BRGM No. 183. Bureau de Recherches Géologiques et Minières: Orléans, France, 1988; pp. 171–186. [Google Scholar]
- Taylor, S.R.; McLennan, S.M. The Continental Crust: Its Composition and Evolution; Blackwell Scientific Publications: Oxford, UK, 1985; p. 312. [Google Scholar]
- Bau, M.; Dulski, P. Comparative Study of Yttrium and Rare-Earth Element Behaviours in Fluorine-Rich Hydrothermal Fluids. Contrib. Mineral. Petrol. 1995, 119, 213–223. [Google Scholar] [CrossRef]
- Mao, M.; Simandl, G.J.; Spence, J.; Neetz, M.; Marshall, D. Trace Element Composition of Fluorite and Its Potential Use as an Indicator in Mineral Exploration. Geological Fieldwork 2015; British Columbia Geological Survey Paper 2016-1; British Columbia Ministry of Energy and Mines: Victoria, BC, Canada, 2016; pp. 181–206. [Google Scholar]
- Haschke, S.; Gutzmer, J.; Wohlgemuth-Ueberwasser, C.C.; Kraemer, D.; Burisch, M. The Niederschlag Fluorite-(Barite) Deposit, Erzgebirge/Germany—A Fluid Inclusion and Trace Element Study. Miner. Depos. 2021, 56, 1071–1086. [Google Scholar] [CrossRef]
- Ronchi, L.H.; Touray, J.C.; Michard, A.; Dardenne, M.A. The Riberia Fluorite District, Southern Brazil: Geological and Geochemical (REE, Sm–Nd Isotopes) Characteristics. Miner. Depos. 1993, 28, 40–52. [Google Scholar]
- Hill, G.T.; Campbell, A.R.; Kyle, P.R. Geochemistry of Southwestern New Mexico Fluorite Occurrences Implications for Precious Metals Exploration in Fluorite-Bearing Systems. J. Geochem. Explor. 2000, 68, 1–20. [Google Scholar] [CrossRef]
- Constantopoulos, J. Fluid Inclusions and Rare Earth Element Geochemistry of Fluorite from South-Central Idaho. Econ. Geol. 1988, 83, 626–636. [Google Scholar] [CrossRef]
- Ekambaram, V.; Brookins, D.G.; Rosenberg, P.E.; Emanuel, K.M. Rare-Earth Element Geochemistry of Fluorite-Carbonate Deposits in Western Montana, U.S.A. Chem. Geol. 1986, 54, 319–331. [Google Scholar] [CrossRef]
- Möller, P.; Parekh, P.P.; Schneider, H.-J. The Application of Tb/Ca–Tb/La Abundance Ratios to Problems of Fluorspar Genesis. Miner. Depos. 1976, 11, 111–116. [Google Scholar] [CrossRef]
- Lu, L.; Liu, Y.; Liu, H.; Zhao, Z.; Wang, C.; Xu, X. Geochemical and Geochronological Constraints on the Genesis of Ion-Adsorption-Type REE Mineralization in the Lincang Pluton, SW China. Minerals 2020, 10, 1116. [Google Scholar] [CrossRef]
- Louvel, M.; Etschmann, B.; Guan, Q.; Testemale, D.; Brugger, J. Carbonate Complexation Enhances Hydrothermal Transport of Rare Earth Elements in Alkaline Fluids. Nat. Commun. 2022, 13, 1456. [Google Scholar] [CrossRef]
- Tostevin, R.; Shields, G.A.; Tarbuck, G.M.; He, T.; Clarkson, M.O.; Wood, R.A. Effective Use of Cerium Anomalies as a Redox Proxy in Carbonate-Dominated Marine Settings. Chem. Geol. 2016, 438, 146–162. [Google Scholar] [CrossRef]
- Rajabzadeh, M.A. A Fluid Inclusion Study of a Large MVT Barite-Fluorite Deposit: Komshecheh, Central Iran. Iran. J. Sci. Technol. Trans. A Sci. 2007, 31, 73–87. [Google Scholar]
- Migdisov, A.A.; Williams-Jones, A.E. Hydrothermal Transport and Deposition of the Rare Earth Elements by Fluorine-Bearing Aqueous Liquids. Miner. Depos. 2014, 49, 987–997. [Google Scholar] [CrossRef]
- Tsay, A.; Zajacz, Z.; Sanchez-Valle, C. Efficient Mobilization and Fractionation of Rare-Earth Elements by Aqueous Fluids upon Slab Dehydration. Earth Planet. Sci. Lett. 2014, 398, 101–112. [Google Scholar] [CrossRef]
- Bau, M.; Möller, P. Rare Earth Element Fractionation in Metamorphogenic Hydrothermal Calcite, Magnesite and Siderite. Mineral. Petrol. 1992, 45, 231–246. [Google Scholar] [CrossRef]
- Bau, M.; Koschinsky, A. Oxidative Scavenging of Cerium on Hydrous Fe Oxide: Evidence from the Distribution of Rare Earth Elements and Yttrium between Fe Oxides and Mn Oxides in Hydrogenetic Ferromanganese Crusts. Geochem. J. 2009, 43, 37–47. [Google Scholar] [CrossRef]
- Johannesson, K.H.; Palmore, C.D.; Fackrell, J.K.; Prouty, N.G.; Swarzenski, P.W.; Chevis, D.A.; Telfeyan, K.; White, C.J.; Burdige, D.J. Rare Earth Element Behavior during Groundwater–Seawater Mixing along the Kona Coast of Hawaii. Geochim. Cosmochim. Acta 2017, 198, 229–258. [Google Scholar] [CrossRef]
- Deluca, F.; Mongelli, G.; Paternoster, M.; Zhu, Y. Rare Earth Elements Distribution and Geochemical Behaviour in the Volcanic Groundwaters of Mount Vulture, Southern Italy. Chem. Geol. 2020, 539, 119503. [Google Scholar] [CrossRef]
- Elderfield, H.; Upstill-Goddard, R.; Sholkovitz, E.R. The Rare Earth Elements in Rivers, Estuaries, and Coastal Seas and Their Significance to the Composition of Ocean Waters. Geochim. Cosmochim. Acta 1990, 54, 971–991. [Google Scholar] [CrossRef]
- Mahdy, N.M.; Shalaby, M.H.; Helmy, H.M.; Osman, A.F.; El Sawey, E.S.H.; Zeid, E.K.A. Trace and REE Element Geochemistry of Fluorite and Its Relation to Uranium Mineralizations, Gabal Gattar Area, Northern Eastern Desert, Egypt. Arab. J. Geosci. 2014, 7, 2573–2589. [Google Scholar] [CrossRef]
- Bau, M. Rare-Earth Element Mobility during Hydrothermal and Metamorphic Fluid-Rock Interaction and the Significance of the Oxidation State of Europium. Chem. Geol. 1991, 93, 219–230. [Google Scholar] [CrossRef]
- Möller, P. Behavior of REE in Alteration Processes of Granites. Metallog. Collisional Orogens 1994, 368–375. [Google Scholar]
- Möller, P.; Stober, I.; Dulski, P. Seltenerdelement-, Yttrium-Gehalte Und Bleiisotope in Thermal- Und Mineralwässern Des Schwarzwaldes. Grundwasser 1997, 2, 118–132. [Google Scholar] [CrossRef]
- Wood, S.A. The Aqueous Geochemistry of the Rare-Earth Elements and Yttrium. Chem. Geol. 1990, 88, 99–125. [Google Scholar] [CrossRef]
- Sallet, R.; Moritz, R.; Fontignie, D. The Use of Vein Fluorite as Probe for Paleofluid REE and Sr–Nd Isotope Geochemistry: The Santa Catarina Fluorite District, Southern Brazil. Chem. Geol. 2005, 223, 227–248. [Google Scholar] [CrossRef]
- Zou, H.; Zhang, S.T.; Chen, A.Q.; Fang, Y.; Zeng, Z.F. Hydrothermal Fluid Sources of the Fengjia Barite-Fluorite Deposit in Southeast Sichuan, China: Evidence from Fluid Inclusions and Hydrogen and Oxygen Isotopes. Resour. Geol. 2016, 66, 24–36. [Google Scholar] [CrossRef]
- Lee, S.-G.; Lee, D.-H.; Kim, Y.; Chae, B.-G.; Kim, W.-Y.; Woo, N.-C. Rare Earth Elements as Indicators of Groundwater Environ-ment Changes in a Fractured Rock System: Evidence from Fracture-Filling Calcite. Appl. Geochem. 2003, 18, 135–143. [Google Scholar] [CrossRef]
- Ross, D.J.K.; Bustin, R.M. Investigating the Use of Sedimentary Geochemical Proxies for Paleoenvironment Interpretation of Thermally Mature Organic-Rich Strata: Examples from the Devonian–Mississippian Shales, Western Canadian Sedimentary Basin. Chem. Geol. 2009, 260, 1–19. [Google Scholar] [CrossRef]
- Sasmaz, A.; Kryuchenko, N.; Zhovinsky, E.; Suyarko, V.; Konakci, N.; Akgul, B. Major, trace and rare earth element (REE) geochemistry of different colored fluorites in the Bobrynets region, Ukraine. Ore Geol. Rev. 2018, 102, 338–350. [Google Scholar]
- Sasmaz, A.; Yavuz, F.; Sagiroglu, A.; Akgul, B. Geochemical patterns of the Akdagmadeni (Yozgat, Central Turkey) fluorite deposits and implications. J. Asian Earth Sci. 2005, 24, 469–479. [Google Scholar] [CrossRef]
- Hintzen, R.; Werner, W.; Hauck, M.; Klemd, R.; Fischer, L.A. Multistage Fluorite Mineralization in the Southern Black For-est, Germany: Evidence from Rare Earth Element (REE) Geochemistry. Eur. J. Miner. 2023, 35, 403–426. [Google Scholar] [CrossRef]
- Kraemer, D.; Viehmann, S.; Banks, D.; Sumoondur, A.D.; Koeberl, C.; Bau, M. Regional Variations in Fluid Formation and Metal Sources in MVT Mineralization in the Pennine Orefield, UK: Implications from Rare Earth Element and Yttrium Distribution, Sr-Nd Isotopes and Fluid Inclusion Compositions of Hydrothermal Vein Fluorites. Ore Geol. Rev. 2019, 107, 960–972. [Google Scholar] [CrossRef]
- Walter, B.L.; Gerdes, A.; Kleinhanns, I.C.; Dunkl, I.; von Eynatten, H.; Kreissl, S.; Markl, G. The Connection between Hydrothermal Fluids, Mineralization, Tectonics and Magmatism in a Continental Rift Setting: Fluorite Sm-Nd and Hematite and Carbonates U-Pb Geochronology from the Rhinegraben in SW Germany. Geochim. Cosmochim. Acta 2018, 240, 11–42. [Google Scholar] [CrossRef]
- Rddad, L.; Sośnicka, M.; Abdelhafid, E.; Kraemer, D.; Billström, K.; Mourad, E.; Toummite, A. Fluid Evolution and Origin of the Tamazert Fluorite Deposits, Moroccan High Atlas. J. Afr. Earth Sci. 2023, 200, 104856. [Google Scholar] [CrossRef]
- Namga, S.; Srivastava, P.K.; Magotra, R.; Singh, P. Trace Element Composition of Fluorite from the Chumathang Pegmatite Deposit, Eastern Ladakh, India. Resour. Geol. 2023, 73, e12322. [Google Scholar] [CrossRef]
- Deng, X.-H.; Chen, Y.-J.; Yao, J.-M.; Bagas, L.; Tang, H.-S. Fluorite REE-Y (REY) Geochemistry of the Ca. 850Ma Tumen Molybdenite–Fluorite Deposit, Eastern Qinling, China: Constraints on Ore Genesis. Ore Geol. Rev. 2014, 63, 532–543. [Google Scholar] [CrossRef]
- Bau, M. Controls on the Fractionation of Isovalent Trace Elements in Magmatic and Aqueous Systems: Evidence from Y/Ho, Zr/Hf, and Lanthanide Tetrad Effect. Contrib. Miner. Petrol. 1996, 123, 323–333. [Google Scholar] [CrossRef]
- Loges, A.; Migdisov, A.A.; Wagner, T.; Williams-Jones, A.E.; Markl, G. An Experimental Study of the Aqueous Solubility and Speciation of Y(III) Fluoride at Temperatures up to 250 °C. Geochimica Cosmochimica Acta 2013, 123, 403–415. [Google Scholar] [CrossRef]
- Graupner, T.; Mühlbach, C.; Schwarz-Schampera, U.; Henjes-Kunst, F.; Melcher, F.; Terblanche, H. Mineralogy of High-Field-Strength Elements (Y, Nb, REE) in the World-Class Vergenoeg Fluorite Deposit, South Africa. Ore Geol. Rev. 2015, 64, 583–601. [Google Scholar] [CrossRef]
- Anders, E.; Grevesse, N. Abundances of the Elements: Meteoritic and Solar. Geochim. Cosmochim. Acta 1989, 53, 197–214. [Google Scholar] [CrossRef]
- Bonsall, T.A.; Spry, P.G.; Voudouris, P.C.; Tombros, S.; Seymour, K.S.; Melfos, V. The Geochemistry of Carbonate-Replacement Pb-Zn-Ag Mineralization in the Lavrion District, Attica, Greece: Fluid Inclusion, Stable Isotope, and Rare Earth Element Studies. Econ. Geol. 2011, 106, 619–651. [Google Scholar] [CrossRef]
- Zou, H.; Xiao, B.; Gong, D.-X.; Huang, C.-C.; Li, M.; Yu, L.-M.; Tian, E.-Y.; Liu, C.-M.; Chen, H.-F.; Hu, C.-H. Origin and Tectonic Setting of Pingqiao Fluorite-Lithium Deposit in the Guizhou, Southwest Yangtze Block, China. Ore Geol. Rev. 2022, 143, 104755. [Google Scholar] [CrossRef]
- Möller, P.; Morteani, G. On the Geochemical Fractionation of Rare Earth Elements During the Formation of Ca-Minerals and Its Application to Problems of the Genesis of Ore Deposits. In The Significance of Trace Elements in Solving Petrogenetic Problems and Controversies; Augustithis, S.S., Ed.; Theophrastus: Athens, Greece, 1983; pp. 747–791. [Google Scholar]
- Yuan, S.; Peng, J.; Hu, R.; Bi, X.; Qi, L.; Li, Z.; Li, X.; Shuang, Y. Characteristics of Rare-Earth Elements (REE), Strontium and Neodymium Isotopes in Hydrothermal Fluorites from the Bailashui Tin Deposit in the Furong Ore Field, Southern Hunan Province, China. Chin. J. Geochem. 2008, 27, 342–350. [Google Scholar] [CrossRef]
- Makin, S.; Simandl, G.; Marshall, D. Fluorite and Its Potential as an Indicator Mineral for Carbonatite-Related Rare Earth Element Deposits. 2014. Available online: https://cmscontent.nrs.gov.bc.ca/geoscience/publicationcatalogue/Paper/BCGS_P2014-01-13_Makin.pdf (accessed on 12 March 2025).
- Khorshidi, E.; Etemadi, B. REE and Stable Isotope (C, O, S) Geochemistry of Fluorite from the Kamar-Mehdi Deposit, Southwest of Tabas, Iran. Arab. J. Geosci. 2016, 9, 123. [Google Scholar] [CrossRef]
- Hanor, J.S. Origin of Saline Fluids in Sedimentary Basins. Geol. Soc. Lond. Spec. Publ. 1994, 78, 151–174. [Google Scholar] [CrossRef]
- Chesley, J.T.; Halliday, A.N.; Scrivener, R.C. Samarium-Neodymium Direct Dating of Fluorite Mineralization. Science 1991, 252, 949–951. [Google Scholar] [PubMed]
- Weis, U.; Stoll, B.; Hell, K.; Winkes, E.; Jochum, K.P. Geostandards and Geoanalytical Research Bibliographic Review 2021. Geostand. Geoanalytical Res. 2022, 46, 753–759. [Google Scholar] [CrossRef]
- Whitford, D.J.; Korsch, M.J.; Solomon, M. Strontium Isotope Studies of Barites; Implications for the Origin of Base Metal Mineralization in Tasmania. Econ. Geol. 1992, 87, 953–959. [Google Scholar]
- Kessen, K.M.; Woodruff, M.S.; Grant, N.K. Gangue Mineral 87Sr/86Sr Ratios and the Origin of Mississippi Valley-Type Mineralization. Econ. Geol. 1981, 76, 913–920. [Google Scholar]
- Ruiz, J.; Richardson, C.K.; Patchett, P.J. Strontium Isotope Geochemistry of Fluorite, Calcite, and Barite of the Cave-in-Rock Fluorite District, Illinois. Econ. Geol. 1988, 83, 203–210. [Google Scholar]
- Duan, Z.-P.; Jiang, S.-Y.; Su, H.-M.; Zhu, X.-Y.; Zou, T.; Cheng, X.-Y. Trace and Rare Earth Elements, and Sr Isotopic Compositions of Fluorite from the Shihuiyao Rare Metal Deposit, Inner Mongolia: Implication for Its Origin. Minerals 2020, 10, 882. [Google Scholar] [CrossRef]
- Richardson, J.M.; Blenkinsop, J.; Bell, K. Extreme Variations in Strontium Initial Ratios in Ore-Related Fluids. Contrib. Miner. Petrol. 1990, 104, 516–529. [Google Scholar] [CrossRef]
- Burke, W.H.; Denison, R.E.; Hetherington, E.A.; Koepnick, R.B.; Nelson, H.F.; Otto, J.B. Variation of Seawater 87Sr/86Sr throughout Phanerozoic Time. Geol. Soc. Am. Bull. 1982, 10, 516–519. [Google Scholar] [CrossRef]
- Koepnick, R.B.; Denison, R.E.; Burke, W.H.; Hetherington, E.A.; Dahl, D.A. Construction of the Triassic and Jurassic Portion of the Phanerozoic Curve of Seawater 87Sr/86Sr. Chem. Geol. Isot. Geosci. Sect. 1990, 80, 327–349. [Google Scholar] [CrossRef]
- Benchilla, L.; Guilhaumou, N.; Mougin, P.; Jaswal, T.; Roure, F. Reconstruction of Palaeo-Burial History and Pore Fluid Pressure in Foothill Areas: A Sensitivity Test in the Hammam Zriba (Tunisia) and Koh-I-Maran (Pakistan) Ore Deposits. Geofluids 2003, 3, 103–123. [Google Scholar] [CrossRef]
- Jemmali, N.; Rddad, L.; Souissi, F.; Carranza, E.J.M. The Ore Genesis of the Jebel Mecella and Sidi Taya F Ba (Zn Pb) Mississippi Valley-Type Deposits, Fluorite Zaghouan Province, NE Tunisia, in Relation to Alpine Orogeny: Constraints from Geological, Sulfur, and Lead Isotope Studies. Comptes. Rendus. Geosci. 2019, 351, 312–320. [Google Scholar] [CrossRef]
Disclaimer/Publisher’s Note: The statements, opinions and data contained in all publications are solely those of the individual author(s) and contributor(s) and not of MDPI and/or the editor(s). MDPI and/or the editor(s) disclaim responsibility for any injury to people or property resulting from any ideas, methods, instructions or products referred to in the content. |
© 2025 by the authors. Licensee MDPI, Basel, Switzerland. This article is an open access article distributed under the terms and conditions of the Creative Commons Attribution (CC BY) license (https://creativecommons.org/licenses/by/4.0/).
Share and Cite
Somrani, C.; Souissi, F.; Souissi, R.; De Giudici, G.; Ferreira da Silva, E.; Fancello, D.; Podda, F.; Santos, J.F.; Abu-Alam, T.; Ribeiro, S.; et al. The Geochemical Characteristics of Ore-Forming Fluids in the Jebel Stah Fluorite Deposit in Northeast Tunisia: Insights from LA-ICP-MS and Sr Isotope Analyses. Minerals 2025, 15, 331. https://doi.org/10.3390/min15040331
Somrani C, Souissi F, Souissi R, De Giudici G, Ferreira da Silva E, Fancello D, Podda F, Santos JF, Abu-Alam T, Ribeiro S, et al. The Geochemical Characteristics of Ore-Forming Fluids in the Jebel Stah Fluorite Deposit in Northeast Tunisia: Insights from LA-ICP-MS and Sr Isotope Analyses. Minerals. 2025; 15(4):331. https://doi.org/10.3390/min15040331
Chicago/Turabian StyleSomrani, Chaima, Fouad Souissi, Radhia Souissi, Giovanni De Giudici, Eduardo Ferreira da Silva, Dario Fancello, Francesca Podda, José Francisco Santos, Tamer Abu-Alam, Sara Ribeiro, and et al. 2025. "The Geochemical Characteristics of Ore-Forming Fluids in the Jebel Stah Fluorite Deposit in Northeast Tunisia: Insights from LA-ICP-MS and Sr Isotope Analyses" Minerals 15, no. 4: 331. https://doi.org/10.3390/min15040331
APA StyleSomrani, C., Souissi, F., Souissi, R., De Giudici, G., Ferreira da Silva, E., Fancello, D., Podda, F., Santos, J. F., Abu-Alam, T., Ribeiro, S., & Rocha, F. (2025). The Geochemical Characteristics of Ore-Forming Fluids in the Jebel Stah Fluorite Deposit in Northeast Tunisia: Insights from LA-ICP-MS and Sr Isotope Analyses. Minerals, 15(4), 331. https://doi.org/10.3390/min15040331