Article

Spatial Distribution of Uranium and Thorium in the Soils of North Macedonia

1
Institute of Chemistry, Faculty of Natural Sciences and Mathematics, Ss Cyril and Methodius University in Skopje, Arhimedova 5, 1000 Skopje, North Macedonia
2
Geological Survey of Slovenia, Dimičeva 14, 1000 Ljubljana, Slovenia
*
Author to whom correspondence should be addressed.
Minerals 2025, 15(10), 1063; https://doi.org/10.3390/min15101063
Submission received: 12 September 2025 / Revised: 6 October 2025 / Accepted: 8 October 2025 / Published: 9 October 2025

Abstract

The aim of the study was to determine the spatial distribution and assess uranium and thorium contamination in the soils of North Macedonia. Topsoil samples (0–30 cm) were collected from 995 locations across the country on a 5 × 5 km grid. The soil samples were analysed by inductively coupled plasma–mass spectrometry (ICP-MS) using the total digestion method. The distribution of uranium and thorium in the soils is discussed according to the country’s 8 statistical regions, 15 major geological formations and 13 pedological units. The average uranium content is 2.1 mg/kg, ranging from <0.1 to 13 mg/kg (median 2.0 mg/kg), while the average thorium content is 9.3 mg/kg, ranging from 0.20 to 92 mg/kg (median 9.5 mg/kg). The spatial distribution patterns of U and Th in the soils of North Macedonia are very similar and are determined by geology (parent material and mineralisation). High uranium (2.9–13 mg/kg) and thorium (42–92 mg/kg) contents were found mainly in soils in the areas of Neogene and Palaeozoic igneous rocks and Neogene clastites (Pelagonian, East Macedonian zone), as well as in the Kratovo-Zletovo Massif in the north-eastern part of the country and in the Kožuf Mountains in the central and southern parts, where Neogene igneous rocks predominate. According to the pedological units, the hydromorphic soils (mean content of 2.9 mg/kg U and 12 mg/kg Th) in the valleys of the country’s main rivers, which predominate in the western part, were the richest for these elements.

1. Introduction

The origin and near-surface distribution of about 250 known uranium and/or thorium minerals provide insight into the principles of mineral evolution. Uranium and thorium represent a unique pair in the periodic table and are of particular importance to geoscientists. Uranium and thorium are the two largest naturally occurring elements and the most abundant of the actinide series. The energy released by the radioactive decay of U and Th has driven the thermal evolution of the Earth, resulting in its layered internal structure and the continuous movement of plates at the Earth’s surface [1]. The radioactive decay of 238U, 235U and 232Th also provides a rich array of radiogenic elements, such as radon, which are found in three naturally occurring radioactive decay chains.
238U and 232Th, which are at the top of the primordial radionuclide decay series, have been present in the Earth’s crust throughout its history [2]. The distribution of radionuclide concentrations reflects the migration of uranium and thorium under surface conditions, with the capacity for migration proceeding in the order U > Ra > Th. Uranium can remain in a soluble state over long periods of time and is translocated over long distances by the flow of streams or rivers. The horizontal transfer of uranium and thorium is determined by the alternation of sorption and desorption [3].
Rocks or minerals containing long-lived parent isotopes of the decay series (U and Th) are necessarily associated with other members of the decay series. Rocks that host U and Th include some crystalline rocks such as granites and quartz conglomerate metamorphic rocks, as well as certain sedimentary rocks, such as organic shales, sandstones, carbonates and phosphorites. The behaviour of radioelements found in the natural environment, therefore, depends on their geochemistry, their half-life and the nature of their environment [4].
Uranium (atomic number 92) is the 46th most abundant element in the Earth’s upper continental crust with an estimated abundance of 2.7 mg/kg [5]. The average uranium content in European topsoil is 2.45 mg/kg [6], while the average content in arable and pasture soils in Europe is 0.77 mg/kg and 0.74 mg/kg, respectively [7]. It occurs in nature in three radioactive isotopes. Its main oxidation state is +6. The three typical uranium minerals are uraninite (UO2), brannerite [(U,Ca,Ce)(Ti,Fe)2O6] and carnotite [K2(UO2)2(VO4)2·3H2O]. Uranium is also found in phosphate rock, lignite, and monazite sand. In common rock types, uranium content is highest in granite (4 mg/kg), felsic gneiss, shale, and schist (3 mg/kg), and its content is the lowest in basalt (0.1–0.5 mg/kg) and ultramafic rocks (0.02 mg/kg). Uranium is used extensively in glass and ceramics as a pigment, while depleted uranium (238U) is used in military shells and armour. Some apatite-based phosphate fertilisers can contain high levels of uranium. Uranium and its compounds are highly toxic, both chemically and radiologically [7].
Thorium (atomic number 90) is the 38th most abundant element in the Earth’s upper continental crust with an estimated abundance of 10.5 mg/kg. The average thorium content in European topsoil is 8.2 mg/kg [8]. Thorium belongs to the actinide series and occurs naturally as the radioactive isotope 232Th. Its predominant oxidation state is +4. Thorite (ThSiO4) and thorianite (ThO2) are two typical thorium minerals. Thorium is more widespread as an accessory element in rock-forming minerals such as zircon, epidote, sphene, apatite and allanite. In common rocks, Th concentrations are highest in granite (15 mg/kg), shale and schist (12 mg/kg) and lowest in basalt (0.3 mg/kg) and ultramafic rocks (0.05 mg/kg). Limestone contains traces of Th (2 mg/kg). When Th is released during weathering, it is strongly sorbed by clay minerals [7]. Thorium is an important alloying element in magnesium. It is used to coat tungsten wire for electronic devices. It is both chemotoxic and radiotoxic. All Th isotopes are sources of α-rays.
The occurrence of Th and U in surface soils and sediments is predominantly of geogenic origin [9]. However, some anthropogenic activities, such as electronics and mining, have contributed to their increased content [10,11,12,13,14,15]. The use of Th and U in newer technologies, the combustion of biomass and fossil fuels, the application of fertilisers, and electronic waste further increase their content in soil [15,16,17].
To date, very few results have been published on the U and thorium content of soils in North Macedonia, and these relate to a small number of measurements (around 200) that were not carried out as part of a systematic, standardised network [18]. Instead, the research has focused on the risk assessment of radionuclides in soils (including U and Th radioisotopes) at the national level [19,20] and for specific regions, such as Veles [21], Kavadarci [22] and Bitola [23,24] regions.
The aim of this work is to monitor and determine the distribution of uranium and thorium in soils from the entire area of North Macedonia using an evenly distributed 5 × 5 km sampling system, in which topsoil samples (0–30 cm) were taken at 995 locations. All statistically analysed data on U and Th contents, as well as the distribution maps of U and Th contents across the whole territory of North Macedonia, will allow for a detailed interpretation of the distribution of U and Th in soils by statistical regions, geological formations and pedological units.

2. Materials and Methods

2.1. Study Area

North Macedonia is a landlocked country in the central part of the Balkan Peninsula, located between 40°50′ and 42°20′ north latitude and between 20°28′ and 23°05′ east longitude (Figure 1). North Macedonia covers an area of 25,436 km2 and has a total population of 1,837,000 inhabitants (2021 census). Geographically, North Macedonia is characterised by a central valley formed by the Vardar River and framed by mountain ranges. The country is rich in minerals, with significant deposits of chromium and other non-ferrous metals (Cu, Pb, Zn, Ni and Mn). The country also has gypsum, marble and granite mines, while lignite provides 80% of Macedonia′s electricity [25]. North Macedonia is divided into eight statistical regions: Skopje, Pelagonia, Polog, Vardar, east, southeast, northeast and southwest.
Because of its characteristic natural and geographical features, there are two different climates in Macedonia: an altered Mediterranean climate and a temperate continental climate, with two distinct seasons—cold, wet winters and dry, hot summers—associated with the transitional seasons, spring and autumn. In mountainous regions, the climate is characterised by short, cool summers and significantly cold and moderately wet winters, with precipitation mostly as snow [25].

2.2. Geological Characteristics

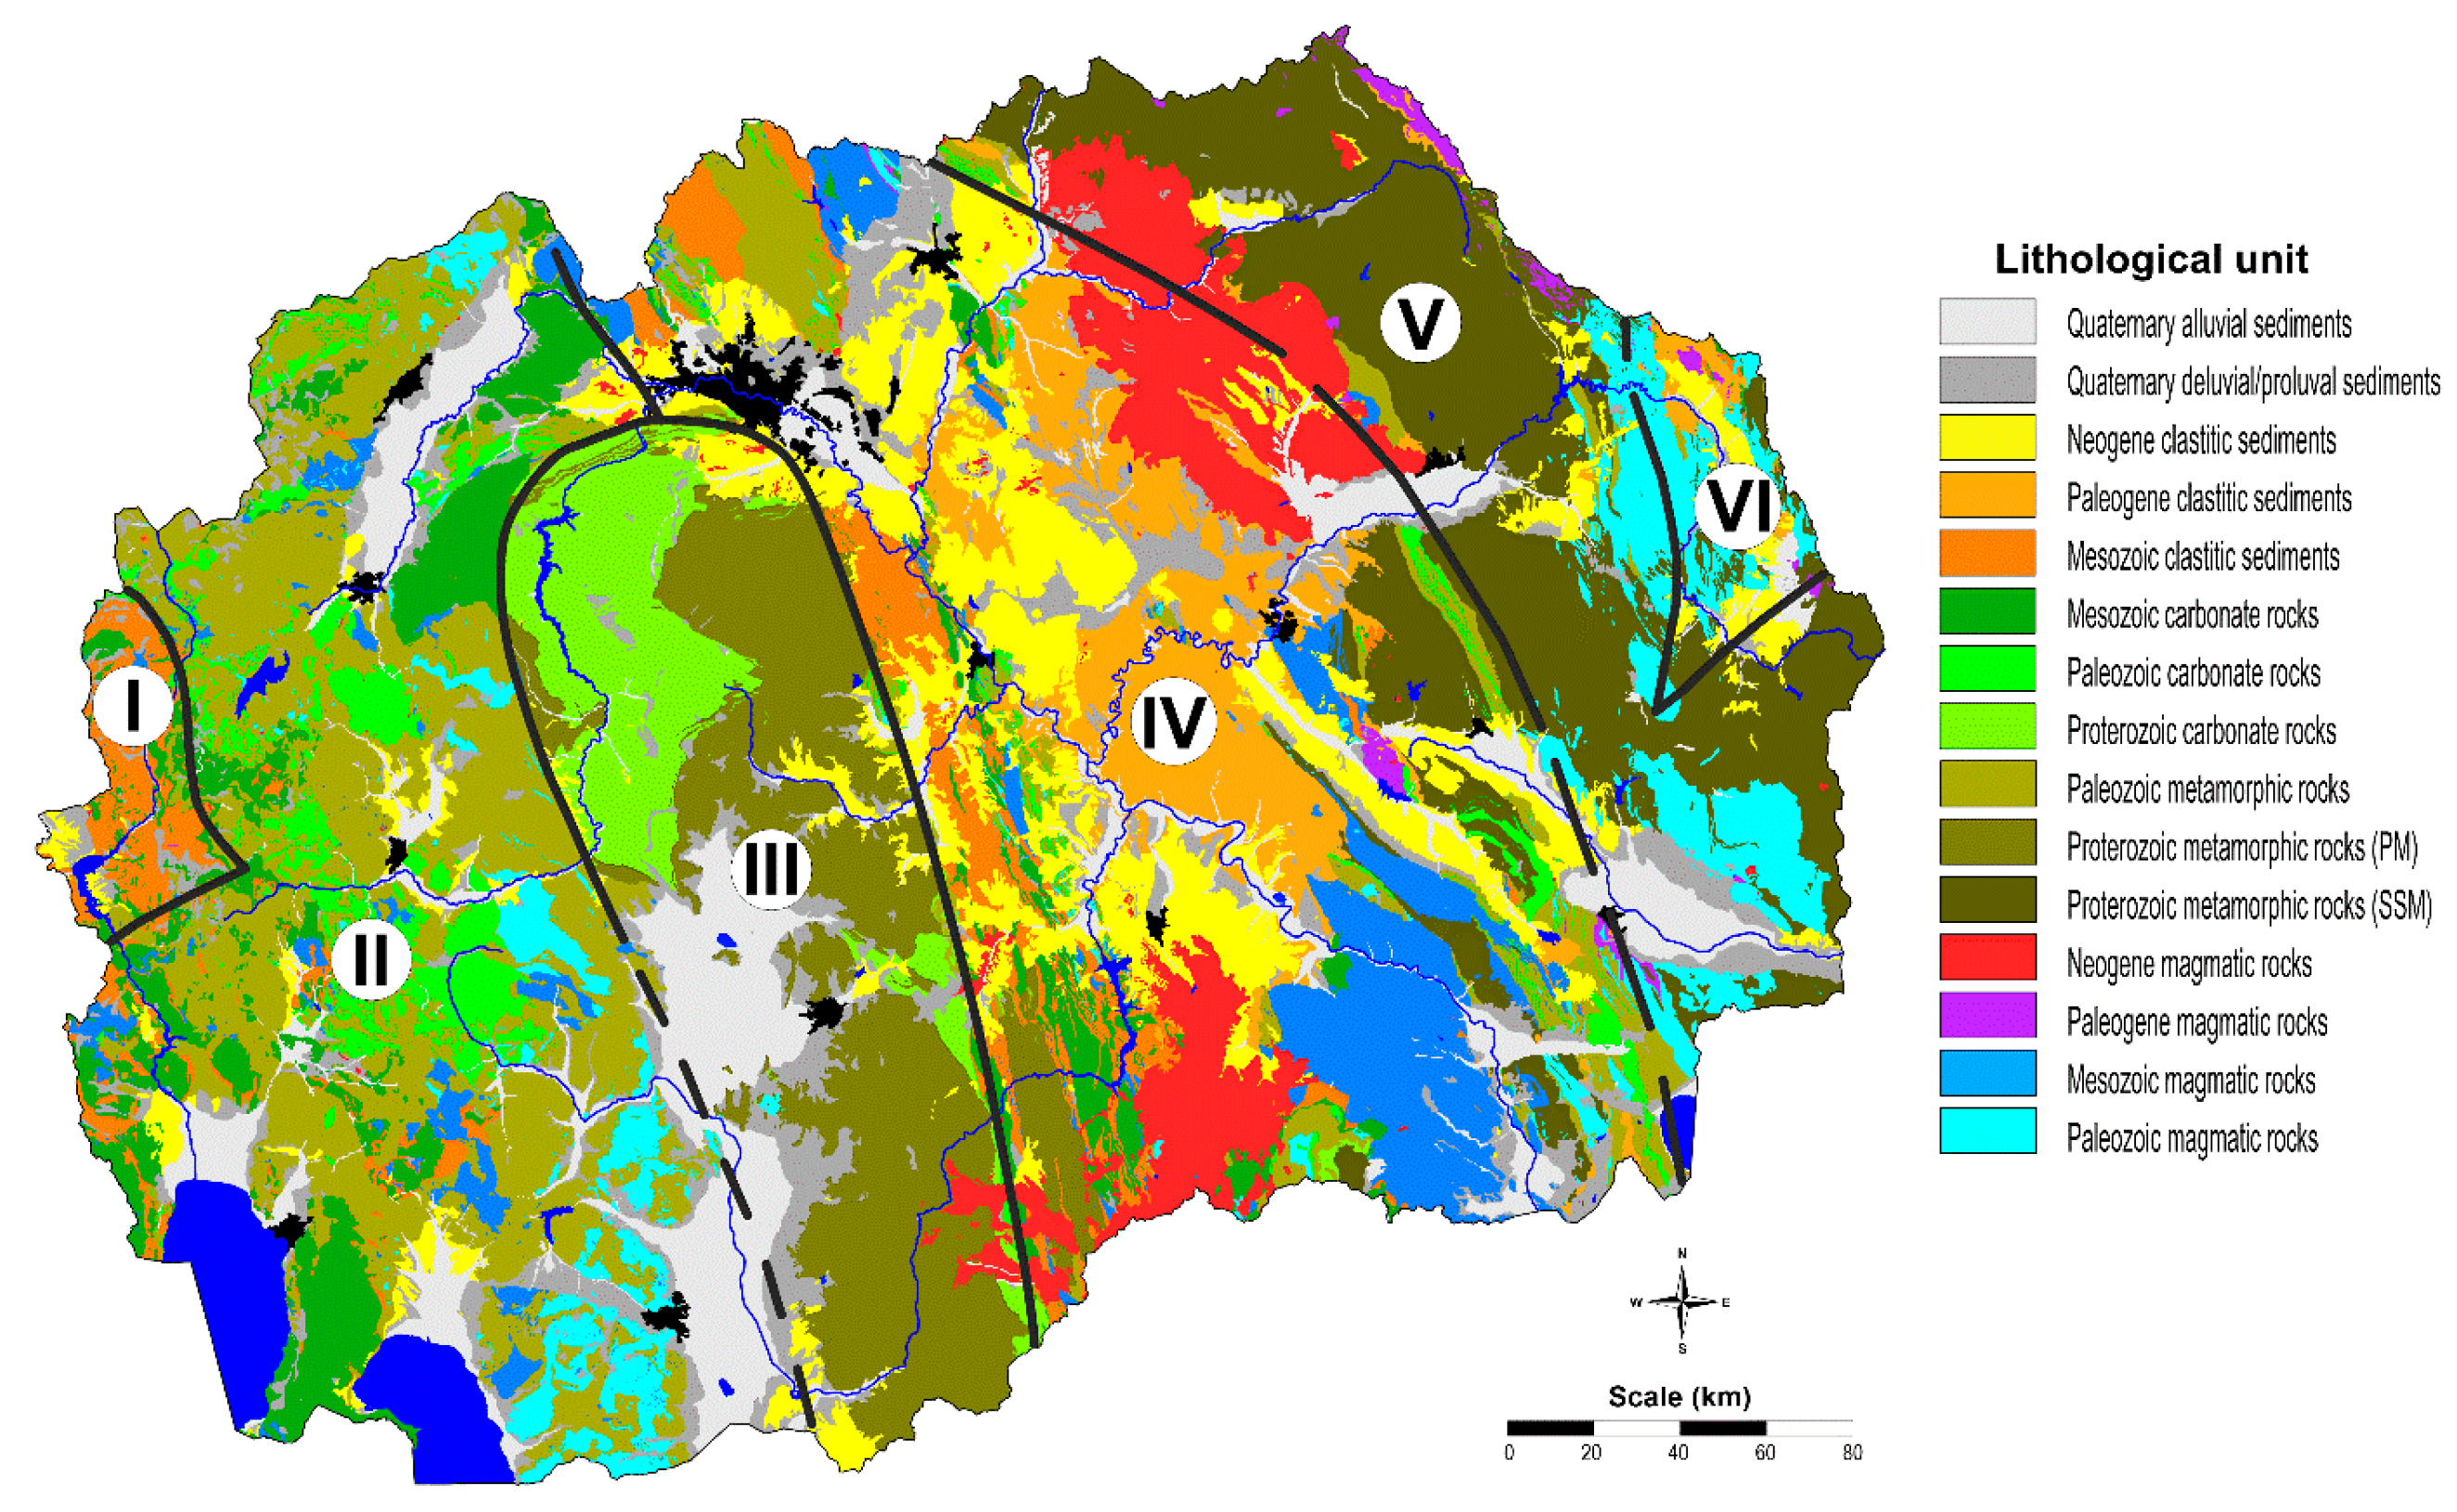
The main geological and tectonic features of North Macedonia are described in detail by Stafilov & Šajn [25] and Petrušev et al. [26] based on earlier studies by Pendžerkovski [27], Hadži-Mitrova [28], Dumurdžanov et al. [29,30] and Arsovski [31]. From a tectonic point of view, Macedonia comprises six major tectonic units: the Vardar Zone (VZ) in the central region, the Pelagonian Massif (PM), the West-Macedonian Zone (WMZ) and a small part of the Cukali-Krasta Zone (CKZ) in the west, and the Serbo-Macedonian Massif (SMM) and the Kraishtide Zone (KZ) in the east of the country (Figure 2).
The Cukali-Krasta Zone consists of Upper Cretaceous conglomerates, including sandstones, claystones and limestones with olistostromes and rudist limestones. The West-Macedonian Zone consists of low-grade metamorphic rocks, anchi-metamorphic Palaeozoic rocks and magmatites, Triassic and Jurassic sediments and magmatites, as well as Tertiary sediments. The Pelagonian Massif consists of a Proterozoic crystalline mass, with pronounced domes, brachy and open folds. Lithologically, it is composed of highly metamorphic rocks and granitoids.
The Vardar zone is characterised by the presence of Paleozoic low-metamorphic rocks, Triassic continental sediments, Jurassic ophiolites and ultrabasites and Cretaceous sediments, which are divided into numerous shells intruding Eocene-Oligocene sediments and volcanites. The main mass of the Serbo-Macedonian massif (SMM) consists of Lower or overthrusting Proterozoic and Upper Riphean-Cambrian complexes as well as relicts of Lower Paleozoic schists and intrusions of Hercynian granitoids. The Kraishtide Zone (KZ) represents the increased occurrence of metagabbros, metadiabases and green metasandstones within Hercynian aplitic granitoids [25].
The territory of Macedonia is covered by the following 15 main geological units, which are given in Figure 2: Quaternary alluvium (10.1%), Quaternary deluvium/proluvium (8.3%), Neogene clastites (9.7%), Paleogene clastites (5.0%), Mesozoic clastites (4.1%), Mesozoic carbonates (5.2%), Paleozoic carbonates (3.0%), Proterozoic carbonates (3.6%), Paleozoic metamorphic rocks (14.1%), metamorphic rocks of the Pelagonian Massif (8.5%), metamorphic rocks of the Serbo-Macedonian massif (11.6%), Neogene magmatic rocks (5.6%), Paleogene magmatic rocks (0.4%), Mesozoic magmatic rocks (4.8%) and Paleozoic magmatic rocks (5.3%) [25].

2.3. Pedological Characteristics

The soils in North Macedonia are extremely heterogeneous and vary greatly over small distances [32]. The following soil types have been defined: lithosols, regosols, arenosols, colluvial soils, rendzinas on hard limestones and dolomites, rendzinas, rankers, vertisols, chernozems, chromic cambisols, red soils (terra rossa), brown soils on limestones and dolomites, brown forest soils, illimerised soils, brown podzolic soils, alluvial soils, fluviatile meadow soils, hydromorphic black soils, gleyic soils, peat soils (histosols), pseudogleys, solonchaks and solonetz [33].

2.4. Soil Sampling and Analysis

This study involved determining the uranium and thorium contents in the topsoil (0–30 cm). Soil samples were collected between 2012 and 2014 from 995 sites within 5 × 5 km density grids (Figure 3). This grid is commonly used for the preparation of national soil atlases [34]. A denser grid was used for some smaller areas, as suggested by Golabkesh et al. [35], Vaziri et al. [36], or in some of our studies [37,38]. The soil samples were collected according to the relevant standards [39]. The soil samples were cleaned of plants and stones, then homogenised and dried at room temperature. They were then passed through a 2 mm sieve and ground in a porcelain mortar until they reached a final grain size of 125 μm.
All soil samples were sent for analysis to the accredited laboratory ACME Ltd. in Vancouver, Canada. After complete digestion of the samples (Multi Acid—ICP-ES/MS, Method MA200). The detection limit for uranium and thorium content of the method was 0.1 mg/kg. The precision was tested using the relative differences between pairs of analytical determinations of the same sample. Thirteen selected samples were replicated to achieve a precision of 4.68% for U and 8.05% for Th, respectively. The t-test [40] was used to estimate the accuracy and precision of the two analysed data sets. The value of 0.07 for U and 0.05 for Th at p < 0.05 means that the difference between the means of the two groups is not statistically significant. The estimation of trueness and precision of the two analysed data sets was also performed by calculating the precision and t-test, by analysing two certified reference materials of soil, OREAS 25a and OREAS 45A. From the results of precision (3.36% and 2.73% for U and 5.93% and 4.02% for Th) and t-test (0.40 and −0.82 for U and 0.99 and 0.25 for Th at p < 0.05), it could be concluded that there are no significant differences between the certified and received data.
All data processing and calculations, geostatistical data interpretations and visualisations (mapping) were performed using the following software programmes: Statistica (Stat Soft Inc., Tulsa, OK, USA), Autodesk MAP 3D (Autodesk Inc., San Francisco, CA, USA), QGIS (Open Source Geographic Information System, Chicago, USA) and Surfer (Golden Software Inc., Golden, CO, USA). For the development of the distribution maps, the Kriging method with linear variogram interpolation was applied.

3. Results and Discussion

The basic statistical data on uranium and thorium contents in the topsoil of North Macedonia are presented in Table 1. The mean uranium and thorium contents are 2.5 mg/kg and 11 mg/kg, respectively, while the median U and Th contents are 2.0 mg/kg and 9.5 mg/kg, respectively. The low detection limit for uranium below 0.1 mg/kg was observed in fewer samples. The analysis showed that these cases are related to the nature of the area, which is mainly of lithogenic origin [41].
It was found that the mean and median values for U and Th are similar to those for the European topsoil (2.36 mg/kg and 2.0 mg/kg for U and 11 mg/kg and 9.5 mg/kg for Th) and in the upper continental crust (2.7 mg/kg U and 10.5 mg/kg Th) (Table 2). In some areas of the country, U and Th contents increase up to their maximum values of 13 mg/kg U and 92 mg/kg Th.
Data on national-level contents of U and Th in neighbouring countries are scarce. Only data on Th content in soils from Croatia are available, with a mean of 13 mg/kg and a median of 12.5 mg/kg, which are similar to those for North Macedonia (Table 1). In preparing the study for Chemistry of European Soils [7], general data were provided for many European countries, but these were obtained by analysing soil samples using aqua regia dissolution, with a smaller grid and a significantly smaller number of samples. It was found that uranium content in soils from neighbouring countries is highest in Slovenia, followed by Croatia, North Macedonia, Greece, Serbia, and Bulgaria (ranging from 3 to 6 mg/kg). For thorium content, it is highest in soils from Bulgaria, followed by Slovenia, North Macedonia, Croatia, and Greece (ranging from 3 to 6 mg/kg).
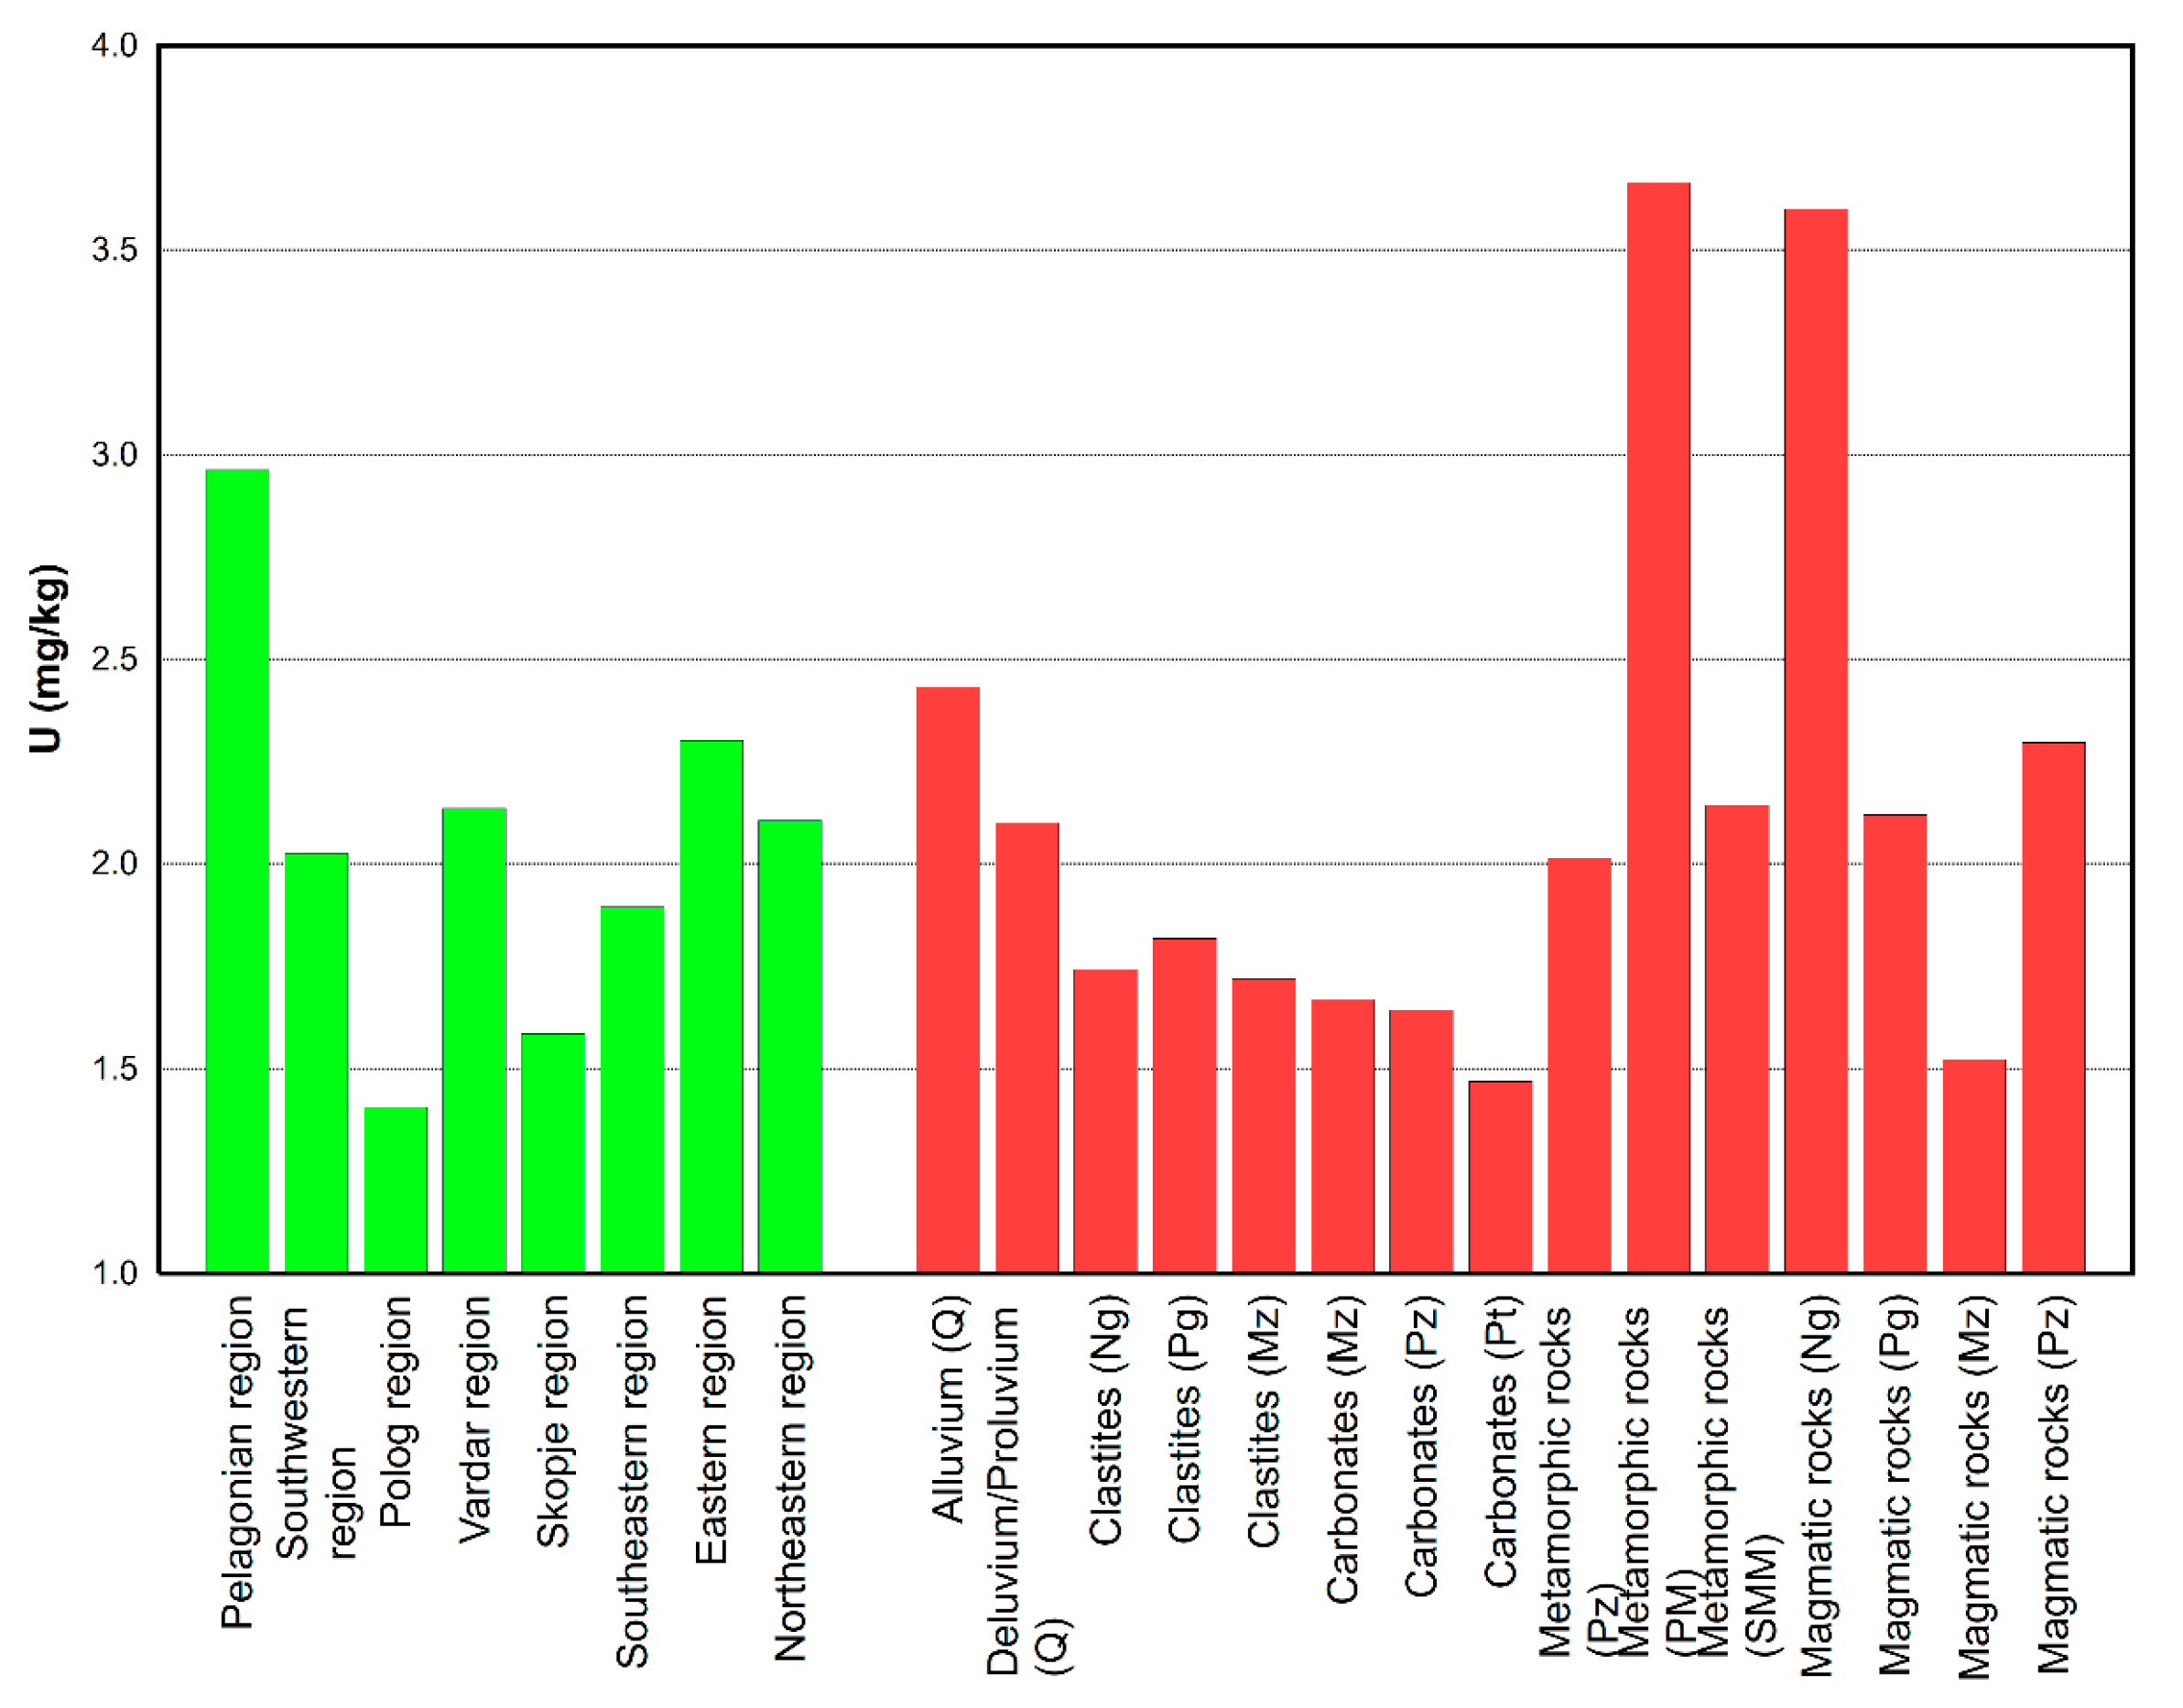
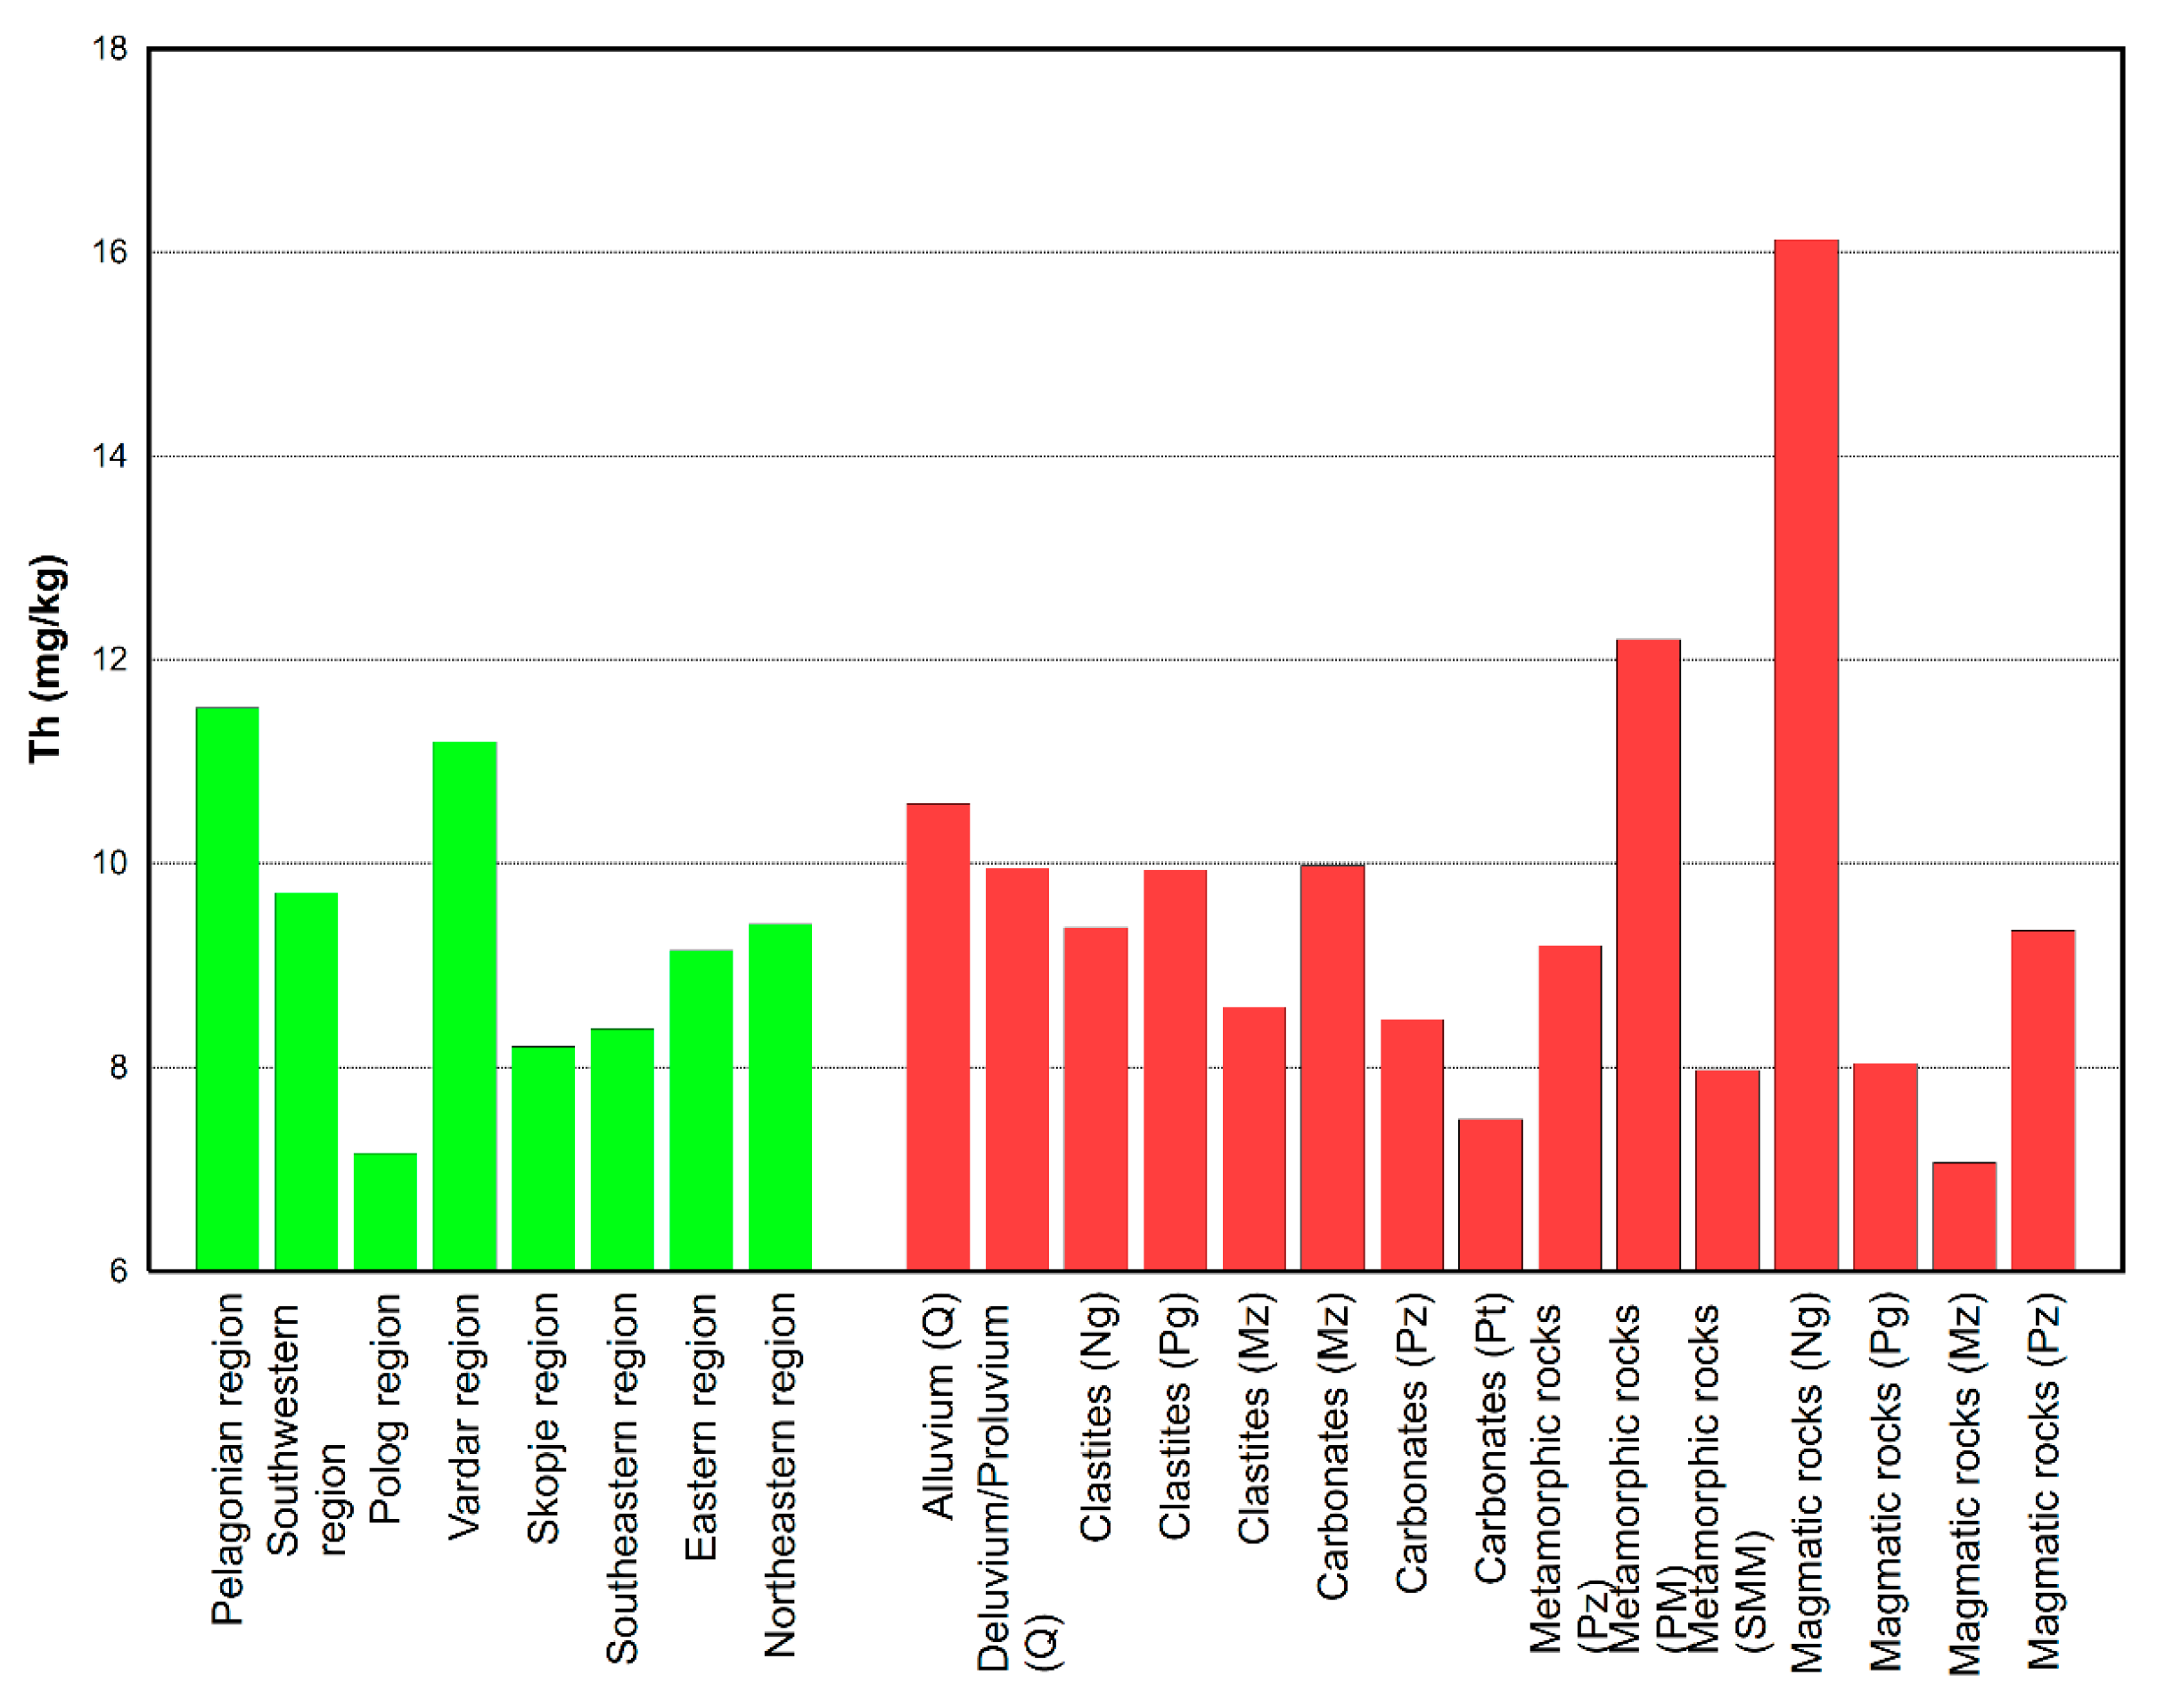
The basic statistical data (mean, median, minimum and maximum) for U and Th content in soils according to country regions (Table 3, Figure 4 and Figure 5) show higher median values in the Pelagonian region in the western part of the country, with contents of 3.0 mg/kg U and 12 mg/kg Th. In the other regions, the median content is below the national median (2.5 mg/kg U and 11 mg/kg Th).
Depending on the geological formation, the elevated U and Th contents in this region are mainly due to the presence of Neogene magmatic rocks and Mesozoic carbonates, which have relatively high U and Th contents compared to other geological formations (Table 4, Figure 4 and Figure 5). The highest mean uranium and thorium contents in soils were found in the area where metamorphic rocks of the Pelagonian Massif (3.7 mg/kg U and 12 mg/kg Th) and Neogene magmatic rocks (3.6 mg/kg U and 16 mg/kg Th) predominate. The areas with Quaternary alluvium (2.4 mg/kg U and 11 mg/kg Th) and Paleozoic magmatic rocks (2.3 mg/kg U and 9.3 mg/kg Th) were found to have slightly higher mean uranium contents than the mean contents in soils across the entire national territory.
According to the pedological units (Table 5), the hydromorphic soils in the valleys of the country’s main rivers, which predominate in the western part of the country, were the richest in these elements. It is known that geochemical processes such as reduction and oxidation are involved in these increased concentrations [42,43]. The mean uranium content is 2.9 mg/kg, ranging from 7.8 to 7.7 mg/kg, while the mean content of Th is 12 mg/kg, ranging from 7.8 to 17 mg/kg. The lowest contents were found in the anthroposols with 1.1 mg/kg U and 6.4 mg/kg Th. According to the pedological units (Table 5), the hydromorphic soils in the valleys of the country’s main rivers, which predominate in the western part of the country, were the richest in these elements. The mean U and Th contents were very similar in the other pedological units, regardless of land use, with the lowest content in the anthropogenic soils being 1.5 mg/kg U and 6.4 mg/kg Th.
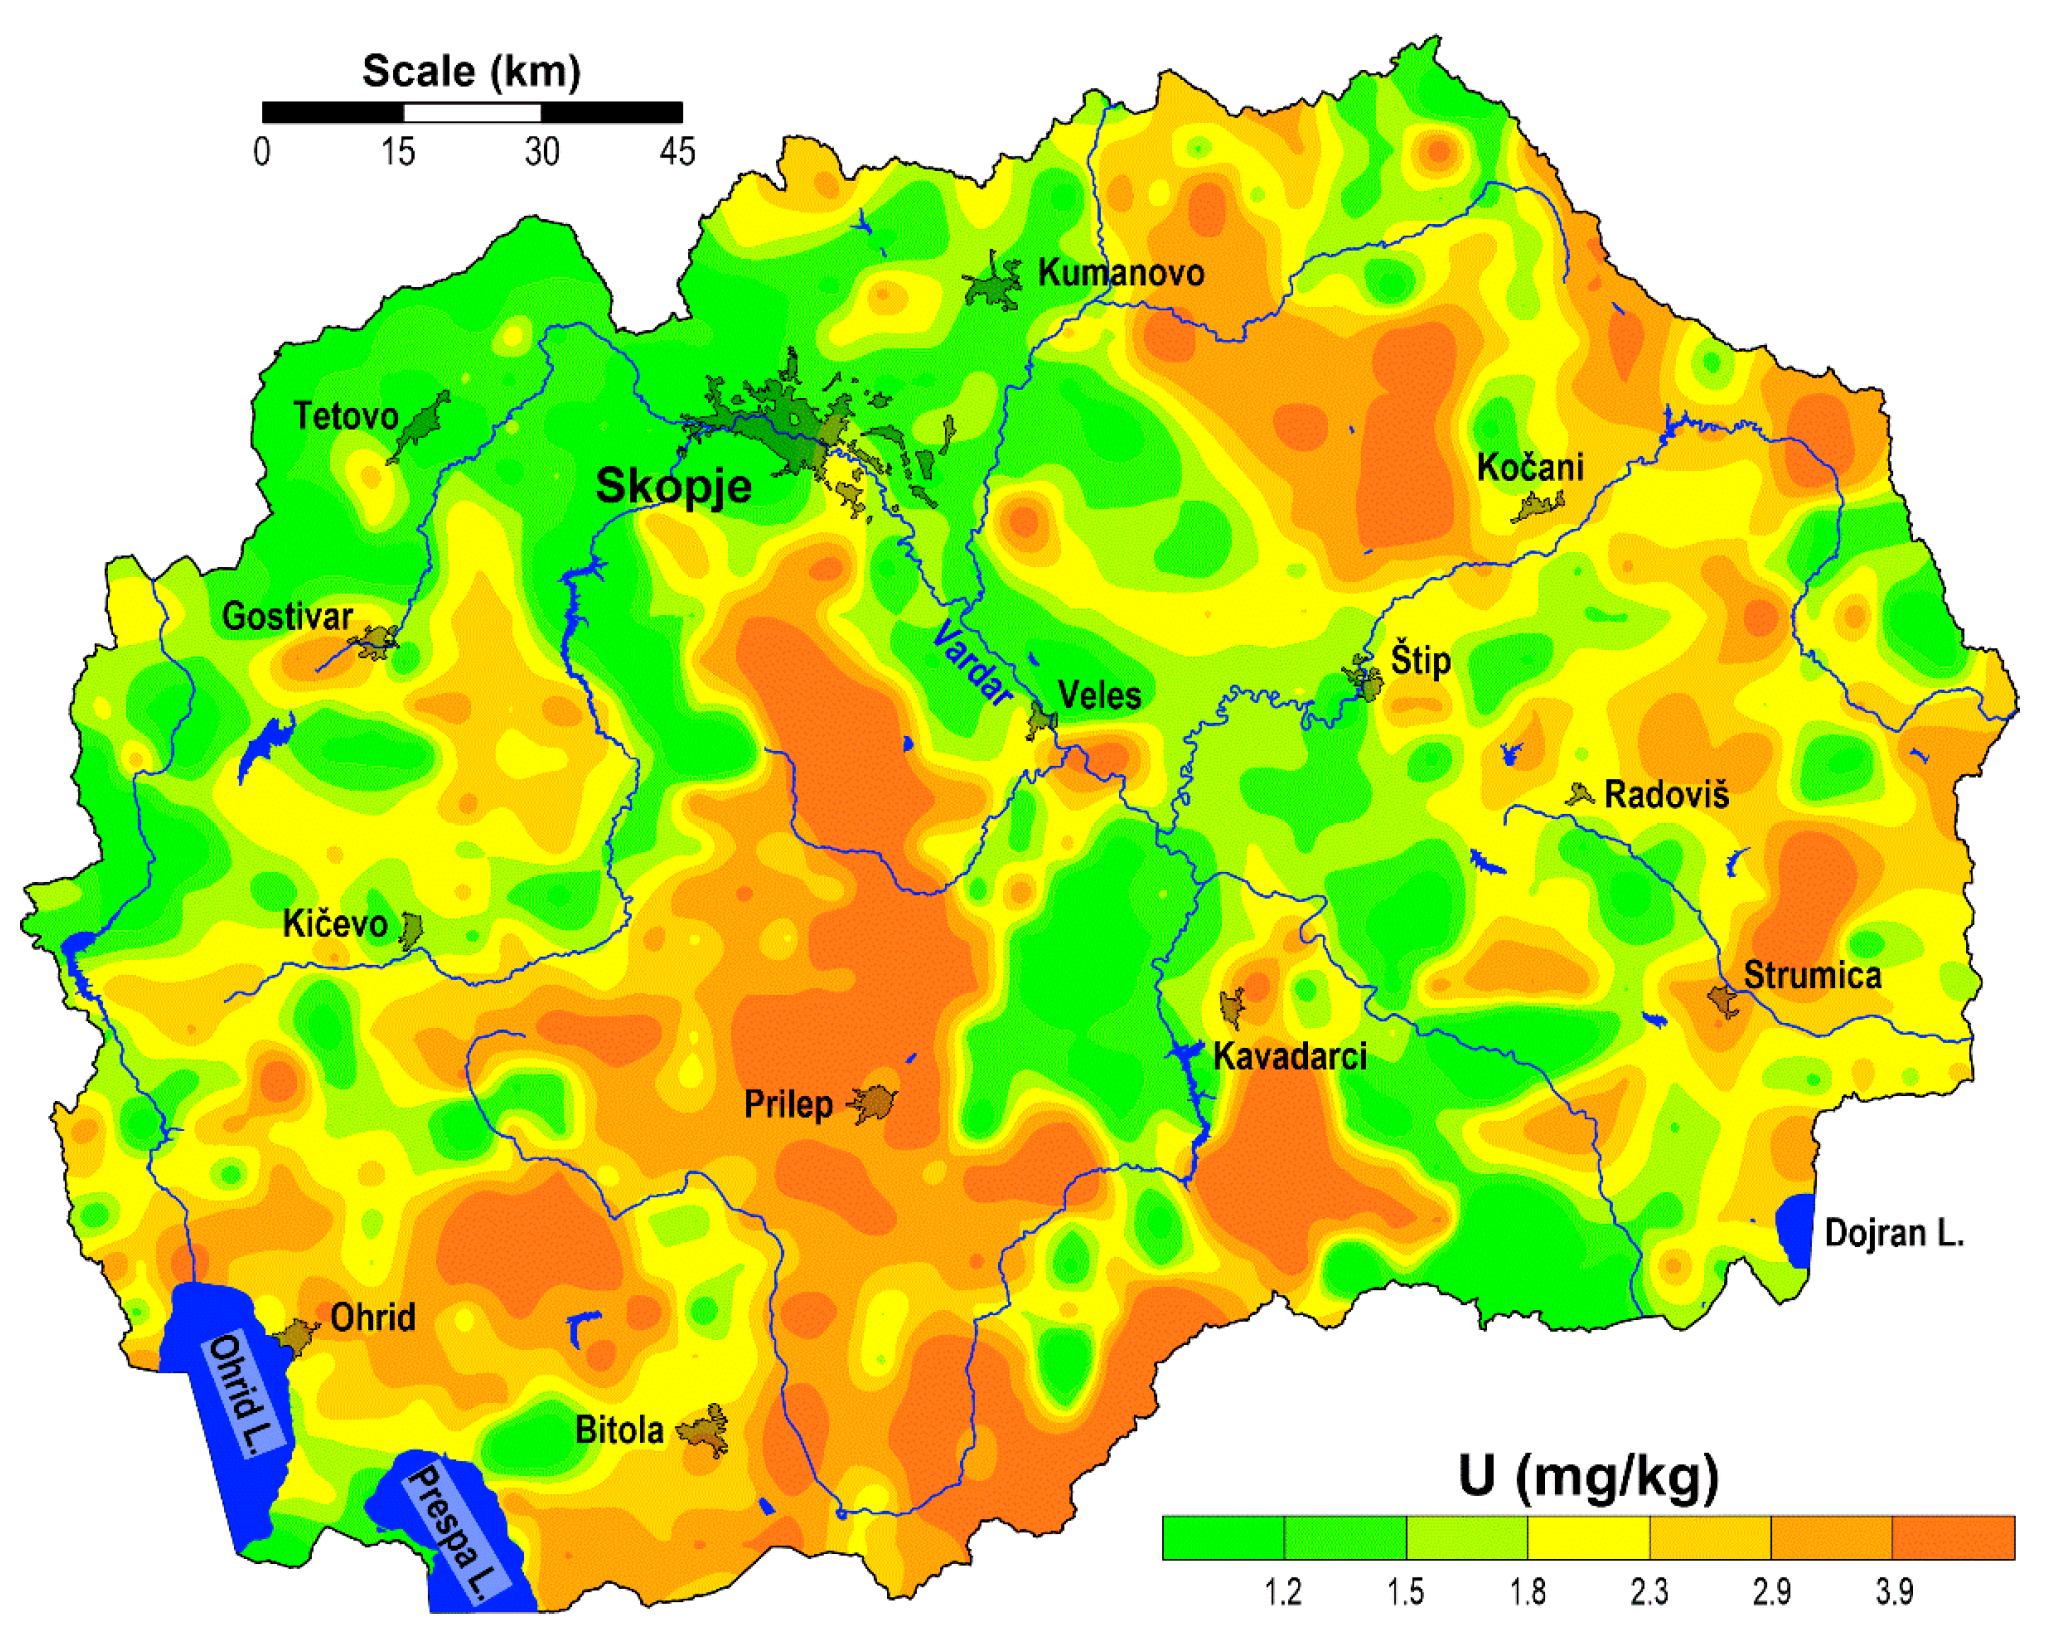
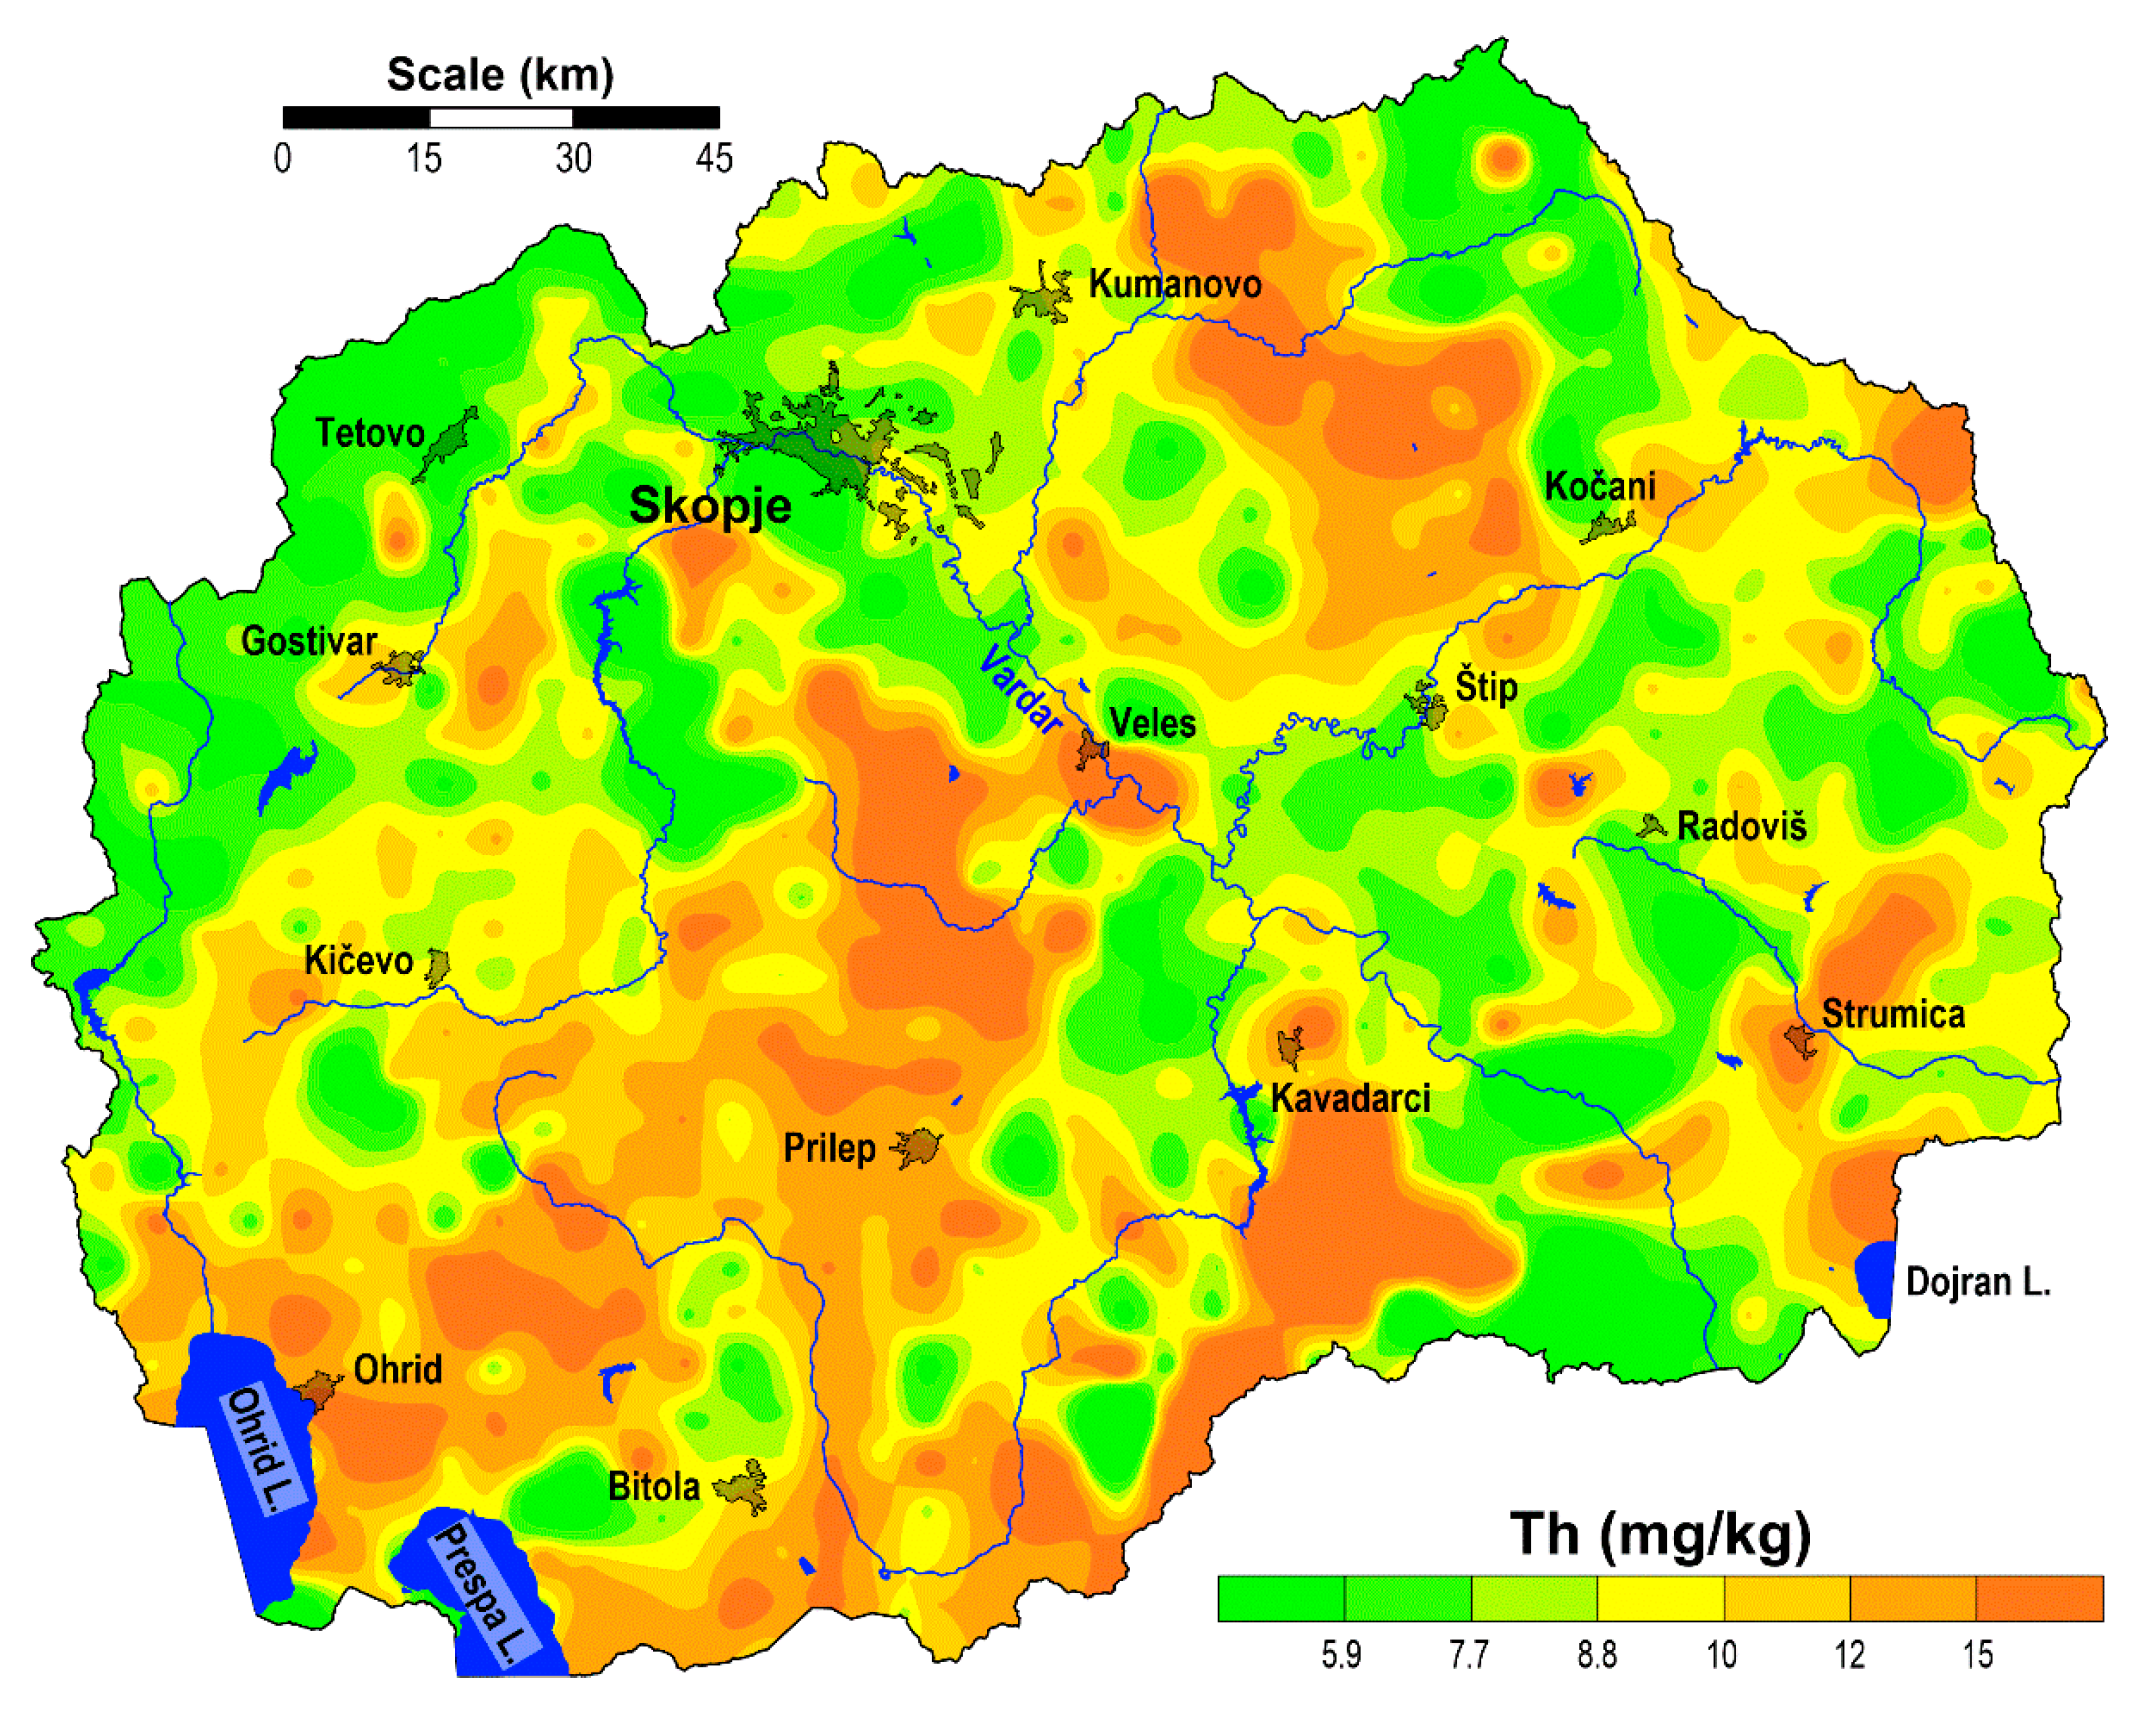
The spatial distribution of uranium and thorium content in soil throughout the country is shown in Figure 6 and Figure 7. In general, the spatial distribution patterns of U and Th in the soil samples are mainly determined by geology (parent material and mineralisation).
High uranium contents (2.9–13 mg/kg) were found mainly in soils from the area where Neogene and Paleozoic igneous rocks and Neogene clastites occur in the Pelagonian, Eastern Macedonian zone, as well as in the Kratovo-Zletovo Masiff in the northeastern part and the Kožuf Mountains in the central-southern part of the country, where Neogene magmatic rocks predominate. High uranium contents (9.1–13.1 mg/kg) were also found in soils from the area with a dominant occurrence of metamorphic and magmatic rocks in the Vardar and Pelagonian regions. The highest uranium content, 13.1 mg/kg, was found in a soil sample taken in the Kavadarci area on Kožuf Mountain in the Vardar region, located in the area of Proterozoic metamorphic rocks. In the same area, another soil sample on the Vitačevo plateau (near the village of Stragovo) had a high U content (9.7 mg/kg). A high U content (11.9 mg/kg) was also found in soil samples from the Mariovo area in the Pelagonian region: a sample near the village of Gugjakovo (11.9 mg/kg) and a sample on Mount Kajmakčalan (11.1 mg/kg), which are located in the area of Mesozoic clastites and metamorphic rocks, respectively. A similar value of U content (11.6 mg/kg) was found in soils from Mount Babuna in the Veles region (Vardar region), which lie in an area of Proterozoic metamorphic rocks. It should also be noted that a high uranium content (9.1 mg/kg) was found in a sample from Mount Ogražden in the north of the town of Strumica.
The highest thorium content (92 mg/kg) was found in soils collected near the town of Veles, close to the confluence of the Babuna and Vardar rivers, in an area with a dominant occurrence of Paleogene clastites. Two other soil samples with the next highest thorium content were collected in the same area of the town of Veles (Vardar region). Both samples were located near the village of Omorani on Mount Babuba. The sample with a Th content of 52 mg/kg was located in the area of Neogene clastites, and the sample with a Th content of 49 mg/kg was in the other area of the Quaternary alluvium. High Th contents (44 mg/kg) were also found in soil samples from the area of Kumanovo in the Northeastern region, near the village of Dragomance, and in a sample from Kožuf Mountain (Vardar region, in the area of Proterozoic metamorphic rocks) with a content of 42 mg/kg.

4. Conclusions

The distribution of total uranium and thorium content in the surface soil (0–30 cm) at 995 sites on a 5 × 5 km grid in North Macedonia was investigated. The mean and median values of uranium (2.0 mg/kg and 2.5 mg/kg) and thorium (11 mg/kg and 9.5 mg/kg) in soil are very similar to their contents in European soils and the upper continental crust. In general, the spatial distribution patterns of U and Th in the collected soil samples are mainly determined by geology (parent material and mineralisation). Thus, uranium and thorium contents in soils by region showed higher median values in the Pelagonian region in the west of the country, with contents of 3.0 mg/kg U and 12 mg/kg Th, while in other regions, the median content was below the median value for the whole country. According to geological formations, the highest mean uranium content in soils was found in areas where metamorphic rocks of the Pelagonian Massif (3.7 mg/kg U and 12 mg/kg Th) and Neogene magmatic rocks (3.6 mg/kg U and 16 mg/kg Th) predominate. The highest thorium content (92 mg/kg) was found in soils collected near the town of Veles, near the confluence of the Babuna River with the Vardar River, and in an area dominated by Paleogene clastites. In the same area of the town of Veles (Vardar region), two soil samples with high thorium content were collected near the village of Omorani on Mount Babuna (52 mg/kg, where Neogene clastites predominate, and 49 mg/kg, where Quaternary alluvium predominates).

Author Contributions

Conceptualization, T.S. and R.Š.; methodology, T.S. and R.Š.; software, R.Š.; validation, R.Š.; resources, T.S. and R.Š.; writing—original draft preparation, T.S. and R.Š.; writing—review and editing, T.S. and R.Š. All authors have read and agreed to the published version of the manuscript.

Funding

Data processing was partially supported by the Slovenian Research Agency under the Research program Mineral Resources (P1-0025).

Data Availability Statement

Data are contained within the manuscript.

Acknowledgments

The authors are greatly appreciative to the following students of Trajče Stafilov for their participation in this study in its various stages: Katerina Bačeva Andonovska, Biljana Balabanova, Svetlana Angelovska, Ružica Blaževska, Danica Božinova, Danica Damčcevska, Biljana Dimkova, Bojana Dimovska, Marija Jeftimova, Ivana Mickovska, Maja Ocevska, Kristina Petrovska, Ana Puteska, Angja Culumoska Gjorgjievska, Sandra Cančcalova and Suzana Veličckovski-Simonović.

Conflicts of Interest

The authors declare no conflicts of interest.

References

  1. Hazen, R.M.; Ewing, R.C.; Sverjensky, D.A. Evolution of Uranium and Thorium Minerals. Am. Min. 2009, 94, 1293–1311. [Google Scholar] [CrossRef]
  2. Sources and Effects of Ionizing Radiation; United Nations Scientific Committee on the Effects of Atomic Radiation, Report to the General Assembly, with Scientific Annexes; United Nations: New York, NY, USA, 2000.
  3. Sartandel, S.J.; Jha, S.K.; Bara, S.V.; Tripathi, R.M.; Puranik, V.D. Spatial Distribution of Uranium and Thorium in the Surface Soil Around Proposed Uranium Mining Site at Lambapur and its Vertical Profile in the Nagarjuna Sagar Dam. J. Environ. Radioact. 2009, 100, 831–834. [Google Scholar] [CrossRef] [PubMed]
  4. Cowart, J.B.; Burnett, W.C. The Distribution of Uranium and Thorium Decay-series Radionuclides in the Environment—A Review. J. Environ. Qual. 1994, 23, 651–662. [Google Scholar] [CrossRef]
  5. Rudnick, R.L.; Gao, S. Composition of the Continental Crust. Treat. Geochem. 2014, 4, 1–64. [Google Scholar]
  6. Salminen, R.; Batista, M.J.; Bidovec, M.; Demetriades, A.; De Vivo, B.; De Vos, W.; Duris, M.; Gilucis, A.; Gregorauskiene, V.; Halamic, J.; et al. Geochemical atlas of Europe, Part 1, Background Information, Methodology and Maps; Geological Survey of Finland: Espoo, Finland, 2005. [Google Scholar]
  7. Reimann, C.; Birke, M.; Demetriades, A.; Filzmoser, P.; O’Connor, P. Chemistry of Europe’s Agricultural Soils—Part A: Methodology and Interpretation of the GEMAS Data Set; Geologisches Jahrbuch Reihe B, Band B 103; Schweizerbart Science Publishers: Stuttgart, Germany, 2014. [Google Scholar]
  8. Hu, Z.; Gao, S. Upper Crustal Abundances of Trace Elements: A Revision and Update. Chem. Geol. 2008, 253, 205–221. [Google Scholar] [CrossRef]
  9. Lauf, R. Mineralogy of Uranium and Thorium, 1st ed.; Schiffer Publishing Ltd.: Littleton, CO, USA, 2016. [Google Scholar]
  10. Pagano, G.; Aliberti, F.; Guida, M.; Oral, R.; Siciliano, A.; Trifuoggi, M.; Tommasi, F. Rare Earth Elements in Human and Animal Health: State of Art and Research Priorities. Environ. Res. 2015, 142, 215–220. [Google Scholar] [CrossRef]
  11. Coyte, R.M.; Jain, R.C.; Srivastava, S.K.; Sharma, K.C.; Khalil, A.; Ma, L.; Vengosh, A. Large–scale Uranium Contamination of Groundwater Resources in India. Environ. Sci. Technol. Lett. 2018, 5, 341–347. [Google Scholar] [CrossRef]
  12. Gu, H.; Wang, N.; Yang, Y.; Zao, C.; Cui, S. Features of Distribution of Uranium and Thorium in Red Mud. Physicochem. Probl. Miner. Process. 2017, 53, 110–121. [Google Scholar]
  13. Gwenzi, W.; Mangori, L.; Danha, C.; Chaukura, N.; Dunjana, N.; Sanganyado, E. Sources, Behaviour, and Environmental and Human Health Risks of High-technology Rare Earth Elements as Emerging Contaminants. Sci. Total Environ. 2018, 636, 299–313. [Google Scholar] [CrossRef]
  14. Kasar, S.; Sahoo, S.K.; Area, H.; Mishra, S.; Tokonami, S.; Aono, T. Uranium, Thorium, and Rare Earth Elements Distribution in Fukushima Soil Samples. Radiat. Protect. Dosim. 2019, 184, 363–367. [Google Scholar] [CrossRef]
  15. Jimenez-Ballesta, R.; Bravo, S.; Perez-de los Reyes, C.; García-Pradas, J.; Sanchez, M.; García-Navarro, F.J. Occurrence of Some Rare Earth Elements in Vineyard Soils under Semiarid Mediterranean Environment. Environ. Monit. Assess. 2021, 194, 341. [Google Scholar]
  16. Pereto, C.; Baudrimont, M.; Coynel, A. Global Natural Concentrations of Rare Earth Elements in Aquatic Organisms: Progress and Lessons from Fifty Years of Studies. Sci. Total Environ. 2024, 922, 171241. [Google Scholar] [CrossRef]
  17. Sánchez-Castro, I.; Martínez-Rodríguez, P.; Abad, M.M.; Descostes, M.; Merroun, M.L. Uranium removal from complex mining waters by alginate beads doped with cells of Stenotrophomonas sp. Br8: Novel perspectives for metal bioremediation. J. Environ. Manage 2021, 296, 113411. [Google Scholar] [CrossRef] [PubMed]
  18. Stojanovska, Z.; Boev, B.; Ristova, M. Spatial Distribution of K, Th and U Elemental Concentration in Soil of the Republic of Macedonia. In Proceedings of the 1st International Workshop of the UNESCO-IGCP Project “Anthropogenic Effects on the Human Environment in the Neogene Basins in the SE Europe, Štip, North Macedonia, 3–4 June 2011; Serafimovski, T., Boev, B., Eds.; Faculty of Natural and Technical Sciences: Štip, North Macedonia, 2011; pp. 53–62. [Google Scholar]
  19. Stojanovska, Z.; Boev, B.; Ristova, M.; Boev, I.B.; Sorsa, A.; Zunic, Z.S.; Georgieva Ivanova, K. Risk Assessment Resulting from Radionuclides in Soils of the Republic of Macedonia. Contrib. Sect. Nat. Math. Biotech. Sci. MASA 2019, 40, 161–168. [Google Scholar]
  20. Stojanovska, Z.; Boev, B.; Bossew, P.; Ristova, M.; Dimov, G.; Zunic, Z.S. Analysis of Radionuclides Specific Activities Variations in Soil within Geotectonic Units of Republic of Macedonia. Nucl. Technol. Radiat. Protect. 2019, 34, 85–93. [Google Scholar] [CrossRef]
  21. Dimovska, S.; Stafilov, T.; Šajn, R.; Frontasyeva, M. Distribution of Some Natural and Man-made Radionuclides in Soil from the City of Veles (Republic of Macedonia) and its Environs. Radiat. Prot. Dosim. 2010, 138, 144–157. [Google Scholar] [CrossRef]
  22. Dimovska, S.; Stafilov, T.; Šajn, R. Radioactivity in Soil from the City of Kavadarci (Republic of Macedonia) and its Environs. Radiat. Prot. Dosim. 2012, 148, 107–120. [Google Scholar] [CrossRef]
  23. Zlatanovska, I.; Stafilov, T.; Šajn, R.; Dimovska Gonovska, B.; Dimovska, S.; Janushevski, J.; Barandovski, L. Distribution of Some Natural and Artificial Radionuclides in Soil from the City of Bitola (Macedonia) and its Environs. Radiat. Protect. Dosim. 2024, 200, 901–918. [Google Scholar] [CrossRef]
  24. Zlatanovska, I.; Stafilov, T.; Šajn, R.; Dimovska Gonovska, B.; Dimovska, S.; Janushevski, J.; Barandovski, L. Assessment of Radiological Hazards of Soils from the City of Bitola (Macedonia) and its Environs. Isot. Environ. Health Stud. 2024, 60, 453–470. [Google Scholar] [CrossRef]
  25. Stafilov, T.; Šajn, R. Geochemical Atlas of the Republic of Macedonia; Faculty of Natural Sciences and Mathematics: Skopje, North Macedonia, 2016. [Google Scholar]
  26. Petrušev, E.; Stolić, N.; Šajn, R.; Stafilov, T. Geological Characteristics of the Republic of North Macedonia. Geol. Maced. 2021, 35, 49–55. [Google Scholar] [CrossRef]
  27. Pendžerkovski, J. Interpreter of the Geological Map of 1:200,000 of SR Macedonia; Professional Fund of the Geological Survey of Macedonia: Skopje, North Macedonia, 1976. [Google Scholar]
  28. Pendžerkovski, J.; Hadži-Mitrova, S. Interpreter of the Geological Map of SR Macedonia 1:200,000; Professional Fund of the Geological Survey of Macedonia: Skopje, North Macedonia, 1977. [Google Scholar]
  29. Dumurdžanov, N.; Serafimovski, T.; Burchfiel, B.C. Evolution of the Neogene-Pleistocene Basins of Macedonia. Digital Map and Chart Series 1 (Accompanying Notes); Geological Society of America: Boulder, CO, USA, 2004. [Google Scholar]
  30. Dumurdžanov, N.; Serafimovski, T.; Burchfiel, B.C. Cenozoic Tectonics of Macedonia and its Relation to the South Balkan Extensional Regime. Geosphere 2005, 1, 1–22. [Google Scholar] [CrossRef]
  31. Arsovski, M. Tectonics of Macedonia; Faculty of Mining and Geology, Ss Cyril and Methodius University: Skopje, North Macedonia, 1997. [Google Scholar]
  32. Filipovski, G.; Andreevski, M.; Vasilevski, K.; Milevski, I.; Markoski, M.; Mitkova, T.; Mitrikeski, J.; Mukaetov, D.; Petkovski, D. Pedological (Soil) Map; Institute of Agriculture, Ss Cyril and Methodius University: Skopje, North Macedonia, 2015. [Google Scholar]
  33. Mitkova, T.; Mitrikeski, J. Soils of the Macedonia: Present Situation and Future Prospects. In Soil Resources of Europe, 2nd ed.; Jones, R.J.A., Houšková, B., Bullock, P., Montanarella, L., Eds.; European Soil Bureau Institute for Environment & Sustainability: Ispra, Italy, 2005; pp. 225–234. [Google Scholar]
  34. Halamić, L.; Peh, Z.; Miko, S.; Galović, L.; Šorša, A. Geochemical Atlas of Croatia: Environmental Implications and Geodynamical Thread. J. Geochem. Explor. 2012, 115, 36–46. [Google Scholar] [CrossRef]
  35. Golabkesh, F.; Ghanavati, N.; Nazarpour, A.; Nejad, T.B. Monitoring Soil Salinity Changes, Comparison of Different Maps and Indices Extracted from Landsat Satellite Images (Case Study: Atabieh, Khuzestan). Pol. J. Environ. Stud. 2021, 30, 1139–1154. [Google Scholar] [CrossRef]
  36. Vaziri, A.; Nazarpour, A.; Ghanavati, N.; Babainejad, T.; Watts, M.J. An Integrated Approach for Spatial Distribution of Potentially Toxic Elements (Cu, Pb and Zn) in Topsoil. Sci. Rep. 2021, 11, 7806. [Google Scholar] [CrossRef] [PubMed]
  37. Stafilov, T.; Šajn, R.; Pančevski, Z.; Boev, B.; Frontasyeva, M.V.; Strelkova, I.P. Heavy Metal Contamination of Surface Soils around a Lead and Zinc Smelter in the Republic of Macedonia. J. Hazard. Mater. 2010, 75, 896–914. [Google Scholar] [CrossRef] [PubMed]
  38. Stafilov, T.; Šajn, R.; Ahmeti, L. Geochemical Characteristics of Soil of the City of Skopje, Republic of Macedonia. J. Environ. Sci. Health A 2019, 54, 972–987. [Google Scholar] [CrossRef] [PubMed]
  39. Reimann, C.; Filzmoser, P.; Fabian, K.; Hron, K.; Birke, M.; Demetriades, A.; Dinelli, E.; Ladenberger, A.; The GEMAS Project Team. The Concept of Compositional Data Analysis in Practice—Total Major Element Concentrations in Agricultural and Grazing Land Soils of Europe. Sci. Total. Environ. 2012, 426, 196–210. [Google Scholar] [CrossRef]
  40. Harvey, D. Modern Analytical Chemistry; McGraw-Hill Higher Education: New York, NY, USA, 2000. [Google Scholar]
  41. Borojerdnia, A.; Rozbahani, M.M.; Nazarpour, A.; Ghanavati, N.; Payandeh, K. Application of Exploratory and Spatial Data Analysis (SDA), singularity Matrix analysis, and Fractal Models to Delineate Background of Potentially Toxic Elements: A Case Study of Ahvaz, SW Iran. Sci. Total Environ. 2020, 740, 140103. [Google Scholar] [CrossRef]
  42. Peuraniemi, V.; Aario, R. Hydromorphic dispersion of uranium in a surficial environment in northern Finland. J. Geochem. Explor. 1991, 41, 197–212. [Google Scholar] [CrossRef]
  43. Åström, M.E.; Peltola, P.; Rönnback, P.; Lavergren, U.; Bergbäck, B.; Tarvainen, T.; Backman, B.; Salminen, R. Uranium in surface and groundwaters in Boreal EuropeUranium in surface and groundwaters in Boreal Europe. Geochem. Explor. Environ. Anal. 2009, 9, 51–62. [Google Scholar] [CrossRef]
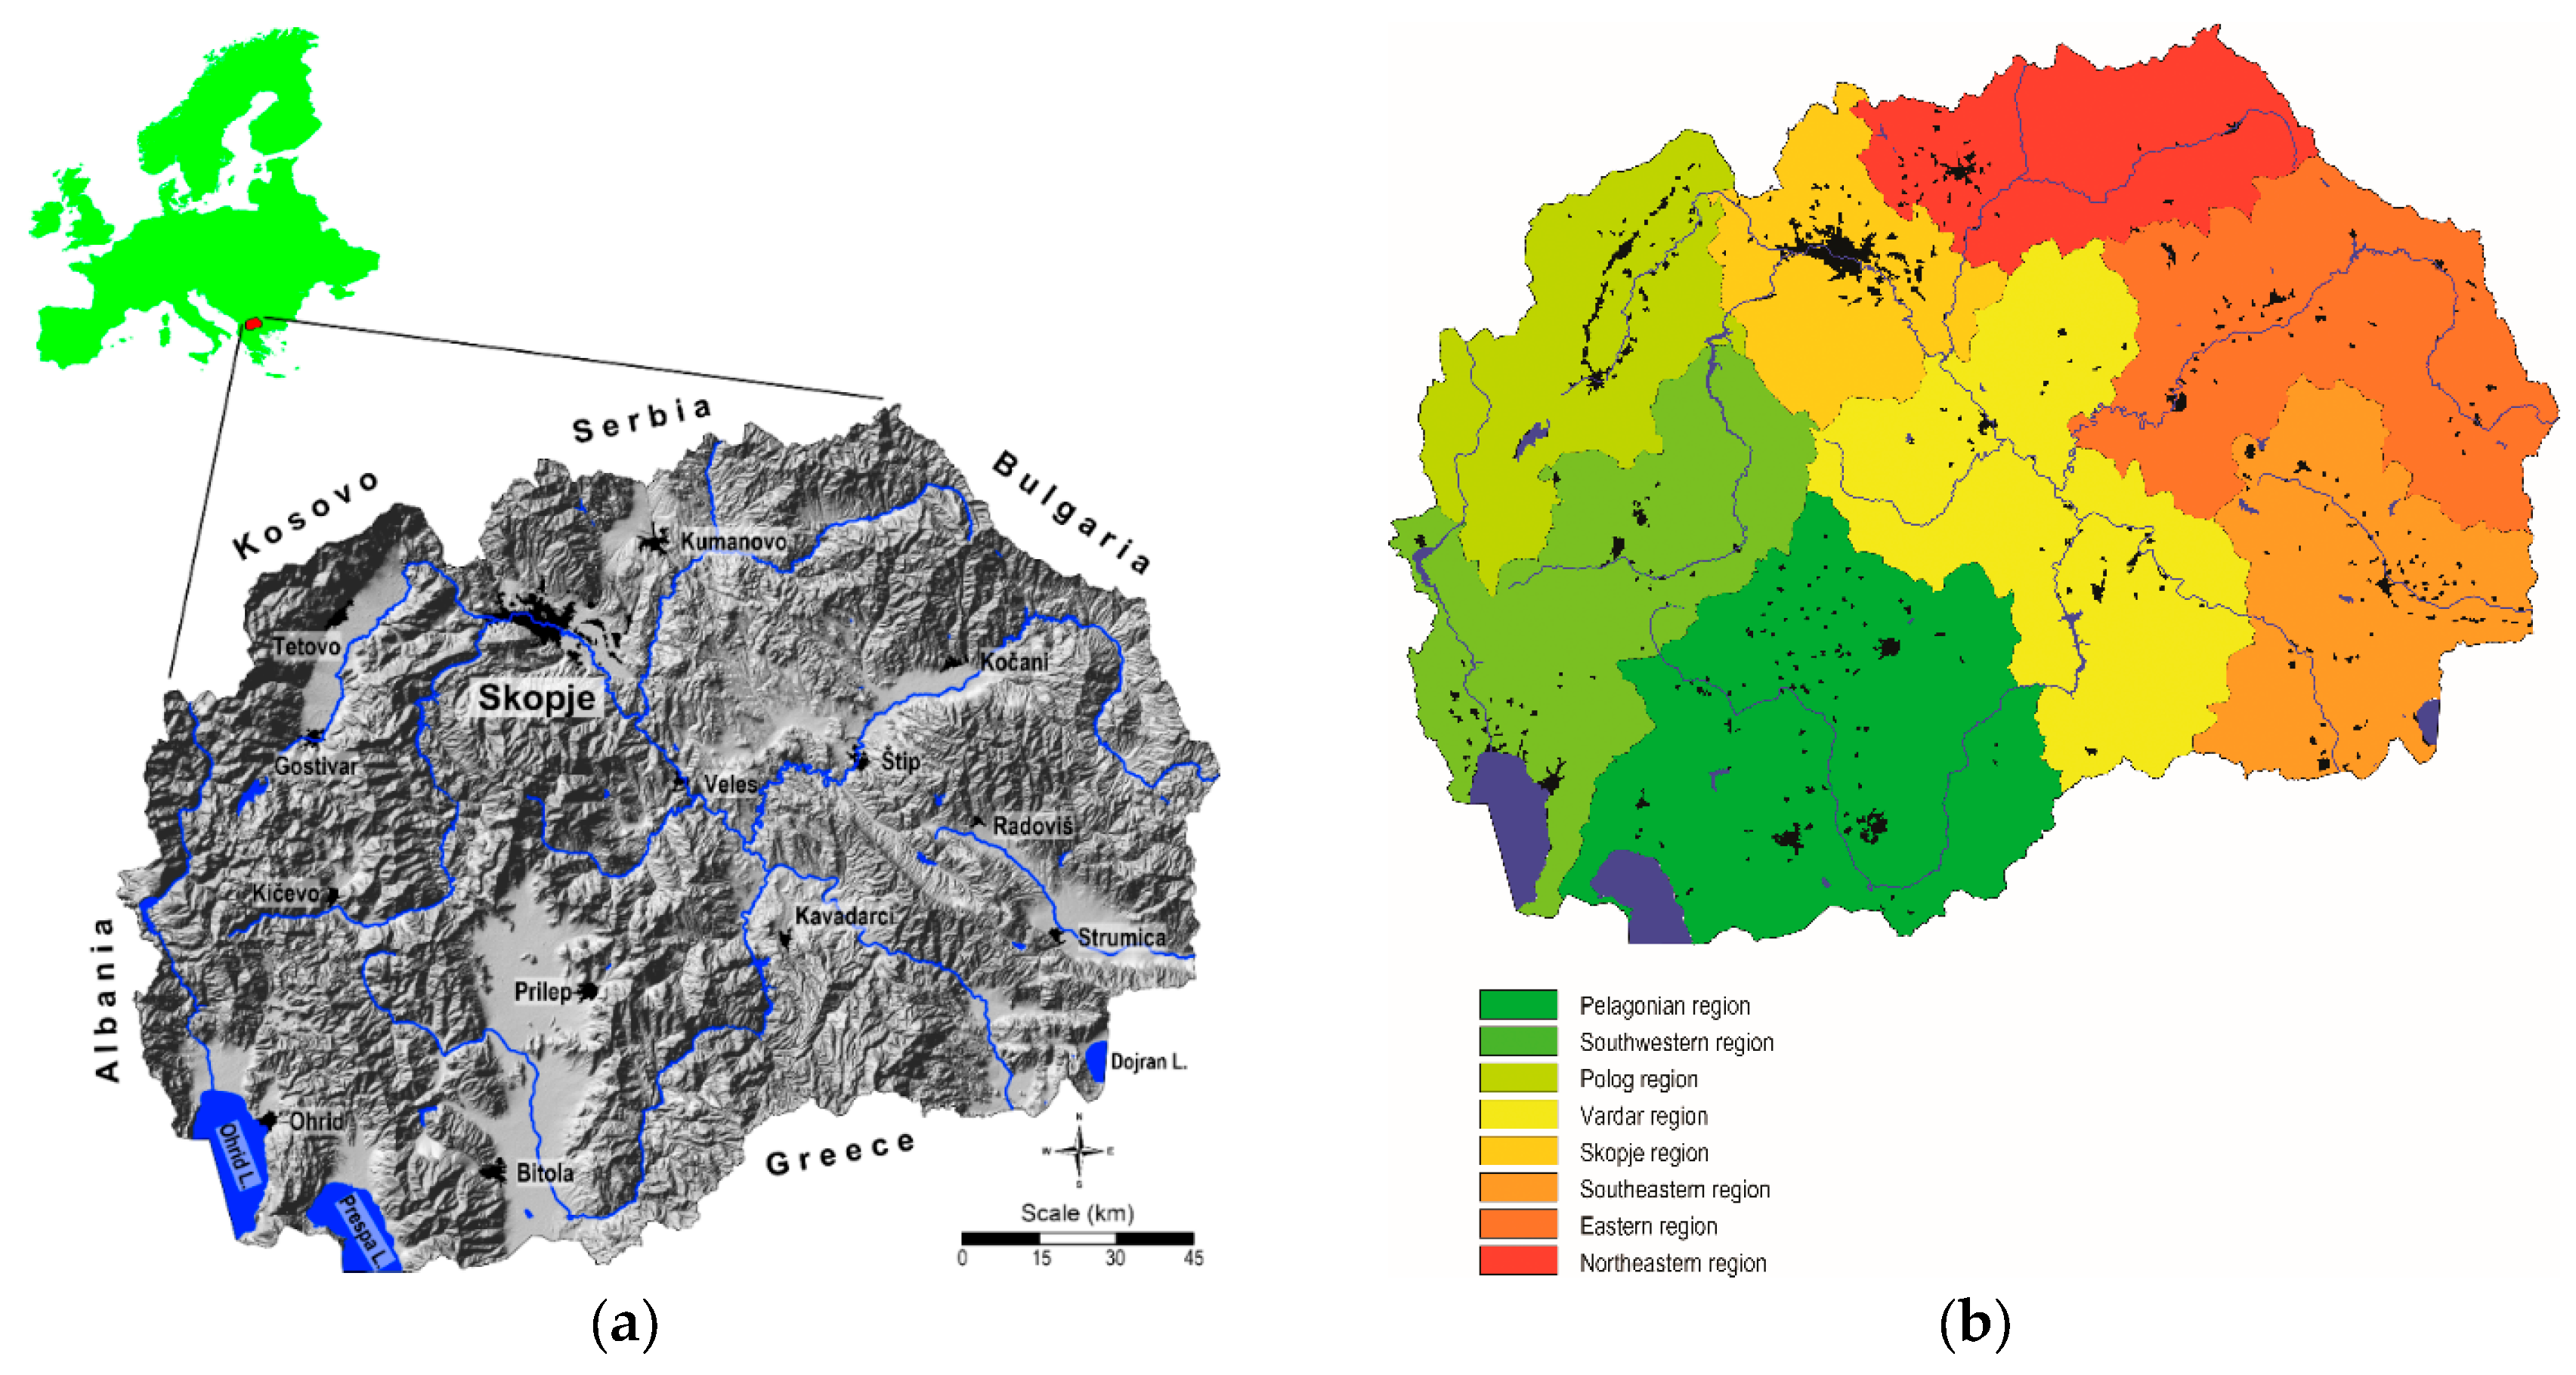
Figure 1. Topographic map (a) and map of the statistical regions (b) of North Macedonia.
Minerals 15 01063 g001
Figure 2. Simplified geological map of North Macedonia. Tectonic units: I—Cukali-Krasta zone (CKZ); II—West-Macedonian zone (WMZ); III—Pelagonian massif (PM); IV—Vardar zone (VZ); V—Serbo-Macedonian massif (SMM); VI—Kraishtide zone (KZ).
Minerals 15 01063 g002
Figure 3. Soil sampling sites in the territory of North Macedonia.
Minerals 15 01063 g003
Figure 4. Mean values of uranium content by statistical regions and geological formations.
Minerals 15 01063 g004
Figure 5. Mean values of thorium content according to statistical regions and geological formations.
Minerals 15 01063 g005
Figure 6. Spatial distribution of the uranium content.
Minerals 15 01063 g006
Figure 7. Spatial distribution of the thorium content.
Minerals 15 01063 g007
Table 1. Descriptive statistics of the analysis of uranium and thorium in the topsoil of North Macedonia.
ParameterU (mg/kg)Th (mg/kg)
Number of sampling locations995995
Detection limit0.100.10
Arithmetic average (mean)2.511
Geometrical mean2.19.3
Box–Cox transformed average2.19.6
Arithmetic standard deviation1.66.1
Geometric standard deviation0.0500.19
Coefficient of variation6458
Minimum<0.100.20
P10—10th percentile1.05.2
P25—25th percentile1.57.3
Median2.09.5
P75—75th percentile3.113
P90—90th percentile4.417
Maximum1392
Skewness2.073.95
Kurtosis6.6636.18
Box–Cox transformed skewness0.020.11
Box–Cox transformed kurtosis1.092.83
Table 2. Comparison of data on the U and Th content in the soils of North Macedonia, Europe and the world (in mg/kg).
UnitNorth Macedonia, This WorkEurope, Topsoil [6]World (Upper Continental Crust) [5]
UThUThUTh
Average2.5112.368.242.710.5
Median2.09.52.037.24
Minimum<0.100.200.210.30
Maximum139253.275.9
Table 3. Mean, median, minimum and maximum Tl content by statistical regions in North Macedonia (in mg/kg).
RegionNumber of SamplesMeanMedianMinimumMaximum
UThUThUThUTh
Pelagonian1923.0123.0120.30.201232
Southwestern1352.09.72.1100.42.28.520
Polog961.47.21.36.90.42.04.120
Vardar1622.1111.89.70.30.901392
Skopje721.68.21.58.10.62.47.528
Southeastern1051.98.42.19.10.10.709.136
Eastern1412.39.12.29.40.72.58.123
Northeastern922.19.41.99.10.72.06.944
Table 4. Mean, median, minimum and maximum uranium and thorium contents depending on the main geological formation (in mg/kg).
GeologyNumber of SamplesMeanMedianMinimumMaximum
UThUThUThUTh
Alluvium (Q)1142.4112.4100.72.37.749
Deluvium (Q)802.1102.19.90.83.56.423
Clastites (Ng)951.79.41.78.90.62.56.352
Clastites (Pg)601.89.91.79.10.93.88.292
Clastites (Mz)401.78.61.48.20.62.61226
Carbonates (Mz)1201.7101.7100.52.34.019
Carbonates (Pz)521.68.51.68.30.82.44.430
Carbonates (Pt)321.57.51.69.10.30.204.821
Metamorphic rocks (Pz)432.09.22.0100.41.98.521
Metamorphic rocks (PM)843.7123.7120.73.01342
Metamorphic rocks (SMM)1152.18.02.28.40.72.08.126
Magmatic rocks (Ng)503.6163.8160.30.909.744
Magmatic rocks (Pg)72.18.02.28.81.02.84.220
Magmatic rocks (Mz)511.57.11.58.0<0.100.707.333
Magmatic rocks (Pz)522.39.32.39.50.73.89.124
Q—Quaternary, Ng—Neogene, Pg—Paleogene, Mz—Mesozoic, Pt—Proterozoic, PM—Pelagonian massif, SMM—Serbo-Macedonian massif.
Table 5. Mean, median, minimum and maximum values of uranium and thorium content according to the main pedological units in North Macedonia (in mg/kg).
Pedological UnitNumber of SamplesMean Median Minimum Maximum
UThUThUThUTh
Lithosol 572.0102.19.80.805.64.220
Lithosol (C)381.79.21.79.50.402.65.130
Regosol 692.3112.19.9<0.101.19.735
Colluvial soil 552.2102.29.30.603.66.749
Rendzina 721.68.91.68.20.602.66.126
Ranker 722.38.72.08.50.300.901133
Vertisol 3192.1111.8100.903.86.944
Cambisol (H) 991.88.81.89.00.602.46.419
Cambisol (M) 802.49.72.49.70.200.201352
Cambisol (C) 151.57.91.58.60.402.04.822
Fluvisol 932.4112.4110.702.36.692
Hydromorphic soil 212.9122.7111.37.87.717
Anthroposol 51.16.41.16.40.803.51.89.2
Lithosol (C)—lithosols on limestone-dolomite chernozems; Cambisol (H)—cambisols, mostly cinnamomic forest soil; Cambisol (M)—cambisols, mostly brown forest soil; Cambisol (C)—cambisols, mostly brown soils on limestone and dolomite.
Disclaimer/Publisher’s Note: The statements, opinions and data contained in all publications are solely those of the individual author(s) and contributor(s) and not of MDPI and/or the editor(s). MDPI and/or the editor(s) disclaim responsibility for any injury to people or property resulting from any ideas, methods, instructions or products referred to in the content.