
Raman Quantitative Measurement on the Cl− Molarity of H2O-NaCl-CO2 System: Application to Fluid Inclusions


Abstract

1. Introduction
2. Materials and Methods
2.1. Samples
2.2. Raman Quantitative Measurement
2.3. Microthermometry
3. Results
4. Discussion
5. Conclusions
- (1)
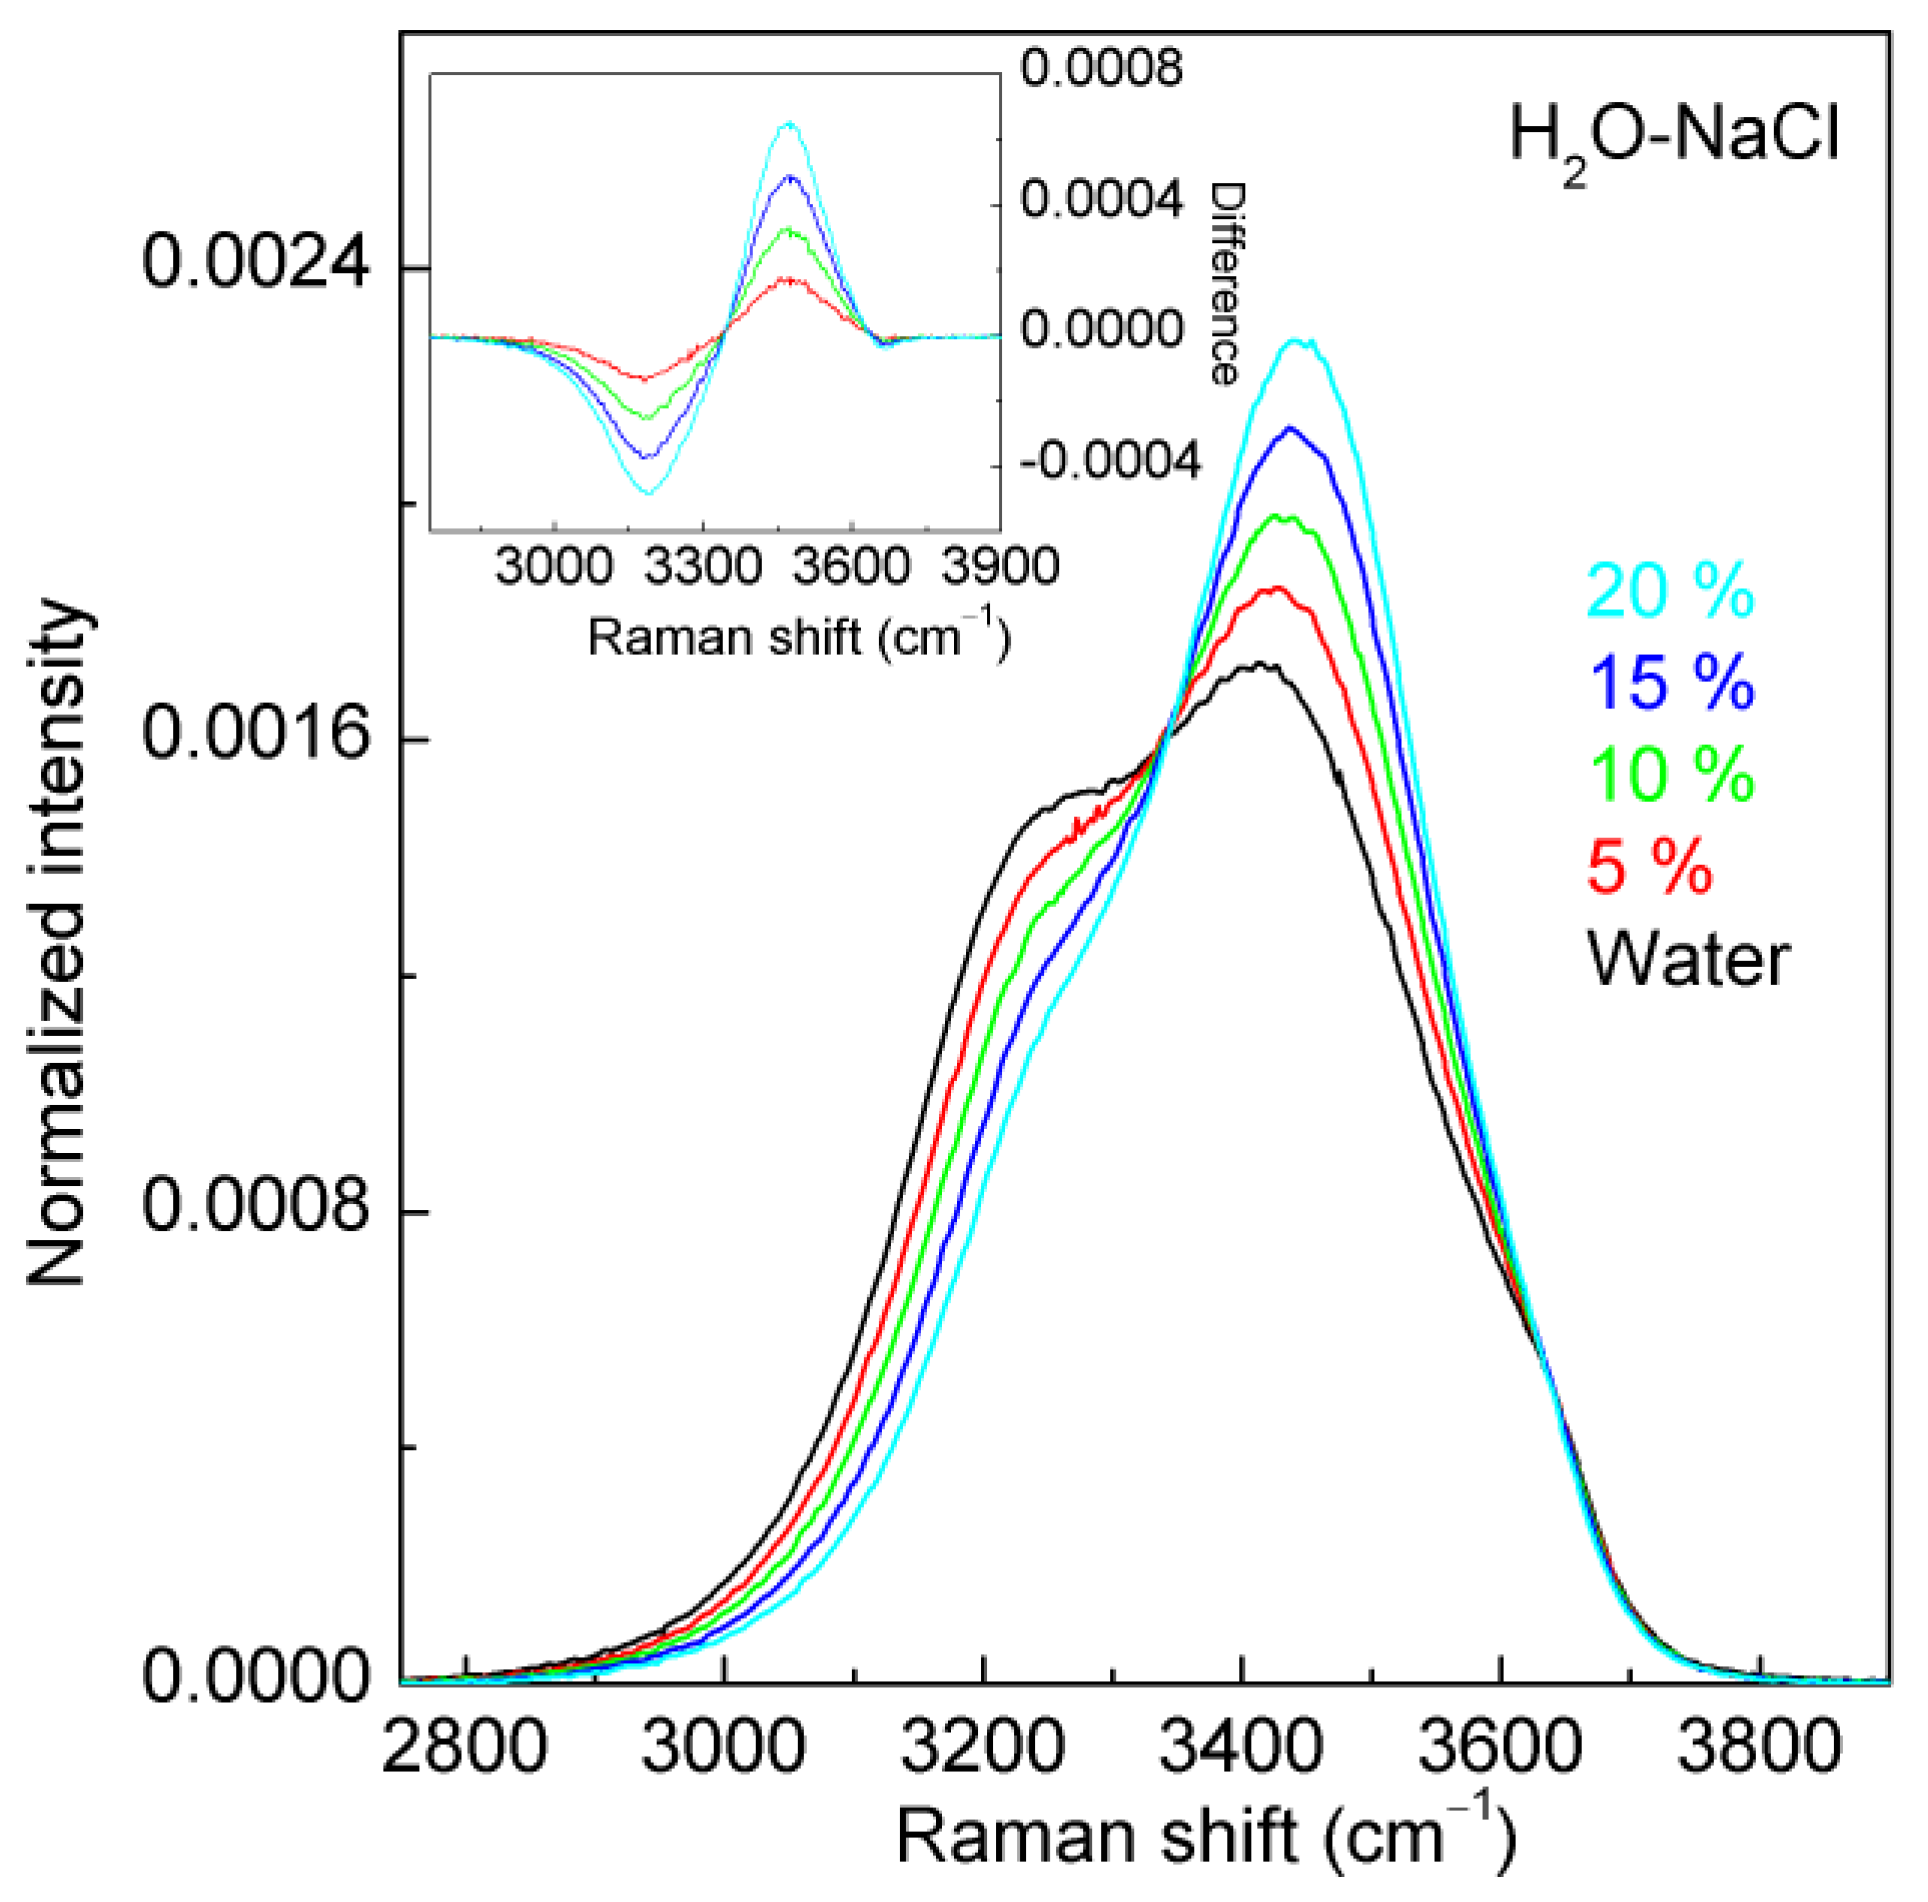
- For the H2O-NaCl system, the addition of NaCl salts decreases the intensity of the sub-band below 3330 cm−1 but increases the intensity of the sub-band above 3330 cm−1. The spectral changes are mostly associated with the interactions between Cl− and water, as indicated by the structural analysis. The intensity ratio of the two fitted sub-bands can be utilized to determine the Cl− concentrations in NaCl solutions.
- (2)
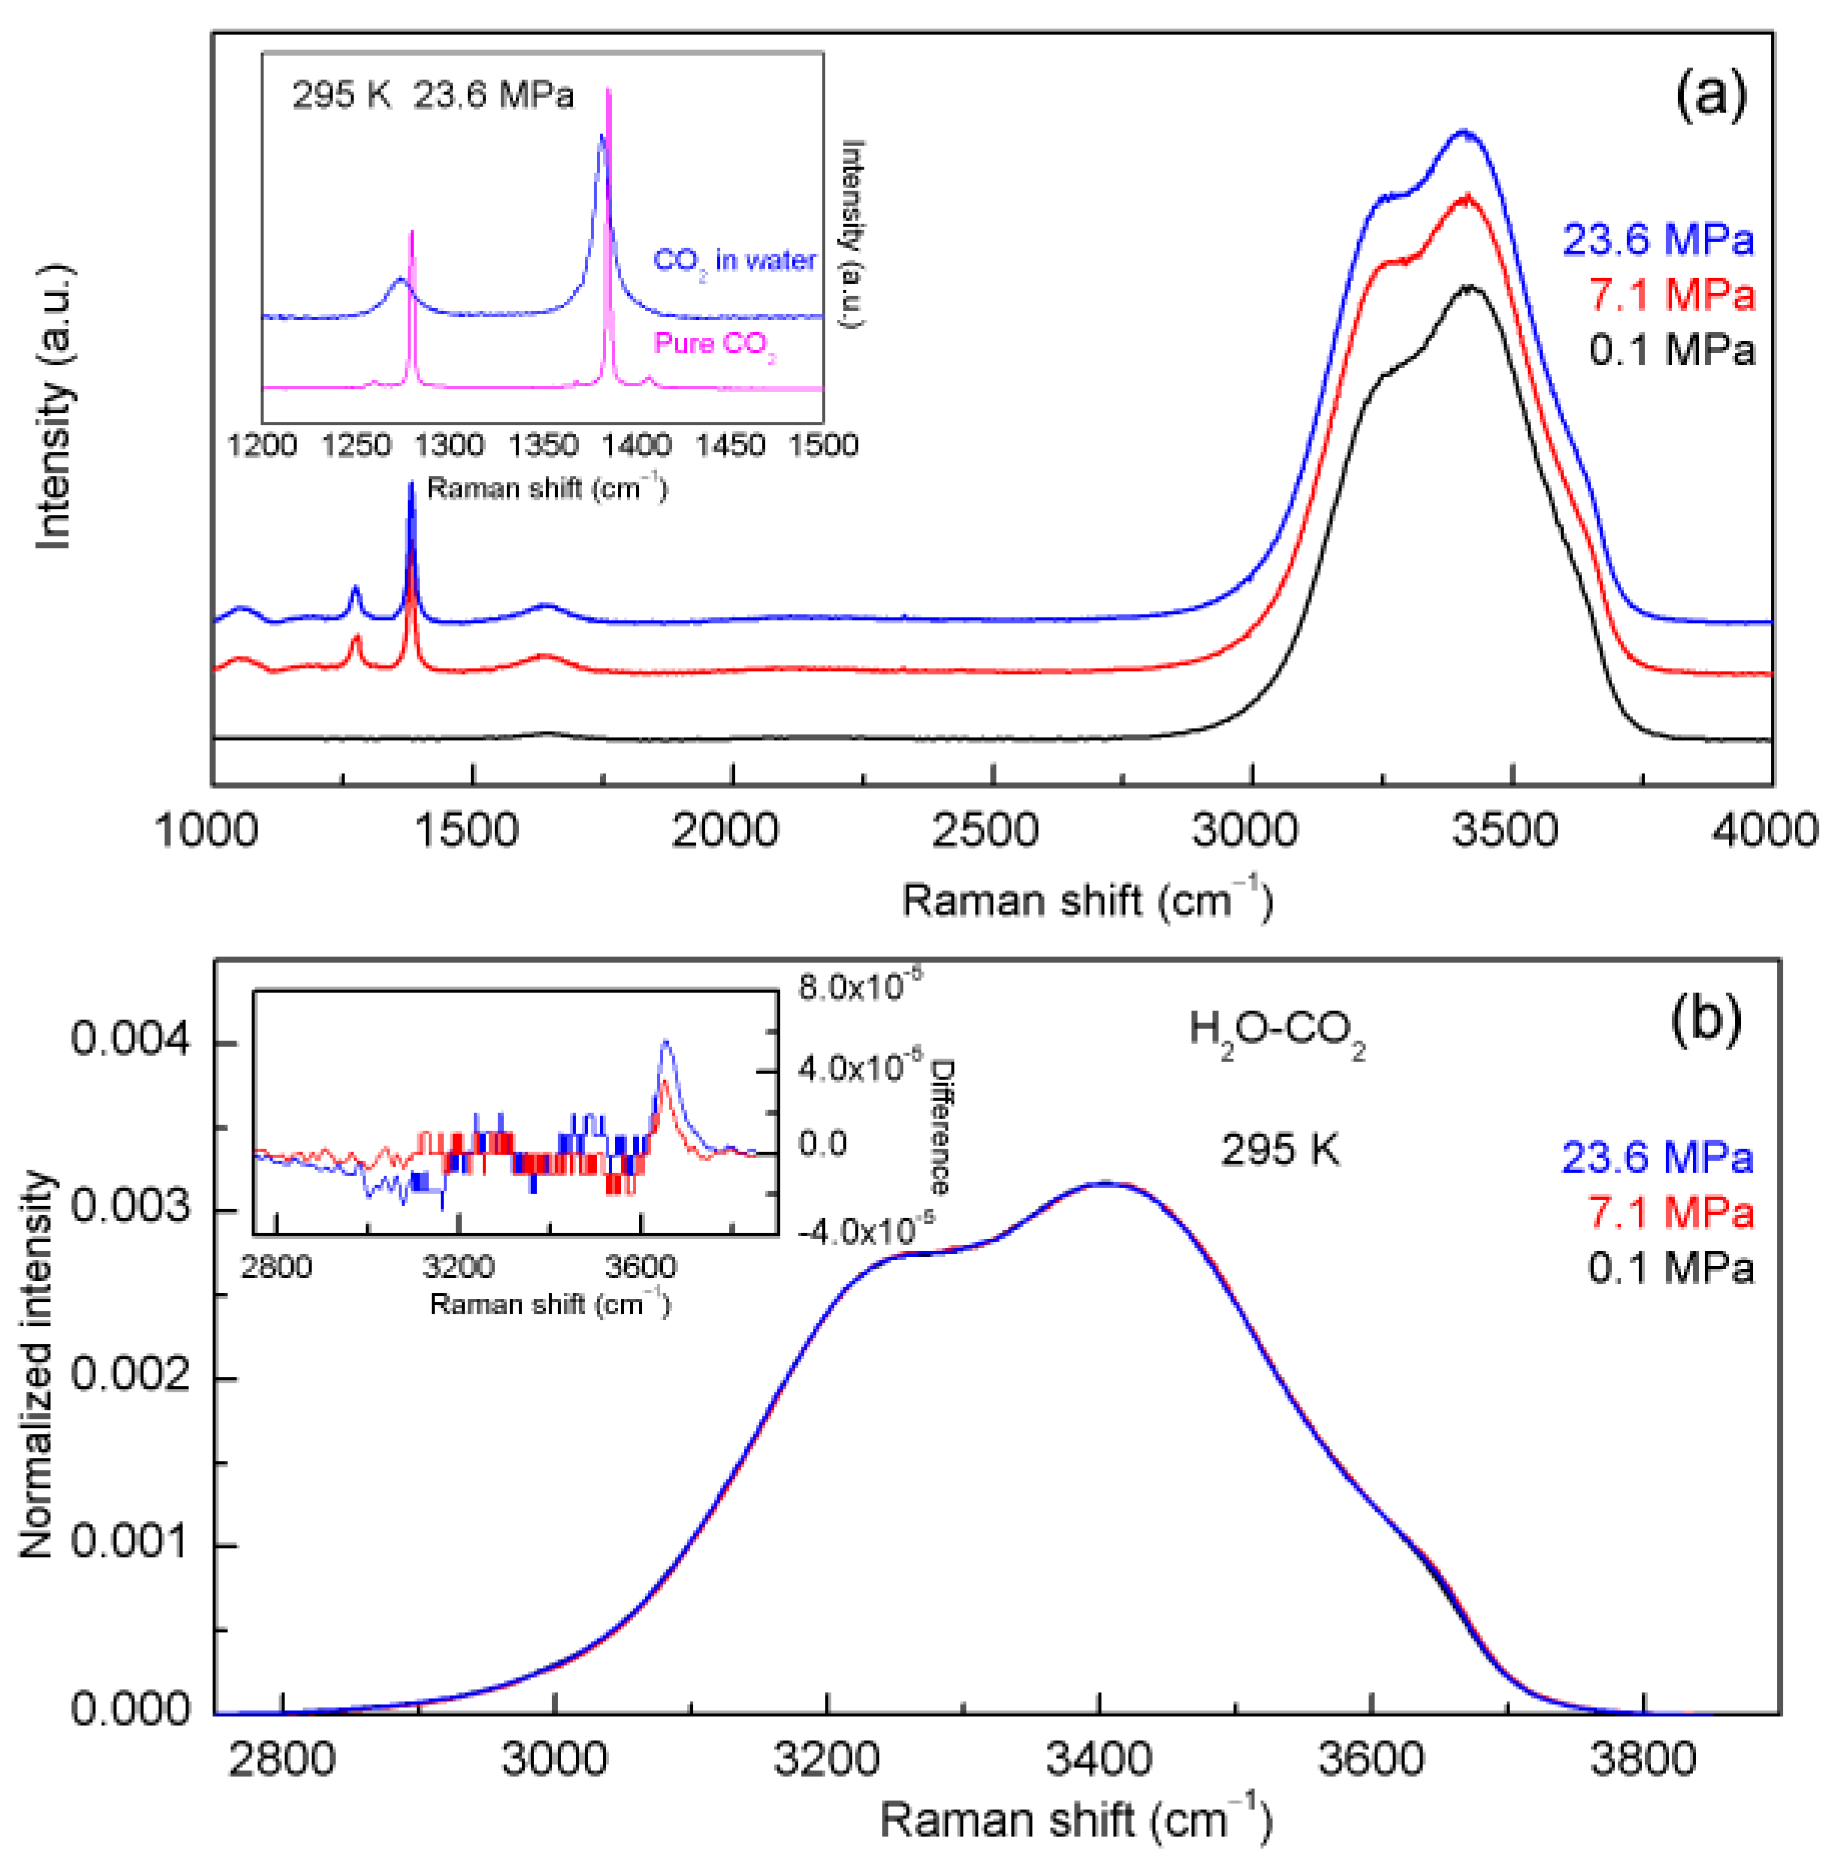
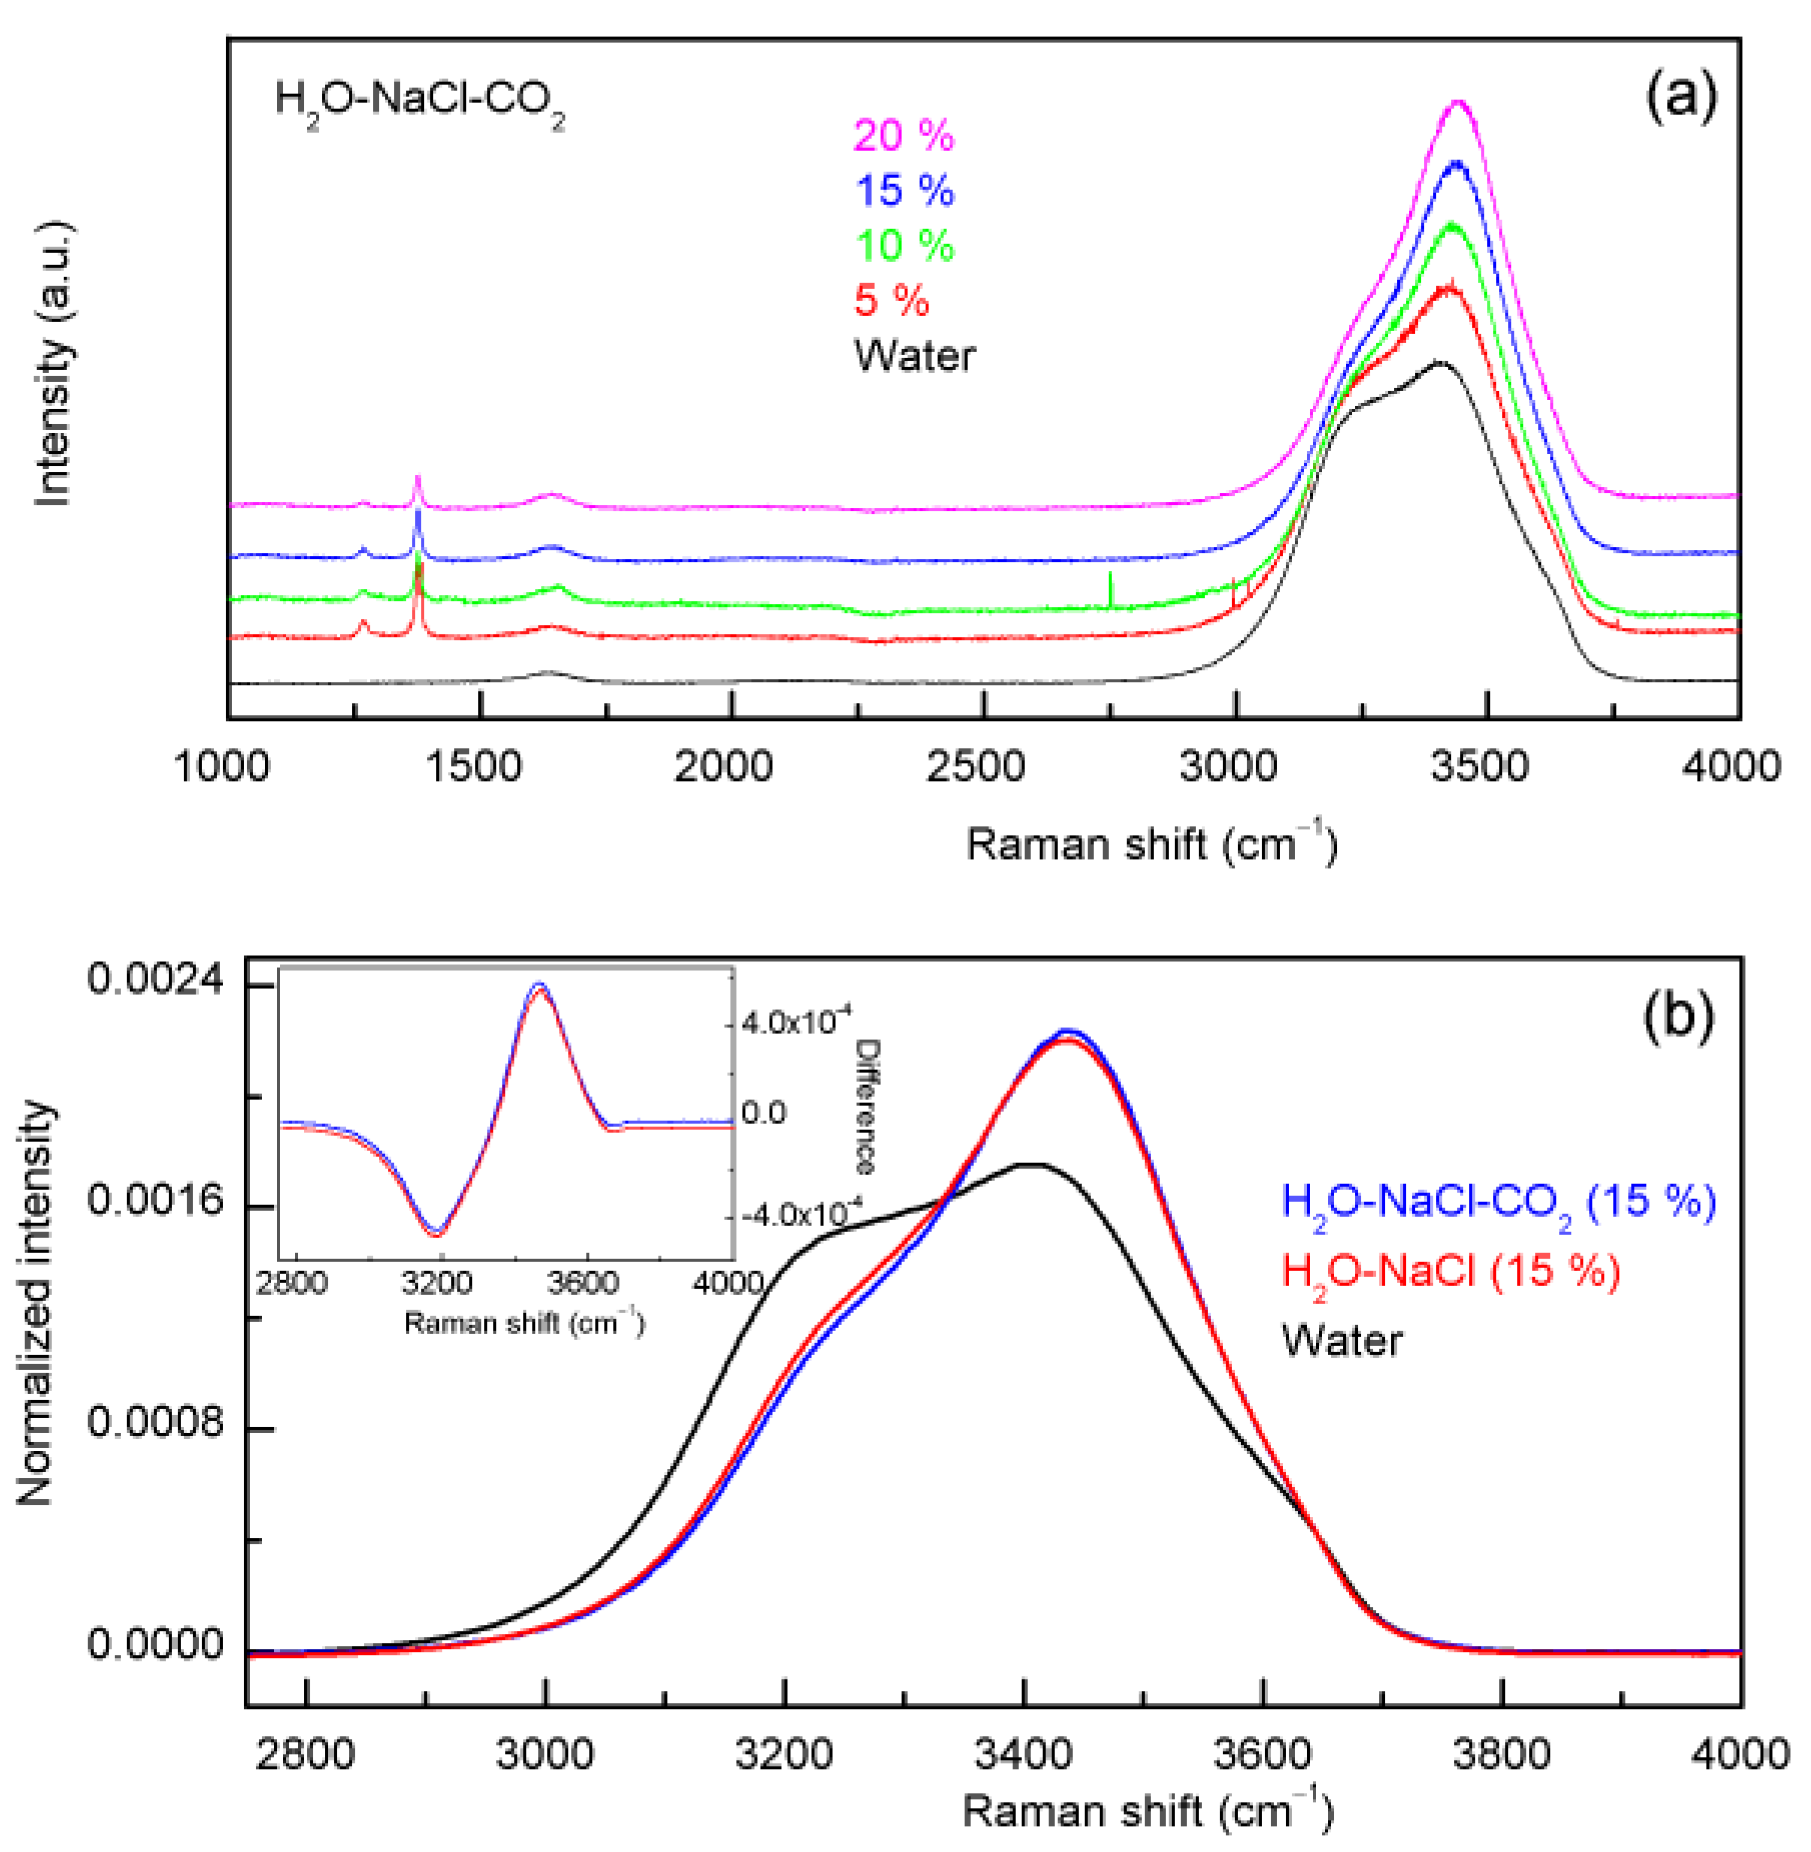
- According to the Raman spectroscopic study, the effects of CO2 on water structure may be weak. It is reasonable to ignore the effects of CO2 on Raman OH stretching bands during they are utilized to measure the salinity of the H2O-NaCl-CO2 system. Therefore, the above method is reasonably extended to quantitatively measure the salinity (Cl− molarity scale) of the H2O-NaCl-CO2 system.
Author Contributions
Funding
Data Availability Statement
Acknowledgments
Conflicts of Interest
References
- Hezarkhani, A.; Willims-Jones, A.E. Controls of alteration and mineralization in the Sungun porphyry copper deposit, Iran: Evidence from fluid inclusions and stable isotopes. Econ. Geol. 1998, 93, 651–670. [Google Scholar] [CrossRef]
- Mollai, H.; Sharma, R.; Pe-Piper, G. Copper mineralization around the Ahar batholith, north of Ahar (NW Iran): Evidence for fluid evolution and the origin of the skarn ore deposit. Ore Geol. Rev. 2009, 35, 401–414. [Google Scholar] [CrossRef]
- Ping, H.W.; Chen, H.H.; Song, G.Q.; Liu, H.M. Oil cracking of deep petroleum in Minfeng Sag in North Dongying depression, Bohai Bay basin, China: Evidence from natural fluid inclusions. J. Earth Sci. 2010, 21, 455–470. [Google Scholar] [CrossRef]
- Tian, Z.; Zhang, X.; Liu, C.; Meng, Q.; Du, Z.; Yan, J. Characterization of the influence of hydrated ions on the oxygen-hydrogen stretching vibration of water by Raman spectroscopy. Anal. Lett. 2020, 53, 2034–2046. [Google Scholar] [CrossRef]
- Wang, K.; Chi, G.; Bethune, K.M.; Li, Z.; Blamey, N.; Card, C.; Potter, E.G.; Liu, Y. Fluid P-T-X characteristics and evidence for boiling in the formation of the Phoenix uranium deposit (Athabasca Basin, Canada): Implications for unconformity-related uranium mineralization mechanisms. Ore Geol. Rev. 2018, 101, 122–142. [Google Scholar] [CrossRef]
- Xie, X.; Fan, Z.; Liu, X.; Lu, Y. Geochemistry of formation water and its implication on overpressured fluid flow in the Dongying Depression of the Bohaiwan Basin, China. J. Geochem. Explor. 2006, 89, 432–435. [Google Scholar] [CrossRef]
- Yang, T.; Zhu, L.; Zhang, G.; Wang, F.; Lu, R.; Xia, J.; Zhang, Y. Geological and geochemical constraints on genesis of the Liziyuan gold-dominated polymetal deposit, Western Qinling orogen, central China. Int. Geol. Rev. 2012, 54, 1944–1966. [Google Scholar] [CrossRef]
- Bodnar, R.J. Revised equation and table for determining the freezing point depression of H2O-NaCl solutions. Geochim. Cosmochim. Acta 1993, 57, 683–684. [Google Scholar] [CrossRef]
- Roedder, E. Fluid inclusions. In Reviews in Mineralogy; Ribbe, H.P., Ed.; Mineralogical Society of America: Washington, DC, USA, 1984; Volume 12, pp. 1–644. [Google Scholar]
- Bakker, R.J.; Diamond, L.W. Determination of the composition and molar volume of H2O-CO2 fluid inclusions by microthermometry. Geochim. Cosmochim. Acta 2000, 64, 1753–1764. [Google Scholar] [CrossRef]
- Diamond, L.W. Review of the systematics of CO2-H2O fluid inclusions. Lithos 2001, 55, 69–99. [Google Scholar] [CrossRef]
- Tsunogae, T.; Santosh, M.; Dubessy, J. Fluid characteristics of high to ultrahigh-temperature metamorphism in Southern India: A quantitative Raman spectroscopic study. Precambrian Res. 2008, 162, 198–211. [Google Scholar] [CrossRef]
- Fall, A.; Tattitch, B.; Bodnar, R.J. Combined microthermometric and Raman spectroscopic technique to determine the salinity of H2O-CO2-NaCl fluid inclusions based on clathrate melting. Geochim. Cosmochim. Acta 2011, 75, 951–964. [Google Scholar] [CrossRef]
- Bakker, R.J. Raman spectra of fluid and crystal mixtures in the systems H2O, H2O-NaCl and H2O-MgCl2 at low temperatures: Applications to fluid-inclusion research. Can. Mineral. 2004, 42, 1283–1314. [Google Scholar] [CrossRef]
- Bakker, R.J.; Baumgartner, M. Unexpected phase assemblages in inclusions with ternary H2O-salt fluids at low temperatures. Cent. Eur. J. Geosci. 2012, 4, 225–237. [Google Scholar] [CrossRef]
- Davis, D.W.; Lowenstein, T.K.; Spencer, R.J. Melting behavior of fluid inclusions in laboratory-grown halite crystals in the systems NaCl-H2O, NaCl-KCl-H2O, NaCl-MgCl2-H2O, and NaCl-CaCl2-H2O. Geochim. Cosmochim. Acta 1990, 54, 591–601. [Google Scholar] [CrossRef]
- Mernagh, T.P.; Wilde, A.R. The use of the laser Raman microprobe for the determination of salinity in fluid inclusions. Geochim. Cosmochim. Acta 1989, 53, 765–771. [Google Scholar] [CrossRef]
- Baumgartner, M.; Bakker, R.J. Raman spectroscopy of pure H2O and NaCl-H2O containing synthetic fluid inclusions in quartz-A study of polarization effects. Miner. Petrol. 2009, 95, 1–15. [Google Scholar] [CrossRef]
- Georgiev, G.; Kalkanjiev, T.; Petrov, V.; Nickolov, Z. Determination of salts in water solutions by a skewing parameter of the water Raman band. Appl. Spectrosc. 1984, 38, 593–595. [Google Scholar] [CrossRef]
- Dubessy, J.; Lhomme, T.; Boiron, M.C.; Rull, F. Determination of chlorinity in aqueous fluids using Raman spectroscopy of the stretching band of water at room temperature: Application to fluid inclusions. Appl. Spectrosc. 2002, 56, 99–106. [Google Scholar] [CrossRef]
- Sun, Q.; Zhao, L.; Li, N.; Liu, J. Raman spectroscopic study for the determination of Cl− concentration (molarity scale) in aqueous solutions: Application to fluid inclusions. Chem. Geol. 2010, 272, 55–61. [Google Scholar] [CrossRef]
- Wang, X.; Hu, W.; Chou, I.-M. Raman spectroscopic characterization on the OH stretching bands in NaCl-Na2CO3-Na2SO4-CO2-H2O systems: Implications for the measurement of chloride concentrations in fluid inclusions. J. Geochem. Explor. 2013, 132, 111–119. [Google Scholar] [CrossRef]
- Chou, I.-M.; Song, Y.; Burruss, R.C. A new method for synthesizing fluid inclusions in fused silica capillaries containing organic and inorganic material. Geochim. Cosmochim. Acta 2008, 72, 5217–5231. [Google Scholar] [CrossRef]
- Lu, W.; Chou, I.; Burruss, R.C.; Song, Y. Unified equation for calculating methane vapor pressures in the CH4-H2O system with measured Raman shifts. Geochem. Cosmochim. Acta 2007, 71, 3969–3978. [Google Scholar] [CrossRef]
- Aarnoutse, P.; Westerhuis, J. Quantitative Raman reaction monitoring using the solvent as internal standard. Anal. Chem. 2005, 77, 1228–1236. [Google Scholar] [CrossRef] [PubMed]
- Caillet, A.; Puel, F.; Fevotte, G. In-line monitoring of partial and overall solid concentration during solvent-mediated phase transition using Raman spectroscopy. Int. J. Pharm. 2006, 307, 201–208. [Google Scholar] [CrossRef]
- Sun, Q.; Qin, C. Raman OH stretching band of water as an internal standard to determine carbonate concentrations. Chem. Geol. 2011, 283, 274–278. [Google Scholar] [CrossRef]
- Collins, P.L.F. Gas hydrates in CO2-bearing fluid inclusions and the use of freezing data for estimation of salinity. Econ. Geol. 1979, 74, 1435–1444. [Google Scholar] [CrossRef]
- Nilsson, A.; Pettersson, L.G.M. Perspective on the structure of liquid water. Chem. Phys. 2011, 389, 1–34. [Google Scholar] [CrossRef]
- Stanley, H.E.; Teixeira, J. Interpretation of the unusual behavior of H2O and D2O at low temperatures. Test of a percolation model. J. Chem. Phys. 1980, 73, 3404–3422. [Google Scholar] [CrossRef]
- Fraley, P.E.; Rao, K.N. High resolution infrared spectra of water vapor, ν1 and ν3 band of H2O. J. Mol. Spectrosc. 1969, 29, 348–364. [Google Scholar] [CrossRef]
- Ludwig, R. The effect of hydrogen bonding on the thermodynamic and spectroscopic properties of molecular clusters and liquids. Phys. Chem. Chem. Phys. 2002, 4, 5481–5487. [Google Scholar] [CrossRef]
- Sun, Q. The Raman OH stretching bands of liquid water. Vib. Spectrosc. 2009, 51, 213–217. [Google Scholar] [CrossRef]
- Sun, Q. Raman spectroscopic study of the effects of dissolved NaCl on water structure. Vib. Spectrosc. 2012, 62, 110–114. [Google Scholar] [CrossRef]
- Sun, Q. Local statistical interpretation for water structure. Chem. Phys. Lett. 2013, 568, 90–94. [Google Scholar] [CrossRef]
- Bouazizi, S.; Nasr, S.; Jaîdane, N.; Bellissent-Funel, M.C. Local order in aqueous NaCl solutions and pure water: X-ray scattering and molecular dynamics simulations study. J. Phys. Chem. B 2006, 110, 23515–23523. [Google Scholar] [CrossRef]
- Nag; Chakraborty, D.; Chandra, A. Effects of ion concentration on the hydrogen bonded structure of water in the vicinity of ions in aqueous NaCl solutions. J. Chem. Sci. 2008, 120, 71–77. [Google Scholar] [CrossRef]
- Soper, A.K.; Weckström, K. Ion solvation and water structure in potassium halide aqueous solutions. Biophys. Chem. 2006, 124, 180–191. [Google Scholar] [CrossRef]
- Collins, K.D.; Neilson, G.W.; Enderby, J.E. Ions in water: Characterizing the forces that control chemical processes and biological structure. Biophys. Chem. 2007, 128, 95–104. [Google Scholar] [CrossRef]
- Cappa, C.D.; Smith, J.D.; Messer, B.M.; Cohen, R.C.; Saykally, R.J. Effects of cations on the hydrogen bond network of liquid water: New results from X-ray absorption spectroscopy of liquid microjets. J. Phys. Chem. B 2006, 110, 5301–5309. [Google Scholar] [CrossRef]
- Moilanen, D.E.; Fenn, E.E.; Wong, D.; Fayer, M.D. Water dynamics in large and small reverse micelles: From two ensembles to collective behavior. J. Chem. Phys. 2009, 131, 014704. [Google Scholar] [CrossRef]
- Omta, A.W.; Kropman, M.F.; Woutersen, S.; Bakker, H.J. Influence of ions on the hydrogen-bond structure in liquid water. J. Chem. Phys. 2003, 119, 12457–12461. [Google Scholar] [CrossRef]
- Turton, D.A.; Hunger, J.; Hefter, G.; Buchner, R.; Wynne, K. Glasslike behavior in aqueous electrolyte solutions. J. Chem. Phys. 2008, 128, 161102. [Google Scholar] [CrossRef] [PubMed]
- White, J.A.; Schwegler, E.; Galli, G.; Gygi, F. The solvation of Na+ in water: First-principles simulations. J. Chem. Phys. 2000, 113, 4668–4673. [Google Scholar] [CrossRef]
- Aziz, E.F.; Zimina, A.; Freiwald, M.; Eisebitt, S.; Eberhardt, W. Molecular and electronic structure in NaCl electrolytes of varying concentration: Identification of spectral fingerprints. J. Chem. Phys. 2006, 124, 114502. [Google Scholar] [CrossRef]
- Wu, Z.; Wang, Z.; Sun, X.; Zhang, L.; Xu, M.; Xu, X. Insight into the liquid structure of water and sodium chloride solutions using stimulated Raman scattering. Phys. Rev. Appl. 2020, 13, 024030. [Google Scholar] [CrossRef]
- Wang, X.; Chou, I.-M.; Hu, W.; Burruss, R.C.; Sun, Q.; Song, Y. Raman spectroscopic measurements of CO2 density: Experimental calibration with high-pressure optical cell (HPOC) and fused silica capillary capsule (FSCC) with application to fluid inclusion observations. Geochim. Cosmochim. Acta 2011, 75, 4080–4093. [Google Scholar] [CrossRef]
- Anderson, G.R. The Raman-spectra of carbon dioxide in liquid H2O and D2O. J. Phys. Chem. 1977, 81, 273–276. [Google Scholar] [CrossRef]
- Rudolph, W.W.; Fische, D.; Irmer, G. Vibrational spectroscopic studies and density functional theory calculations of speciation in the CO2-water system. Appl. Spectrosc. 2006, 60, 130–144. [Google Scholar] [CrossRef]
- Leung, K.; Nielsen, I.M.; Kurtz, I. Ab initio molecular dynamics study of carbon dioxide and bicarbonate hydration and the nucleophilic attack of hydroxide on CO2. J. Phys. Chem. B 2007, 111, 4453–4459. [Google Scholar] [CrossRef]
- Lam, R.K.; England, A.H.; Smith, J.W.; Rizzuto, A.M.; Shih, O.; Prendergast, D.; Saykally, R.J. The hydration structure of dissolved carbon dioxide from X-ray absorption spectroscopy. Chem. Phys. Lett. 2015, 633, 214–217. [Google Scholar] [CrossRef]
- Prasetyo, N.; Hofer, T.S. Structure, dynamics, and hydration free energy of carbon dioxide in aqueous solution: A quantum mechanical/molecular mechanics molecular dynamics thermodynamic integration (QM/MM MD TI) simulation study. J. Chem. Theory Comput. 2018, 14, 6472–6483. [Google Scholar] [CrossRef] [PubMed]
- Soli, A.L.; Byrne, R.H. CO2 system hydration and dehydration kinetics and the equilibrium CO2/H2CO3 ratio in aqueous NaCl solution. Mar. Chem. 2002, 78, 65–73. [Google Scholar] [CrossRef]
- Davis, A.R.; Oliver, B.G. A vibrational-spectroscopic study of the species present in the CO2-H2O system. J. Solut. Chem. 1972, 1, 329–339. [Google Scholar] [CrossRef]


| H2O-NaCl (Mass %) | Cl− Molarity (M) | (HB)S | I(HB)S | (HB)W | I(HB)W | K | ΔK |
|---|---|---|---|---|---|---|---|
| 0 | 0 | 3213.230 | 5326.496 | 3437.976 | 8026.689 | 1.506936 | 0 |
| 2.5 | 0.433178 | 3216.709 | 3408.956 | 3441.793 | 5579.770 | 1.636797 | 0.129861 |
| 5 | 0.878333 | 3218.897 | 3345.302 | 3443.944 | 5913.753 | 1.767778 | 0.260842 |
| 7.5 | 1.335969 | 3220.875 | 3242.197 | 3445.469 | 6174.818 | 1.904517 | 0.397581 |
| 10 | 1.806617 | 3222.979 | 3110.091 | 3446.796 | 6460.872 | 2.077390 | 0.570454 |
| 12.5 | 2.290842 | 3226.204 | 2964.250 | 3449.026 | 6622.218 | 2.234028 | 0.727092 |
| 15 | 2.789239 | 3229.123 | 1988.754 | 3450.289 | 4895.760 | 2.461722 | 0.954786 |
| 17.5 | 3.302439 | 3229.020 | 2749.645 | 3450.172 | 7326.519 | 2.664533 | 1.157596 |
| 20 | 3.831113 | 3230.939 | 2638.158 | 3450.790 | 7606.917 | 2.883420 | 1.376484 |
| Synthetic H2O-NaCl-CO2 (NaCl, Mass %) | Cl− Molarity (M) | (HB)S | I(HB)S | (HB)W | I(HB)W | K | ΔK | Calculated Cl− Molarity | Relative Error |
|---|---|---|---|---|---|---|---|---|---|
| 0 | 0 | 3213.230 | 5326.496 | 3437.976 | 8026.689 | 1.506936 | 0 | ||
| 5 | 0.878333 | 3214.922 | 12855.950 | 3438.752 | 22743.29 | 1.769087 | 0.262151 | 0.893625 | −1.74% |
| 10 | 1.806617 | 3222.917 | 13847.220 | 3445.224 | 28919.52 | 2.088471 | 0.581535 | 1.862504 | −3.09% |
| 15 | 2.789239 | 3228.519 | 10821.210 | 3449.305 | 26758.11 | 2.472746 | 0.965810 | 2.840135 | −1.82% |
| 20 | 3.831113 | 3229.875 | 11488.240 | 3449.543 | 33129.09 | 2.883741 | 1.376804 | 3.830830 | 0.01% |
| No. | T(m,cla) (°C) | Salinity (Mass % NaCl) | Cl− Molarity (Microthermometry) | ΔK | Cl− Molarity (M) (Equation (3)) | Relative Error | Variance (σ2) | Standard Deviation (σ) |
|---|---|---|---|---|---|---|---|---|
| Large-1 | 8.3 | 3.33 | 0.579616 | 0.169730 | 0.572443 | 1.23% | 5.4 × 10⁻⁵ | 7.35 × 10⁻³ |
| Large-2 | 8.3 | 3.33 | 0.579616 | 0.171487 | 0.578750 | 0.15% | ||
| Large-3 | 8.3 | 3.33 | 0.579616 | 0.173636 | 0.586455 | −1.18% | ||
| Large-4 | 8.3 | 3.33 | 0.579616 | 0.175111 | 0.591735 | −2.09% |
Disclaimer/Publisher’s Note: The statements, opinions and data contained in all publications are solely those of the individual author(s) and contributor(s) and not of MDPI and/or the editor(s). MDPI and/or the editor(s) disclaim responsibility for any injury to people or property resulting from any ideas, methods, instructions or products referred to in the content. |
© 2024 by the authors. Licensee MDPI, Basel, Switzerland. This article is an open access article distributed under the terms and conditions of the Creative Commons Attribution (CC BY) license (https://creativecommons.org/licenses/by/4.0/).
Share and Cite
He, X.; Wang, W.-Q.; Liu, Y.-Z.; Sun, Q. Raman Quantitative Measurement on the Cl− Molarity of H2O-NaCl-CO2 System: Application to Fluid Inclusions. Minerals 2024, 14, 1121. https://doi.org/10.3390/min14111121
He X, Wang W-Q, Liu Y-Z, Sun Q. Raman Quantitative Measurement on the Cl− Molarity of H2O-NaCl-CO2 System: Application to Fluid Inclusions. Minerals. 2024; 14(11):1121. https://doi.org/10.3390/min14111121
Chicago/Turabian StyleHe, Xian, Wei-Qi Wang, Yu-Zhen Liu, and Qiang Sun. 2024. "Raman Quantitative Measurement on the Cl− Molarity of H2O-NaCl-CO2 System: Application to Fluid Inclusions" Minerals 14, no. 11: 1121. https://doi.org/10.3390/min14111121
APA StyleHe, X., Wang, W.-Q., Liu, Y.-Z., & Sun, Q. (2024). Raman Quantitative Measurement on the Cl− Molarity of H2O-NaCl-CO2 System: Application to Fluid Inclusions. Minerals, 14(11), 1121. https://doi.org/10.3390/min14111121