Next Article in Journal
The Characterization of the Building Materials Used in the Refectory of the Manzana Jesuítica in Córdoba (Argentina) on the Basis of a Study of Its Historical Background and the Archaeological Evidence
Previous Article in Journal
Tectonic–Climate Interactions Controlled the Episodic Magmatism and Exhumation of the Zheduo–Gongga Massif in the Eastern Tibetan Plateau
Previous Article in Special Issue
Analytical Techniques for Detecting Rare Earth Elements in Geological Ores: Laser-Induced Breakdown Spectroscopy (LIBS), MFA-LIBS, Thermal LIBS, Laser Ablation Time-of-Flight Mass Spectrometry, Energy-Dispersive X-ray Spectroscopy, Energy-Dispersive X-ray Fluorescence Spectrometer, and Inductively Coupled Plasma Optical Emission Spectroscopy
 
 
Communication

Laser-Induced Breakdown Spectroscopy Applied to the Quantification of K, Ca, Mg and Mn Nutrients in Organo-Mineral, Mineral P Fertilizers and Rock Fertilizers

by
Cesar Cervantes
1,
Bruno S. Marangoni
2,
Gustavo Nicolodelli
3,*,
Giorgio S. Senesi
4,
Paulino R. Villas-Boas
1,
Caroline S. Silva
5,
Ana Rita A. Nogueira
6,
Vinicius M. Benites
7 and
Débora M. B. P. Milori
1
1
Embrapa Instrumentação, P.O. Box 741, São Carlos 13560-970, SP, Brazil
2
Instituto de Física, Universidade Federal de Mato Grosso de Sul, P.O. Box 549, Campo Grande 79070-900, MS, Brazil
3
Departamento de Física, Universidade Federal de Santa Catarina, Florianópolis 88040-900, SC, Brazil
4
CNR—Istituto per la Scienza e Tecnologia dei Plasmi (ISTP) sede di Bari, Via Amendola 122/D, 70126 Bari, Italy
5
Departamento de Quimica, Universidade Federal de São Carlos, P.O. Box 676, São Carlos 13565-905, SP, Brazil
6
Embrapa Pecuária Sudeste, P.O. Box 339, São Carlos 13560-970, SP, Brazil
7
Embrapa Solos, Rua Jardim Botânico 1024, Rio de Janeiro 22460-000, RJ, Brazil
*
Author to whom correspondence should be addressed.
Minerals 2024, 14(11), 1109; https://doi.org/10.3390/min14111109
Submission received: 10 September 2024 / Revised: 24 October 2024 / Accepted: 28 October 2024 / Published: 30 October 2024

Abstract

:
A low-cost laser-induced breakdown spectroscopy (LIBS) instrument equipped with a charge-coupled device (CCD) was tested in the atmospheric environment for the quantification of K, Ca, Mg, and Mn in some organo–mineral fertilizers, mineral P fertilizers, and rock fertilizers of various compositions and origins, using flame atomic absorption spectrometry (FAAS) as the reference technique. The correlation analysis performed between each CCD pixel and the corresponding element concentration measured by FAAS allowed to choose the most appropriate K, Ca, Mg and Mn emission lines for LIBS analysis. The normalization process applied to LIBS spectra to correct physical matrix effects and small fluctuations was able to increase the linear correlation of the calibration curves between LIBS data and FAAS data by an average of 0.15 points of the R-value for all elements of interest. The R values of calibration curves were 0.97, 0.96, 0.86 and 0.84, for K, Ca, Mg and Mn, respectively. The limits of detection (LOD) were 66 mg/kg (K), 35 mg/kg (Ca), 5.4 mg/kg (Mg) and 0.8 mg/kg (Mn) when using LIBS in the quantification model. The cross-validation (leave-one-out) analysis yielded an absolute average error of 12% (K), 21% (Ca), 8% (Mg) and 13% (Mn) when LIBS data were correlated to FAAS ones. These results showed that the calibration models used were close to the optimization limit and satisfactory for K, Ca, Mg, and Mn quantification in the fertilizers and rocks examined.

1. Introduction

The global population is estimated to increase by up to 30% from now until 2050, with a simultaneous significant growth of the demand for agricultural production [1]. In this context, Brazil is expected to be one of the world leaders in food production for exportation, which implies a simultaneous increase in fertilizer demand. In recent years, however, agricultural production has increased at a slower rate than the use of fertilizers, which implies the need of improving their use [2].
Currently, several projects in Brazil aim to produce organo–mineral phosphate fertilizers composed of the mixtures of organic materials derived from waste and phosphate minerals to reduce production costs and the dependence on imported fertilizers [3]. Organo–mineral phosphate fertilizers generally contain more than 1% wt of K, Ca, Mg, and Mn originated from the parent materials. In particular, K is one of the three most important nutrients for plants due to its unique actions such as activation of enzymes, control of membrane potentials, synthesis of carbohydrates, etc. The elements Ca, Mg, and Mn are also important plant nutrients due to their action in building cellular structures, the role in photosynthesis and metabolic processes, activation of plant enzymes, etc. [4].
Nowadays, the elemental composition of fertilizers in Brazil is determined at low detail and accuracy, which can lead to incorrect use of fertilization rates. Inductively coupled plasma–optical emission spectrometry (ICP-OES) and flame atomic absorption spectrometry (FAAS) are the most reliable and commonly used techniques for the quantification of elements in fertilizers. However, these techniques are time-consuming, laborious, and susceptible to contamination due to the extraction methods used [5]. Furthermore, some techniques used for elemental analysis of soils, e.g., flame photometry, have also been adapted to fertilizer analysis [6]. Thus, developing a low-cost and easy-handling technique that measures the concentration of elements in fertilizers is expected to increase the analytical performance by reducing analytical errors and possible data misinterpretations and reduce both the cost and time involved.
Laser-induced breakdown spectroscopy (LIBS) is a rapid and relatively simple technique that has gained great interest in soil and fertilizer analysis [7,8,9,10,11,12,13,14,15]. In recent years, significant advancements have been made in the online conventional LIBS and double pulse (DP)-LIBS analysis of pollutants and nutrients in a variety of fertilizers, including those based on biochar’s, other organic matrices, phosphates, and phosphate rocks [12,13,14,15,16]. However, the main problem encountered when applying LIBS to fertilizers analysis is the so-called matrix effect, which makes it difficult to build a direct calibration model without the use of complex correction methods. In this work, the quantification and correction of the spectra were carried out directly at the atomic and ionic emissions lines. This simplification in the analysis avoids the occurrence of overfitting processes and improves the interpretability of the analysis compared to multivariate methods [8].
Thus, the objective of this work was to apply a commercial LIBS equipment to the quantification of the elements K, Ca, Mg, and Mn in organo–mineral fertilizers, mineral P fertilizers and rock fertilizers, using the most appropriate elemental emission lines while accounting for matrix effects in a simple and effective way.

2. Materials and Methods

2.1. Samples

Three main types of fertilizers were used in this work: (a) n. 5 phosphate rocks (PR) of different sources, i.e., Bayovar, Gafsa, Arad, Djebel, and Itafos; (b) n. 3 commercial phosphate fertilizers, i.e., monoammonium phosphate (MAP), single superphosphate (SS) and triple superphosphate (TS); and (c) n. 18 organo–mineral fertilizers consisting of mixtures of 60% poultry litter, either non- composted (NCPL) or composted (CPL), and 40% MAP, with some samples added with 2% bentonite and various amounts (from 1 to 10%) of S [8]. Furthermore, to construct a robust calibration curve, nine additional samples were prepared by mixing the two organo–phosphate fertilizers containing the highest K concentration to obtain a range of K concentrations between 200 and 500 mg/kg.
All samples were ground and sieved (<100 mesh) to ensure homogeneity, and then pelletized by pressing the sample powders at 6 × 10⁸ N·m−2 for 30 s. The phosphate rock and commercial phosphate fertilizer samples were used to test the LIBS quantification performance for organo–phosphate fertilizers with a very low content of the elements of interest.

2.2. LIBS Instrument Set-Up and FAAS Analysis

The LIBS spectra were obtained using a commercial LIBS device, which included a Q-switched Nd laser. The laser operated at a wavelength of 1064 nm, with a repetition rate of 10 Hz, a pulse duration of 8 ns, an energy output of 60 mJ, and an integration time of 2.1 ms. The plasma emission was collected by a fiber optics bundle located 7 mm from the sample and then delivered to seven spectrometers. The wavelengths analyzed covered the range from 189 nm to 966 nm with an optical resolution of 0.1 nm. The detector consisted of a CCD with a 2048-pixel array. The delay time was 2.5 µs. Each sample pellet was subjected to 30 laser shots on each side of the sample [8].
The spectral baseline correction and peak normalization were performed using an accumulation of 30 laser shots with no sample present, producing a reference blank LIBS spectrum featuring the same plasma fluctuations as the sample. To correct the offset from the continuous plasma emission (background noise), a baseline was established beneath the emission peak, connecting 4–5 points from one end of the peak to the other, ensuring no overlap with other emission peaks (Figure 1a). The peak was then subtracted across the spectrum within the defined points of interest. An asymmetrical Lorentzian function was used to fit the isolated peak in each spectrum (Figure 1b).
Following the spectral correction, the final normalized peak area, Af, was obtained by calculating the ratio of the corrected peak area, A1, to the area beneath the spectral peak, A2 (Figure 2). This value, Af, was then utilized to construct calibration curves. The normalization process aimed to compensate for matrix effects that could influence plasma fluctuations, which were expected to vary depending on the type of sample [8]. By using this method, the signal intensity remained proportional to the concentration of the target element, helping to address discrepancies between sample matrices. This technique was also effective in mitigating small variations in laser power and minor alignment issues [8], a crucial factor, particularly for portable measurement systems used in fieldwork. Assuming that the stoichiometric relationship between the sample and the plasma remained unchanged, with only the plasma volume fluctuating, the continuous plasma emission was expected to change in proportion to the peak emission. Based on this reasoning, the peak area was normalized by considering the continuous plasma emission beneath the spectral peak [18].
The optimal emission peaks for each element were selected by constructing calibration curves, which involved comparing FAAS reference data with the spectral pixel information. The initial step in this process involved removing outlier spectra using the spectral angle mapper (SAM) technique in MatLab [19]. This method enabled the detection and elimination of outliers by comparing two spectra and returning a similarity score between −1 and 1. Once the outliers were excluded, an average spectrum was calculated for each sample. Specific wavelengths corresponding to the elements of interest were then identified, cross-checked with data from the NIST website [20], and compared against the FAAS reference data. Then, a Pearson correlation analysis was performed for each wavelength. This approach enabled the calculation of R values for each point in the spectra, helping to identify the most reliable peaks for use in the calibration models. In the case of lines with reabsorption or interference, an abnormal behavior would be observed in the graph, allowing a quick assessment of the line quality.
Furthermore, to confirm that no other element interfered with the regions of interest, the NIST database was used, and a correlation analysis was performed with various elements that were near these regions. Figure 3, for example, was the result of a correlation graph involving the spectrum of all samples and their elemental concentrations. A specific wavelength from each spectrum for all samples was selected and fitted to a line corresponding to the change in concentration of a selected chemical element. All the correlation coefficients (R) related to the concentration of the chosen element of this fit were recorded and the process repeated in order to evaluate all points in the spectra.
In Figure 3, a high value (close to 1) indicated that the specific wavelength responded strongly to changes in element concentration allowing to quickly and easily identify transitions with the greatest potential for calibration development and, more importantly, spotted problematic transitions, whether due to interference from overlapping lines or excessive reabsorption and noise. An example is shown in Figure 3 for the element K, where the K peak at 769.9 nm featured the highest correlation, but it appeared self-absorbed. On the other hand, the transition at 698.3 nm showed behavior without peak reversal and apparent broadening of the emission lines, indicating that there was no strong self-absorption process. Although the R correlation is lower for the 698.3 nm transition compared to the 769.9 nm transition, the 698.3 nm transition was chosen for our model due to its stability, resulting in more reliable and reproducible outcomes. Finally, the emission lines that represented at the best the elements of interest are listed in Table 1 and Figure 4, these transitions showed the best correlation and were not significantly affected by interference or reabsorption.
A Perkin-Elmer PinAAcle 900T model instrument was used to perform FAAS analysis on 1 g of sample added with 10 mL of HNO3 divided by 3 mL of H2O2, and digested for 6 h at 150 °C on a digestion block.

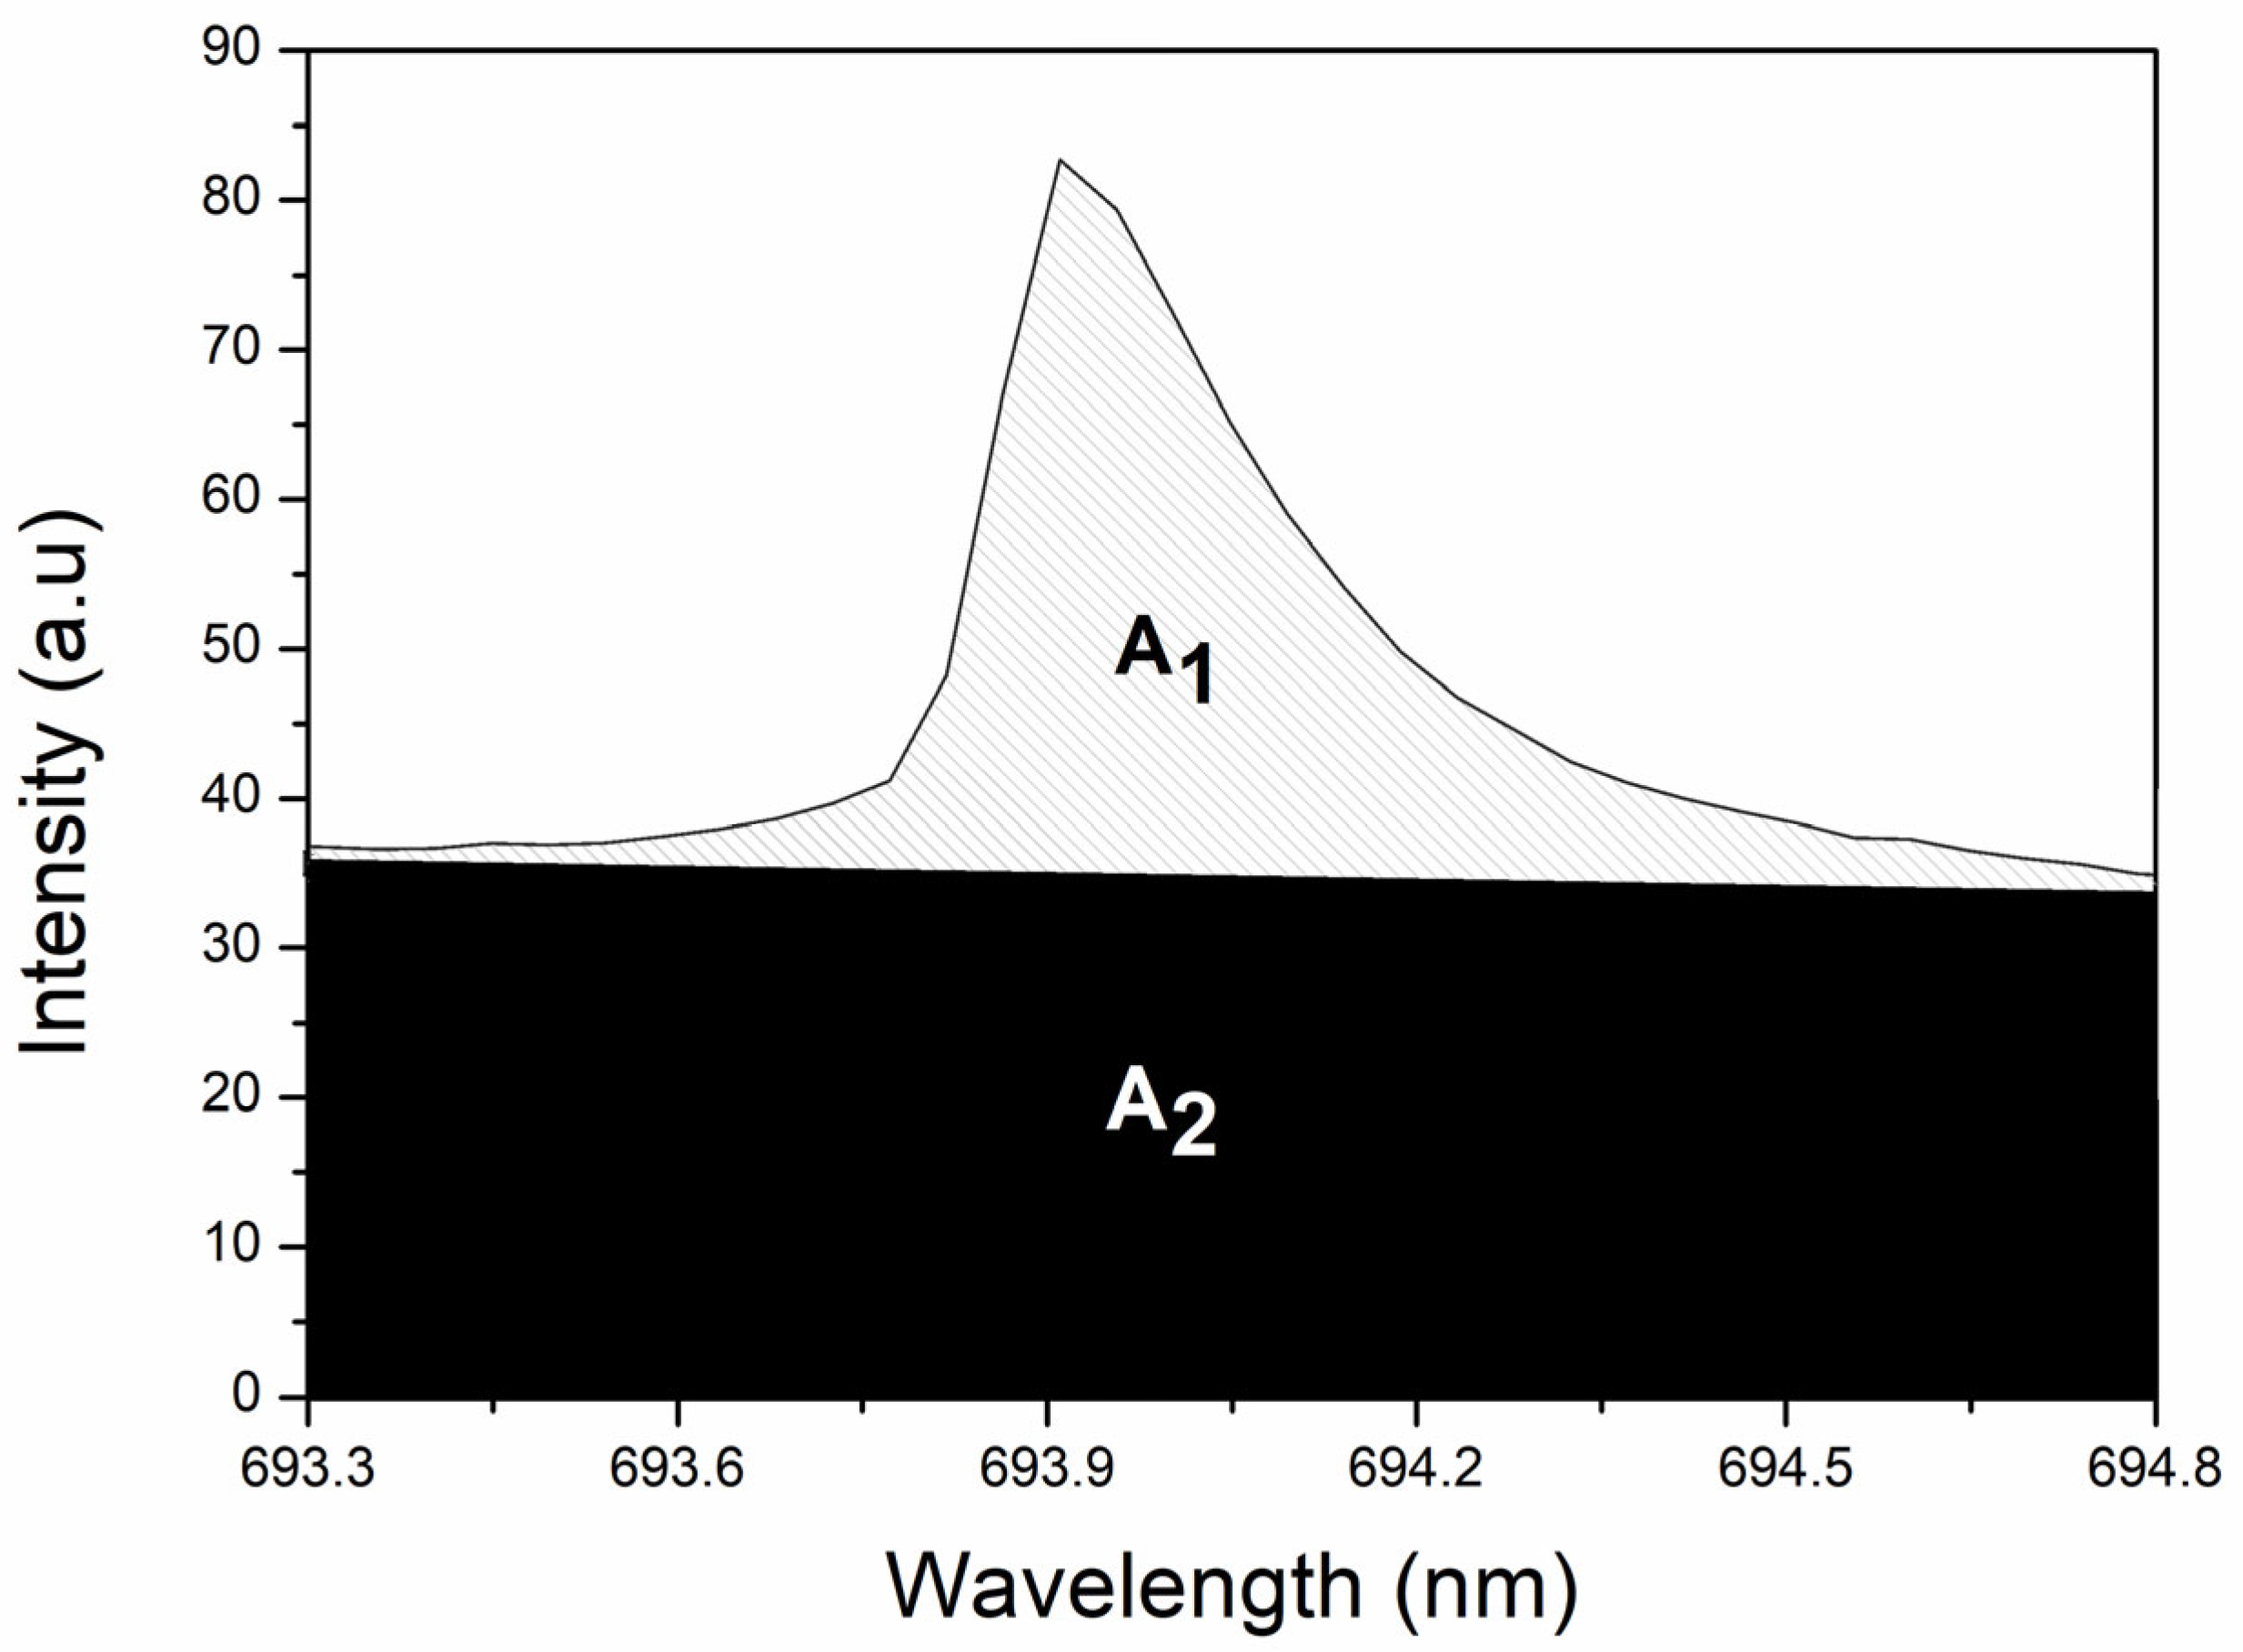
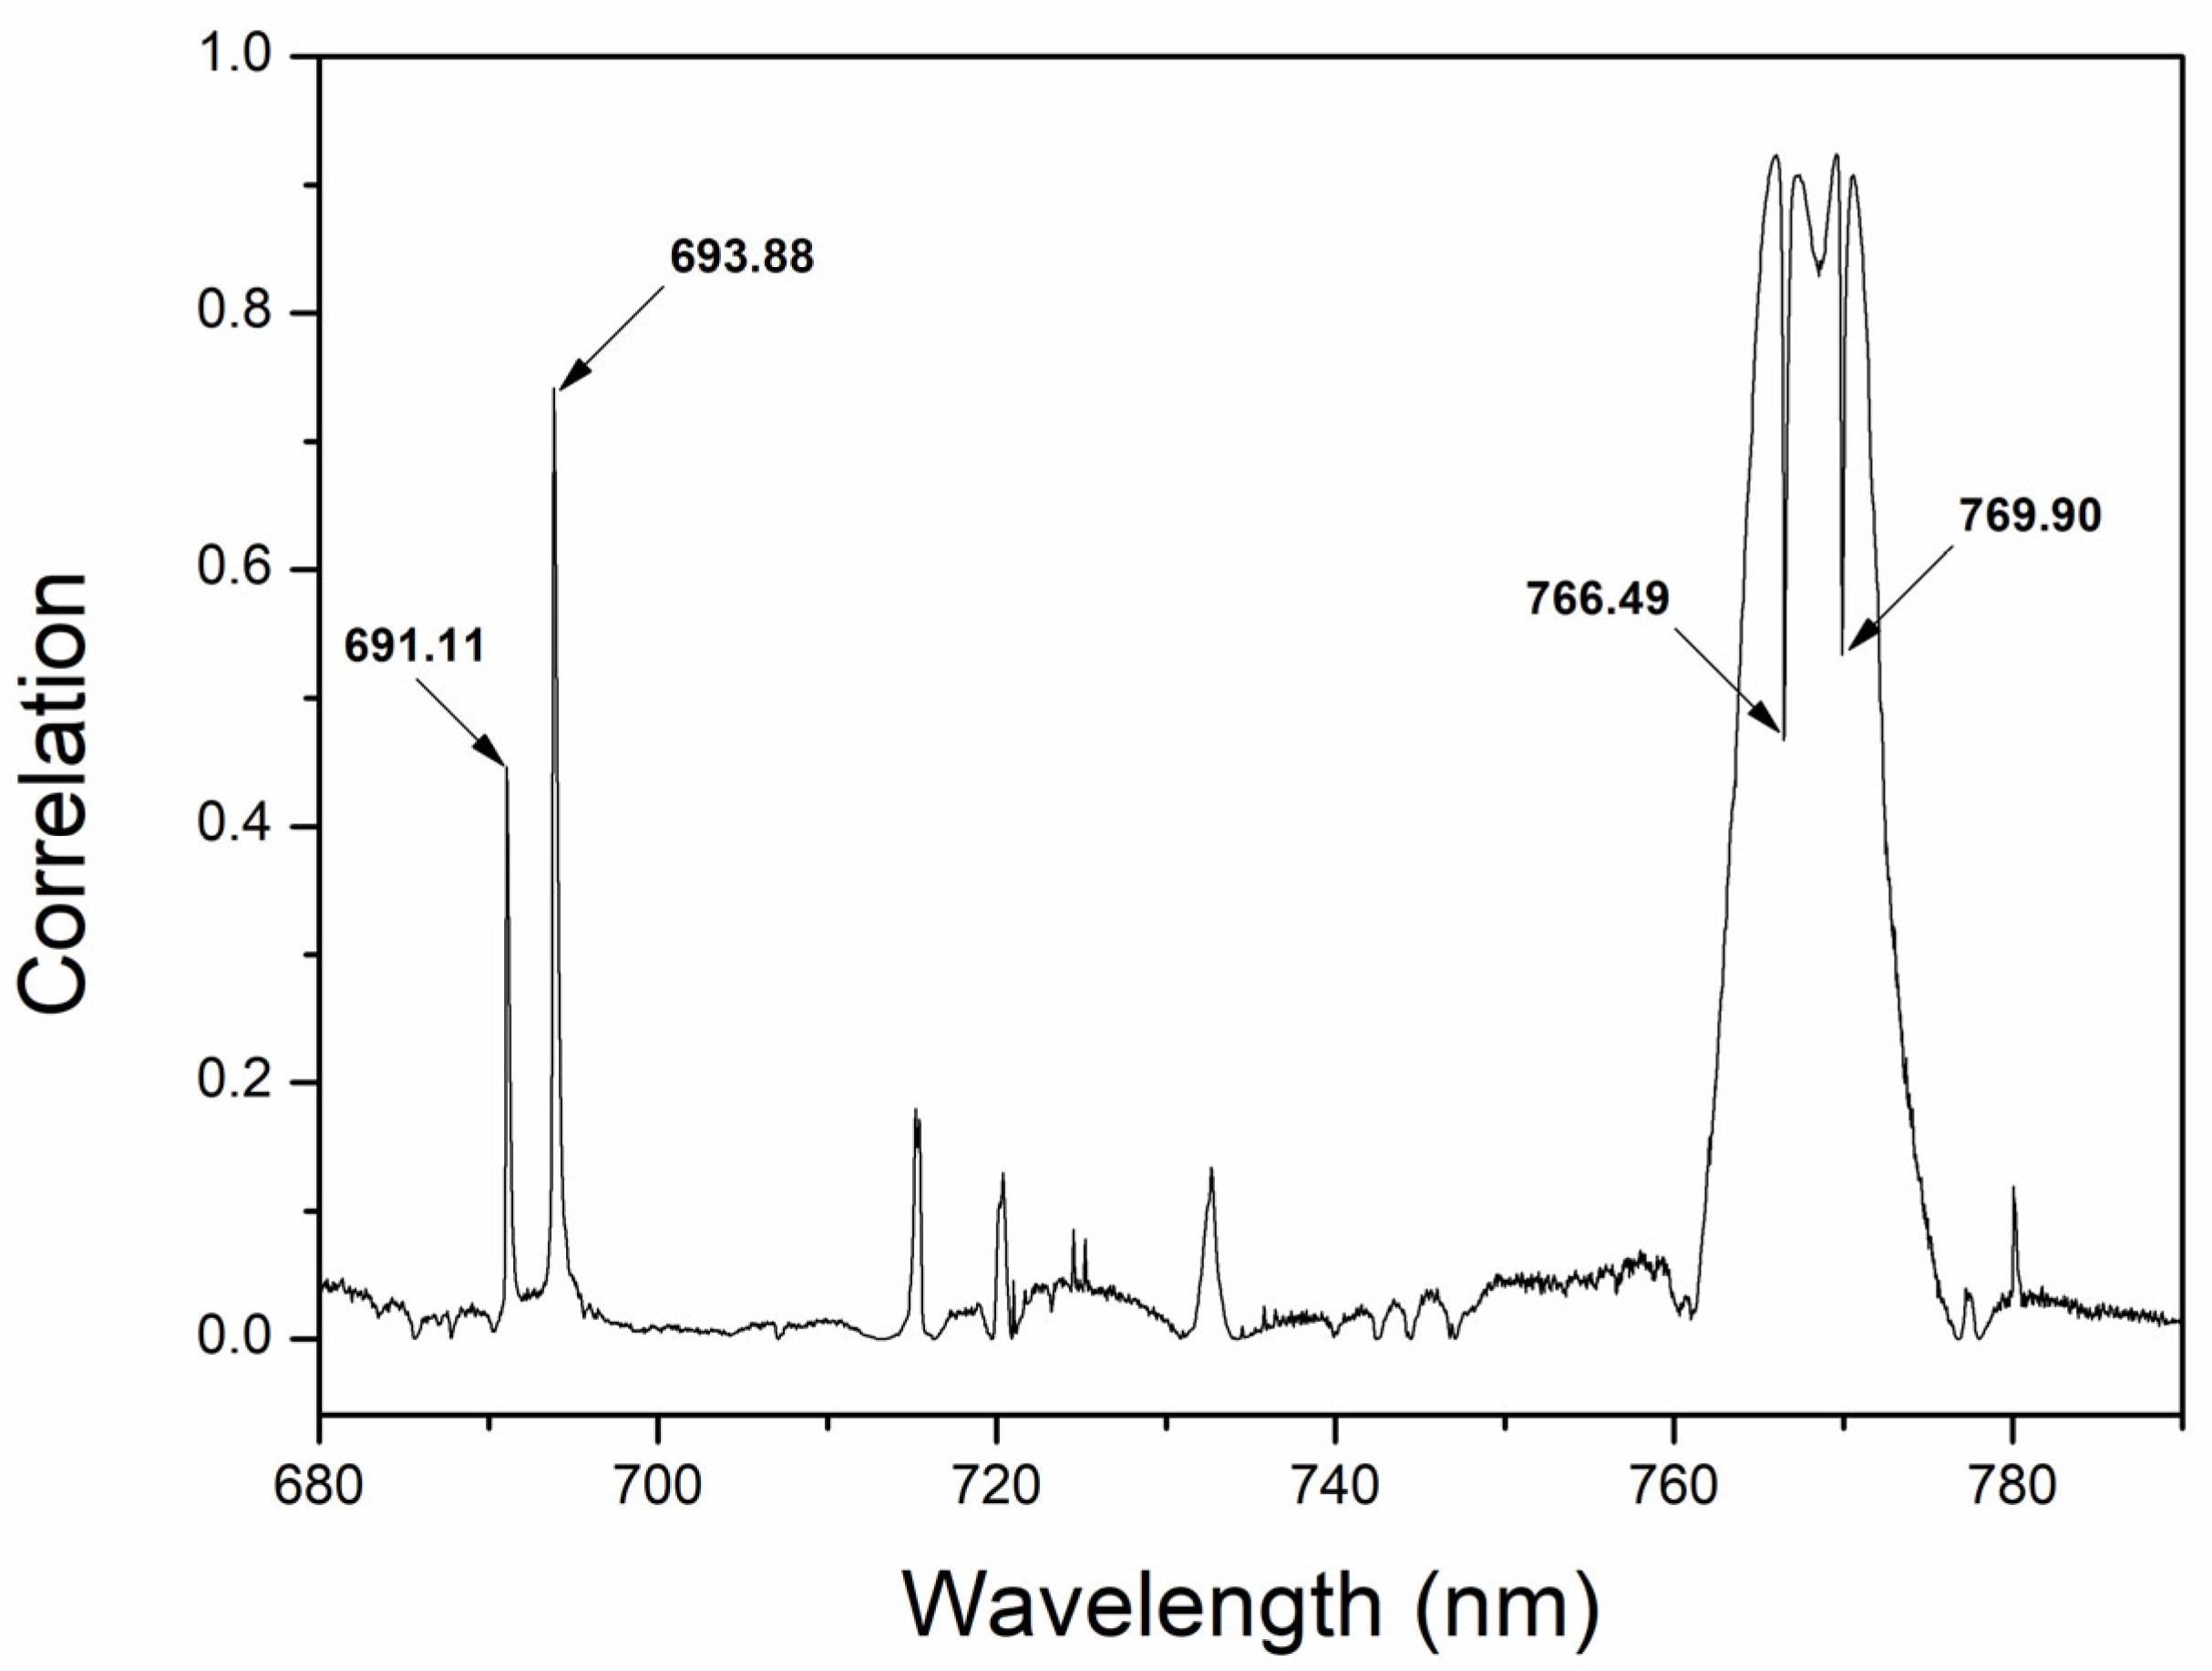
3. Results and Discussion

The normalization procedure applied proved to be adequate for correcting plasma fluctuations (volume changes), which is the main factor influencing the intensity of LIBS emission signals. Five spectral lines of Ca I were utilized (443.5 nm, 610.2 nm, 643.9 nm, 428.3 nm, and 585.7 nm), and a linear regression was applied to create the Boltzmann plot. To determine the plasma temperature, three samples were selected, each representing one of the three primary groups of fertilizers: phosphate rock, commercial mineral, and organo–mineral. The three plasma temperatures calculated, i.e., 6860 K, 6290 K and 6790 K, respectively, for samples featuring different matrices showed no significant temperature change and were consistent, yielding a mean temperature of 6813 K. This result suggested that the effects of plasma volume changes were physical and not chemical. In particular, plasma volume changes are influenced mainly by perceivable differences in sound shock waves and plasma luminosity that can cause the LIBS emission signal to grow [21,22].
The plasma’s electron density (Ne) is determined by the width of Stark-broadened spectral lines, which are influenced by two types of Stark effects: quadratic and linear. The linear Stark effect is specific to the hydrogen atom, making it simpler to accurately determine hydrogen lines’ full width at half-maximum (FWHM) intensity. In contrast, other atoms experience the quadratic Stark effect, which influences their spectral lines differently [23]. The electron density was then calculated using the following equation:
Ne = 8.02 × 10¹²[Δλ1/21/2]3/2
where Δλ1/2 is the FWHM of the hydrogen line at 656.5 nm, α1/2 is the reduced wavelength. To ensure the existence of LTE conditions, the McWhirter criterion has to be satisfied, i.e., Ne ≥ 1.6 × 10¹² ΔE3T1/2. The values of the average electron density of the three representative samples, i.e., 1.46 × 10¹⁶, 1.61 × 10¹⁶ and 9.63 × 10¹⁵ were bigger than the electron density defined by the McWhirter criterion. Therefore, the criterion was satisfied, so the analyses were performed close to or under LTE conditions, and the quantitative information produced can be reliable.
The four calibration curves built by applying the linear fit method between normalized LIBS area and the corresponding FAAS data (mg/kg) (Figure 5) yielded R values for K, Ca, Mg, and Mn, i.e., 0.97, 0.96, 0.86, and 0.84, respectively (Table 2). The normalization process applied to LIBS spectra to correct physical matrix effects and small fluctuations was thus able to increase the linear correlation of the calibration curves between LIBS data and FAAS data by an average of 0.15 points of the R-value for all elements of interest, improving the quantitative performance of LIBS analysis.
Quite satisfactory LOD values, calculated as 3.3 σ/m, where σ is the standard deviation of the background signal and m is the slope of the calibration curve [24], were obtained for K, Ca, Mg, and Mn, i.e., 66 mg/kg, 35 mg/kg, 5.4 mg/kg and 0.8 mg/kg, respectively (Table 2). The good agreement between the values predicted by LIBS and those obtained from the reference technique confirmed the satisfactory quantitative performance of LIBS in analyzing K, Ca, Mg, Mn, and Cu in organo–phosphate, phosphate fertilizers, and phosphate rocks.
The leave-one-out cross-validation procedure between FAAS and LIBS data was performed by withdrawing one sample from the sample set and testing it against the calibration model previously built to produce the concentration predicted by the LIBS area. The procedure was repeated for each element in each sample. The element concentrations predicted by LIBS were then compared to the corresponding FAAS concentrations, and an absolute error was calculated. The mean errors calculated for K, Ca, Mg, and Mn were 12, 21, 8, and 13% (Figure 6). The relatively small errors achieved could be considered satisfactory for LIBS quantification of the elements of interest in the fertilizers examined.
The results show that the adopted protocol provided satisfactory values for agricultural applications. The selection of a single transition, using a correlation technique to identify lines with interference or reabsorption, enhanced the robustness of the model. The univariate analysis allows the development of simple and portable equipment dedicated to the analysis of a specific element. Consequently, there is no need for significant computational power or a robust spectrometer to perform the analyses, enabling reliable measurements even under hostile conditions, e.g., areas or terrain with extreme climatic or geographic conditions. In a previous study, a similar protocol for the quantification of phosphorus in fertilizers was demonstrated [8]. The univariate calibration curve with background correction proved to be reliable for quantifications performed up to six months after the calibration curve was constructed, demonstrating significant resilience, a crucial characteristic for this type of measurement.

4. Conclusions

The concentrations of K, Ca, Mg, and Mn were measured in several organo–mineral fertilizers, mineral P fertilizers, and rock fertilizers using a commercial LIBS system. Outlier spectra were successfully removed using the SAM method, this automated outlier exclusion process minimizes human intervention reducing bias in the analysis, so that the best emission line representing the elements could be used in the correlation curves. The normalization procedure was applied satisfactorily to correct plasma fluctuations and allowed the construction of robust calibration curves. The model’s robustness is enhanced by selecting a single transition and using a correlation technique to identify lines with interference or reabsorption. The univariate analysis enables the development of simple, portable equipment for specific element analysis, eliminating the need for significant computational power or robust spectrometers.

Author Contributions

Conceptualization, C.C., B.S.M., G.N., G.S.S. and D.M.B.P.M.; methodology, C.S.S., A.R.A.N. and V.M.B.; software, B.S.M. and P.R.V.-B.; validation, B.S.M. and P.R.V.-B.; formal analysis, C.C., V.M.B. and B.S.M.; investigation, C.C., B.S.M., G.N., G.S.S., D.M.B.P.M. and P.R.V.-B.; resources, D.M.B.P.M.; data curation, B.S.M., C.S.S., A.R.A.N. and V.M.B.; writing—original draft preparation, C.C., B.S.M., G.N. and G.S.S.; writing—review and editing, C.C., B.S.M., G.N., G.S.S., A.R.A.N. and V.M.B.; supervision, B.S.M. and D.M.B.P.M.; project administration, D.M.B.P.M.; funding acquisition, D.M.B.P.M. All authors have read and agreed to the published version of the manuscript.

Funding

This research was funded by FAPESP (13/072776-1), CNPq (440226/2021-0, 461743/2014-0, and 312775/2021-0, 308510/2023-2, 304366/2022-6).

Institutional Review Board Statement

Not applicable.

Informed Consent Statement

Not applicable.

Data Availability Statement

Data underlying the results presented and the original calculation draft in this paper are not publicly available at this time but may be obtained from the authors upon reasonable request.

Acknowledgments

The authors thank CAPES (001) and EMBRAPA for their financial support of this work.

Conflicts of Interest

The authors declare no conflicts of interest. The funders had no role in the design of the study; in the collection, analyses, or interpretation of data; in the writing of the manuscript; or in the decision to publish the results.

References

  1. World Population Projected to Reach 9.8 Billion in 2050, and 11.2 Billion in 2100. Available online: https://www.un.org/en/desa/world-population-projected-reach-98-billion-2050-and-112-billion-2100 (accessed on 25 July 2024).
  2. Lu, C.; Tian, H. Global nitrogen and phosphorus fertilizer use for agriculture production in the past half century: Shifted hot spots and nutrient imbalance. Earth Syst. Sci. Data 2017, 9, 181–192. [Google Scholar] [CrossRef]
  3. Pavinato, P.S.; Cherubin, M.R.; Soltangheisi, A.; Rocha, G.C.; Chadwick, D.R.; Jones, D.L. Revealing soil legacy phosphorus to promote sustainable agriculture in Brazil. Sci. Rep. 2020, 10, 15615. [Google Scholar] [CrossRef] [PubMed]
  4. Zhou, S.; Yan, G.; Hu, J.; Liu, X.; Zou, X.; Tie, L.; Yuan, R.; Yang, Y.; Xiao, L.; Cui, X.; et al. The Responses of Leaf Litter Calcium, Magnesium, and Manganese Dynamics to Simulated Nitrogen Deposition and Reduced Precipitation Vary with Different Decomposition Stages. Forests 2021, 12, 1473. [Google Scholar] [CrossRef]
  5. Capră, L.; Stoica, R.; Ivan, G.-R.; Șuică-Bunghez, I.-R.; Oancea, F. The Optimization and Validation of the Method for the Determination of Micronutrients in Organic Fertilizers by Inductively Coupled Plasma Optical Emission Spectrometry. Chem. Proc. 2023, 13, 10. [Google Scholar] [CrossRef]
  6. Ullah, R.; Abbas, Z.; Bilal, M.; Habib, F.; Iqbal, J.; Bashir, F.; Noor, S.; Qazi, M.A.; Niaz, A.; Baig, K.S.; et al. Method development and validation for the determination of potassium (K2O) in fertilizer samples by flame photometry technique. J. King Saud Univ. Sci. 2022, 34, 102070. [Google Scholar] [CrossRef]
  7. Farooq, W.A.; Al-Mutairi, F.N.; Khater, A.E.M.; Al-Dwayyan, A.S.; AlSalhi, M.S.; Atif, M. Elemental analysis of fertilizer using laser induced breakdown spectroscopy. Opt. Spectrosc. 2012, 112, 874–880. [Google Scholar] [CrossRef]
  8. Marangoni, B.S.; Silva, K.S.; Nicolodelli, G.; Senesi, G.S.; Cabral, J.S.; Villas-Boas, P.R.; Silva, C.S.; Teixeira, P.C.; Nogueira, A.R.A.; Benites, V.M.; et al. Phosphorus quantification in fertilizers using laser induced breakdown spectroscopy (LIBS): A methodology of analysis to correct physical matrix effects. Anal. Methods 2016, 8, 78–82. [Google Scholar] [CrossRef]
  9. Yao, S.; Lu, J.; Li, J.; Chen, K.; Li, J.; Dong, M. Multi-elemental analysis of fertilizer using laser-induced breakdown spectroscopy coupled with partial least squares regression. J. Anal. At Spectrom. 2010, 25, 1733. [Google Scholar] [CrossRef]
  10. Groisman, Y.; Gaft, M. Online analysis of potassium fertilizers by Laser-Induced Breakdown Spectroscopy. Spectrochim. Acta Part B At. Spectrosc. 2010, 65, 744–749. [Google Scholar] [CrossRef]
  11. Senesi, G.S.; Romano, R.A.; Marangoni, B.S.; Nicolodelli, G.; Villas-Boas, P.R.; Benites, V.M.; Milori, D.M.B.P. Laser-Induced Breakdown Spectroscopy Associated with Multivariate Analysis Applied to Discriminate Fertilizers of Different Nature. J. Appl. Spectrosc. 2017, 84, 923–928. [Google Scholar] [CrossRef]
  12. Nicolodelli, G.; Cabral, J.; Menegatti, C.R.; Marangoni, B.; Senesi, G.S. Recent advances and future trends in LIBS applications to agricultural materials and their food derivatives: An overview of developments in the last decade (2010–2019). Part I. Soils and fertilizers. TrAC Trends Anal. Chem. 2019, 115, 70–82. [Google Scholar] [CrossRef]
  13. Wei, L.; Ding, Y.; Chen, J.; Yang, L.; Wei, J.; Shi, Y.; Ma, Z.; Wang, Z.; Chen, W.; Zhao, X. Quantitative analysis of fertilizer using laser-induced breakdown spectroscopy combined with random forest algorithm. Front. Chem. 2023, 11, 1123003. [Google Scholar] [CrossRef] [PubMed]
  14. Babos, D.V.; Ramos, J.F.K.; Francisco, G.C.; de Melo Benites, V.; Milori, D.M.B.P. Laser-induced breakdown spectroscopy and digital image data fusion for determination of the Al, Ca, Fe, Mg, and P in mineral fertilizer: Overcome matrix effects in solid direct analysis. J. Opt. Soc. Am. B 2023, 40, 654. [Google Scholar] [CrossRef]
  15. Zhang, B.; Sha, W.; Jiang, Y.; Cui, Z. Quantitative analysis of nitrogen in ammonium phosphate fertilizers using laser-induced breakdown spectroscopy. Appl. Opt. 2019, 58, 3277. [Google Scholar] [CrossRef] [PubMed]
  16. Ren, J.; Zhao, Y.; Yu, K. LIBS in agriculture: A review focusing on revealing nutritional and toxic elements in soil, water, and crops. Comput. Electron. Agric. 2022, 197, 106986. [Google Scholar] [CrossRef]
  17. Cervantes, C. Laser Induced Breakdown Spectroscopy (LIBS) Applied to the Quantification of Elements in Fertilizers [Internet]. 2017. Available online: http://www.teses.usp.br/teses/disponiveis/75/75135/tde-20042017-101150/ (accessed on 2 October 2024).
  18. Aguilera, J.A.; Aragón, C.; Madurga, V.; Manrique, J. Study of matrix effects in laser induced breakdown spectroscopy on metallic samples using plasma characterization by emission spectroscopy. Spectrochim. Acta Part B At. Spectrosc. 2009, 64, 993–998. [Google Scholar] [CrossRef]
  19. Singh, V.K.; Tripathi, D.K.; Deguchi, Y.; Wang, Z. (Eds.) Laser Induced Breakdown Spectroscopy (LIBS); Wiley: Hoboken, NJ, USA, 2023. [Google Scholar] [CrossRef]
  20. NIST Database. Available online: http://physics.nist.gov/PhysRefData/ASD/lines_form.html (accessed on 23 May 2023).
  21. Yang, L.; Zhang, Y.; Li, Y.; Qin, L.; Dong, J.; Ji, F.; Wei, Y.; Chang, S.; Lu, R. Enhancement of LIBS plasma and efficient collection of emitted light by open smooth triangular cavities. J. Anal. At. Spectrom. 2023, 38, 1182–1191. [Google Scholar] [CrossRef]
  22. Lin, J.; Yang, J.; Huang, Y.; Lin, X. A study of the temperature variation effect in a steel sample for rapid analysis using LIBS. Opt. Laser Technol. 2022, 147, 107707. [Google Scholar] [CrossRef]
  23. Hooker, A.; Greene, C.H.; Clark, W. Classical examination of the Stark effect in hydrogen. Phys. Rev. A 1997, 55, 4609–4612. [Google Scholar] [CrossRef]
  24. Currie, L.A. Limits for qualitative detection and quantitative determination. Application to radiochemistry. Anal. Chem. 1968, 40, 586–593. [Google Scholar] [CrossRef]
Figure 1. K I emission line at 693.88 nm and the fit of the area under the peak. (a) and Lorentzian asymmetrical fit used to extract the corrected peak area (b). Reuse of the figure authorized by Cesar Cervantes [17].
Minerals 14 01109 g001
Figure 2. Example of area normalization using K I emission line at 693.88 nm. The emission line used to determine the area of the peak (A1) and that below it (A2).
Minerals 14 01109 g002
Figure 3. Pearson correlation analysis between K pixel intensity and FAAS reference data. Reuse of the figure authorized by Cesar Cervantes [17].
Minerals 14 01109 g003
Figure 4. Emission peaks related to the elements Mn, Mg, Ca, and, K.
Minerals 14 01109 g004
Figure 5. Calibration curves for K, Ca, Mg, and Mn. Reuse of the figure authorized by Cesar Cervantes [17].
Minerals 14 01109 g005
Figure 6. Cross-validation error analysis for K, Ca, Mg, and Mn. Reuse of the figure authorized by Cesar Cervantes [17].
Minerals 14 01109 g006
Table 1. Emission lines chosen and their spectroscopic parameters.
Elements/IonEmission Line (nm)Atomic Transition Probabilities (s−1)Upper Level Energy (eV)
K I693.884.956 × 1063.403
Ca I610.279.600 × 1063.910
Mn II256.302.170 × 1088.250
Mg I285.204.910 × 1084.346
Table 2. LOD values of calibration curves for K, Ca, Mg, and Mn.
ElementsLIBS-FAAS LOD (mg/kg)
K66
Ca35
Mg5.4
Mn0.8
Disclaimer/Publisher’s Note: The statements, opinions and data contained in all publications are solely those of the individual author(s) and contributor(s) and not of MDPI and/or the editor(s). MDPI and/or the editor(s) disclaim responsibility for any injury to people or property resulting from any ideas, methods, instructions or products referred to in the content.

