Article

Estimation of Geotechnical Parameters for Coal Exploration from Quasi-3D Electrical Resistivity Measurements

Department of Geology and Geophysics, Indian Institute of Technology, Kharagpur 721302, West Bengal, India
*
Author to whom correspondence should be addressed.
Minerals 2024, 14(1), 102; https://doi.org/10.3390/min14010102
Submission received: 7 October 2023 / Revised: 10 January 2024 / Accepted: 10 January 2024 / Published: 17 January 2024

Abstract

:
Geotechnical parameters are crucial for mine planning and operation at different stages of development. However, estimating these parameters requires a large number of boreholes and subsequent detailed analysis of the samples, making it a cumbersome exercise. Moreover, even after conducting these studies, it is not possible to cover the entire operational area. To address this issue, this study presents an indirect method of estimating geotechnical parameters through mathematical relations using resistivity data. The present study incorporated 2D and 3D subsurface imaging techniques for exploring coal reserves and analyzing geotechnical parameters that define subsurface soil properties. Electrical resistivity tomography (ERT) was utilized for data acquisition, employing a Dipole–dipole array with a multielectrode ABEM Terrameter LS instrument. Six parallel profiles were conducted, each 400 m in length, with an inter-electrode spacing of 10 m and a spacing of 50 m between profiles. These profiles were combined into a 3D dataset referred to as quasi-3D ERT. The inversion process for both 2D and 3D data was performed using the Res2dinv and Res3dinv programs, respectively. This study overcame the challenges of 2D resistivity sections by evaluating horizontal depth slices in the x-z plane from layers 1 to 10, reaching a depth of 81.2 m. The geotechnical parameters, including cohesion, friction angle, moisture content, and plastic index, were derived from the resistivity data. The ERT method proved to be cost-effective and efficient in determining soil properties over a large area compared with traditional laboratory analysis of borehole samples. Additionally, the variation of geotechnical parameters with resistivity values exhibited unique characteristics. The results from both the 2D and quasi-3D ERT were well correlated with the borehole data. Such studies are valuable for resource exploration and mine planning purposes.

1. Introduction

Coal is formed from decomposed plants and trees buried under the Earth’s subsurface millions of years ago, making it an organic sedimentary rock [1]. The extraction of coal is a non-renewable process, and burning coal plays a substantial role in exacerbating climate change by emitting carbon dioxide, a potent greenhouse gas that plays a pivotal role in the escalation of global warming. However, coal is a valuable global energy resource in alleviating energy poverty in developing countries. Economic empowerment through energy sources is the only way to end energy poverty while reducing emissions to address the climate issue. Developed countries rely less on fossil fuels for power generation, while emerging countries should limit the production and consumption of fossil fuels. In India, coal accounts for 55% of the country’s energy needs, making coal production essential for economic growth and development [2]. It contributes to over a third of global electricity generation [3].
The present study uses quasi-3D ERT (Electrical Resistivity Tomography), an electrical geophysical method, to explore coal reserves and analyze subsurface soil properties in three dimensions. The primary applications of quasi-3D ERT include groundwater exploration [4,5,6,7], mineral exploration [8,9,10], environmental studies [11,12,13], and civil engineering constructions [14,15,16,17]. Civil engineering constructions, such as bridges, buildings, dams, embankments, highways, tunnels, and towers, necessitate investigations on subsurface soil properties. Assessing soil’s in situ strength properties is crucial for various geotechnical and civil engineering applications. Numerous instruments and methods are employed for this purpose, each offering specific insights into soil behavior [18,19,20,21,22,23,24,25,26,27]. Accurate information about soil properties typically entails high-resolution drilling data, which can be expensive, time-consuming, and labor-intensive. As an alternative to borehole drilling data, Electrical Resistivity Tomography (ERT) data can be employed. ERT is a cost-effective, non-destructive, non-invasive, and environmentally friendly method for characterizing the subsurface structures.
ERT enables the simultaneous collection of multiple readings. During data collection, an electrical current is applied to the soil through a pair of current electrodes, while the potential electrodes measure the resulting potential differences between a pair or a series of electrodes. These potential differences provide valuable information about the electrical properties of the subsurface materials. Using ERT data, the actual subsurface resistivity distribution is interpreted, and geological structures are delineated based on resistivity changes. The depth of the investigation in ERT depends on various factors, such as the spacing between the current electrodes and the lithology of the subsurface layers [28]. A conductive surface layer will limit the depth of investigation. Nonetheless, the electrical resistivity method remains a powerful tool for subsurface investigation, as it allows for the efficient estimation of the subsurface characteristics of soils and rocks, through empirical relationships between resistivity and geotechnical parameters. ERT is a cost-effective, efficient data collection and non-destructive technique allowing for the assessment of subsurface conditions without disturbing the soil or rock layers. It can also be advantageous for site investigations and environmental studies, apart from conventional mineral and groundwater investigations.
The advantage of ERT is its ability to provide information about subsurface conditions at various depths in real-time data recording. Different electrode configurations/arrays can be used to investigate different depths, making it versatile for various applications. The method can provide a relatively high resolution to detect changes in subsurface resistivity. It allows for identifying geological features, such as faults, fractures, and changes in lithology. The electrical resistivity method is non-invasive and does not require drilling or excavation. Electrical resistivity surveys can be conducted in various environments, including land, water, and boreholes. This versatility makes it applicable to various geological and environmental studies. Despite the many advantages of ERT, there are some disadvantages as well. For example, interpreting electrical resistivity data can be complex, as the resistivity values depend on the type of material and its saturation. Calibration with additional information (e.g., borehole data) is often necessary to interpret the results accurately. The depth of investigation is influenced by factors such as electrode spacing, array configuration, and moisture content [29]. In some cases, the method may have limitations in penetrating greater depths, especially in areas with high conductivity. Surface conditions, such as conductive structures or infrastructure (e.g., metal pipes), can influence the measurements. A change in the degree of compaction affects resistivity measurements for the same soil type, electrode spacing, and soil moisture content [30]. The relationship between salinity and resistivity is inversely proportional; an elevation in pore water salinity significantly decreases resistivity [31].
The previous study [32] observed that 3D ERT using a Dipole–dipole array provides better results compared with other electrode configurations in lateritic terrain. In the current work, the effectiveness of the 3D inversion result of ERT data using a Dipole–dipole array is evaluated. Further, an established mathematical relationship in [33] is used between resistivity and geotechnical parameters to determine cohesion, moisture content, friction angle, and plastic index using regression analysis. Regression analysis is a general method to establish the relationship between two or more variables [34]. The proposed methodology does not account for the impact of the mineral content of the soil; the study is restricted to the soil in tropical areas and is not suited to rocks of all kinds. Geophysical exploration technologies have been applied to geotechnical engineering problems since their inception; however, the results may not always meet engineers’ expectations. A lot of successful case histories are needed to establish the use of geophysical technologies in engineering practice.
This study will help geotechnical engineers to quickly determine the suitability of a site during soil research work. This study uses an innovative approach to transform resistivity obtained from ERT measurement in geotechnical parameters, such as cohesion, plastic index, friction angle, and moisture content. Cohesion refers to the intermolecular force of attraction between molecules of the same substance. It acts over a short range and varies in magnitude with lithology. The shear strength of the sliding surface can be expressed by cohesion and the friction angle. The moisture content affects the physical properties of the soil, including resistivity, viscosity, weight, and density. Determining the plasticity index and the liquid limit helps to understand the consistency or plasticity of the clay [35]. Based on the ERT and geotechnical parameters computed from ERT data, this study aims to image the potential coal seam zone and soil properties. Interpretation of the inverted resistivity images is based on resistivity contrast and correlation with borehole data. The borehole is located less than 400 m, which is a significant distance to change the geology from the ERT site. The borehole data was obtained through personal communication with Coal India.

2. Geology of the Study Area

The study area, Salanpur, West Bengal, India (Figure 1), is an extended part of the Chotanagpur plateau and belongs to the Damuda age group [36] under the Panchet/Pachmari formation. Salanpur is bounded by latitude 23°44′0″ N to 23°54′0″ N and longitude 86°46′0″ E to 87°2′0″ E [37]. The average altitude of the area is 100.6 m above the mean sea level. The Panchet/Pachmari formation mainly comprises thick beds of coarse felspathic and micaceous sandstones, generally white or greenish white, with minor spots of red clay. Granite intrusions influence the Chotanagpur plateau from the east to the west [38].
The Barakar and Raniganj formations of the Permian age are in the north and west surrounding the area. Laterite deposits are found in the Panchet formation north and south of the Damodar River. The stratigraphic symbols of geology are indicated in Figure 1. The Talchir formations are in the northwest portion of this region and consist of a boulder bed overlain by shale and sandstone. The Barakar formations occupy the northern part and consist of massive sandstone with shale and carbonaceous bands with many workable seams. Coal deposition was developed mainly in the Gondwana system in the west Bardhaman district, where coal deposits are prominent, which promotes coal mining activities. The Raniganj formations extend as a wide belt in the western region and the eastern part of the coalfield, and Igneous intrusions are common in the Raniganj formation. The series comprises greyish fine-grained sandstone, carbonaceous shale, and extensive coal seams.

3. Materials and Methods

3.1. Data Acquisition

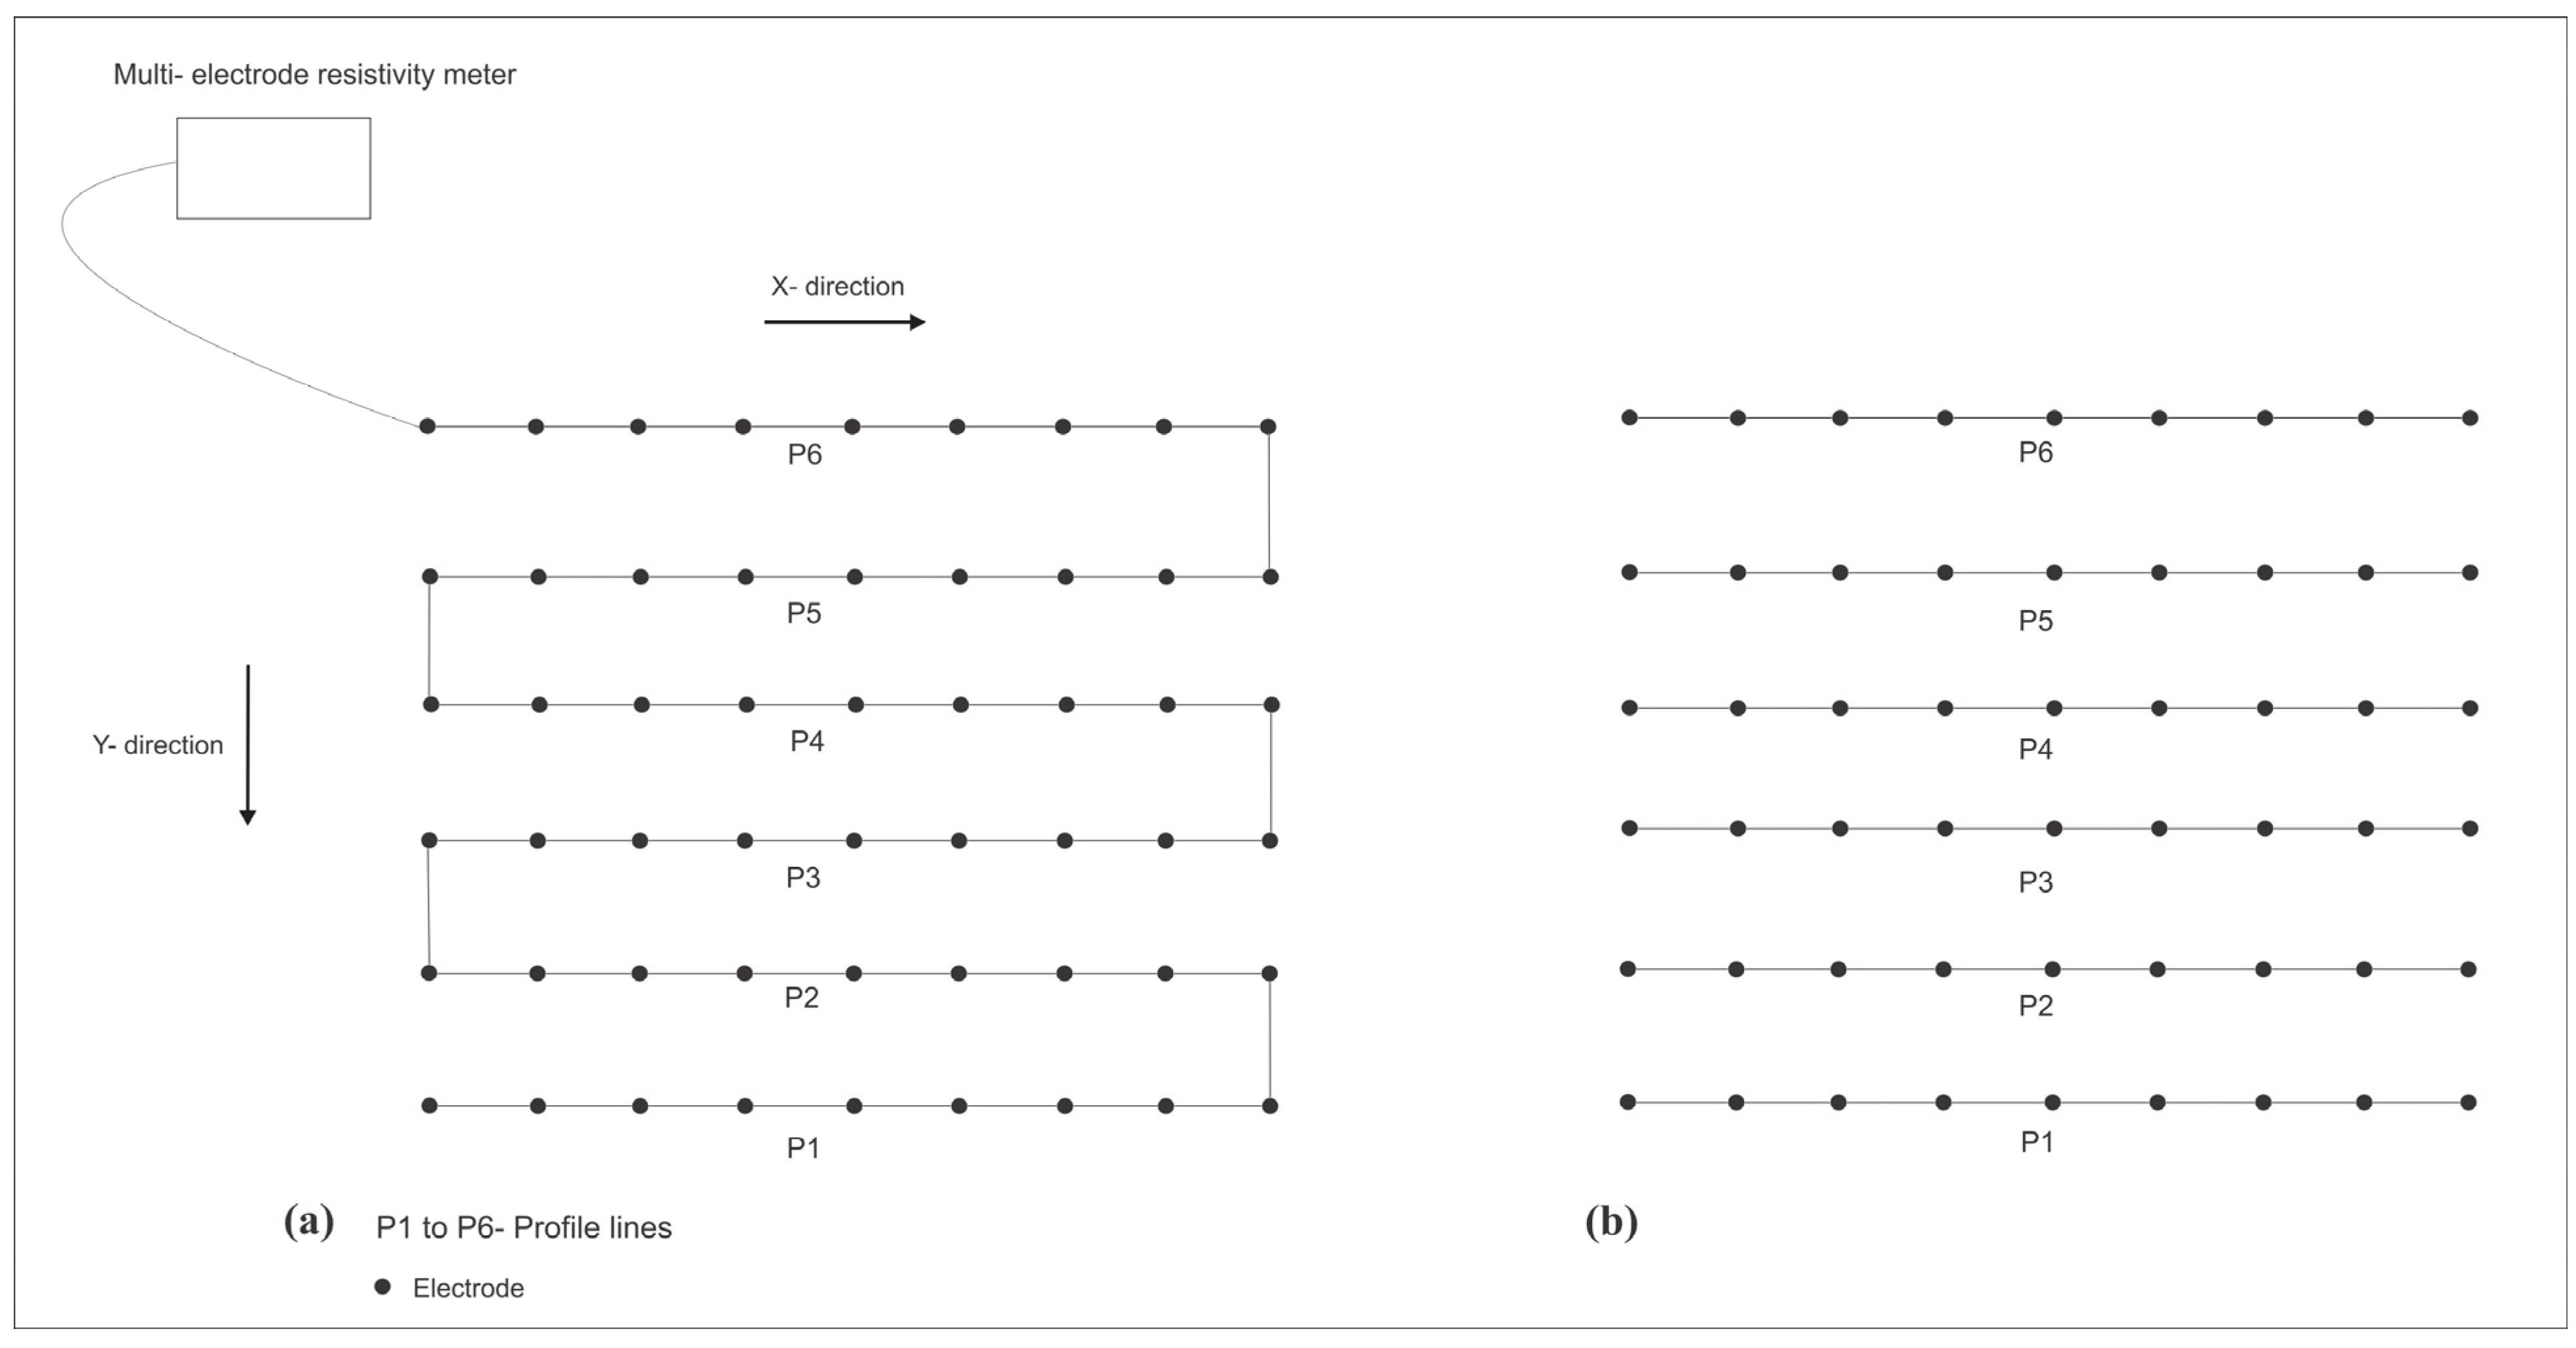
This work involved acquiring, processing, and interpreting 2D and quasi-3D ERT data to image the subsurface in 2D and 3D. An ABEM Terrameter LS multielectrode imaging instrument was used for data acquisition. The instrument setup included two winches with 200-m-long cables, a 12-volt battery, 41 electrodes, 42 connectors, and a measurement tape. Figure 2 shows the standard layout for 3D and quasi-3D ERT. The design used in this study, shown in Figure 2b, consists of six parallel profiles (P1 to P6), covering an area of 400 m × 250 m in the west–east direction. The starting points of the lines are S1 to S6, and the ending points are E1 to E6. Each profile is 400 m long, with 41 electrodes spaced 10 m apart. The spacing between each traverse line is 50 m.
Several factors can affect the results of an electrical resistivity survey, e.g., porosity and saturation, mineral composition, electrolyte concentration, geological heterogeneity, electrode contact quality, instrument calibration, and cultural noise. Fluids, such as water with salt and chemicals, conduct electricity, so a higher water saturation decreases resistivity. Conversely, dry or poorly saturated materials have higher resistivities. The mineral composition of the subsurface materials can significantly impact the resistivity measurements. For example, metals are good conductors, while certain rocks, like sandstone and coal, have higher resistivities. Geological heterogeneity, such as the presence of different rock layers or structures, can lead to variations in resistivity. An understanding of the geological setting is crucial for interpreting resistivity data accurately. The quality of contact between electrodes and the ground is critical; poor contact can introduce errors in resistivity measurements and lead to poor data quality. Careful electrode placement and ensuring good contact are essential to record reliable data. Proper calibration of the resistivity measurement equipment is important for accurate data interpretation. Electrical resistivity surveys can be affected by anthropogenic factors, such as nearby power lines, metal structures, or other sources of electrical interference. These external influences may introduce noise into the data. We looked through all these factors carefully during the acquisition and interpretation of the ERT data.

3.2. Data Processing

The ERT data were processed using the Res2dinv ver. 3.71 and Res3dinv ver. 3.14, of Geotomo software, Malaysia to obtain 2D and 3D models of the site. The first step in processing the ERT data was to remove the bad data points and negative apparent resistivity values before inverting the actual field data set. Bad data points can be caused by poor ground contact of electrodes, a break in the cable, or a telluric current that affects all the readings. Negative apparent resistivity can be caused by asymmetric electrode configurations [39,40,41] and negative potential differences. During the processing of the ERT data using the Res2dinv software, there was an option to exterminate bad data points. Here, bad data points were identified by abrupt changes (very low or very high) in apparent resistivity that might indicate errors.
The Res2dinv and Res3dinv programs allow the robust/blocky (L1 norm) inversion. This method is ideal for sharp boundaries, as it minimizes the absolute difference between measured and calculated apparent resistivity values through an iterative process [42]. The inversion of apparent resistivity data was performed using the L1-norm regularization inversion technique, where accuracy is expressed in terms of absolute error [43]. Mathematical formulations and geophysical literature of L1-norm and L2-norm are discussed in previous studies [42,44,45].

3.3. Correlation and Regression Equations

The estimation of geotechnical parameters, including cohesion, plastic index, moisture content, and friction angle, was calculated from the inverted resistivity data using Equations (1)–(4). The MATLAB software program, version 2022, was used to plot the geotechnical results. Equations (1)–(4) were deduced by the laboratory tests of undisturbed samples collected after drilling for selected soil properties [33]. Geotechnical parameters and resistivity values of soil samples were determined in the laboratory from various samples to deduce these equations. A correlation analysis was performed to establish the relationship between the two variables. Microsoft Excel was used to perform the correlation and regression analysis. The Pearson method calculated the coefficient of determination in the correlation and regression equations. Electrical resistivity values used in equations were extracted from inverted ERT data.
C = 3 e 0.5   r s 2 + 0.0918   r s + 21.544
P I = 2.71 l n ( r s ) + 29.793
W = 123.93   r s 0.252
F = 4.7036 × l n   r s + 6.6297
C = Cohesion, PI = Plastic index, W = Moisture content, F = Angle of friction, rs = Inverted resistivity. Here, the cohesion is calculated in kPa (Kilopascal), the friction angle in ϕ (degree), and the plastic index and moisture content in % (percentage).

4. Results and Discussion

4.1. Geophysical Study

Previous studies [46,47,48] performed near the present study area employed electrical resistivity imaging methods to define the coal seams and subterranean voids. [49,50,51,52,53] are some of the previous research works that used resistivity methods for coal exploration and coal mine workings.
This study uses only the first five ERT profiles for 2D electrical sections to compare the electrical sections and interpret the anomalous features [54]. Data from all six ERT profiles were used for 3D inversion to calculate the resistivity distribution in the three dimensions and allow for better interpretation of the anomalies. The number of data points was reduced because some of the noisy data points were eliminated from the data set. The maximum number of data points was 344 for profile 2; however, the minimum number of data points was 332 for profile 1, and the number of datum levels (i.e., the levels of the data points with respect to depth) for each 2D ERT was 12. Even though the electrodes were placed at 10 m intervals, the signals (potential differences) are influenced by smaller structures in the subsurface. Therefore, we used a 5 m grid in the zone of interest to model the subsurface structure. This spacing appropriately correlated to the smaller structures in the x- and z-direction. Since the change in electrode spacing on the surface in a geometrical manner increased the investigation depth in an arithmetic manner, a 10 m spacing on the surface showed the finer structures at depth. Therefore, mesh size in the z-direction was considered smaller to delineate the finer structure. Hence, a 2.5 m resolution in the z-direction was obtained by 10 m electrode spacing on the surface.
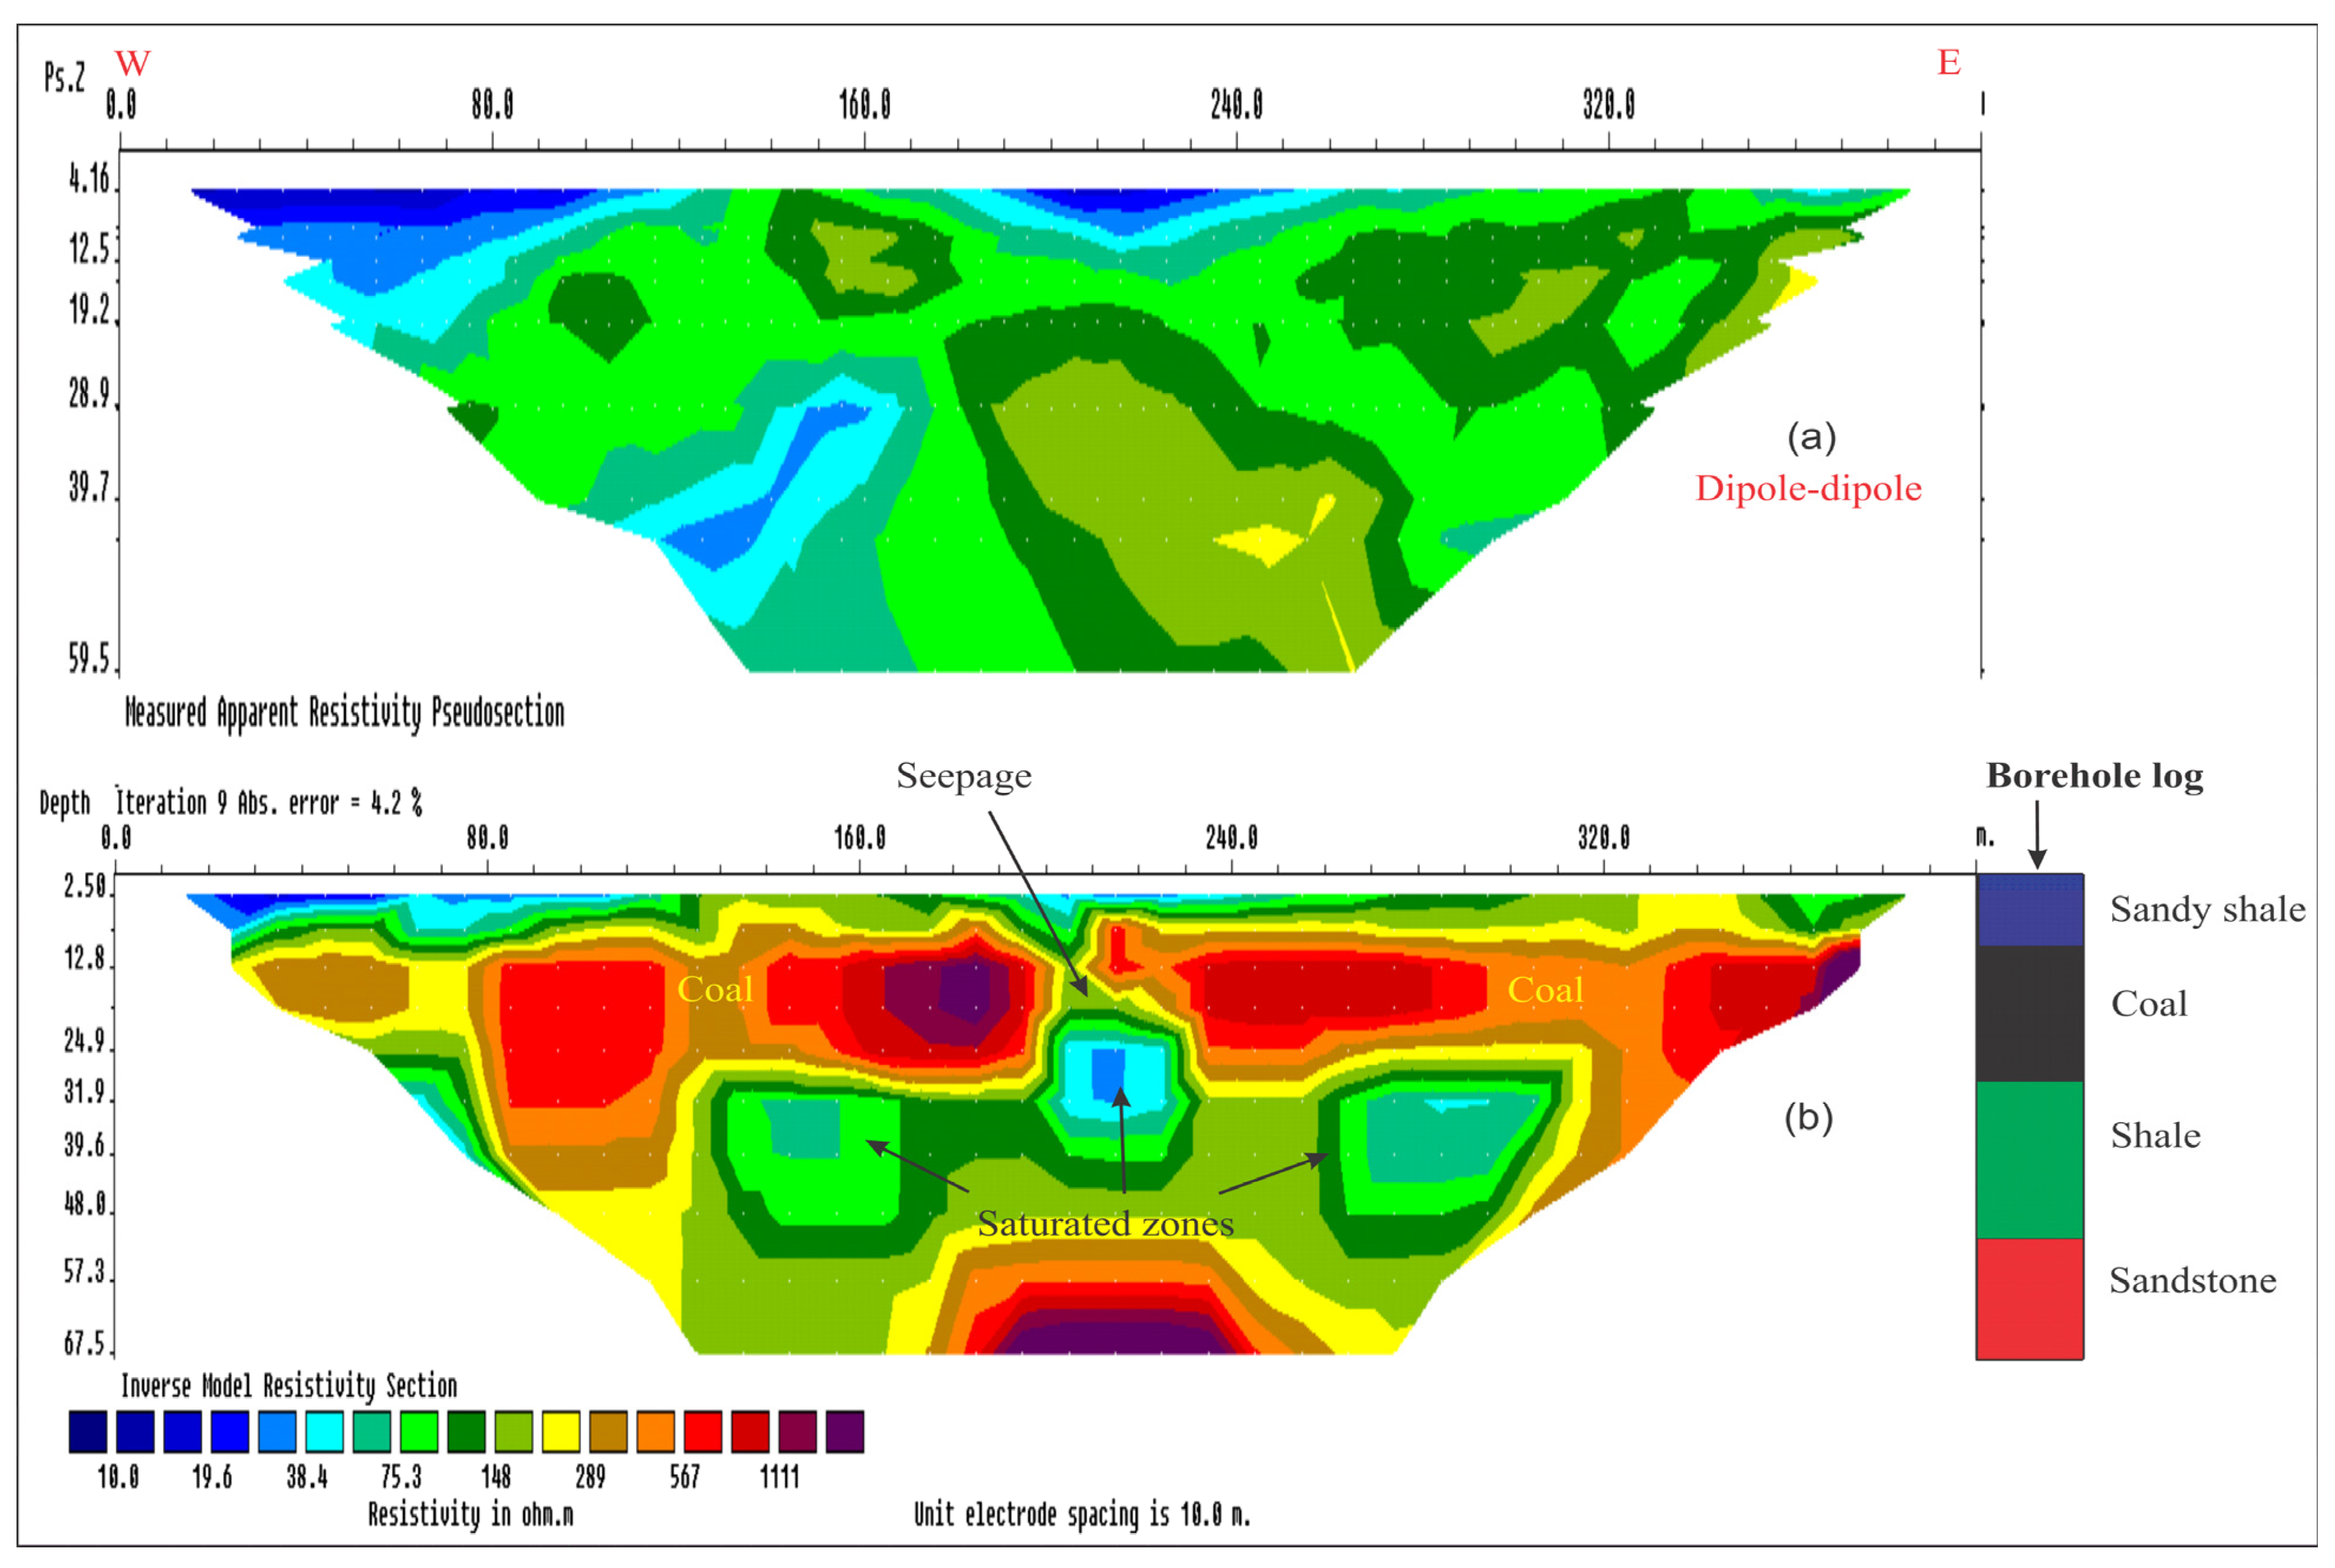
Borehole data shown in Figure 3 to correlate the results. The pseudosection of profile 1, acquired using a Dipole–dipole array from west to east and an inverse model of the same profile, is shown in Figure 4a and Figure 4b, respectively. The depth of investigation is approximately 67 m. The high resistivity of coal seams and low resistivity of saturated zones are well distinguished in the inverse model. Coal seams were observed at a depth of approximately 12 m. The dimensions of coal seams on the western and eastern sides of the profile were approximately 120 × 19 square meters and 170 × 20 square meters, respectively. The resistivity of the coal seam was more than 500 Ωm. Three saturated zones had resistivity values less than 80 Ωm, which could be due to water seepage beneath the coal seam. It was observed that water percolated through the gap between the coal seams, then moved laterally to the left and right sides of the profile. The opening in the coal layer was predicted to be the source of the saturated zone in the shale matrix of resistivity less than 200 Ωm, below a depth of 24 m. The interpreted signatures of anomalies in Figure 4 correlated well with the borehole data.
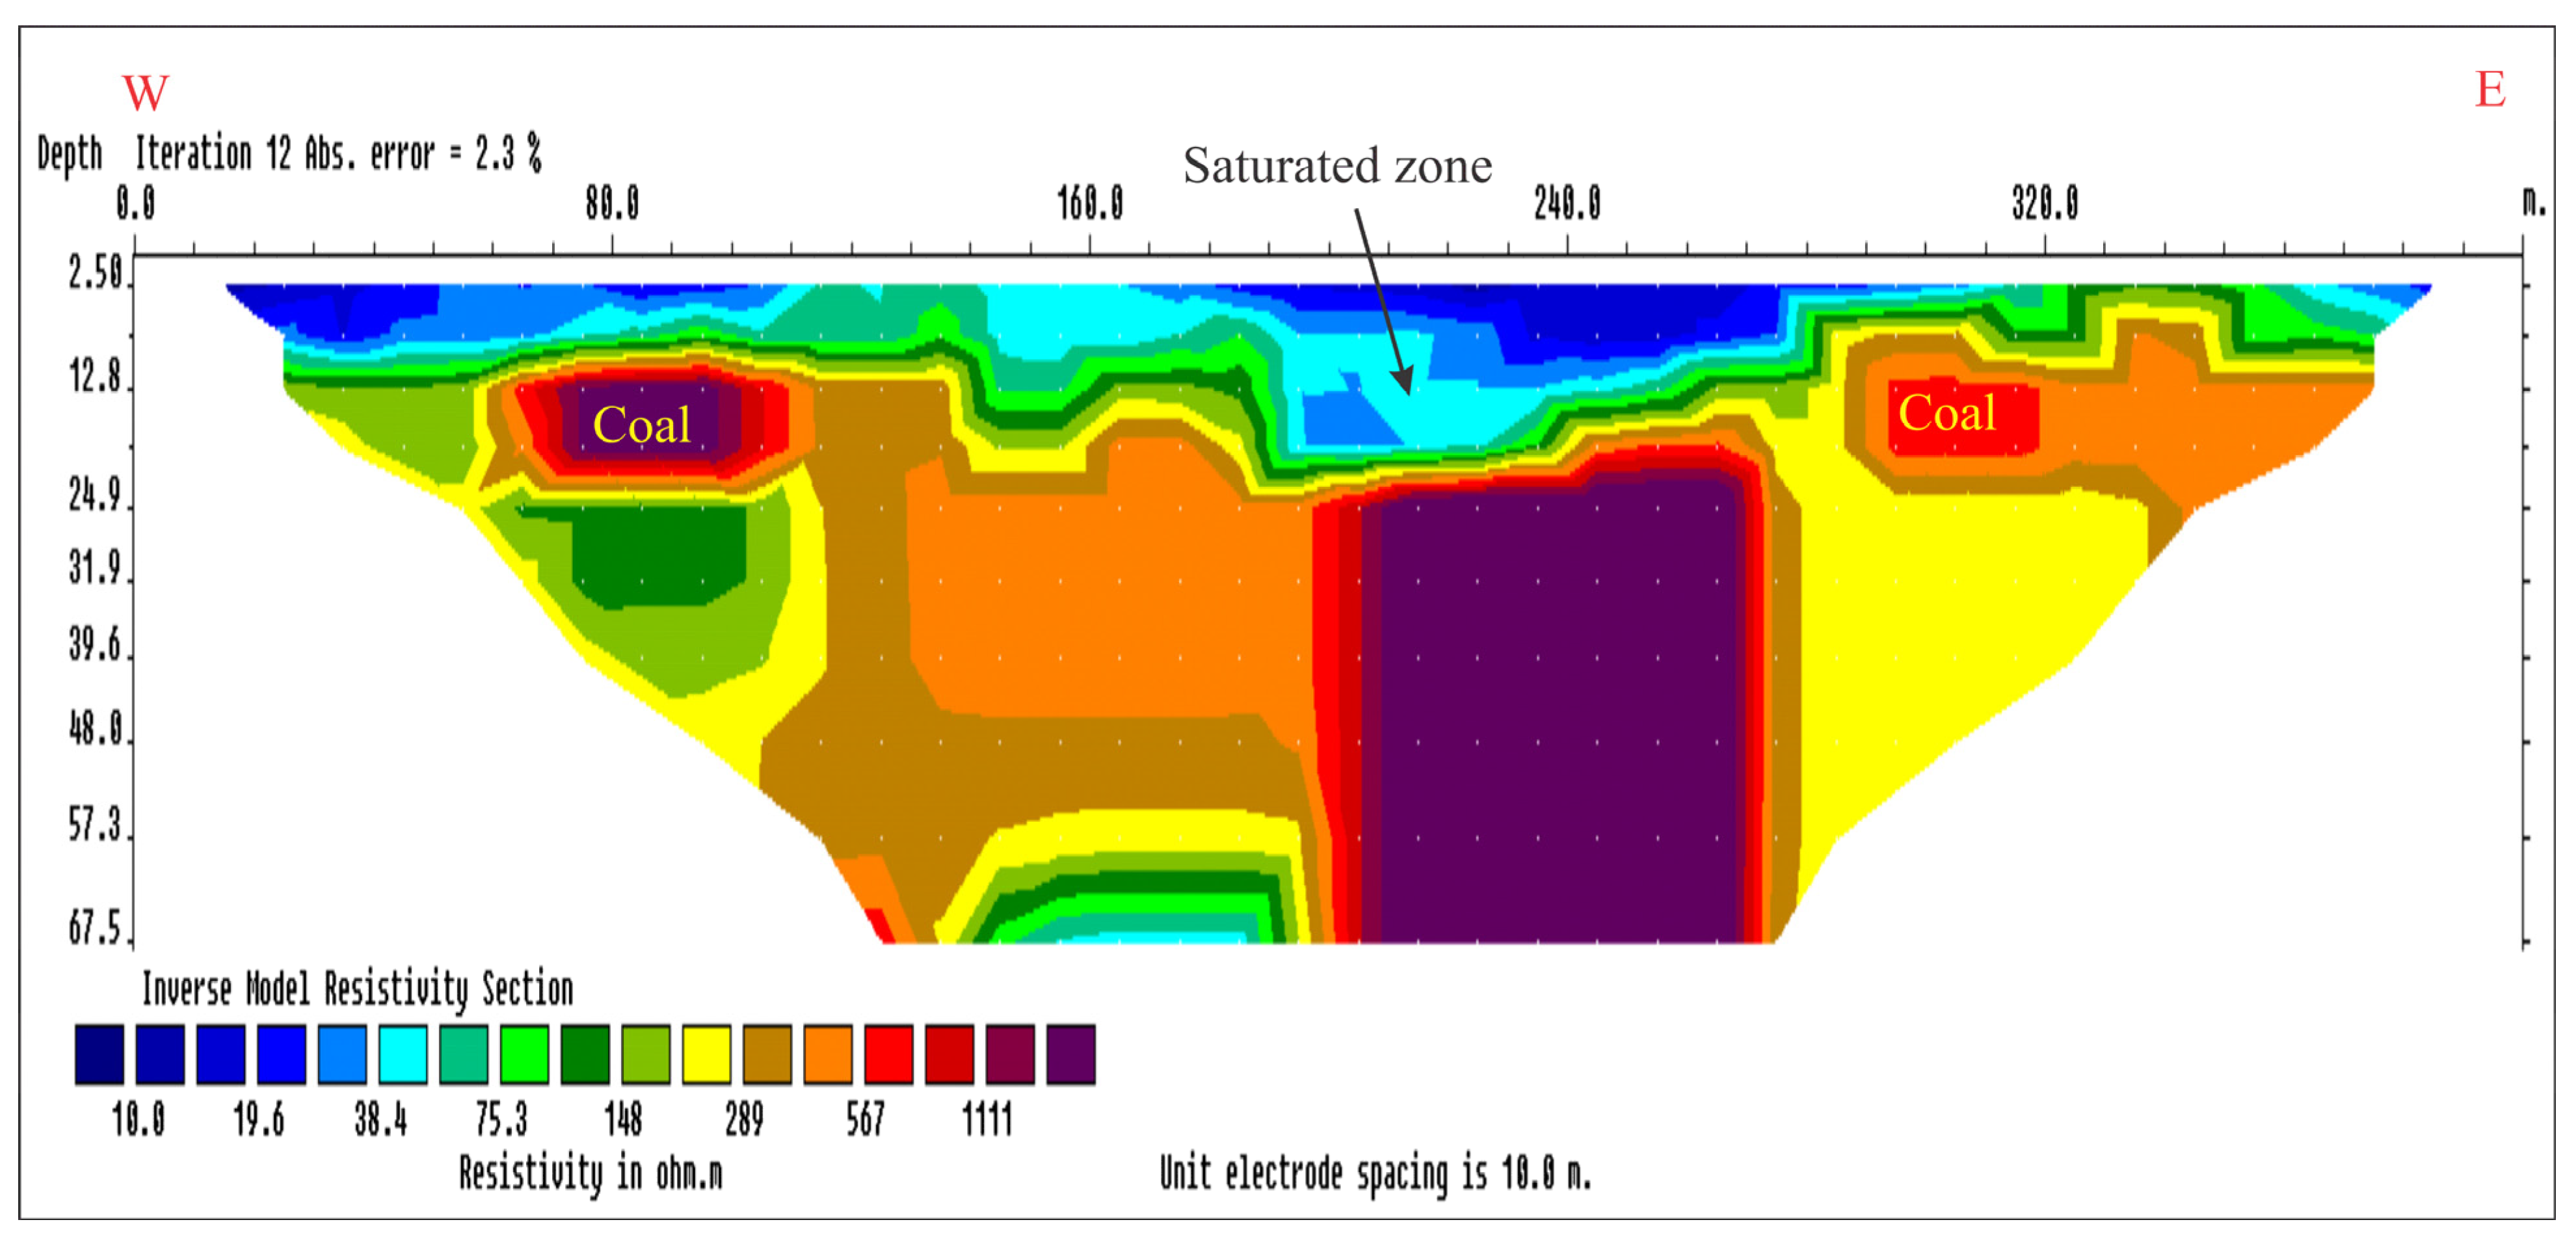
The 2D resistivity inversion model of the second ERT is presented in Figure 5. The result shows a high-resistive coal seam (greater than 567 Ωm) observed on the eastern side of the profile and a less-resistive coal seam (less than 567 Ωm) on the western side of the profile. Coal seams at around 10 m underlie the top saturated layer of variable thickness. The probable source of the saturated zone in the shale matrix of resistivity less than 200 Ωm around a depth of 24 m is a pond near the second ERT. When coal comes in contact with water, its resistivity decreases [55]. The electrical section of profile 2 shows a lower resistivity of the coal, probably because of the saturated coal. Saturated coal in brown color, marked in Figure 5, has a resistivity between 269 and 520 Ωm.
The inversion result of profile 3 (Figure 6) shows that the resistivity value of the top layer is less than 40 Ωm, with lateral variation in thickness and an average thickness of 13 m. The top layer shows low resistivity due to the effect of irrigation water in the field. The resistivity value of the upper layer suggests that it is composed of shale or saturated sandy shale. The top layer overlies the high-resistive coal seam, and the length, thickness, and depth of the coal seam on the western side of the profile are approximately 50 m, 12 m, and 13 m, respectively. The length of the coal seam on the eastern side is more than 90 m, and the thickness and depth are variable. Below the saturated zone, a vertical high-resistive anomaly between 200 and 270 m could be unsaturated coal at a depth of around 24 m.
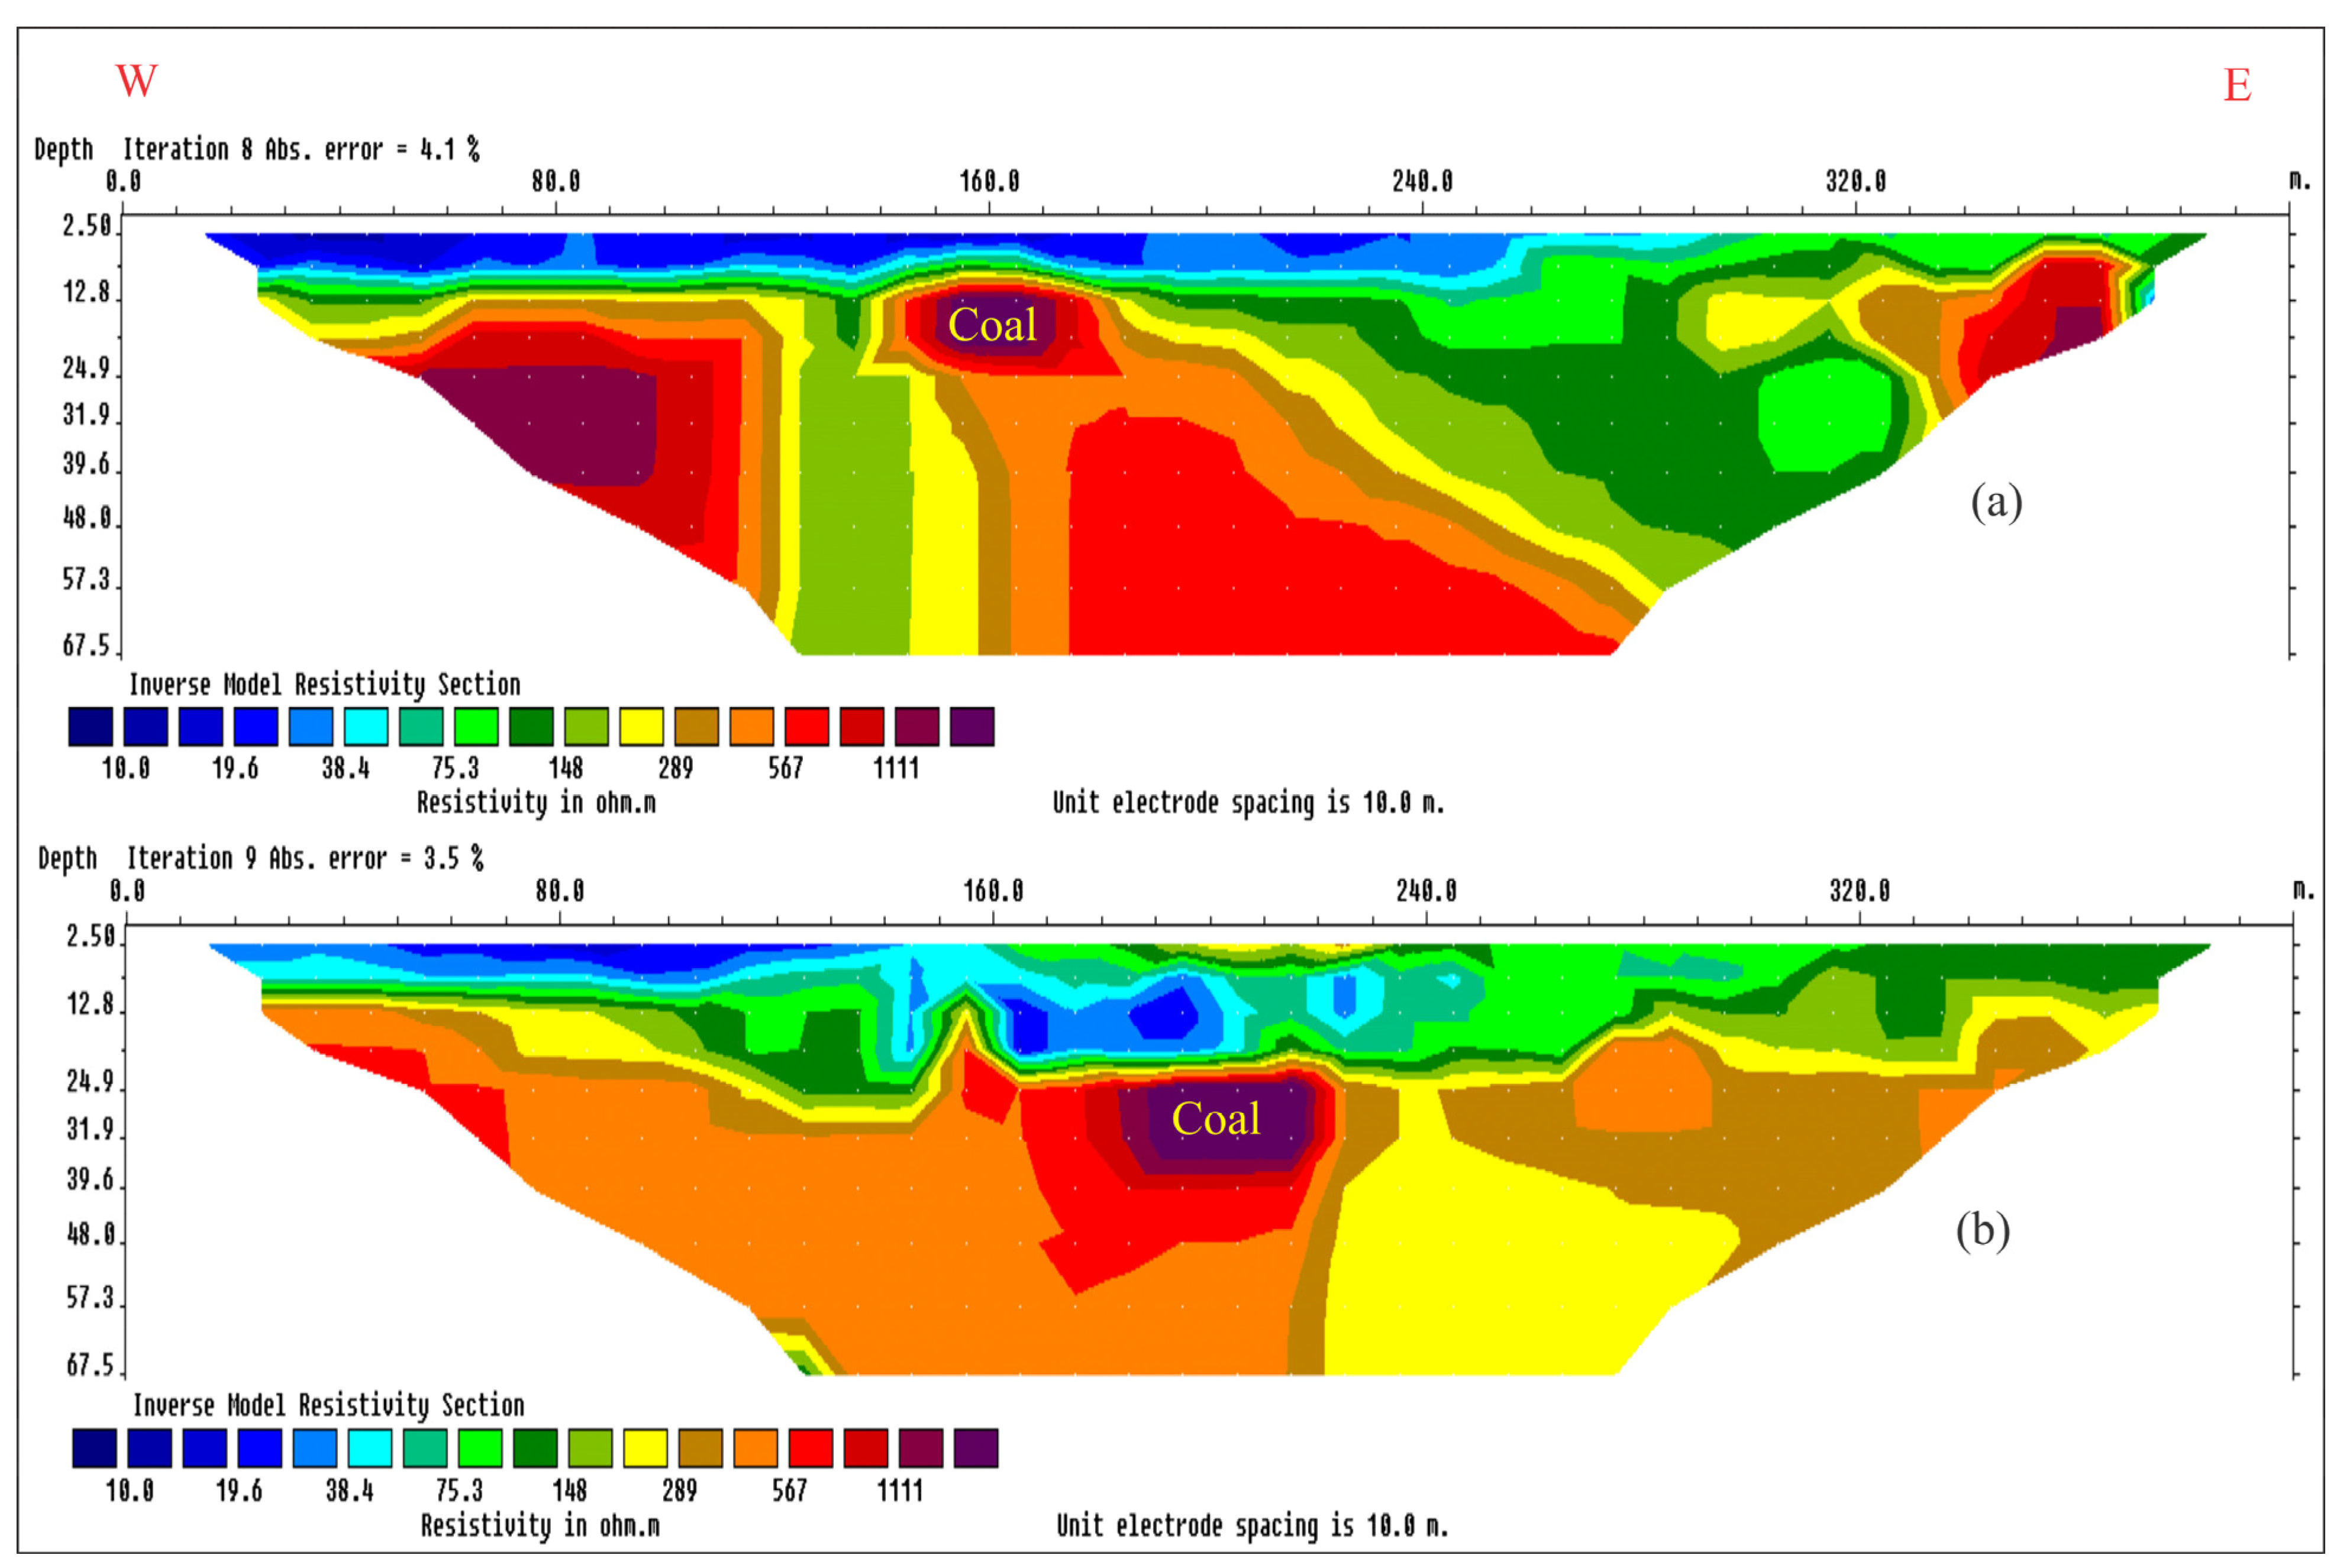
The inverse model in Figure 7a shows three coal seams in the electrical section’s left, center, and right at a depth of around 10 m and resistivity above 500 Ωm, with the intercalated shale of resistivity less than 200 Ωm. The first coal seam extends to 120 m, and the second is 40 m by 15 m in size. The third coal seam on the right side of the profile continues from 330 m to beyond 400 m. In Figure 7b, the top layer is of variable thickness, and the maximum thickness is at the center of the profile. This may be due to more loose sediments between 140 and 280 m of shale. The reduction of the salinity of irrigation water with depth may cause a gradual change in resistivity [55]. The coal seam starts at around 20 m depth and is approximately 60 m × 30 m in size, as interpreted at the center of the profile.
All profiles do not have the same amount of noise in the measured data; therefore, to get the convergence, they require different iterations. Moreover, sometimes obtaining the desired low misfit error is unnecessary after executing significant iterations when the data is noisy. We executed the program in many iterations to obtain small misfit errors, which differed for different profiles.
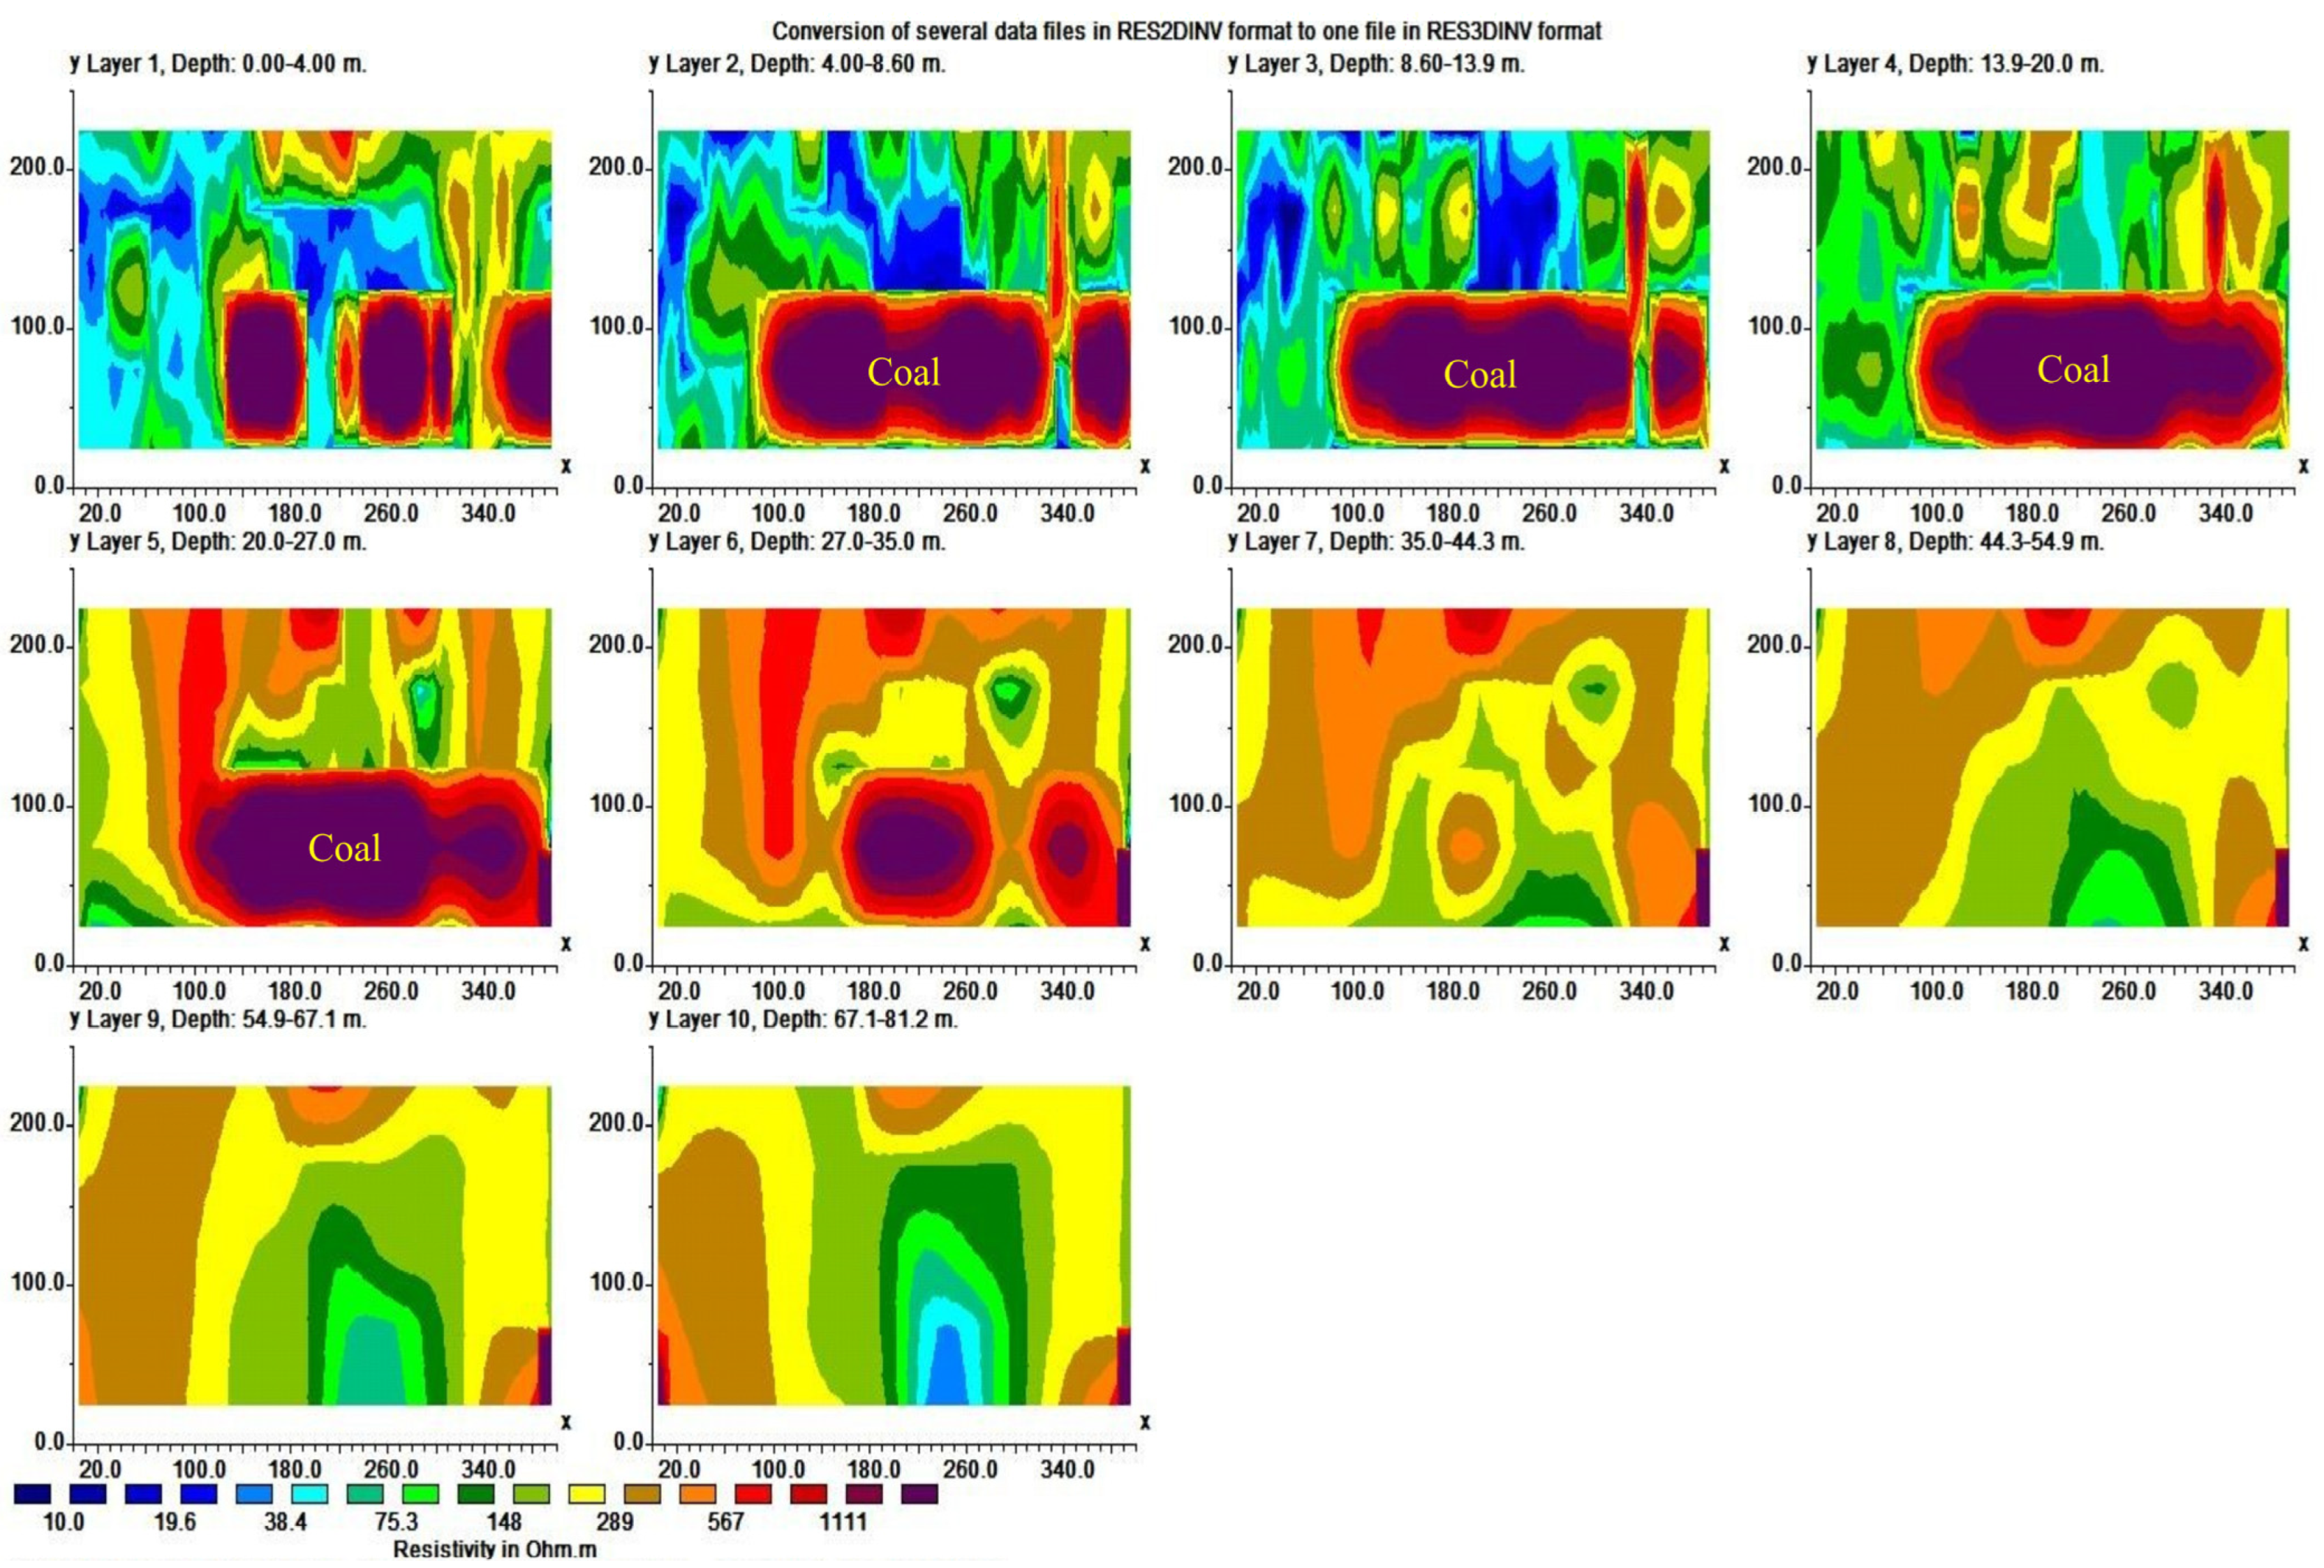
2D ERT is a conventional approach, but a traditional 2D resistivity model may not be sufficiently accurate [56] when resistivity changes rapidly due to the inhomogeneous subsurface in 3D. In such a situation, 3D inversion of ERT data is an advanced geophysical technique that can image the Earth’s subsurface in three dimensions (x, y, and z). Previous studies [57,58] discussed the efficacy of 3D geoelectrical resistivity imaging through the utilization of parallel 2D profiles and the influence of 3D structures on the interpretation process. Figure 8 shows the subsurface resistivity variations along the E-W and N-S directions, obtained using quasi-3D ERT data and its 3D inversion in horizontal depth slices (x-z plane) from layer 1 to layer 10, with a total depth of 81.2 m. These subsurface layers in the z-direction were at depths 0.0 m, 4.0 m, 8.6 m, 13.9 m, 20.0 m, 27.0 m, 35.0 m, 44.3 m, 54.9 m, and 67.1 m, and the corresponding thicknesses of layers was 4.0 m, 4.6 m, 5.3 m, 6.1 m, 7.0 m, 8.0 m, 9.3 m, 10.6 m, 12.2 m, and 14.1 m, respectively. The number of data points in the 3D inversion file was 2055, using 246 electrodes; the number of model blocks was 2000; and the number of nodes in the mesh was 63,344.
Resistivity above 500 Ωm is marked in red and purple from layers 1 to 6 (Figure 8) and is probably coal seams or the intercalation of coal and sandstone. Low resistivity (less than 50 Ωm) in blue from layers 1 to 4 showed conductive signatures probably due to shale, sandy shale, and the water-saturated layer. The thickness of the layers increased gradually with depth, but data density decreased with depth; consequently, model resolution decreased for deeper sections. In 2D electrical sections and 3D depth slices (Figure 8), saturated soil exhibited lower resistivity up to an approximate depth of 13 m.
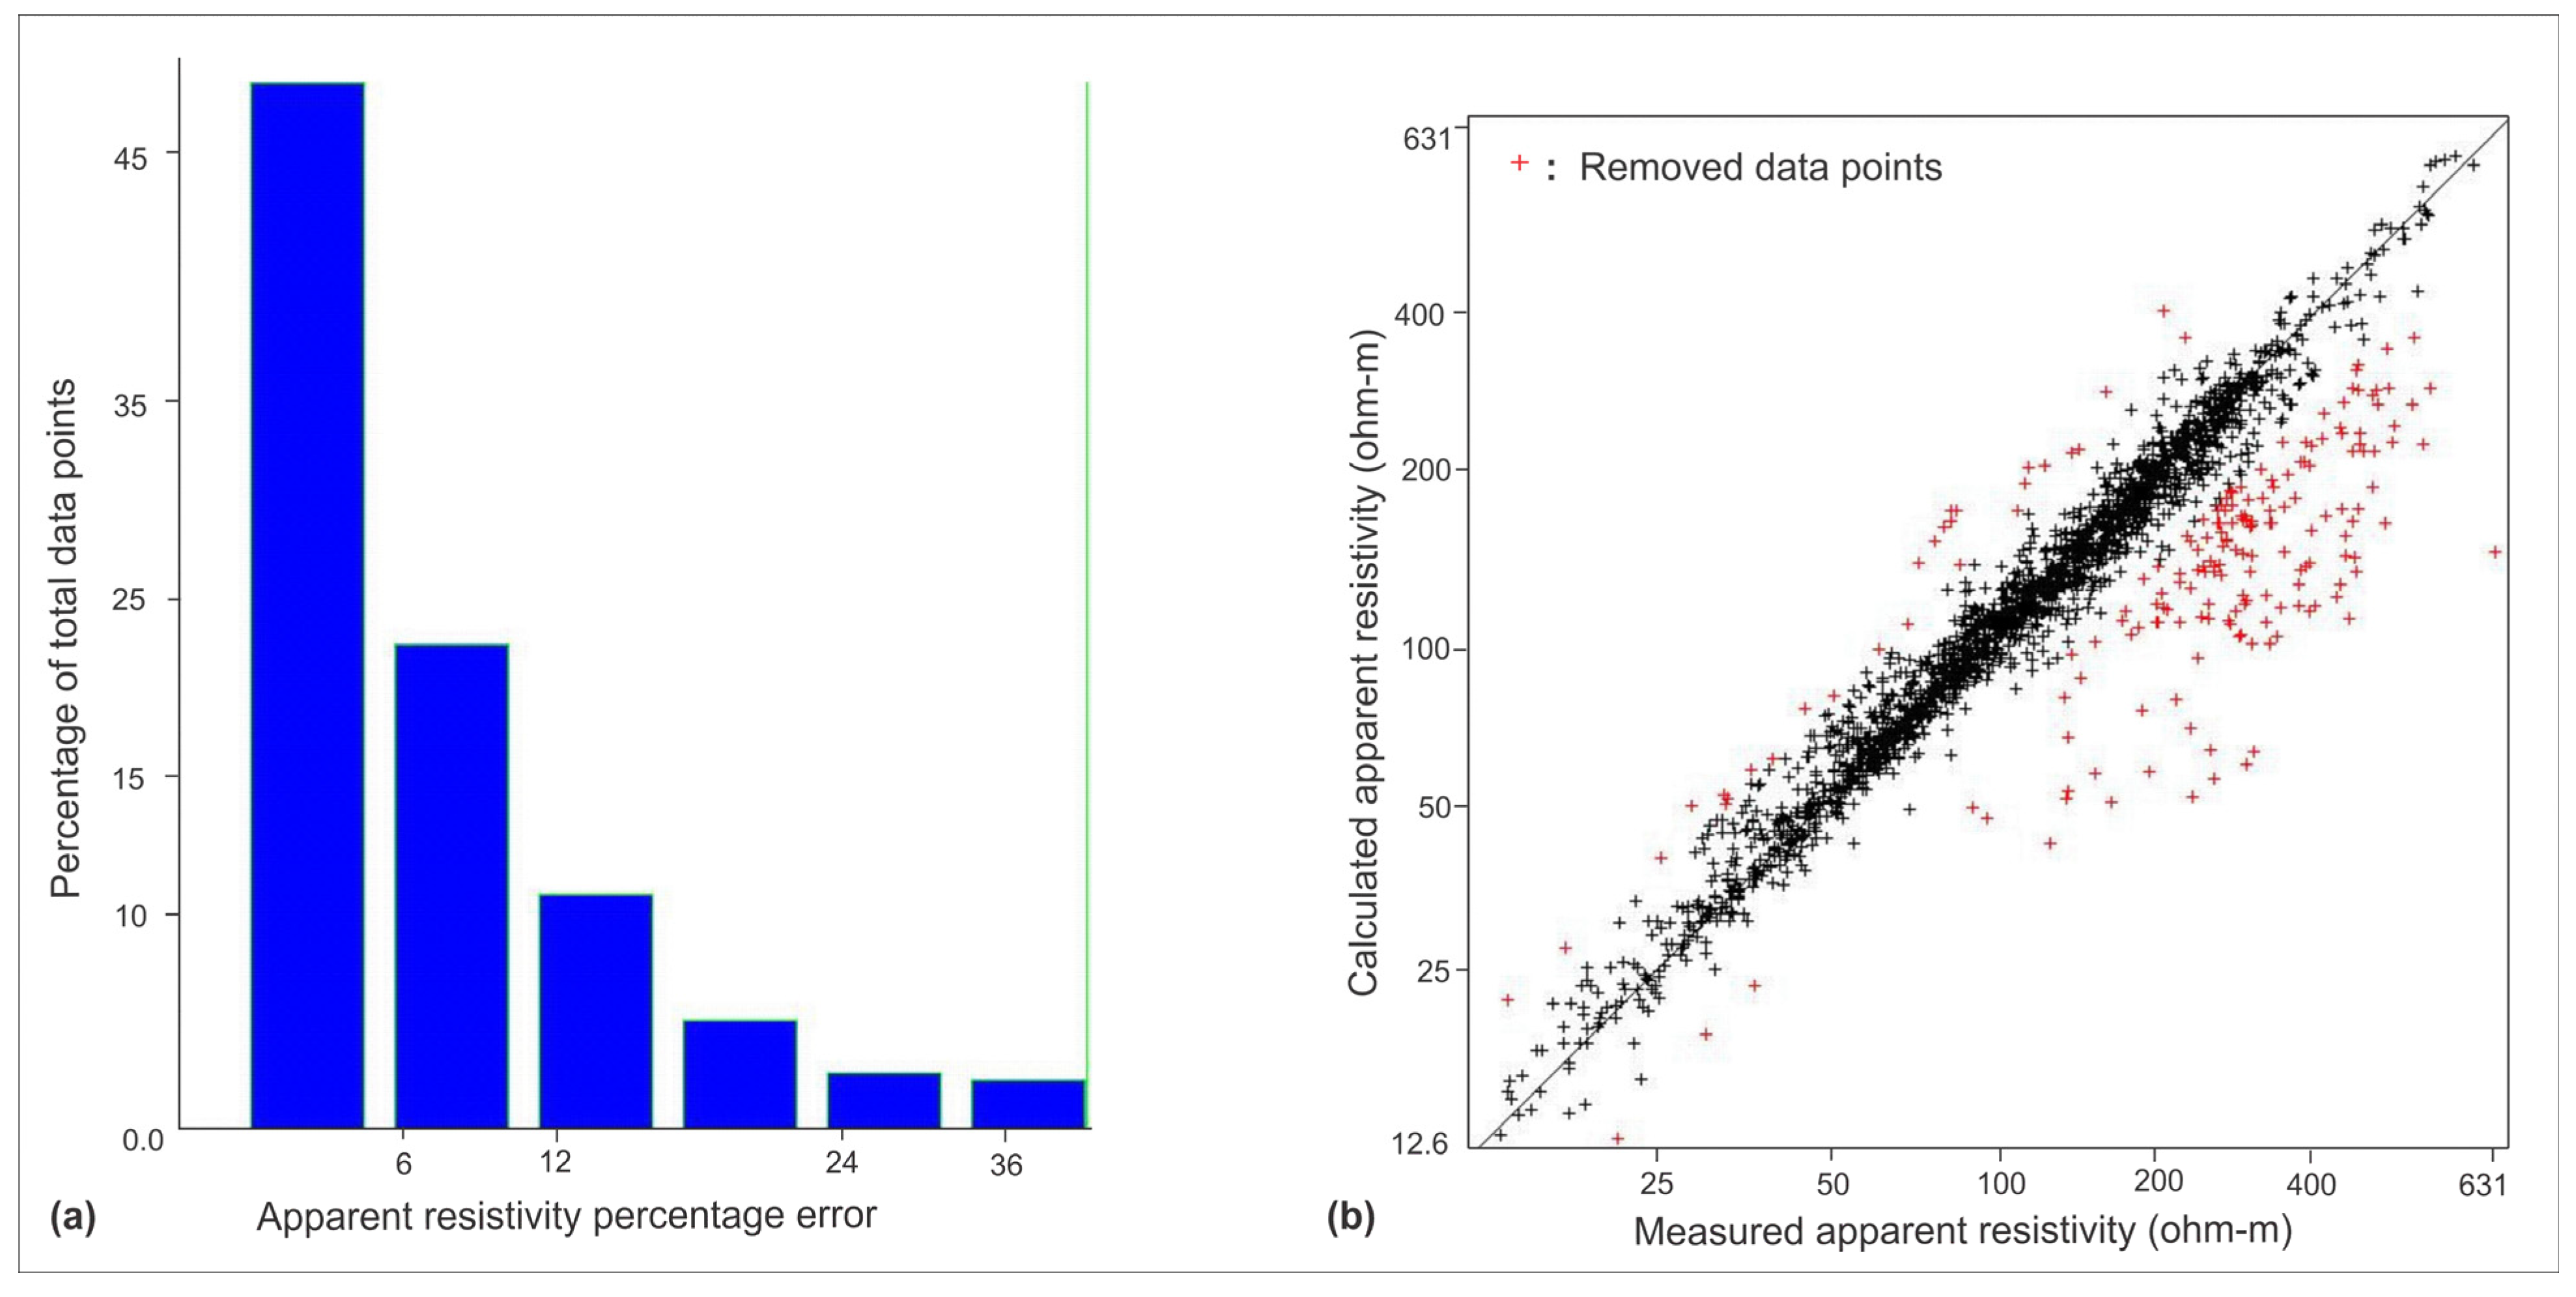
Figure 9a shows the error distribution bar chart for the 3D data set; typically, the highest bar represents the most minor errors, and the heights of the bars gradually decrease with increasing error values. Higher errors are caused by noisy data points, caused by the electrode’s poor contact with the ground. To eliminate undesirable data points from the dataset, we shifted the green cursor line to the left of the error bar. 152 data points were removed out of 2055 data points. The scatter plot for the data points is displayed in Figure 9b. Removed data points are marked in red in the scatter plot. The L1-norm misfit is 13.33%, and the L2-norm misfit is 24.15%.
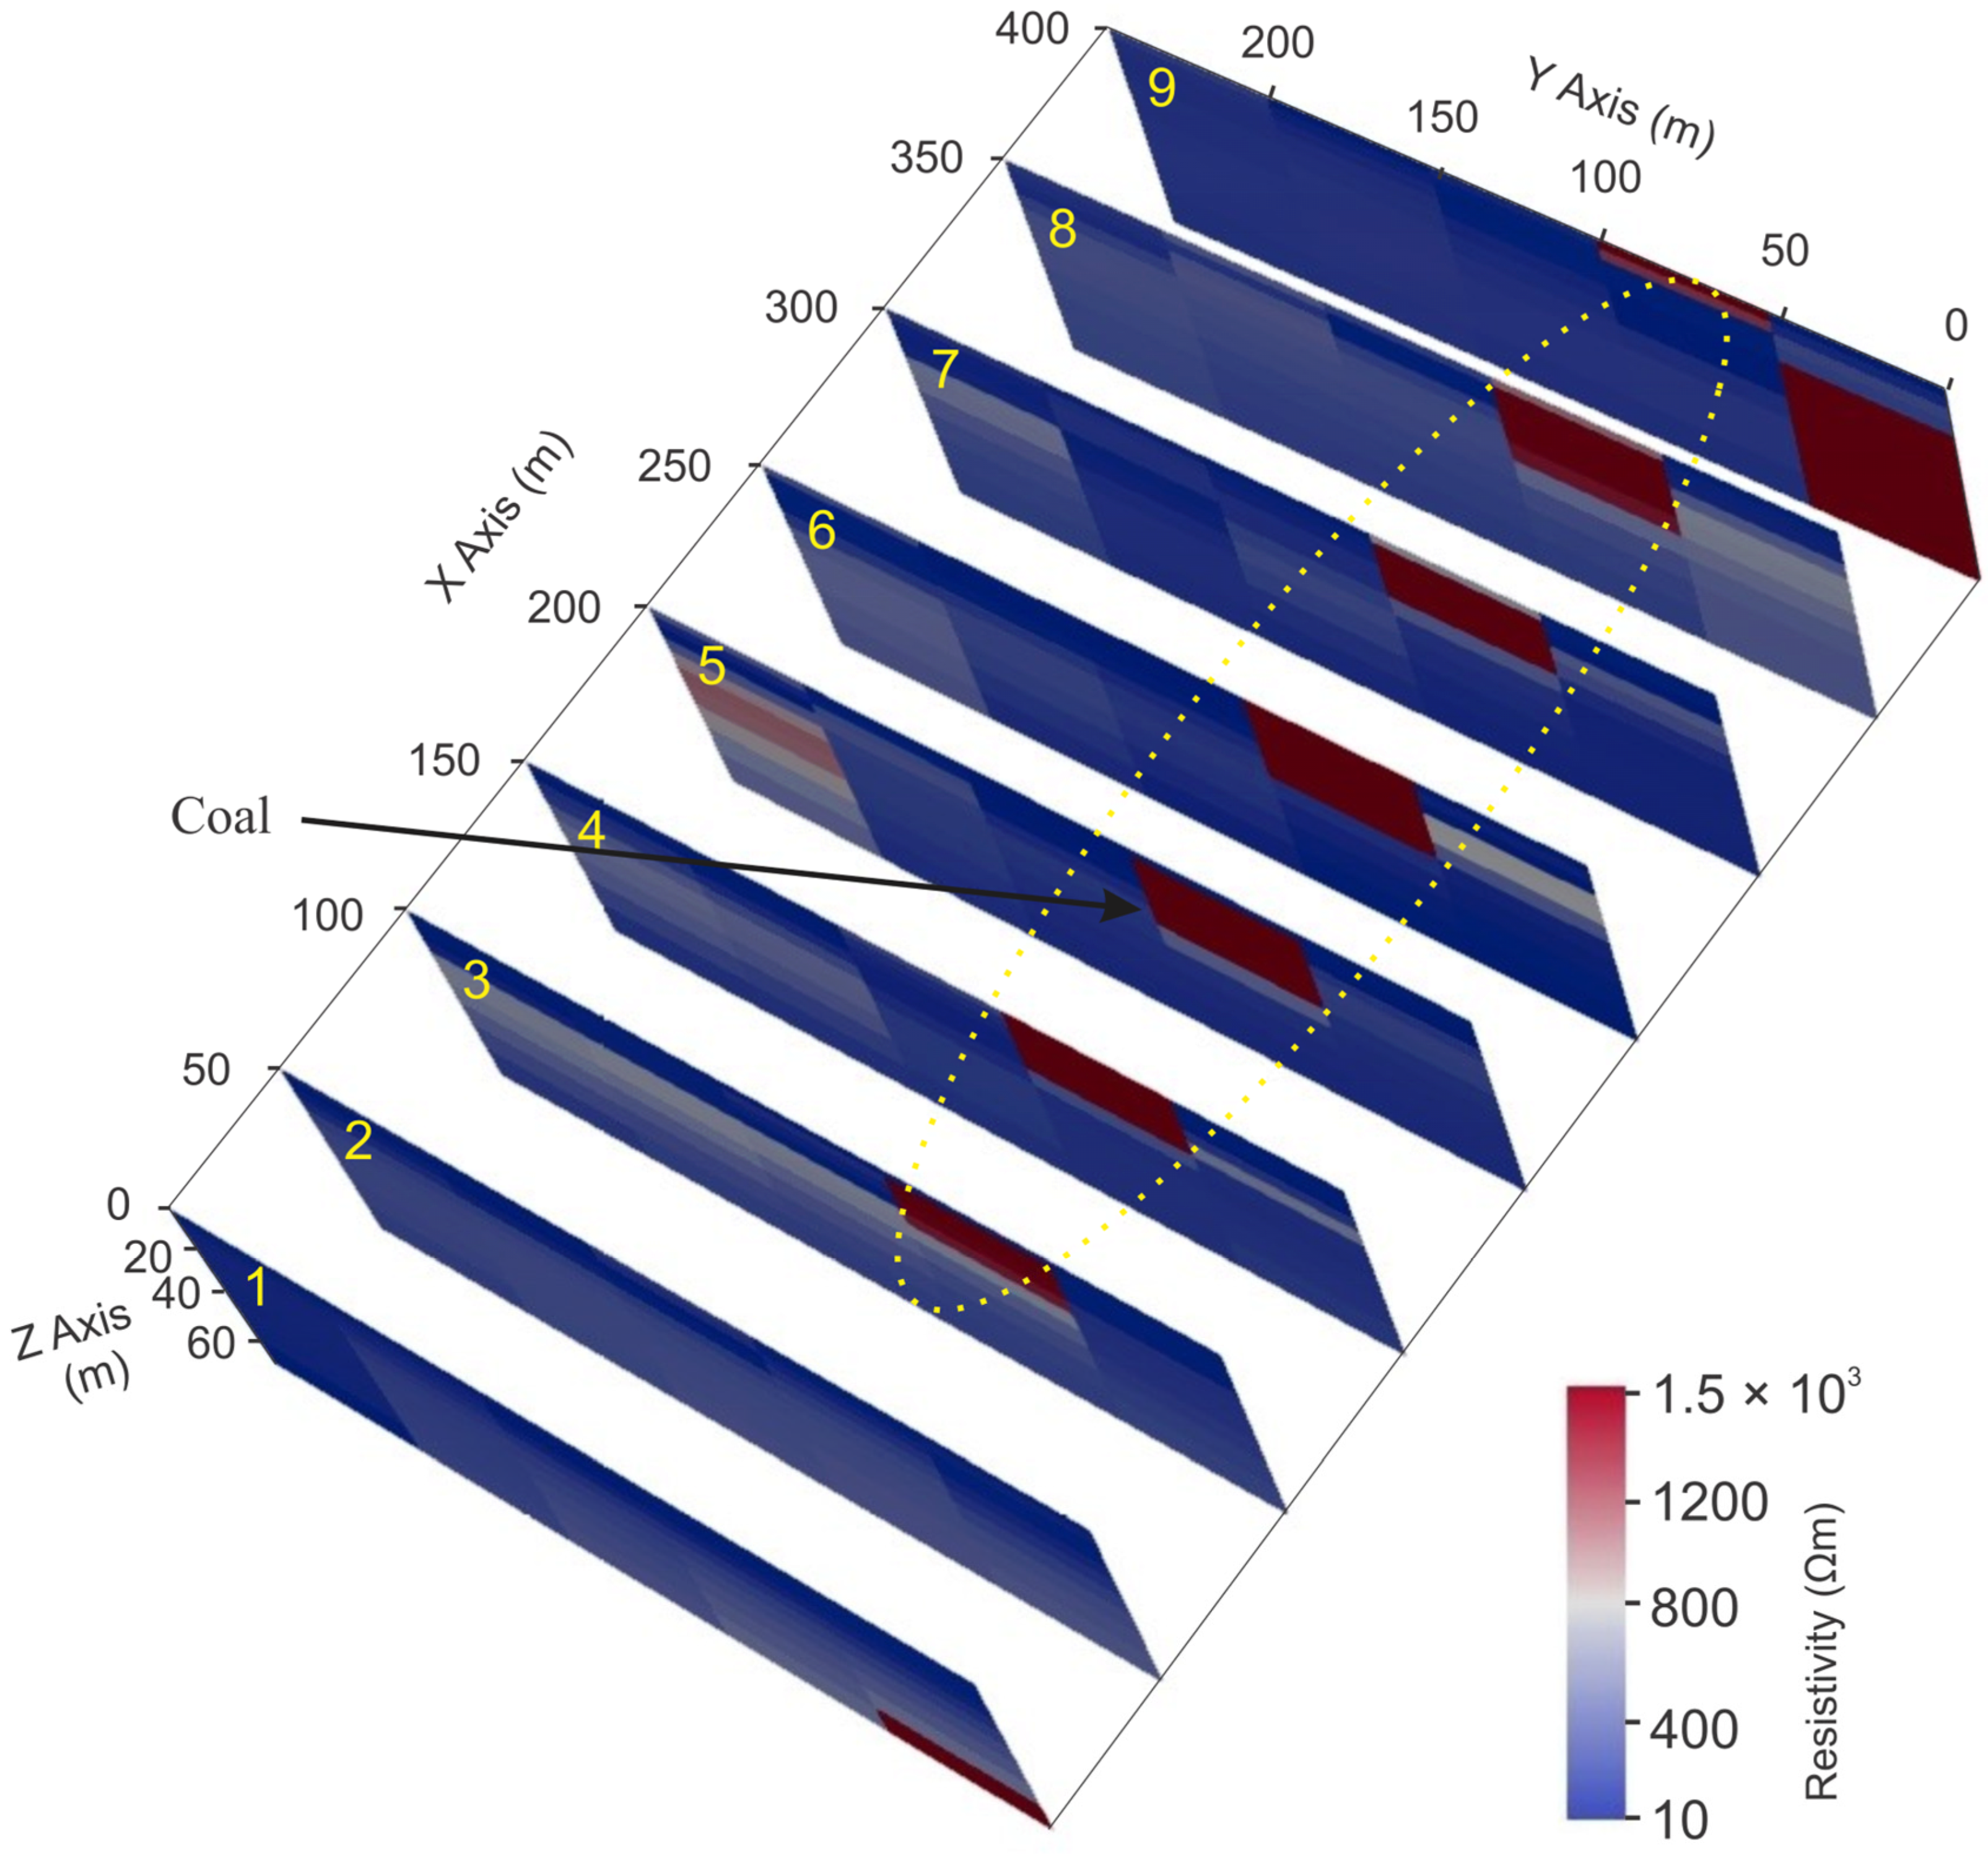
3D inverted data were exported in a universal format and plotted using open-source paraView graphic software (5.9.1) [59] to visualize the 3D resistivity distribution (Figure 10). ERT slices were taken at every 50-m interval up to a 400-m profile. Correlation between profiles can be made more accessible by using a fixed resistivity range of 10 to 15,000 Ωm. High ground resistivity of more than 500 Ωm indicates coal and sandstone in the area, while resistivity of less than 100 Ωm is due to shale and water. A coal signature in red color was observed from the 3rd to 9th slices, as marked in Figure 10 along the x-axis. In the y-direction, the coal seam continued from 50 to 100 m, shown in red. Coal in the study area generally has a higher electrical resistivity compared with sandstone. Coal is a relatively good insulator, while sandstone is more conductive due to the presence of minerals and pore fluids. To distinguish coal from sandstone in unsaturated zones, gather the site’s borehole or core sample data to establish a correlation between the electrical resistivity values obtained from ERT and the actual geological materials. Considering the geological context of the area, knowledge of the regional geology, and the expected distribution of coal and sandstones can guide the interpretation of the ERT data. A high resistivity zone is a noise at the bottom right side in the first and last slices.
The results of 3D ERT inversion improved our understanding of the subsurface geology complexity and significantly improved the delineation of coal seams. The numerical range of 1 to 9 represents the 2D (x-z section) obtained by slicing through the 3D ERT model.

4.2. Geotechnical Study

A geotechnical study describes the soil’s suitability for construction and scientific investigation. The weak strength of soil can be responsible for ground subsidence, a common problem in coal mining. The stability of the structures relies significantly on cohesion and the angle of internal friction, both of which are pivotal factors influencing shear strength [60]. The strength of coal decreases with increasing sample size [61]. Weak soil, cavities around coal seams, and shallow or abandoned collieries may increase the coal mining hazards and associated risks [62].
In this paper, geotechnical parameters were calculated using Equations (1)–(4), using the resistivity data of profile 1, for a better understanding of the ERT results in terms of engineering planning perspective. The relationship between resistivity and geotechnical parameters [33] is applicable to the soil in the tropical areas. The coefficient of determination (R2) gauges the precision of the model’s predictions, ranging from 0 to 1. An R2 value of 0 implies the inability to predict the dependent variable from the independent variable, while an R2 value of 1 indicates flawless prediction of the dependent variable from the independent variable. For the equation deriving moisture content from resistivity data, R2 was 0.8168. Likewise, the equation determining cohesion from resistivity data yielded an R2 of 0.6337, the plastic index derivation had an R2 of 0.6337, and the friction angle derivation had an R2 of 0.6307. Based on the area’s geology, different formulas can be applicable for different geological layers to determine geotechnical parameters based on resistivity values. The empirical relation derived from the laboratory simulation [33] is not validated for a diverse geological nature, although this research aims to apply the derived relation to the actual field data. It is important to note that further testing is required to validate the applicability of the equations proposed in this work across different geological conditions. The conventional approach to assessing soil strength often involves complex and time-consuming laboratory testing; however, the utilization of electrical resistivity measurements provides an intriguing alternative. The relationship between soil properties and electrical resistivity offered a practical method for assessing soil strength without traditional laboratory tests.
The appropriate amount of moisture content can increase the cohesion value of coal up to a certain limit but a continuous increase in moisture content can reduce the cohesion value very fast, as explained in [63]. The dynamic relationship between moisture content, cohesion, and soil strength, highlighting the potential of electrical resistivity and seismic refraction for predictive modeling in geotechnical studies, indicated that low resistivity and high seismic velocity are associated with low cohesion values in clayey sand [64].
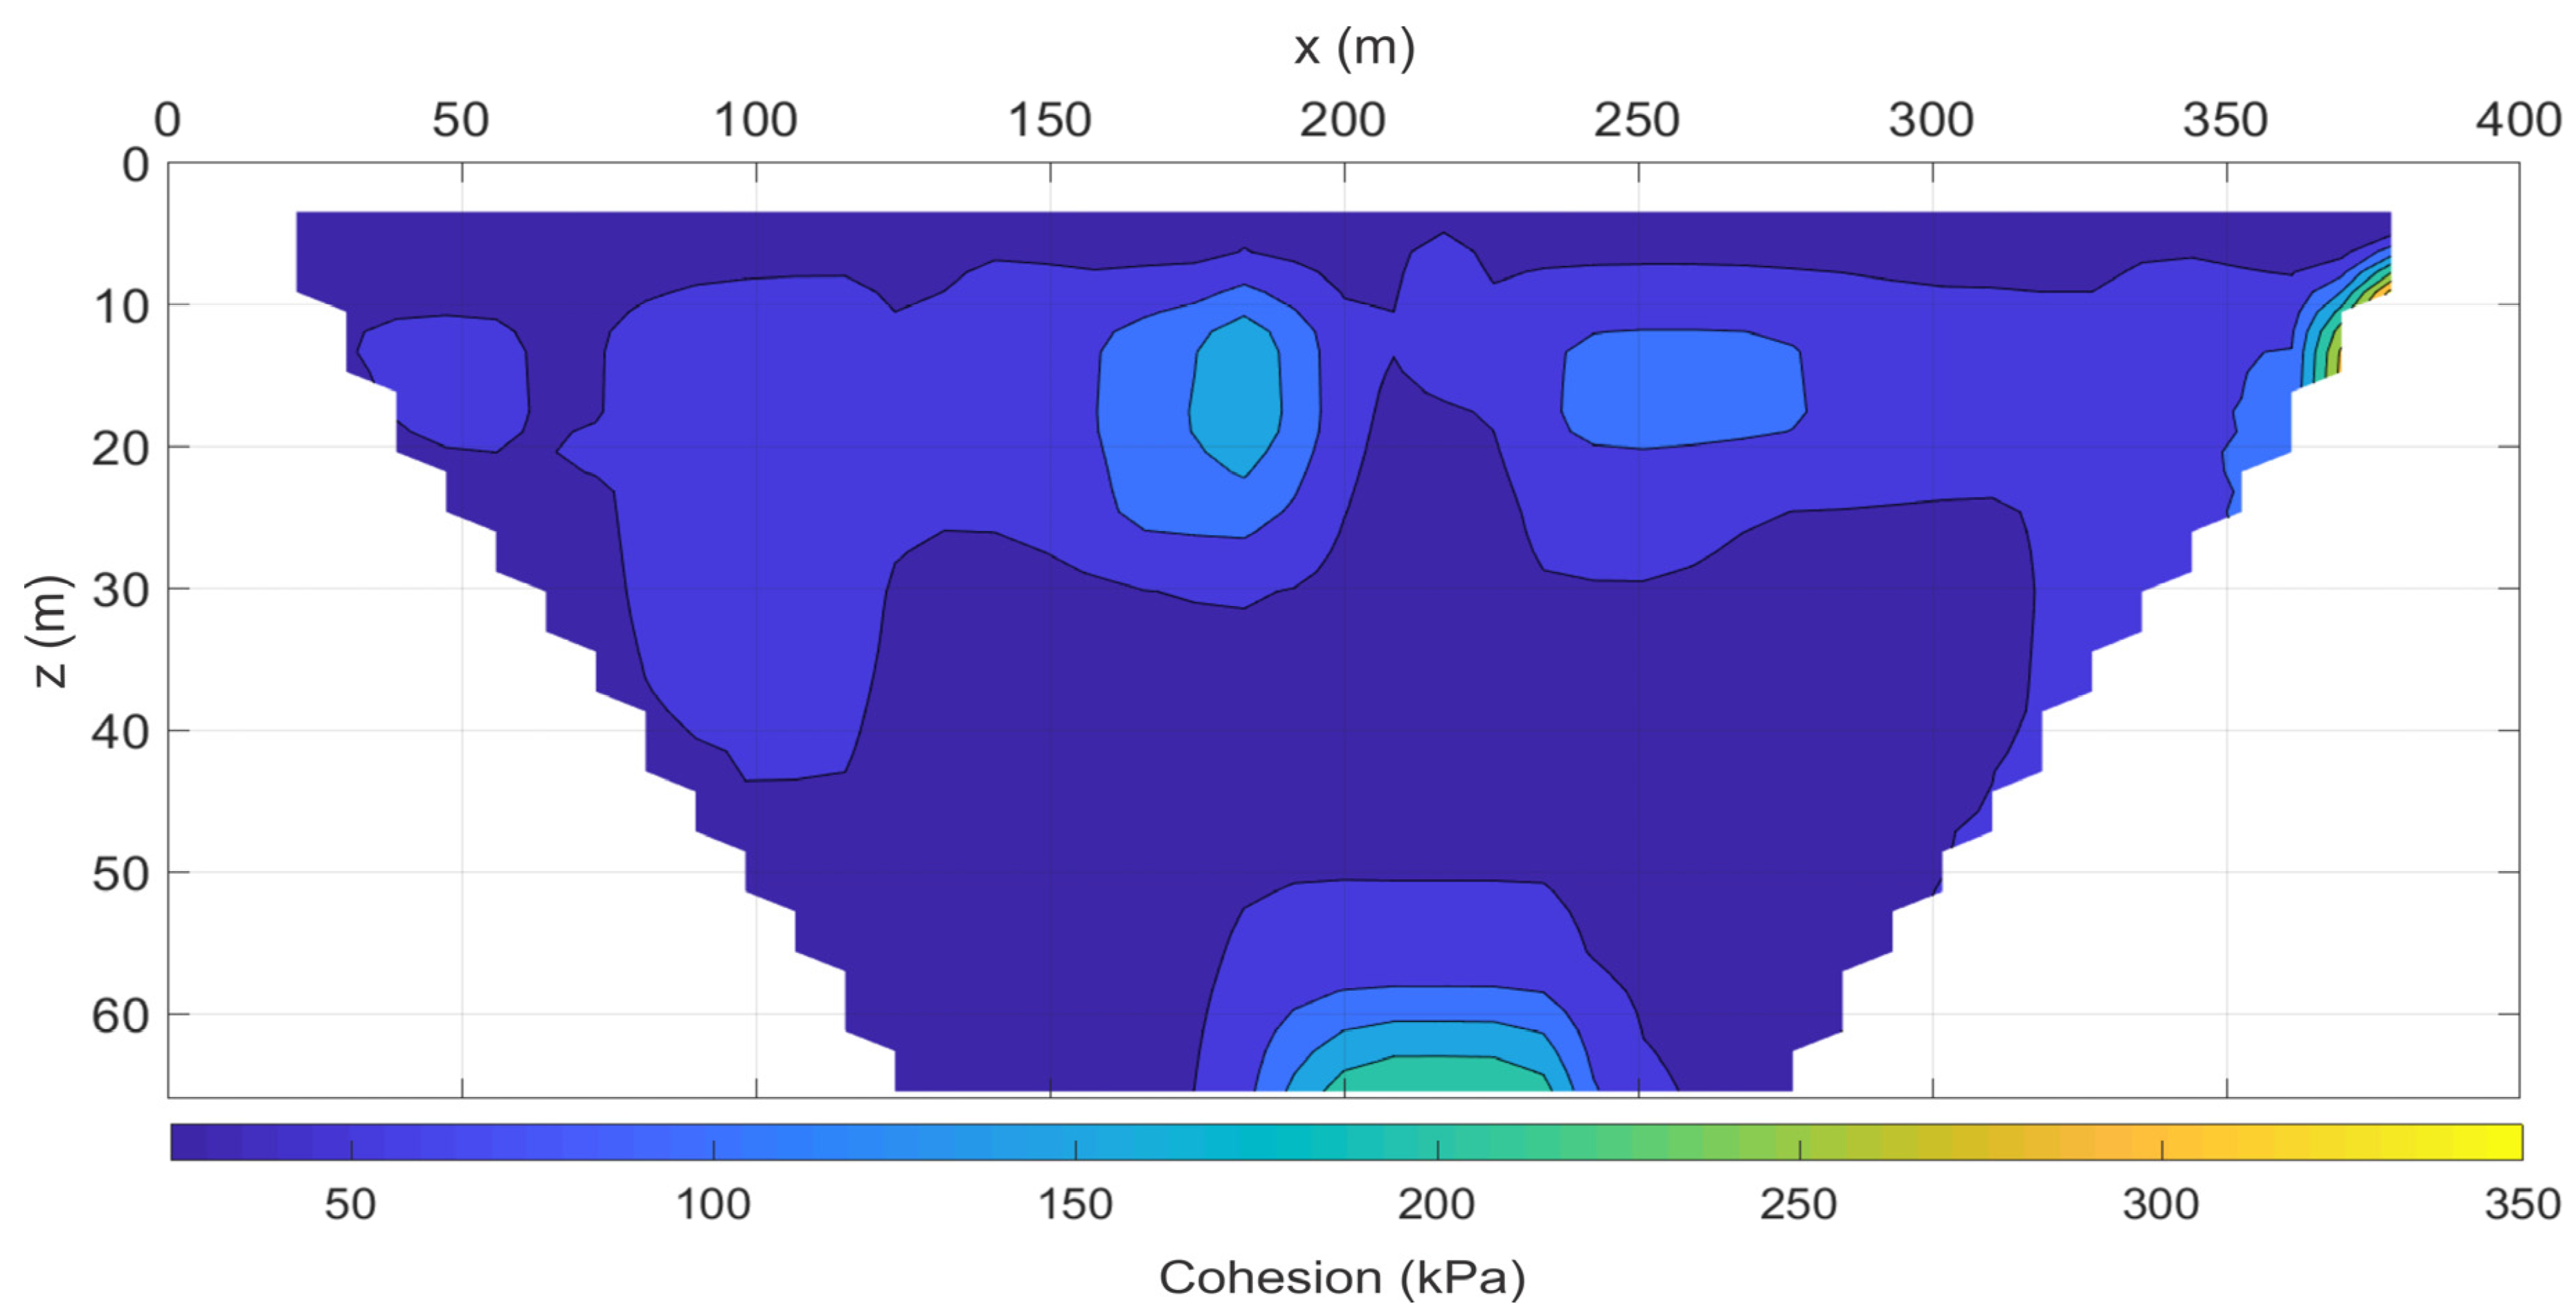
Figure 11 depicts variation of cohesion corresponding to profile 1, with cohesion values derived from resistivity values using Equation (1). Cohesion, a mechanical parameter crucial for soil integrity, essentially binds soil particles within the Earth. Theoretical cohesive strength can span from 0 kPa for very soft clay to 10,000 kPa for massive rock. In the study [65], the cohesion values for the topsoil, coal, and sandstone in the vicinity of the research area were reported as 17–22 kPa, 62–76 kPa, and 94–132 kPa, respectively. For our investigation, cohesion values below 50 kPa indicate topsoil, while values exceeding 60 kPa suggest the presence of a potential coal seam, as interpreted from profile 1; however, discerning other anomalies in this section is challenging.
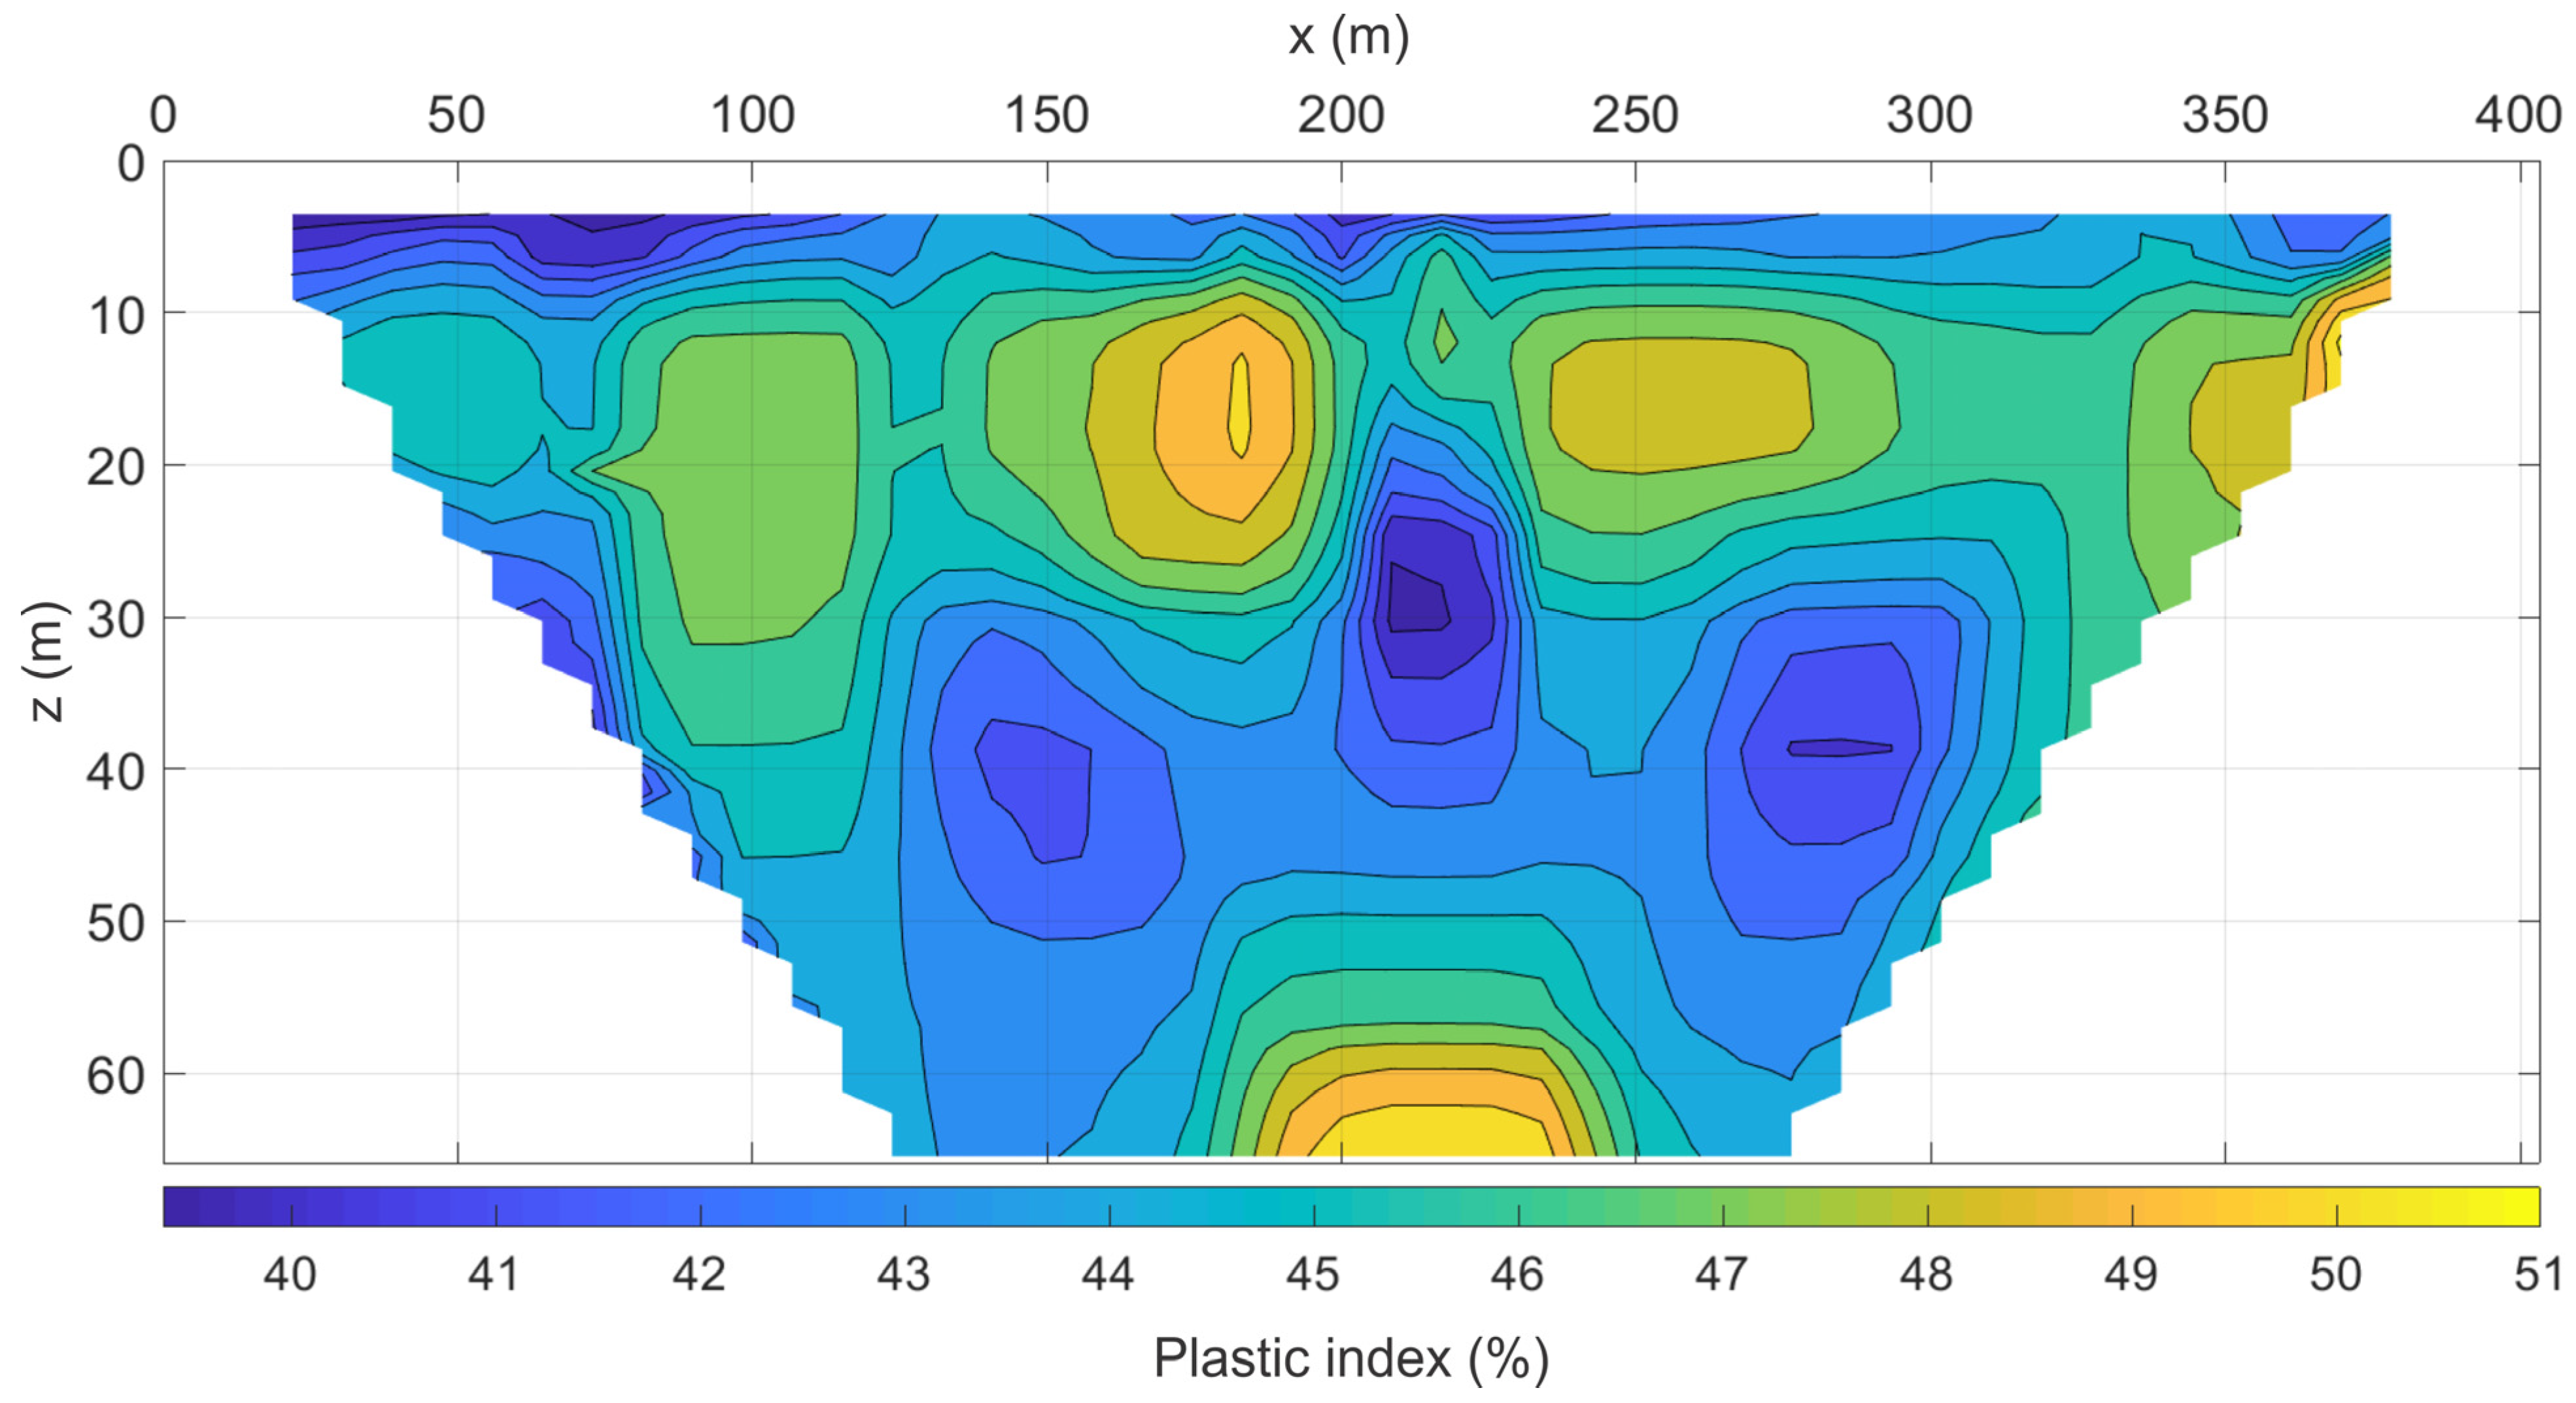
The plastic index is the range of water content over which soil remains in the plastic state. The subsurface instabilities can lead to an expansion of the lateral coal plastic zone [7]. Furthermore, coal tends to become more brittle as the plastic index increases [66]. These findings collectively emphasize the intricate relationship between cement content, subsurface stability, and the plastic properties of coal, and shed light on the crucial factors influencing material behavior in geological contexts. The plastic index is a crucial property for fine-grained soils like clayey soils. A plastic index of 0% signifies non-plastic soil, while a plastic index exceeding 40% indicates soil with very high plasticity. By comparing the inverted resistivity (Figure 4) and plastic index (Figure 12), observations can be made regarding the plastic characteristics of different soil layers. The topsoil exhibits a low plastic index (below 40%), whereas the coal seam layer displays a high plastic index (over 47%). Vertical discontinuities in the top layer are suggested as a potential source of the saturated zone. The plastic index is known to be at its maximum for clayey soils [67]. Figure 12 highlights the coal seam location with a notably higher plastic index, possibly attributed to the presence of shale above the coal seam. This correlation between the plastic index and geological features provides valuable insights into the subsurface composition, aiding the interpretation of soil behavior and potential hydrological characteristics in the studied area.
The influence of water content and void ratio on the electrical resistivity of soil, offering empirical correlation models, is discussed in [68]. Moisture content, a measure of the quantity of water in the soil, is a critical factor in soil behavior. The impact of moisture content on resistivity is substantial [69]. It contributes to a decrease in the soil’s shear strength and electrical resistivity [70]. Figure 13 illustrates the moisture content variation for profile 1 (Figure 4), emphasizing its importance. In the coal seam, the moisture content was less than 30%, whereas the topsoil and saturated zone exhibited moisture content exceeding 40%. This suggests that the gaps are not fully saturated but likely partially saturated with water and filled with soil. Understanding these moisture dynamics is crucial for comprehending the subsurface conditions and the potential influence on soil properties in the studied area.
The differentiation between fine, medium, and coarse soil (non-cohesive soil) based solely on resistivity is challenging due to the decisive influence of moisture content and degree of saturation on resistivity compared with the grain size [30].
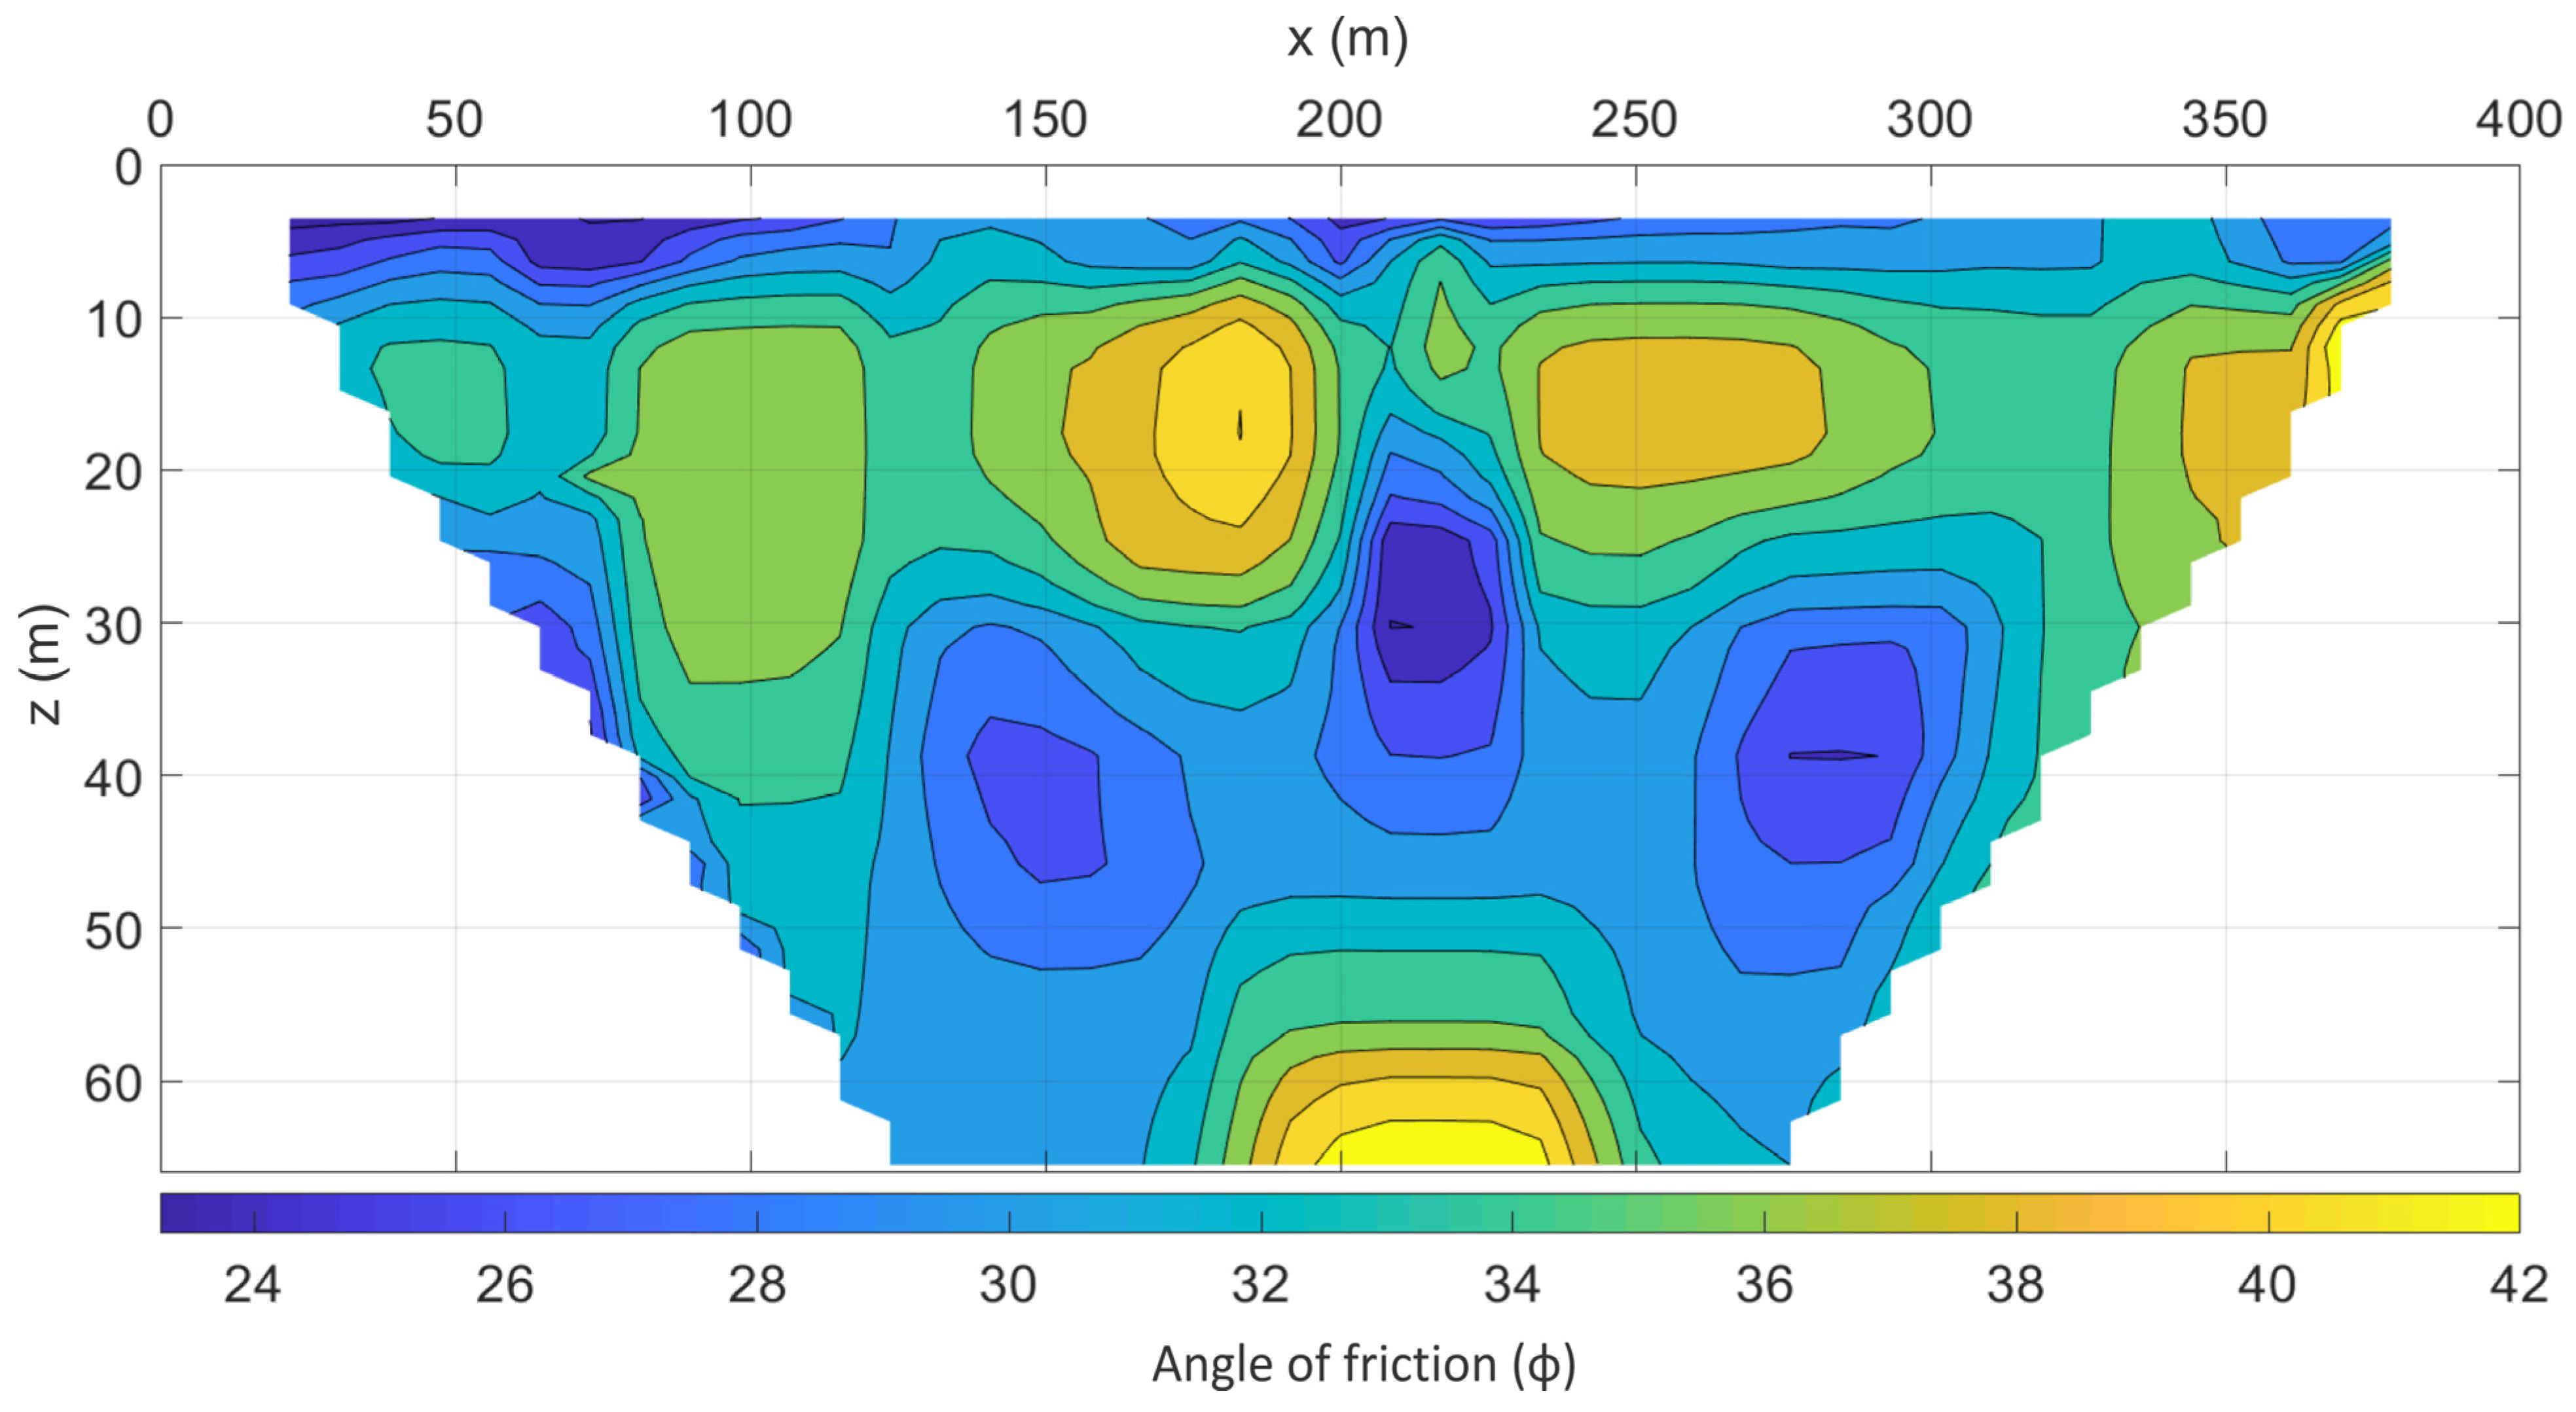
The impact of cohesion and friction angle when tunneling in a homogeneous coal seam highlighted that increasing cohesion can decrease stress values [71]. Conversely, decreasing the coal seam’s internal friction angle or cohesion can shift the stress peak further away. The friction angle is crucial for quantifying a soil’s shear strength. The range of friction angles for topsoil, coal samples, and sandstone near the study area is 28–32°, 18–20°, and 33–35°, respectively [65]. The friction angle of soil is influenced by factors such as grain size distribution, angularity, and particle interlocking. Coarse and angular soils generally exhibit a higher friction angle than fine-grained soils [72]. The friction angle value for coal is more significant than sandstone and less significant than shale [73]. This observation aligns with the findings in 33, that the friction angle increases with resistivity, as illustrated in Figure 14 as well. These insights into the relationship between friction angle, resistivity, and geological characteristics contribute to a better understanding of the mechanical behavior of the coal seam and surrounding materials during tunneling operations.

5. Conclusions

This study integrated 2D and 3D inversion of Electrical Resistivity Tomography (ERT) data with an analysis of geotechnical parameters. The 3D resistivity inversion proved to be more effective in delineating high-resistive geological layers, such as coal seams, than low-resistive anomalies like saturated zones or shale/clayey layers. The variation in moisture content enhanced the identification of conductive areas in the subsurface.
Relying solely on resistivity values places challenges in interpreting thin, sandwiched coal seam layers against a high-resistive background. Therefore, combining ERT results, borehole data, and 3D subsurface images facilitates a more accessible interpretation. Additionally, analyzing geotechnical parameters, such as cohesion, plastic index, moisture content, and friction angle, provides an added advantage in correlating results and enhancing subsurface image interpretation.
The findings of this study reveal that electrical resistivity decreases with increasing moisture content, the plastic index decreases with increasing moisture content, and friction angle and cohesion values change with soil saturation. The presence of loose soil beneath coal seams raises concerns about potential ground subsidence in the future. This comprehensive approach combining geophysical and geotechnical analyses contributes to a more nuanced understanding of the subsurface conditions and the potential risks associated with the study area.
The current study demonstrates the utility of 2D and quasi-3D electrical resistivity tomography (ERT) data in exhibiting a correlated behavior with geotechnical parameters. While laboratory-derived empirical relationships may not be applicable globally, field ERT data can still be highly valuable for subsurface geotechnical characterization using such empirical relations.

Author Contributions

Methodology, R.R., P.T. and S.P.S.; Software, S.P.S.; Validation, R.R. and P.T.; Formal analysis, R.R. and P.T.; Investigation, R.R., P.T. and S.P.S.; Supervision, S.P.S. All authors have read and agreed to the published version of the manuscript.

Funding

This research received no external funding.

Data Availability Statement

The data presented in this study are available on request from the corresponding author. The data are not publicly available due to privacy.

Acknowledgments

The authors thank the Department of Geology and Geophysics, IIT Kharagpur, West Bengal (India) for providing the research facilities. We also would like to express our sincere gratitude to Rudra Mohan Pradhan, NPDF, IIT Kharagpur for his valuable guidance and support during manuscript preparation.

Conflicts of Interest

The authors declare no conflicts of interest.

References

  1. Hatcher, P.G.; Clifford, D.J. The organic geochemistry of coal: From plant materials to coal. Org. Geochem. 1997, 27, 251–274. [Google Scholar] [CrossRef]
  2. Miller, B.G. Coal Energy Systems; Academic Press: Cambridge, MA, USA, 2005. [Google Scholar]
  3. Aberšek, B.; Flogie, A. Energies and Energetics. In Human Awareness, Energy and Environmental Attitudes; Springer International Publishing: Cham, Switzerland, 2022; pp. 91–110. [Google Scholar]
  4. Abdelrahman, K.; Hazaea, S.A.; Hazaea, B.Y.; Abioui, M.; Al-Awah, H. Groundwater potentiality in hard-rock terrain of southern Saudi Arabia using electrical resistivity tomography approach. J. King Saud Univ. Sci. 2023, 35, 102928. [Google Scholar] [CrossRef]
  5. Ariyo, S.O.; Adeyemi, G.O. Role of electrical resistivity method for groundwater exploration in hard rock areas: A case study from Fidiwo/Ajebo areas of Southwestern Nigeria. Pac. J. Sci. Technol. 2009, 10, 483–486. [Google Scholar]
  6. Goldman, M.; Neubauer, F.M. Groundwater exploration using integrated geophysical techniques. Surv. Geophys. 1994, 15, 331–361. [Google Scholar] [CrossRef]
  7. Zhang, B.; Sun, D.; Zheng, R. Evolution law of coal seam abutment pressure under the influence of shallow buried complex strata: A case study. Shock Vib. 2021, 6670175. [Google Scholar] [CrossRef]
  8. Ali, M.A.H.; Mewafy, F.M.; Qian, W.; Alshehri, F.; Ahmed, M.S.; Saleem, H.A. Integration of Electrical Resistivity Tomography and Induced Polarization for Characterization and Mapping of (Pb-Zn-Ag) Sulfide Deposits. Minerals 2023, 13, 986. [Google Scholar] [CrossRef]
  9. Arjwech, R.; Sriwangpon, P.; Somchat, K.; Pondthai, P.; Everett, M. Electrical resistivity tomography (ERT) data for clay mineral mapping. Data Brief 2020, 30, 105494. [Google Scholar] [CrossRef] [PubMed]
  10. Zhang, G.; Lü, Q.-T.; Zhang, G.-B.; Lin, P.-R.; Jia, Z.-Y.; Suo, K. Joint interpretation of geological, magnetic, AMT, and ERT data for mineral exploration in the Northeast of Inner Mongolia, China. Pure Appl. Geophys. 2017, 175, 989–1002. [Google Scholar] [CrossRef]
  11. Dahlin, T.; Bernstone, C.; Loke, M.H. A 3-D resistivity investigation of a contaminated site at Lernacken, Sweden. Geophysics 2002, 67, 1692–1700. [Google Scholar] [CrossRef]
  12. Ustra, A.T.; Elis, V.R.; Mondelli, G.; Zuquette, L.V.; Giacheti, H.L. Case study: A 3D resistivity and induced polar-ization imaging from downstream a waste disposal site in Brazil. Environ. Earth Sci. 2012, 66, 763–772. [Google Scholar] [CrossRef]
  13. Yang, P.; Liu, Y.-H.; Zhang, S.-H.; Pan, Y.-F. Experimental investigation on the migration of leachate under flowing conditions through laboratory ERT. Environ. Sci. Pollut. Res. 2019, 26, 17457–17471. [Google Scholar] [CrossRef] [PubMed]
  14. Cardoso, G.A.F.; Lopes, B.d.C.F.L. ERT Feasibility Study to Assess Unknown Bridge Foundation Depth. J. Bridg. Eng. 2022, 27, 06022002. [Google Scholar] [CrossRef]
  15. Ebrahimi, M.; Taleshi, A.A.; Abbasinia, M.; Arab-Amiri, A. Two and three-dimensional ERT modelling for a buried tunnel. J. Emerg. Trends Eng. Appl. Sci. 2016, 7, 118–127. [Google Scholar]
  16. Muceku, Y.; Reçi, H.; Kaba, F.; Kuriqi, A.; Shyti, F.; Kruja, F.; Kumbaro, R. A case study: Integrated geotechnical and geophysical-ERT investigation for bridge foundation of Tirana bypass. In Proceedings of the International Congress on Roads (AACE), Tirana, Albania, 8–9 October 2015. [Google Scholar]
  17. Ngah, S.A.; Nwankwoala, H.O. Evaluation of sub-soil geotechnical properties for shallow foundation design in onne, Rivers state, Nigeria. Int. J. Eng. Sci. 2013, 2, 8–16. [Google Scholar]
  18. Afip, I.A.; Taib, S.N.L.; Jusoff, K.; Afip, L.A. Measurement of peat soil shear strength using Wenner four-point probes and vane shear strength methods. Int. J. Geophys. 2019, 2019, 3909032. [Google Scholar]
  19. Cheng, Q.; Tao, M.; Chen, X.; Binley, A. Evaluation of electrical resistivity tomography (ERT) for mapping the soil–rock interface in karstic environments. Environ. Earth Sci. 2019, 78, 1–14. [Google Scholar] [CrossRef]
  20. Hatta, K.A.; Osman, S.B.A.S. Correlation of Electrical Resistivity and SPT-N Value from Standard Penetration Test (SPT) of Sandy Soil. Appl. Mech. Mater. 2015, 785, 702–706. [Google Scholar] [CrossRef]
  21. Lech, M.; Bajda, M.; Markowska-Lech, K. The use of resistivity and seismic cone penetration tests for site characterization. Ann. Wars. Univ. Life Sci. SGGW. Land Reclam. 2008, 40, 87–96. [Google Scholar] [CrossRef]
  22. Lech, M.; Skutnik, Z.; Bajda, M.; Markowska-Lech, K. Applications of electrical resistivity surveys in solving selected geotechnical and environmental problems. Appl. Sci. 2020, 10, 2263. [Google Scholar] [CrossRef]
  23. Lee, J.-S.; Kim, S.Y.; Hong, W.-T.; Byun, Y.-H. Assessing subgrade strength using an instrumented dynamic cone penetrometer. Soils Found. 2019, 59, 930–941. [Google Scholar] [CrossRef]
  24. Perri, M.T.; Boaga, J.; Bersan, S.; Cassiani, G.; Cola, S.; Deiana, R.; Simonini, P.; Patti, S. River embankment characterization: The joint use of geophysical and geotechnical techniques. J. Appl. Geophys. 2014, 110, 5–22. [Google Scholar] [CrossRef]
  25. Poenaru, A. Correlations between Cone Penetration Test and Seismic Dilatometer Marchetti Test with Common Laboratory Investigations. Energy Procedia 2016, 85, 399–407. [Google Scholar] [CrossRef]
  26. Yoon, H.K.; Jung, S.H.; Lee, J.S. Characterisation of subsurface spatial variability using a cone resistivity pene-trometer. Soil Dyn. Earthq. Eng. 2011, 31, 1064–1071. [Google Scholar] [CrossRef]
  27. Zhao, Z.; Lu, F.; Yue, C. Study on the Application of Flat Dilatometer Test in Subway Survey Engineering. In IOP Conference Series: Earth and Environmental Science; IOP Publishing: Bristol, UK, 2020; Volume 474, p. 072012. [Google Scholar]
  28. Dahlin, T.; Zhou, B. A numerical comparison of 2D resistivity imaging with 10 electrode arrays. Geophys. Prospect. 2004, 52, 379–398. [Google Scholar] [CrossRef]
  29. Azarsa, P.; Gupta, R. Electrical Resistivity of Concrete for Durability Evaluation: A Review. Adv. Mater. Sci. Eng. 2017, 2017, 8453095. [Google Scholar] [CrossRef]
  30. Kowalczyk, S.; Maślakowski, M.; Tucholka, P. Determination of the correlation between the electrical resistivity of non-cohesive soils and the degree of compaction. J. Appl. Geophys. 2014, 110, 43–50. [Google Scholar] [CrossRef]
  31. Gomaa, M.M. Salinity and water effect on electrical properties of fragile clayey sandstone. Appl. Water Sci. 2020, 10, 1–9. [Google Scholar] [CrossRef]
  32. Rupesh Tiwari, P.; Sharma, S.P. High-resolution quasi-3D electric resistivity tomography for deciphering ground-water potential zones in lateritic terrain. Nat. Resour. Res. 2021, 30, 3339–3353. [Google Scholar] [CrossRef]
  33. Jusoh, H.; Osman, S.B.S. The correlation between resistivity and soil properties as an alternative to soil investigation. Indian J. Sci. Technol. 2017, 10, 1–5. [Google Scholar]
  34. Günaydin, O.; Özbeyaz, A.; Söylemez, M. Regression Analysis of Soil Compaction Parameters Using Support Vector Method. Celal Bayar Univ. J. Sci. 2018, 14, 443–447. [Google Scholar] [CrossRef]
  35. Karsten, T.K.; Gau, C.; Tiedemann, J. Shear Strength Parameters from Direct Shear Tests—Influencing Factors and Their Significance; IAEG2006 Paper number 484; The Geological Society of London: London, UK, 2006; pp. 1–12. [Google Scholar]
  36. Geological Survey of India, 2023. Bhukosh. Geological Survey of India. Available online: https://bhukosh.gsi.gov.in/Bhukosh/Public (accessed on 20 November 2023).
  37. Mahata, S.; Sharma, V.N. Evolution and distribution of coal mines in Salanpur Block, District Paschim Bardhaman, West Bengal. Natl. Geogr. J. India 2022, 65, 122–131. [Google Scholar]
  38. Roy, J. The Geological Characterstics of the Western Part of Bardhaman District. 2019. Available online: http://www.ijrar.com/upload_issue/ijrar_issue_20543863.pdf (accessed on 9 January 2024).
  39. Lee, K.S.; Cho, I.K.; Kim, Y.J. Borehole effect in 2.5 D crosshole resistivity tomography. J. Appl. Geophys. 2016, 135, 212–222. [Google Scholar] [CrossRef]
  40. Lee, K.; Cho, I. Negative apparent resistivities in surface resistivity measurements. J. Appl. Geophys. 2020, 176, 104010. [Google Scholar] [CrossRef]
  41. Wilkinson, P.B.; Chambers, J.E.; Lelliott, M.; Wealthall, G.P.; Ogilvy, R.D. Extreme sensitivity of crosshole electrical resistivity tomography measurements to geometric errors. Geophys. J. Int. 2008, 173, 49–62. [Google Scholar] [CrossRef]
  42. Loke, M.; Acworth, I.; Dahlin, T. A comparison of smooth and blocky inversion methods in 2D electrical imaging surveys. Explor. Geophys. 2003, 34, 182–187. [Google Scholar] [CrossRef]
  43. Claerbout, J.F.; Muir, F. Robust modeling with erratic data. Geophysics 1973, 38, 826–844. [Google Scholar] [CrossRef]
  44. Cardarelli, E.; De Donno, G. Advances in electric resistivity tomography: Theory and case studies. In Innovation in Near-Surface Geophysics; Elsevier: Amsterdam, The Netherlands, 2019; pp. 23–57. [Google Scholar]
  45. Loke, M.; Papadopoulos, N.; Wilkinson, P.; Oikonomou, D.; Simyrdanis, K.; Rucker, D.; Feng, J.; Zhu, B.; Li, W.; Chen, H.; et al. The inversion of data from very large three-dimensional electrical resistivity tomography mobile surveys. Geophys. Prospect. 2020, 68, 2579–2597. [Google Scholar] [CrossRef]
  46. Bharti, A.K.; Pal, S.; Priyam, P.; Pathak, V.K.; Kumar, R.; Ranjan, S.K. Detection of illegal mine voids using electrical resistivity tomography: The case-study of Raniganj coalfield (India). Eng. Geol. 2016, 213, 120–132. [Google Scholar] [CrossRef]
  47. Bharti, A.K.; Prakash, A.; Verma, A.; Oraon, J.; Chaudhary, D.K.; Kumar, S.; Singh, K.K.K. Mapping of decades-old underground coal mine workings using electrical resistivity tomography. J. Earth Syst. Sci. 2022, 131, 258. [Google Scholar] [CrossRef]
  48. Singh, K.K.K.; Singh, K.B.; Lokhande, R.D.; Prakash, A. Multielectrode resistivity imaging technique for the study of coal seam. J. Sci. Ind. Res. 2004, 63, 927–930. [Google Scholar]
  49. Mohammed, M.A.; Adewumi, T.; Ahmed, A.L.; Lawal, K.M. Electrical Resistivity Imaging of a Coal Deposit at Tai Area of Gombe State, North Eastern Nigeria. J. Environ. Earth Sci. 2016, 6, 55. [Google Scholar]
  50. Olatunji, S.; Jimoh, A. Coal Exploration using Electrical Resistivity Method in Some Parts of Benue Trough, Nigeria. Tanzan. J. Sci. 2020, 46, 859–872. [Google Scholar]
  51. Pang, C.; Gao, W.; Wu, P.; Wang, L. Grouting Effect Detection within the Floor of a Coal Seam Using 3D Electric Resistivity Tomography (ERT) with Arbitrary Electrode Positions. Appl. Sci. 2022, 12, 5625. [Google Scholar] [CrossRef]
  52. Ramdani, P.S.; Sehah, M. Modeling of Coal Deposition Using the Resistivity Method with Wenner Configuration in the Bentarsari Basin Area, District of Salem, Brebes Regency, Central Java. J. Fis. dan Apl. 2021, 17, 1–8. [Google Scholar] [CrossRef]
  53. Sheets, R.A. Use of Electrical Resistivity to Detect Underground Mine Voids in Ohio; US Department of the Interior: Washington, DC, USA; US Geological Survey: Denver, CO, USA, 2002; Volume 2.
  54. Qarqori, K.; Rouai, M.; Moreau, F.; Saracco, G.; Dauteuil, O.; Hermitte, D.; Boualoul, M.; de Veslud, L.C. Geoelectrical Tomography Investigating and Modeling of Fractures Network around Bittit Spring (Middle Atlas, Morocco). Int. J. Geophys. 2012, 2012, 489634. [Google Scholar] [CrossRef]
  55. Yue, J.; Wang, Z.; Chen, J.; Wang, B.; An, F. Response characteristics of the resistivity and water content during the imbibition process in remolded coal without gas. Energy Sci. Eng. 2019, 7, 2675–2689. [Google Scholar] [CrossRef]
  56. Loke, M.H. Electrical imaging surveys for environmental and engineering studies. A Pract. Guide 1999, 2, 70. [Google Scholar]
  57. Aizebeokhai, A.P.; Olayinka, A.I.; Singh, V.S.; Uhuegbu, C.C. Effectiveness of 3D geoelectrical resistivity imaging using parallel 2D profiles. Curr. Sci. 2011, 101, 1036–1052. [Google Scholar]
  58. Sasaki, Y.; Hasegawa, N.; Matsuoka, T. Toward practical 3D resistivity surveys: Effects of 3D topography and structures on interpretation. In Proceedings of the 112th SEGJ Conference, Tokyo, Japan, 9–11 May 2005; pp. 207–210. [Google Scholar]
  59. Ahrens, J.; Geveci, B.; Law, C.; Hansen, C.; Johnson, C. 36-ParaView: An End-User Tool for Large-Data Visualization. The Visualization Handbook; Los Almos National Laboratory: Los Alamos, NM, USA, 2005; Available online: https://www.researchgate.net/publication/247111133_ParaView_An_End-User_Tool_for_Large_Data_Visualization (accessed on 9 January 2024).
  60. Fuentes, I.; Seguel, O.; Casanova, M. Shear strength of aggregates compared with bulk soil of two haploxerolls from Chile. J. Soil Sci. Plant Nutr. 2013, 13, 819–831. [Google Scholar] [CrossRef]
  61. Moomivand, H. Effect of size on the compressive strength of coal. Min. Sci. Technol. 1999, 99, 399–404. [Google Scholar]
  62. Bell, F.G.; Donnelly, L.J. Mining and Its Impact on the Environment; CRC Press: London, UK, 2006. [Google Scholar]
  63. Van Nguyen, D.; Nguyen, H.P.; Do, T.M. Experimental Study on the Efficacy of Water Infusion for Underground Mining of a Coal Seam. Appl. Sci. 2019, 9, 3820. [Google Scholar] [CrossRef]
  64. Balarabe, B.; Bery, A.A.; Teoh, Y.J.; Khalil, A.E. New empirical approach for the estimation of soil cohesion and friction angle in 2D form for site investigations. Sains Malays. 2022, 51, 405–419. [Google Scholar] [CrossRef]
  65. Pramanik, A.; Adhikary, A.; Pal, S. Assessment of an Open Cast Coal Mine Slope Stability at Mohanpur Block, Raniganj Coalfield, West Bengal, India. In Proceedings of the Indian Geotechnical Conference 2019, Surat, India, 19–21 December 2021; Springer: Singapore, 2021; Volume I, pp. 765–774. [Google Scholar]
  66. Linnik, V.Y.; Linnik, Y.N.; Zich, A.; Makar, S.V.; Kerimova, C.V.; I Sadriddinov, M. Assessment of properties of coal seams as destructible environments. In IOP Conference Series: Materials Science and Engineering; IOP Publishing: Bristol, UK, 2020; Volume 837, p. 012009. [Google Scholar]
  67. Haigh, S.; Vardanega, P.; Bolton, M.D. The plastic limit of clays. Géotechnique 2013, 63, 435–440. [Google Scholar] [CrossRef]
  68. Bery, A.A.; Ismail, N.E.H. Empirical Correlation Between Electrical Resistivity and Engineering Properties of Soils. Soil Mech. Found. Eng. 2018, 54, 425–429. [Google Scholar] [CrossRef]
  69. Dumont, G.; Pilawski, T.; Dzaomuho-Lenieregue, P.; Hiligsmann, S.; Delvigne, F.; Thonart, P.; Robert, T.; Nguyen, F.; Hermans, T. Gravimetric water distribution assessment from geoelectrical methods (ERT and EMI) in municipal solid waste landfill. Waste Manag. 2016, 55, 129–140. [Google Scholar] [CrossRef]
  70. Spoor, G.; Godwin, R.J. Soil deformation and shear strength characteristics of some clay soils at different moisture contents. Eur. J. Soil Sci. 1979, 30, 483–498. [Google Scholar] [CrossRef]
  71. Yang, W.; Lu, C.; Lin, B.; Zhang, J.; Lin, M.; Wang, H. Tunnelling outburst potential affected by mechanical properties of coal seam. Tunn. Undergr. Space Technol. 2019, 83, 99–112. [Google Scholar] [CrossRef]
  72. Pulat, H.F.; Develioğlu, I.; Rasul, A.Y. Examination of Factors Affecting the Shear Strength of Granulated Blast Furnace Slag. Celal Bayar Univ. J. Sci. 2018, 14, 291–295. [Google Scholar] [CrossRef]
  73. Esterhuizen, G.S.; Bajpayee, T.S.; Ellenberger, J.L.; Murphy, M.M. Practical estimation of rock properties for modeling bedded coal mine strata using the Coal Mine Roof Rating. In Proceedings of the 47th US Rock Mechanics/Geomechanics Symposium, San Francisto, CA, USA, 23–26 June 2013. [Google Scholar]
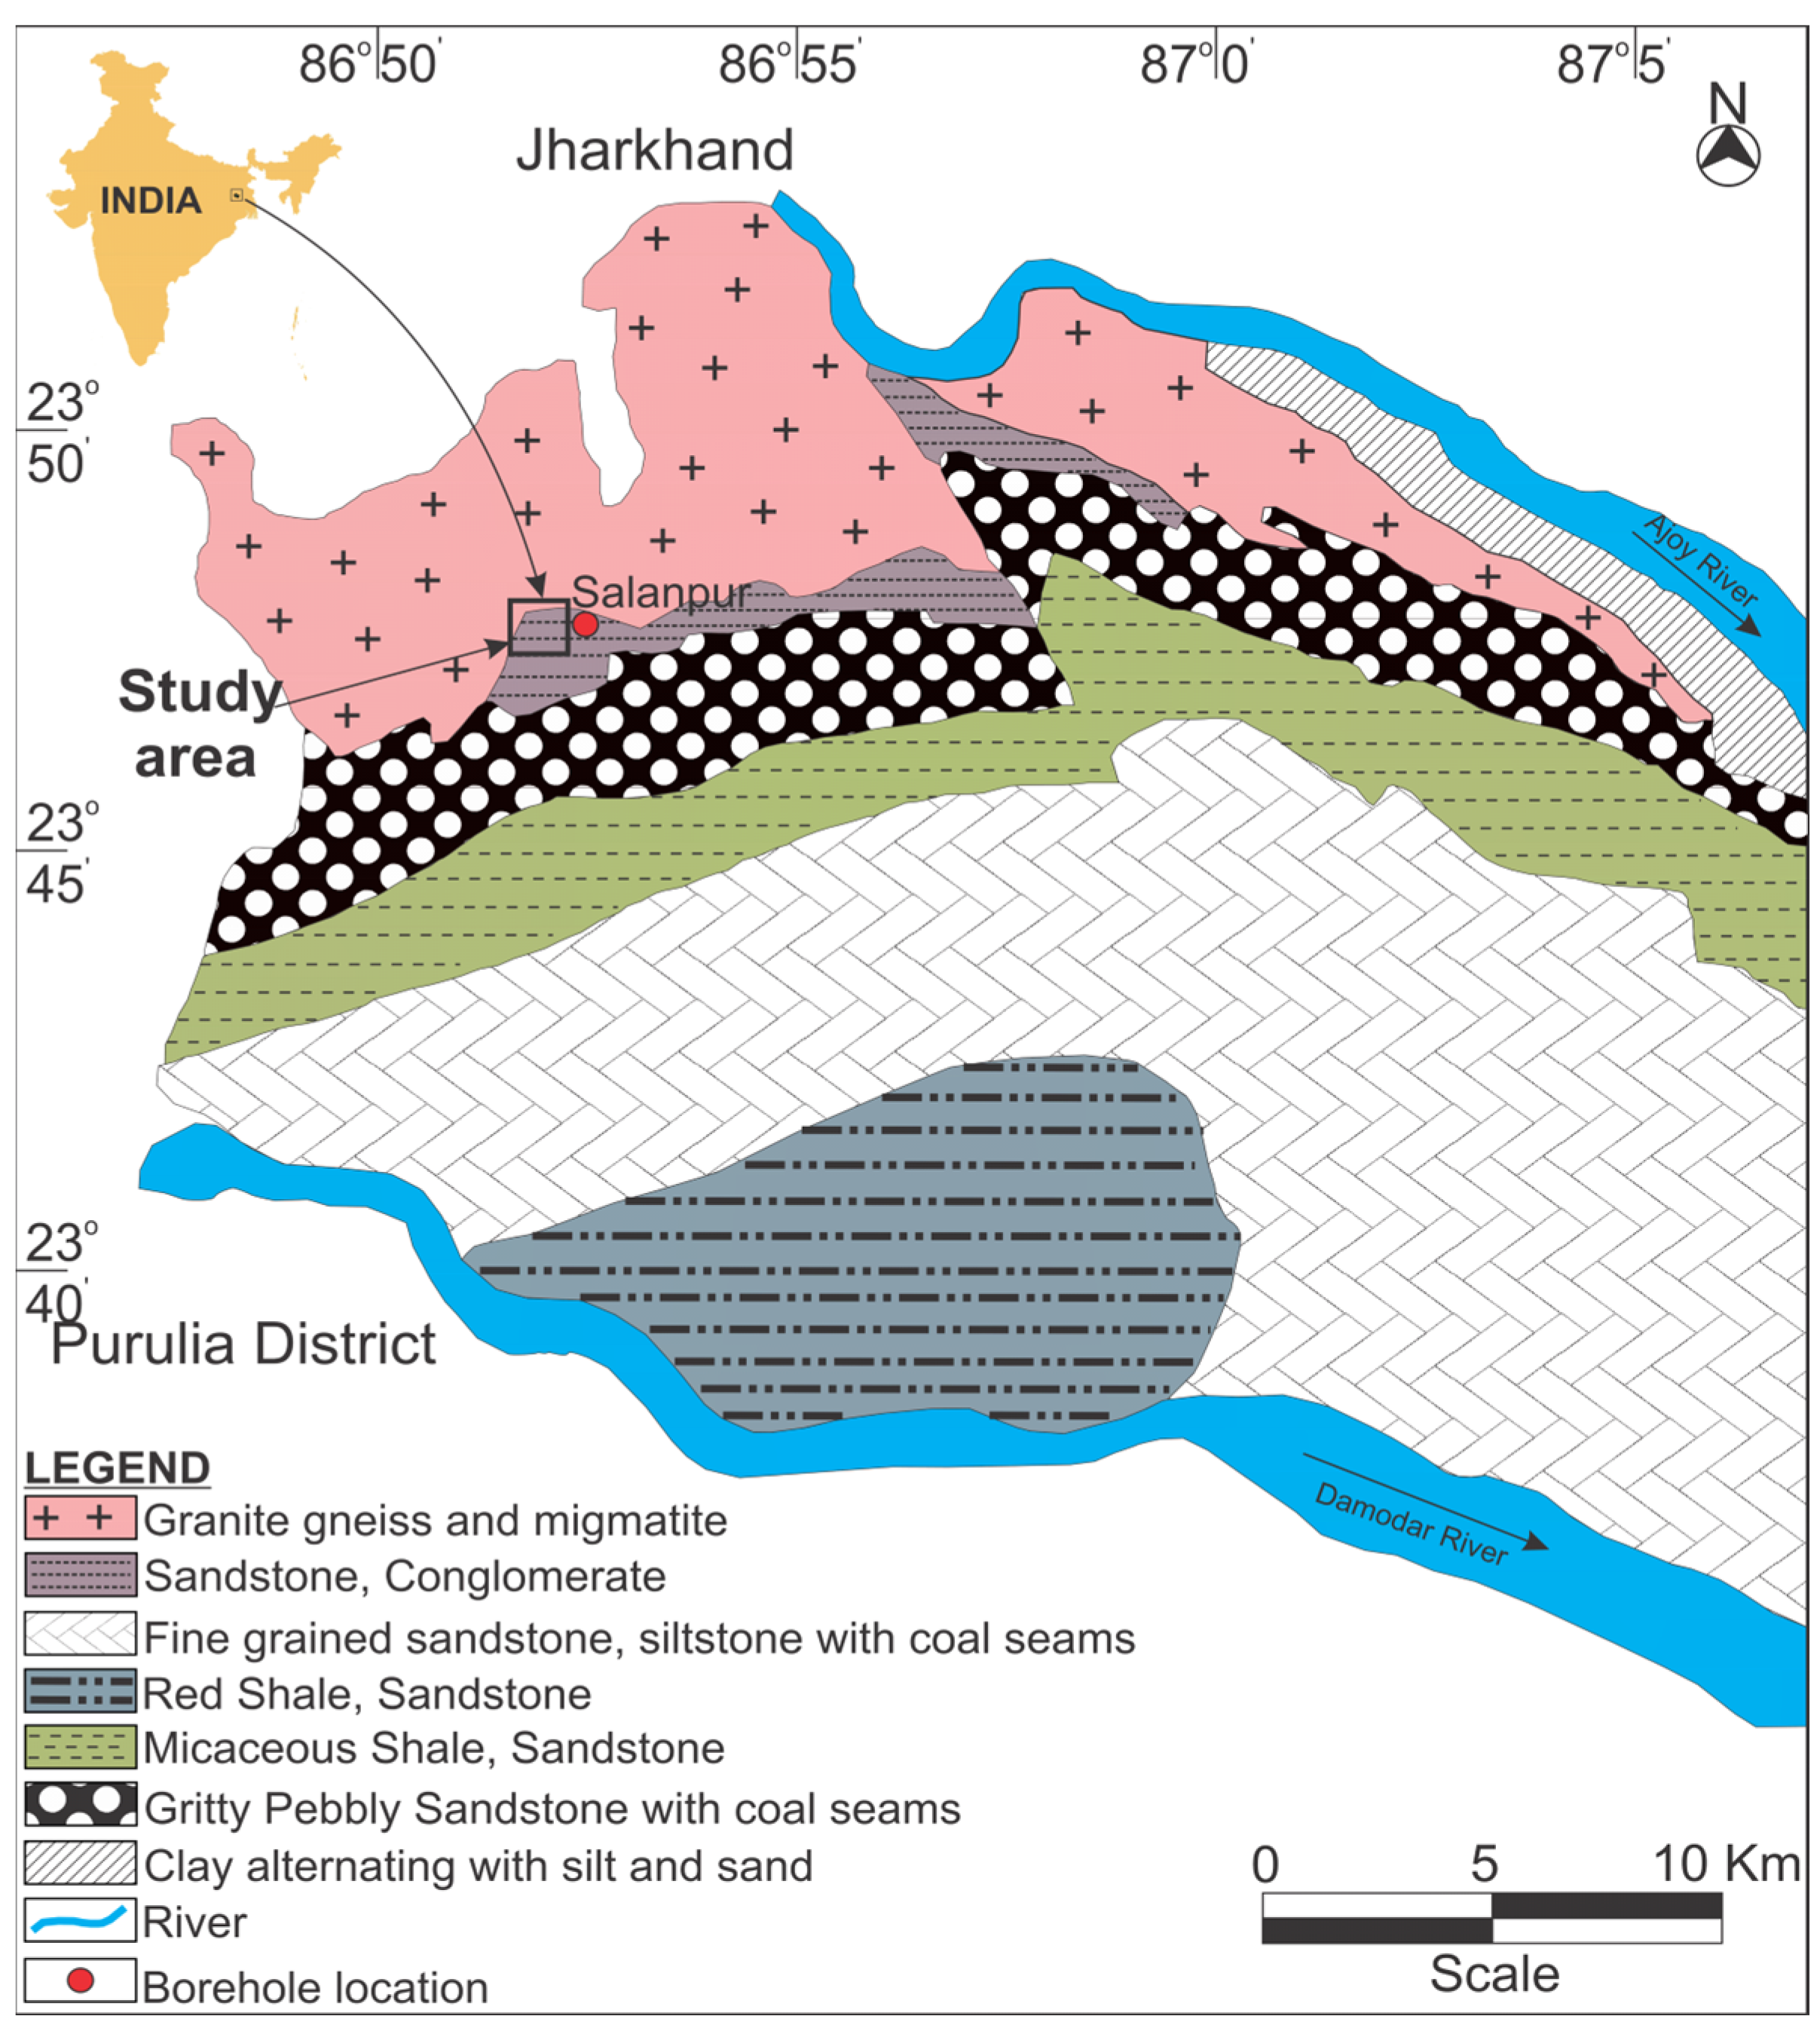
Figure 1. Geological map in and around the study area (Salanpur) in the Western Burdwan district, West Bengal, India.
Minerals 14 00102 g001
Figure 2. (a) Layout of 3D ERT data acquisition; (b) Layout of quasi-3D ERT data acquisition.
Minerals 14 00102 g002
Figure 3. The borehole section shows lithological variation from top to bottom (in meters).
Minerals 14 00102 g003
Figure 4. (a) 2D ERT apparent resistivity pseudosection of profile 1 from the Dipole–dipole array and (b) 2D ERT inversion result of profile 1.
Minerals 14 00102 g004
Figure 5. 2D ERT inversion result of profile 2 from the Dipole–dipole array.
Minerals 14 00102 g005
Figure 6. 2D ERT inversion result of profile 3 from the Dipole–dipole array.
Minerals 14 00102 g006
Figure 7. 2D ERT inversion result of profile 4 (a) and profile 5 (b) from the Dipole–dipole array.
Minerals 14 00102 g007
Figure 8. Horizontal depth slices in the x-z plane after 3D inversion.
Minerals 14 00102 g008
Figure 9. (a) Error distribution bar chart; (b) Measured and calculated apparent resistivity correlation plot.
Minerals 14 00102 g009
Figure 10. 3D ERT slices (yellow circle denoting coal seam in each slice).
Minerals 14 00102 g010
Figure 11. Section showing the variation of cohesion against depth (z) for profile 1.
Minerals 14 00102 g011
Figure 12. Section showing the variation of the plastic index against depth (z) for profile 1.
Minerals 14 00102 g012
Figure 13. Section showing the moisture content variation against depth (z) for profile 1.
Minerals 14 00102 g013
Figure 14. Section showing the variation of the angle of friction against depth (z) for profile 1.
Minerals 14 00102 g014
Disclaimer/Publisher’s Note: The statements, opinions and data contained in all publications are solely those of the individual author(s) and contributor(s) and not of MDPI and/or the editor(s). MDPI and/or the editor(s) disclaim responsibility for any injury to people or property resulting from any ideas, methods, instructions or products referred to in the content.