

High-Temperature Vibrational Analysis of the Lithium Mica: 2M2 Lepidolite


 ,
,
Abstract
:1. Introduction
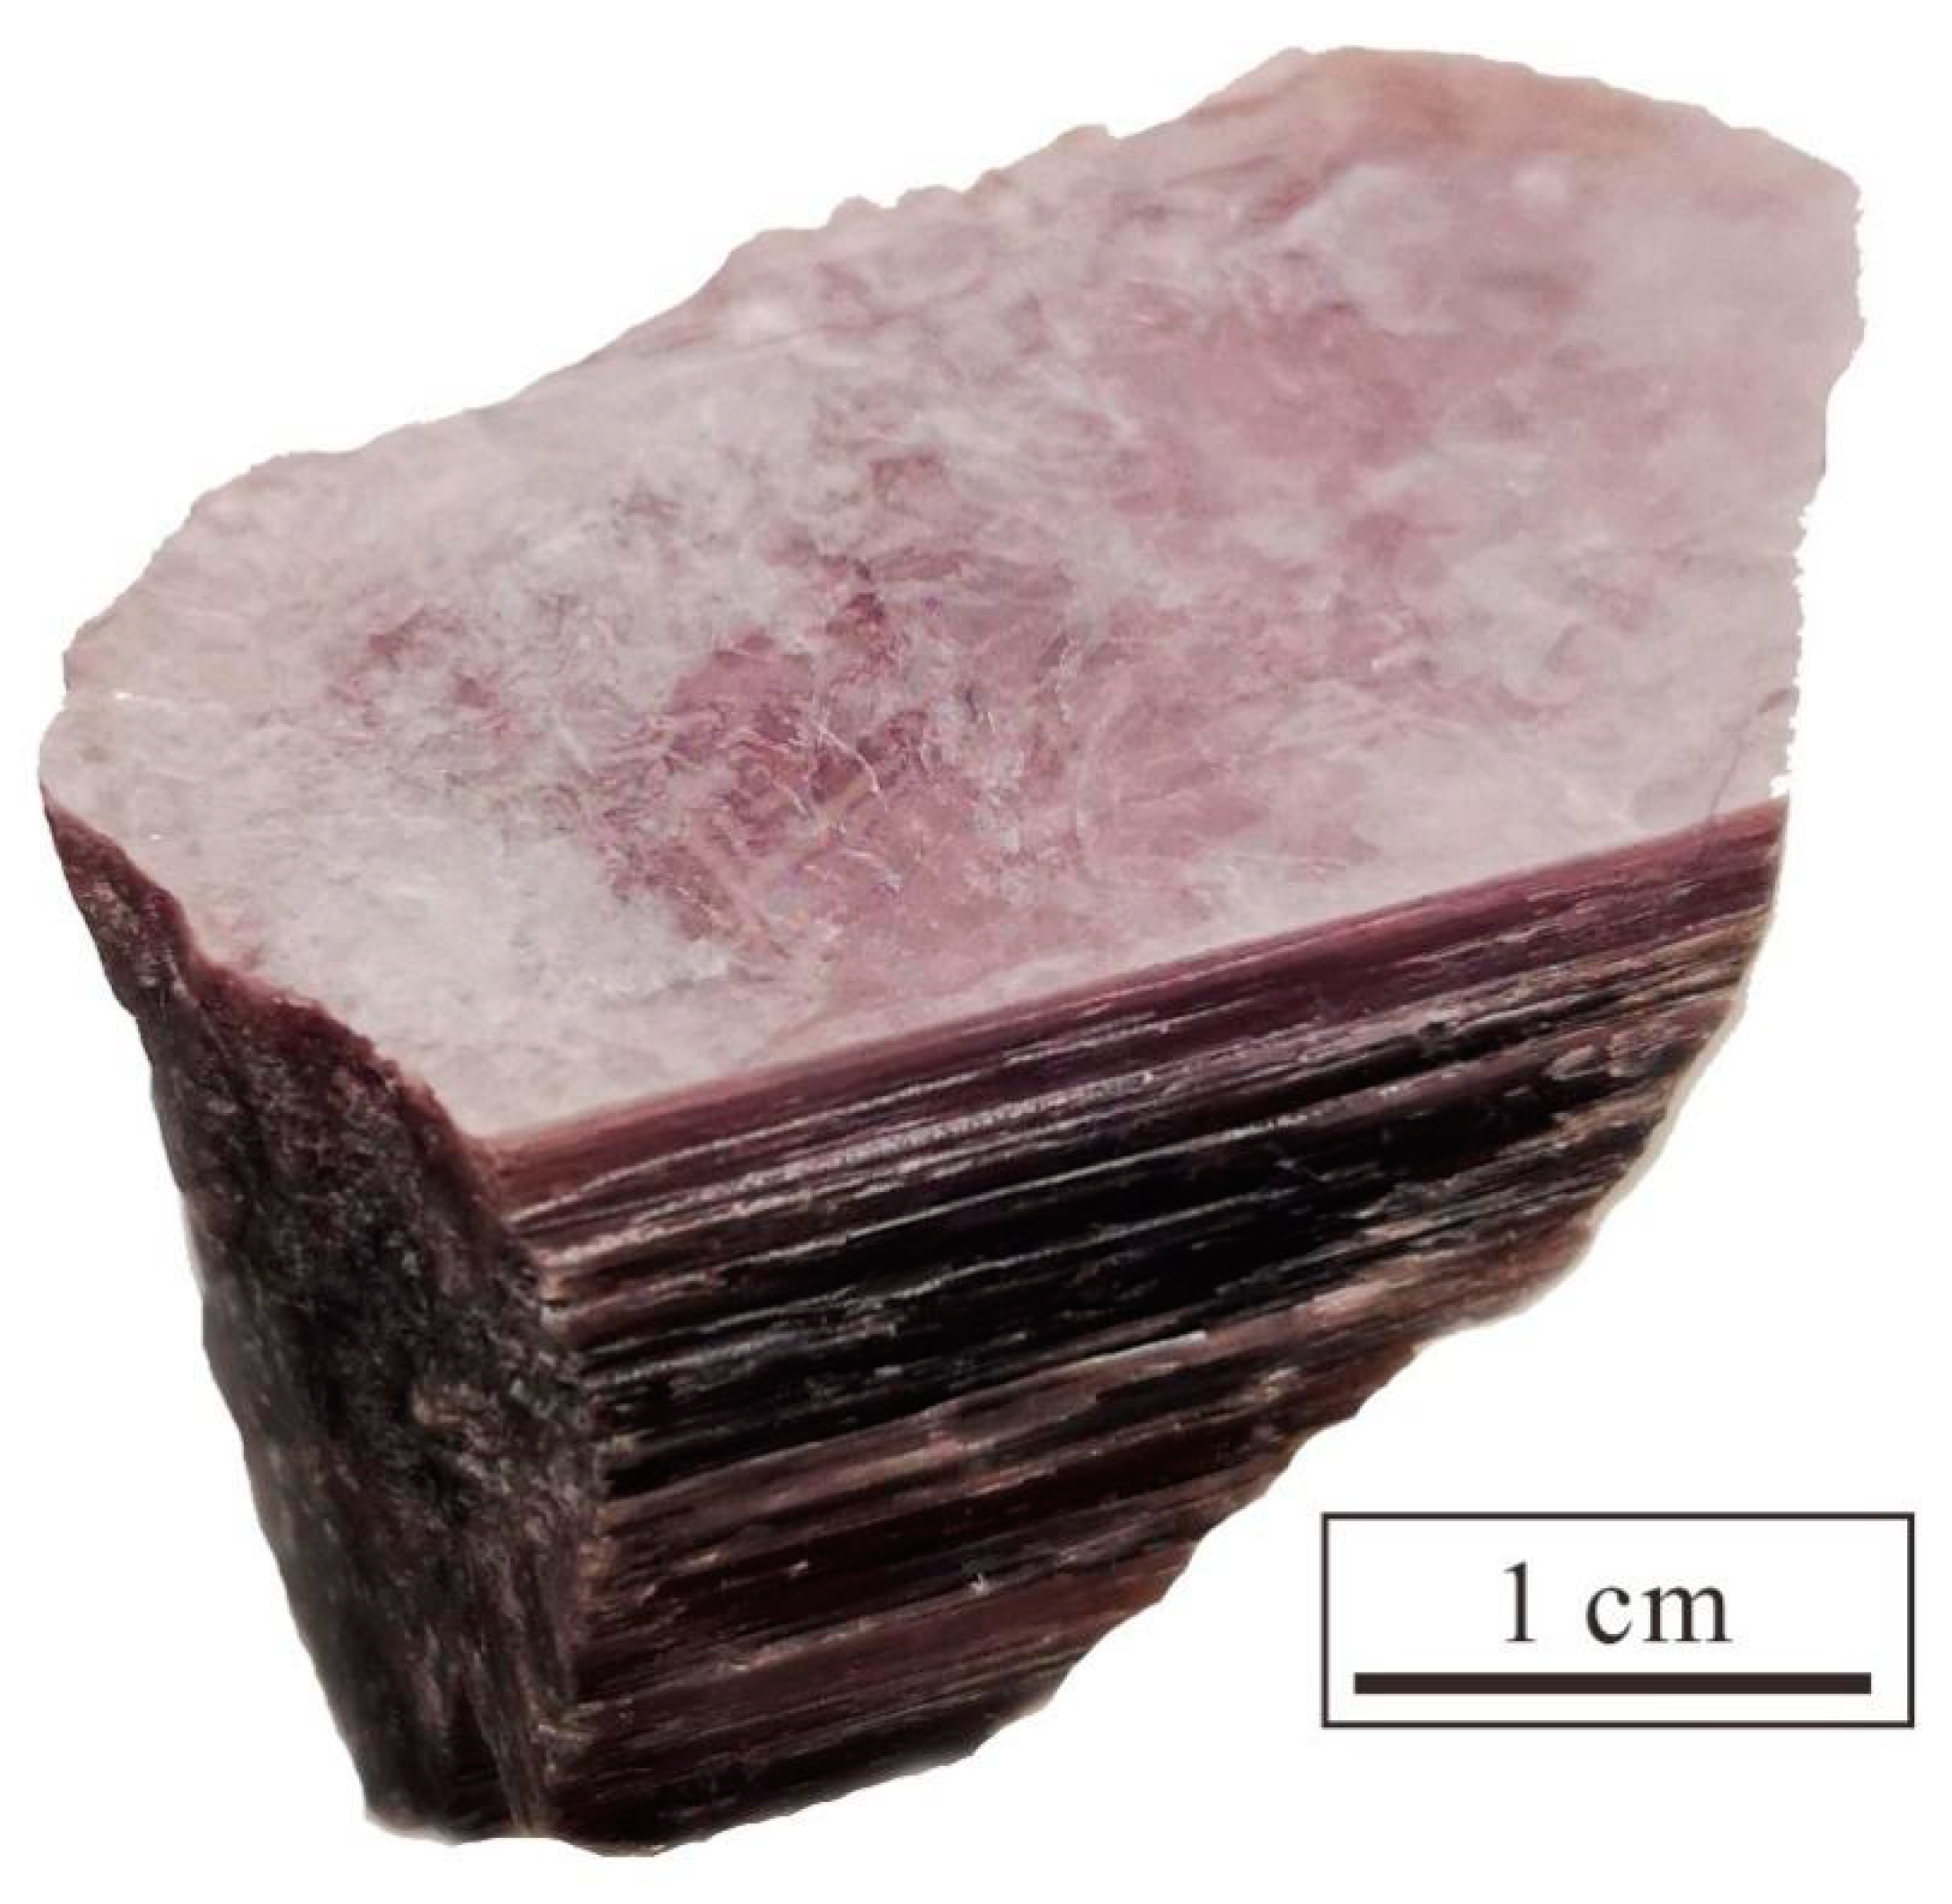
2. Experimental Methods
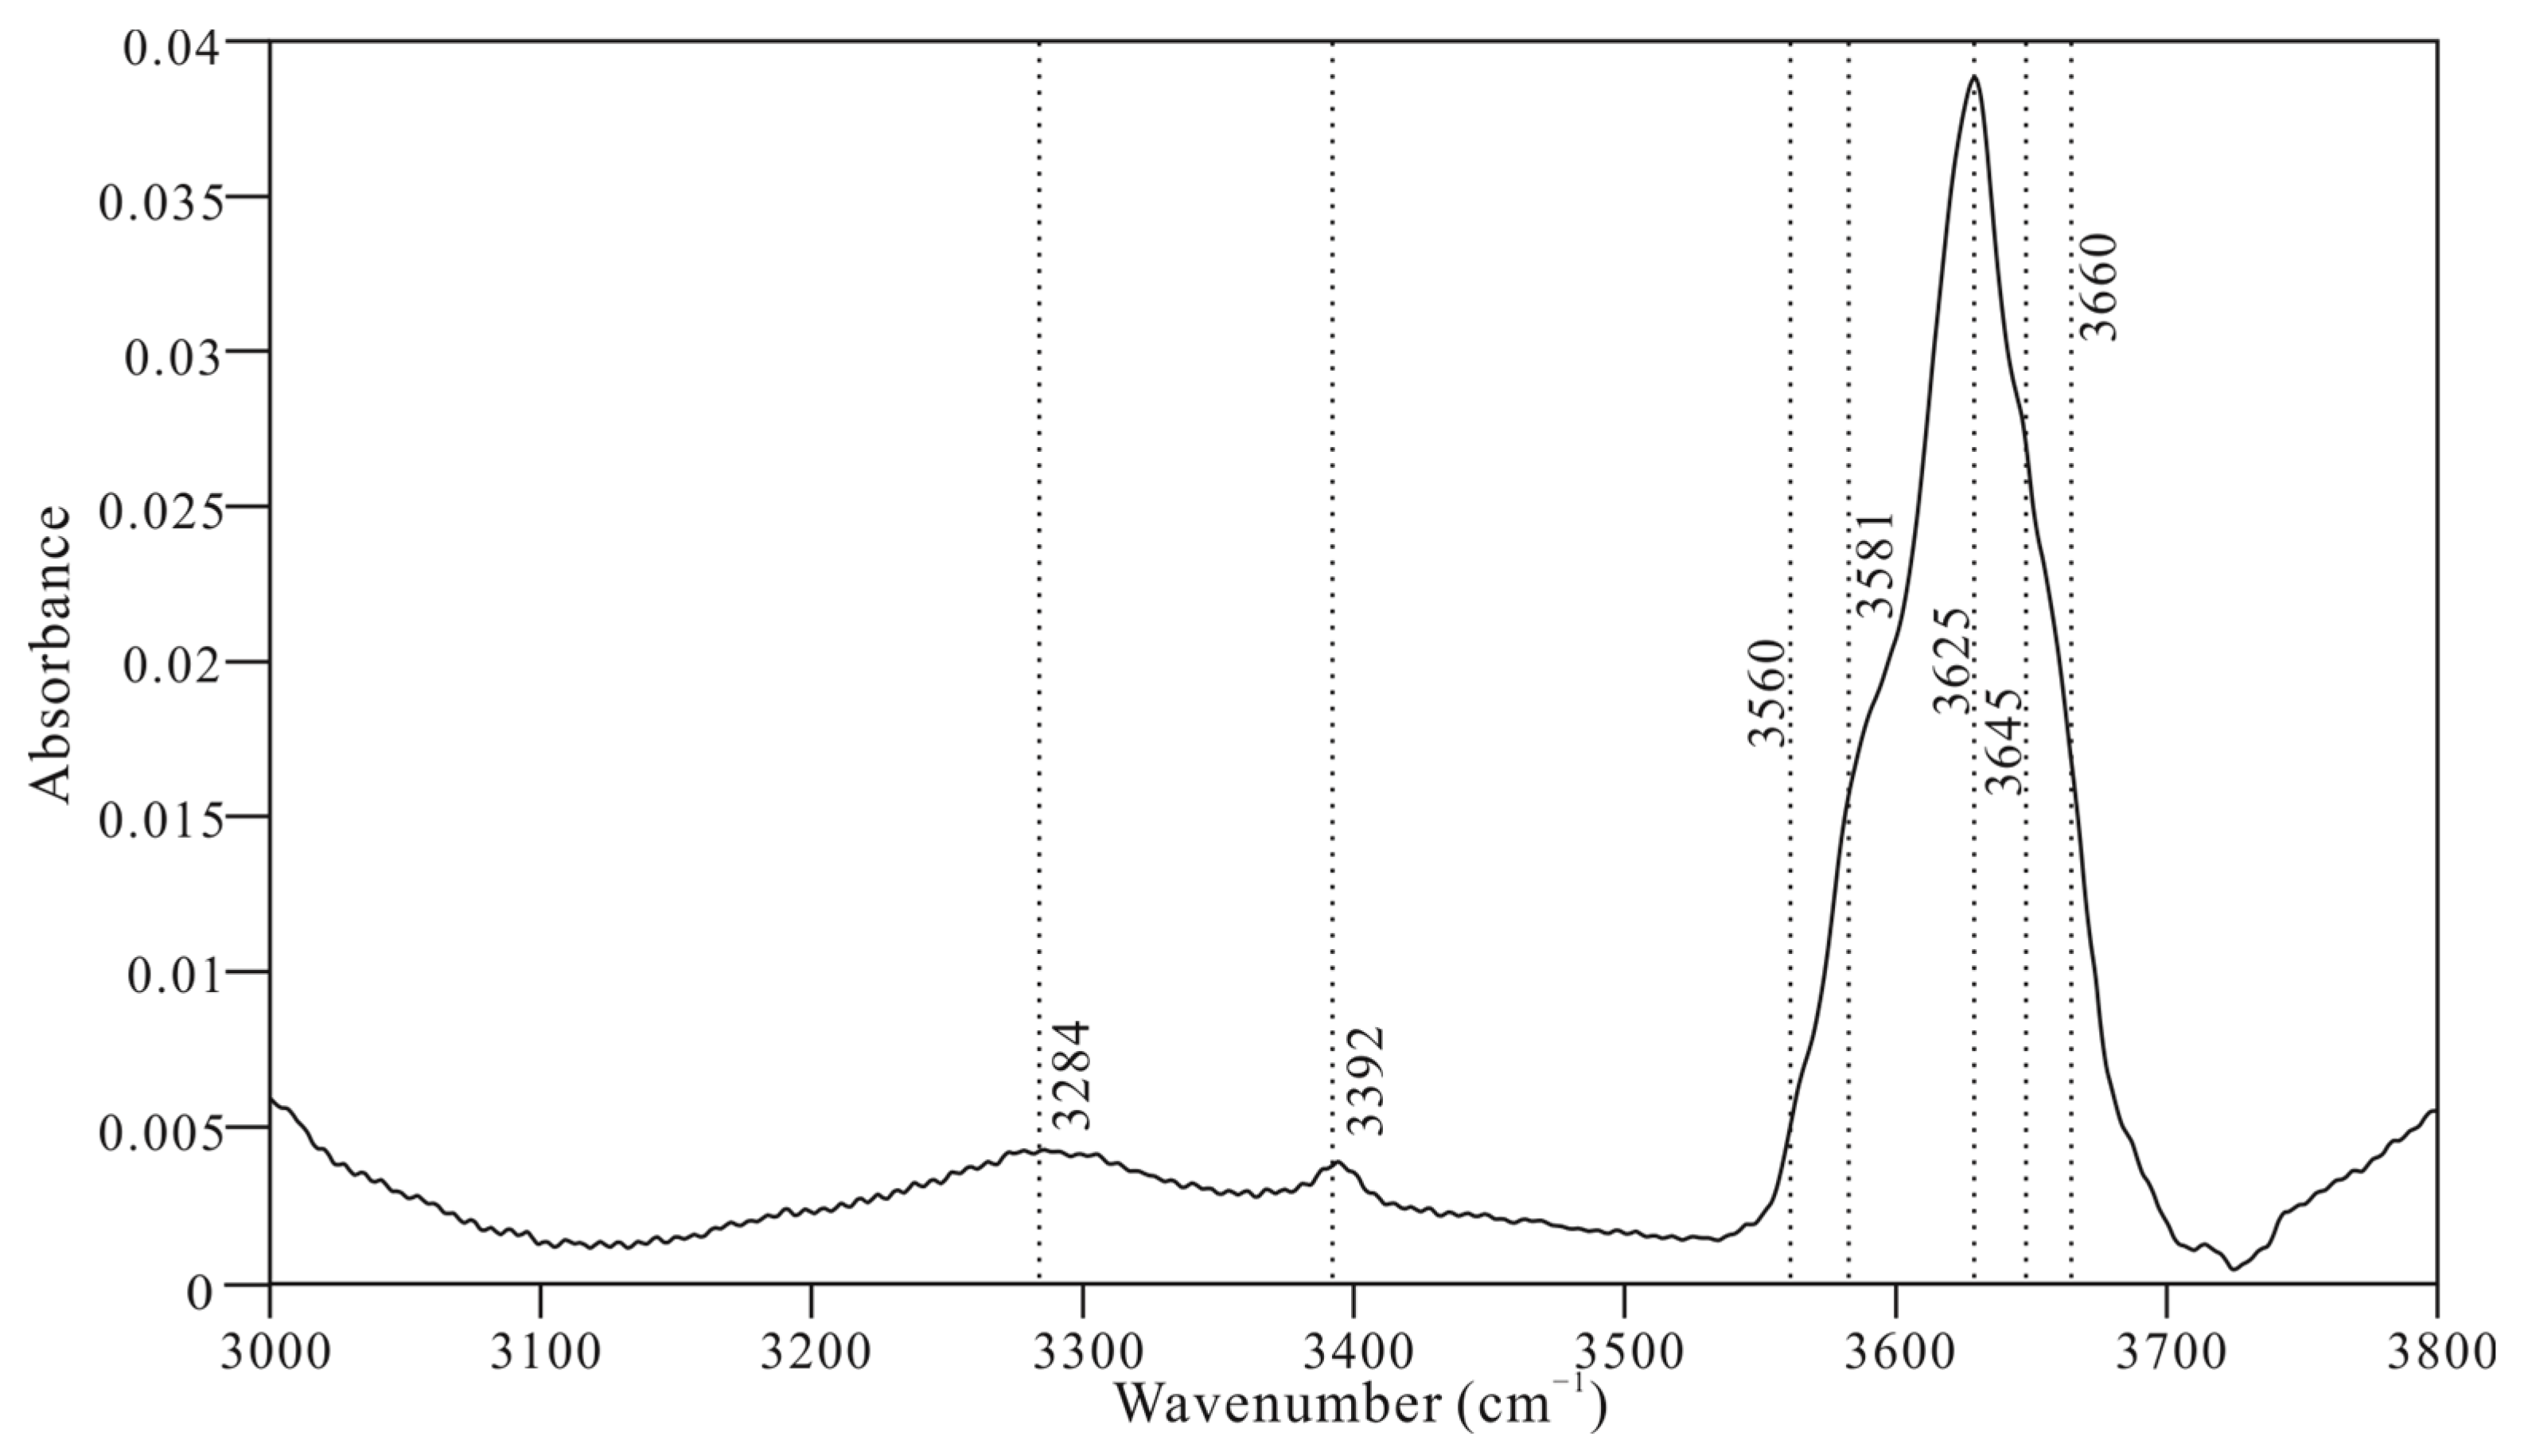
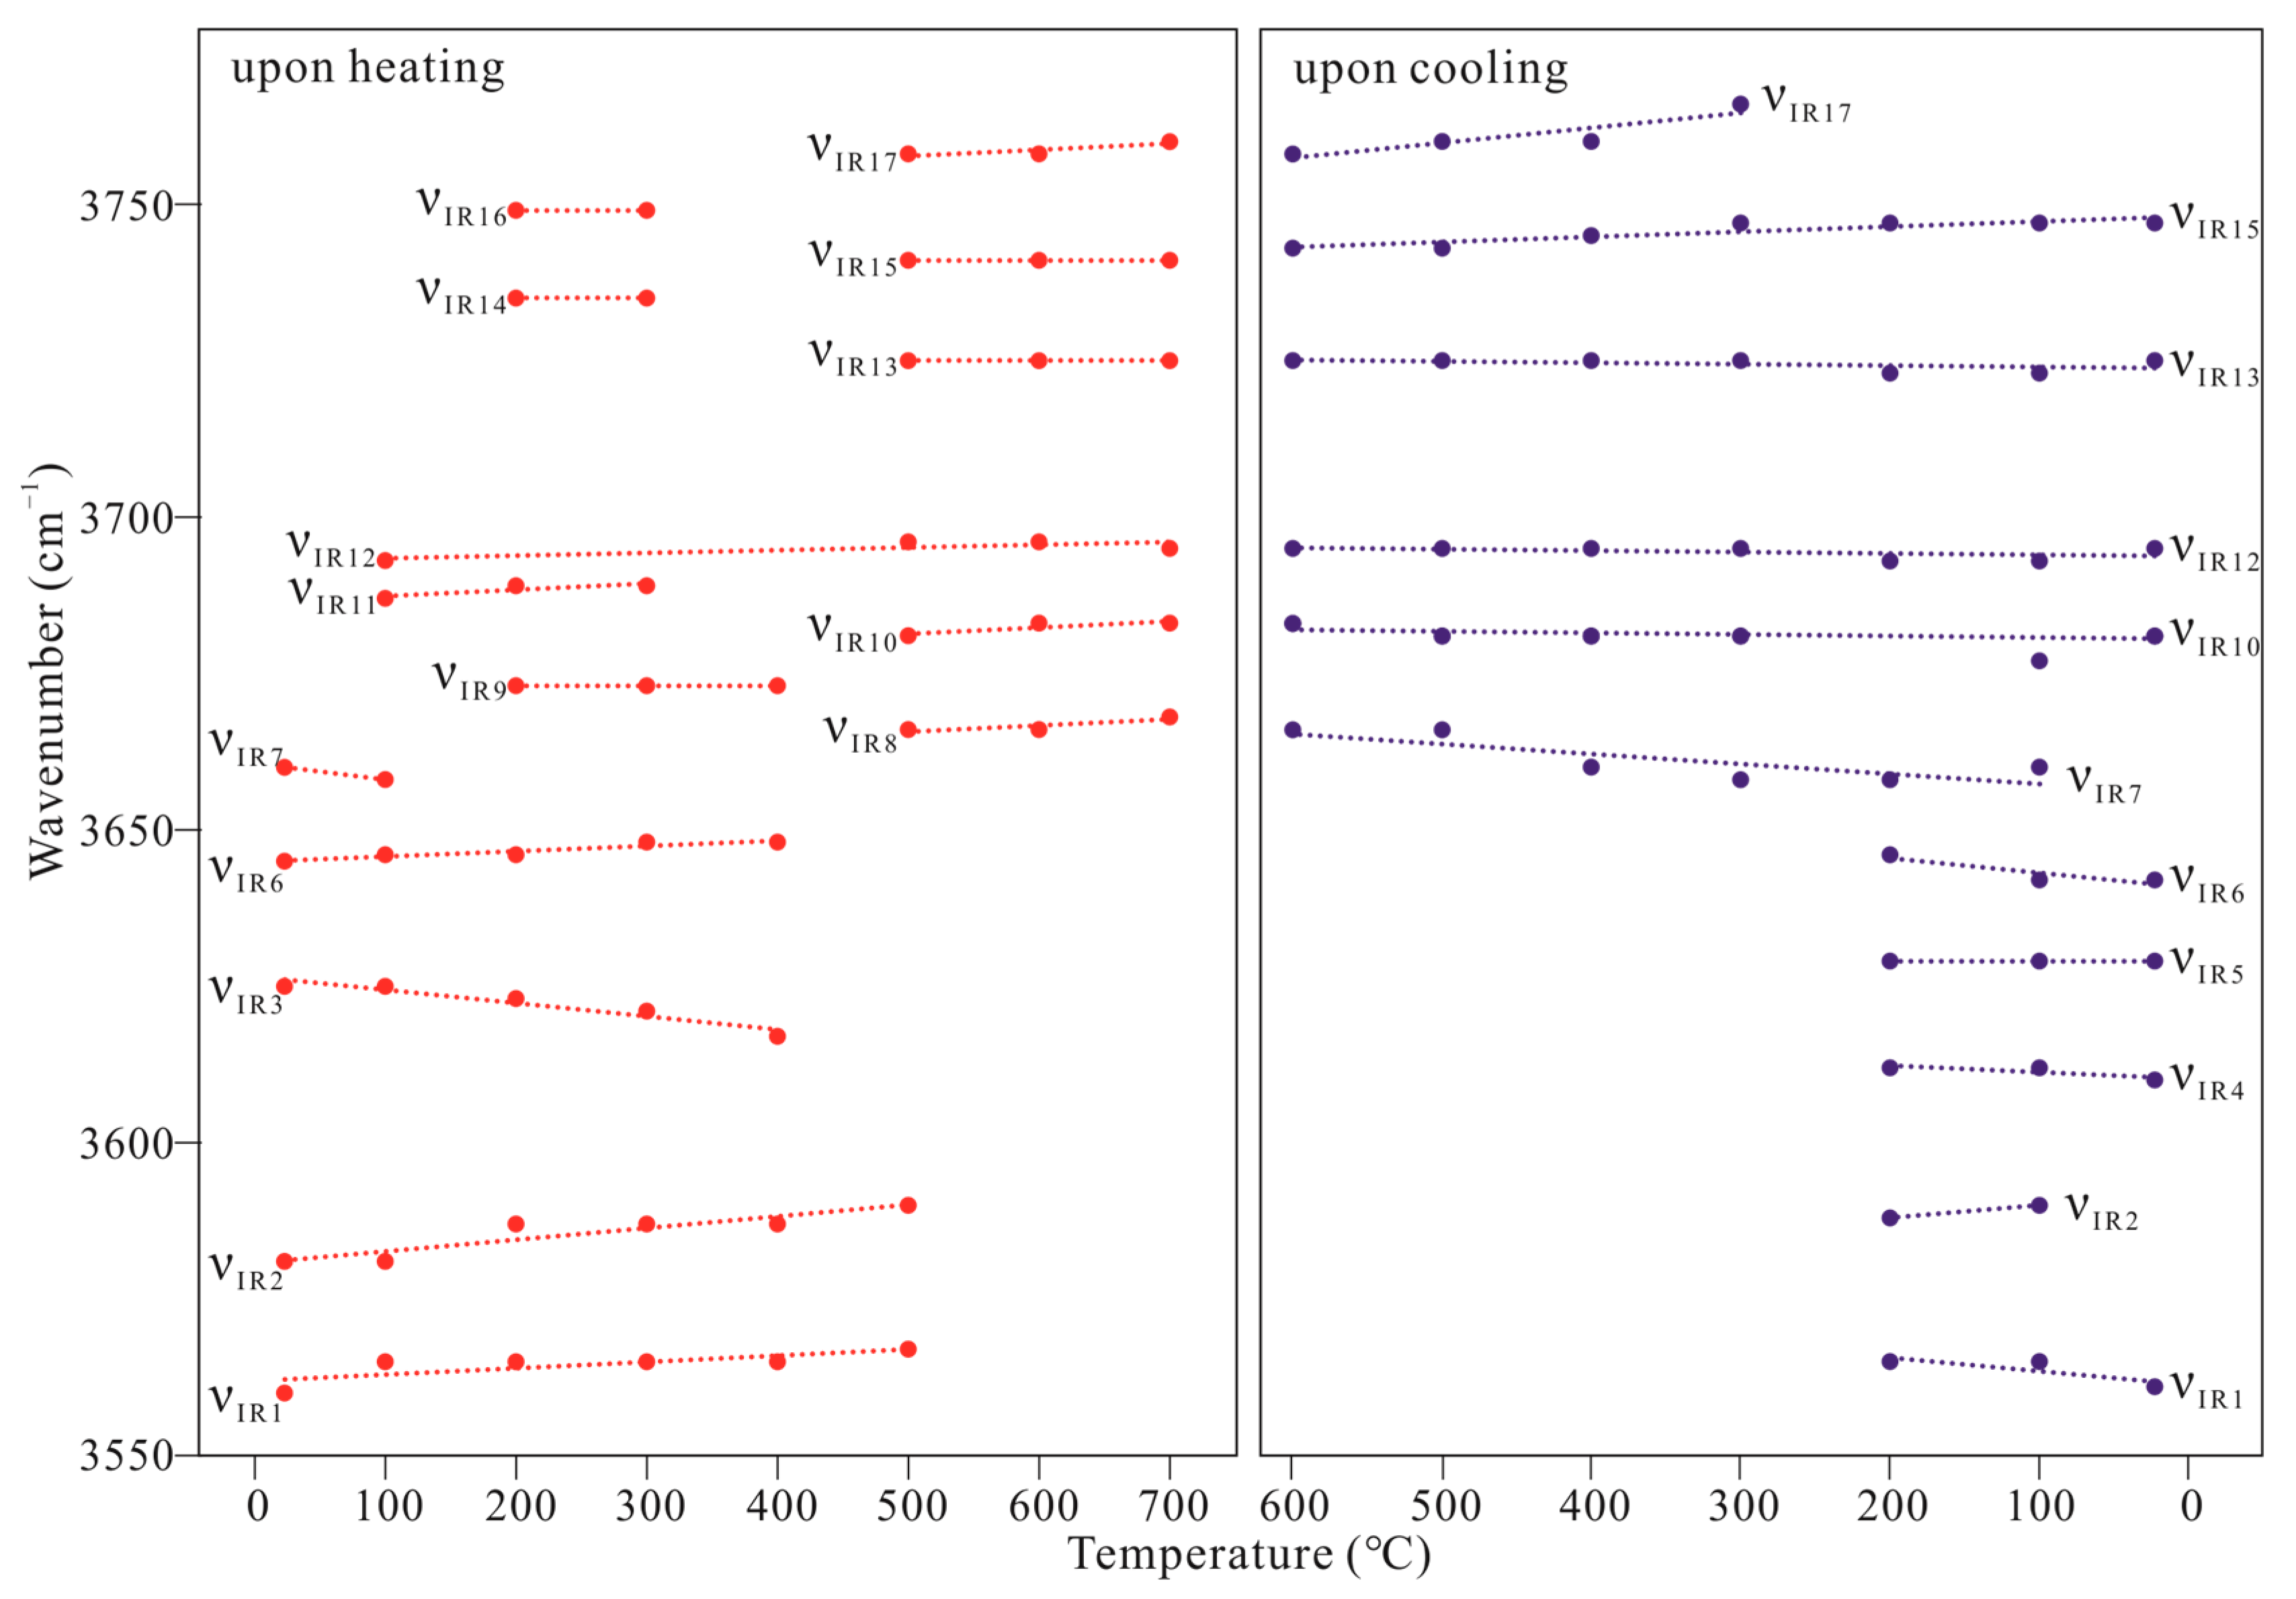
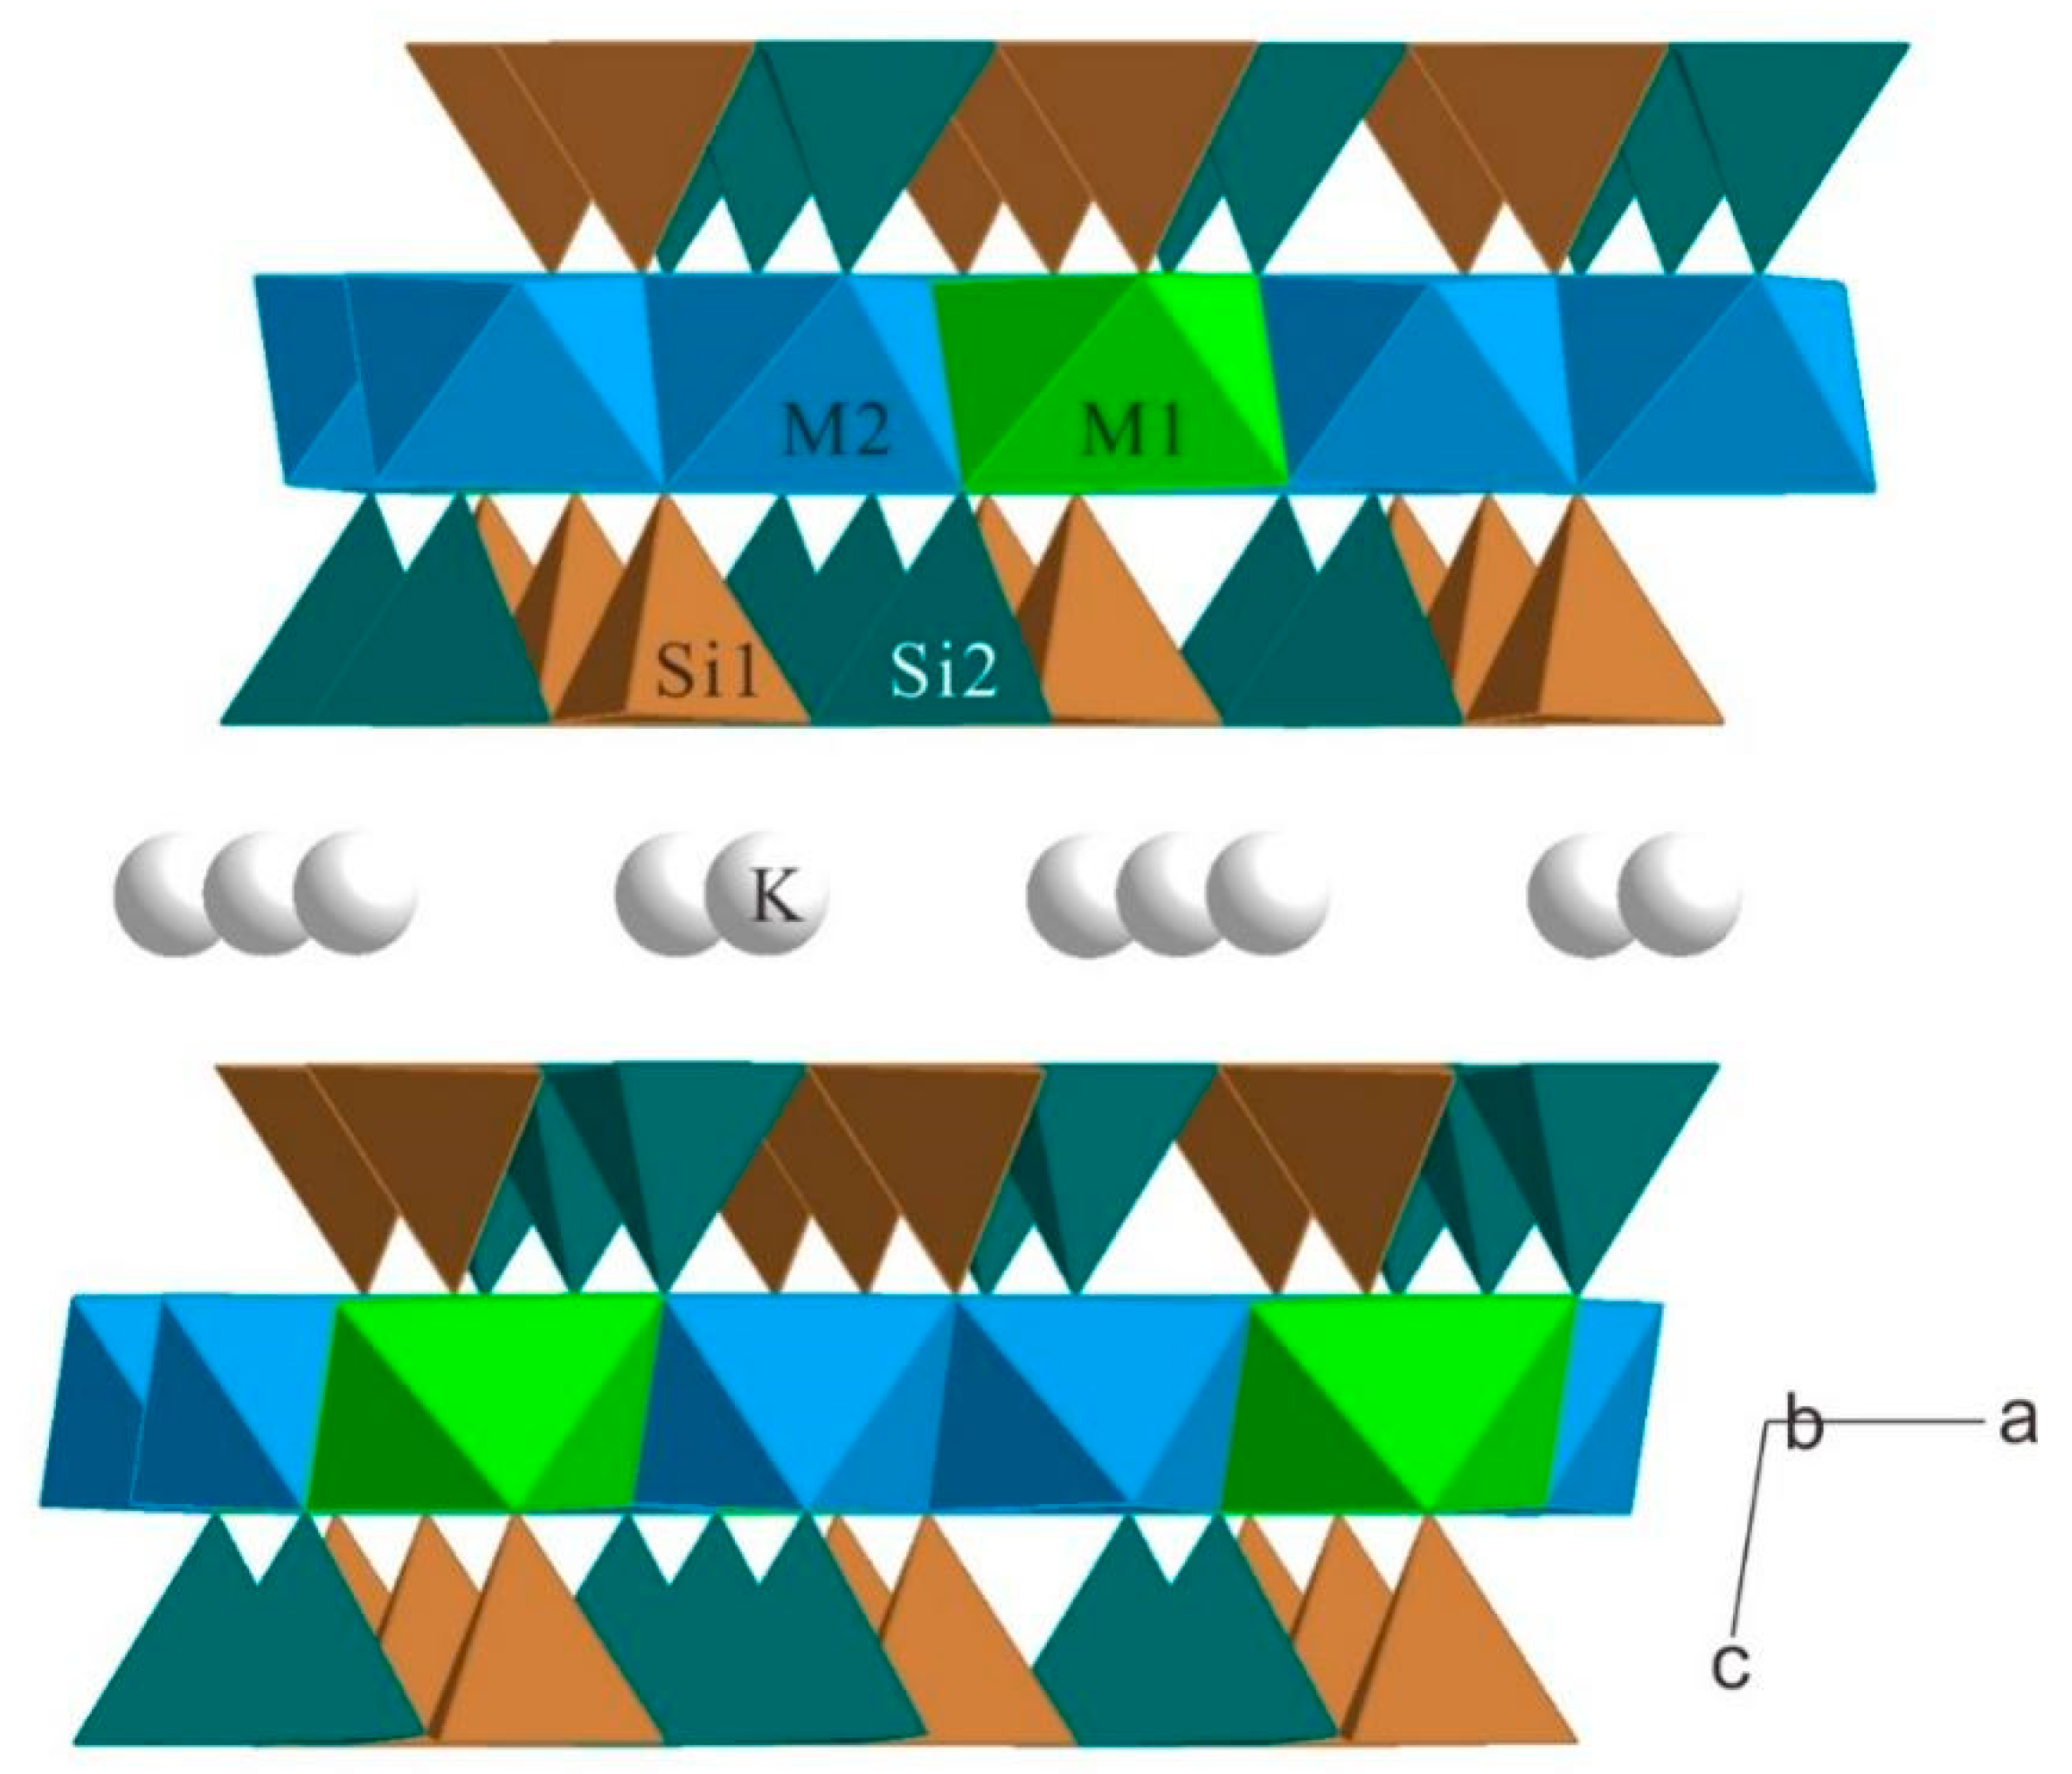
3. Result and Discussion
4. Conclusions
Author Contributions
Funding
Data Availability Statement
Conflicts of Interest
References
- Grew, E.S.; Bosi, F.; Ros, L.; Kristiansson, P.; Gunter, M.E.; Halenius, U.; Trumbull, R.B.; Yates, M. Fluor-elbaite, lepidolite and Ta-Nb oxides from a pegmatite of the 3000 Ma Sinceni Pluton, Swaziland: Evidence for lithium-cesium-tantalum (LCT) pegmatites in the Mesoarchean. Eur. J. Miner. 2018, 30, 205–218. [Google Scholar] [CrossRef]
- Ogorodova, L.P.; Kiseleva, I.A.; Melchakova, L.V. Thermodynamic properties of lithium micas. Geochem. Int. 2010, 48, 415–418. [Google Scholar] [CrossRef]
- Roda, E.; Keller, P.; Pesquera, A.; Fontan, F. Micas of the muscovite-lepidolite series from Karibib pegmatites, Namibia. Miner. Mag. 2007, 71, 41–62. [Google Scholar] [CrossRef]
- Lv, Y.; Ma, B.; Liu, Y.; Wang, C.; Zhang, W.; Chen, Y. Selective extraction of cesium from high concentration rubidium chloride leach liquor of lepidolite. Desalination 2022, 530, 115673. [Google Scholar] [CrossRef]
- Munoz, J.L. Physical properties of synthetic lepidolites. Am. Miner. 1968, 53, 1490–1512. [Google Scholar]
- Ogorodova, L.P.; Kiseleva, I.A.; Melchakova, L.V.; Schuriga, T.N. Thermodynamic properties of lithium mica: Lepidolite. Thermochim. Acta 2005, 43, 68–70. [Google Scholar] [CrossRef]
- Paukov, I.E.; Kovalevskaya, Y.A.; Kiseleva, I.A.; Schuriga, T.N. Thermodynamic properties of natural lepidolite. Geochem. Int. 2007, 45, 559–563. [Google Scholar] [CrossRef]
- Zhang, X.; Chen, Z.; Rohani, S.; He, M.; Tan, X.; Liu, W. Simultaneous extraction of lithium, rubidium, cesium and potassium from lepidolite via roasting with iron(II) sulfate followed by water leaching. Hydrometallurgy 2022, 208, 105820. [Google Scholar] [CrossRef]
- Brown, B.E. The crystal structure of a 3T lepidolite. Am. Miner. 1978, 63, 332–336. [Google Scholar]
- Guggenheim, S. Cation ordering in lepidolite. Am. Miner. 1981, 66, 1221–1232. [Google Scholar]
- Swanson, T.H.; Bailey, S.W. Redetermination of the lepidolite-2M1 structure. Clay Clay Miner. 1981, 29, 81–90. [Google Scholar] [CrossRef]
- Sartori, F.; Franzini, M.; Merlino, S. Crystal structure of a 2M2 lepidolite. Acta Crystallogr. B 1973, 29, 573–578. [Google Scholar] [CrossRef]
- Robert, J.; Beny, J.; Beny, C.; Volfinger, M. Characterization of lepidolites by Raman and infrared spectrometries. I. Relationships between OH-stretching wavenumbers and composition. Can. Miner. 1989, 27, 225–235. [Google Scholar]
- Bebout, G.E.; Bebout, A.E.; Graham, C.M. Cycling of B, Li, and LILE (K, Cs, Rb, Ba, Sr) into subduction zones: SIMS evidence from micas in high-P/T metasedimentary rocks. Chem. Geol. 2007, 239, 284–304. [Google Scholar] [CrossRef]
- Sheldrick, G.M. SHELXL: Programs for Crystal Structure Analysis; University of Göttingen: Göttingen, Germany, 2018. [Google Scholar]
- Farrugia, L.J. WinGX suite for small-molecule single-crystal crystallography. J. Appl. Crystallogr. 1999, 32, 837–838. [Google Scholar] [CrossRef]
- Prince, E. Volume C: Mathematical Physical and Chemical Tables. In International Tables for Crystallography, 3rd ed.; Reidel: Dordrecht, The Netherlands, 2004. [Google Scholar]
- He, X.; Zhang, L.; Kagi, H.; Smyth, J.R.; Komatsu, K.; Li, X.; Gao, J.; Lei, L. In-Situ high-pressure and high-temperature spectroscopic studies of phengite in ultrahigh-pressure eclogite: Implications for water transport during ultra-deep continental subduction. Phys. Chem. Miner. 2022, 49, 24. [Google Scholar] [CrossRef]
- Ross, M.; Takeda, H.; Wones, D.R. Mica polytypes: Systematic description and identification. Science 1966, 151, 191–193. [Google Scholar] [CrossRef]
- Tindle, A.G.; Webb, P.C. Estimation of lithium contents in trioctahedral micas using microprobe data: Application to micas from granitic rocks. Eur. J. Miner. 1990, 2, 595–610. [Google Scholar] [CrossRef]
- Tian, R.; Zhang, H.; Lyu, Z.; Tang, Y. Mineralogical characteristics of micas in the Xiaohusite No. 91 pegmatite dyke in the Koktokay area, Xinjiang and their geological significances. Acta Miner. Sin. 2021, 41, 593–609. [Google Scholar]
- McKeown, D.A.; Bell, M.I.; Etz, E.S. Vibrational analysis of the dioctahedral mica: 2M1 muscovite. Am. Miner. 1999, 84, 1041–1048. [Google Scholar] [CrossRef]
- Williams, Q.; Knittle, E.; Scott, H.P.; Liu, Z.X. The high-pressure behavior of micas: Vibrational spectra of muscovite, biotite, and phlogopite to 30 GPa. Am. Miner. 2012, 97, 241–252. [Google Scholar] [CrossRef]
- Goryainov, S.V.; Krylov, A.S.; Polyansky, O.P.; Vtyurin, A.N. In-situ Raman study of phengite compressed in water medium under simultaneously high P–T parameters. J. Raman Spectrosc. 2017, 48, 1431–1437. [Google Scholar] [CrossRef]
- Wang, Y.; Yuan, X.; Fu, H. Mineralogical characteristics of gem-quality lepidolite rock in Xinjiang. J. Gem Gemmol. 2014, 16, 22–28. [Google Scholar]
- Huang, W.H.; Yang, Y.; Qi, Z.M.; Liu, W.D.; Wang, Z.P.; Liu, Y.; Xia, Q.K. Ammonium impacts on vibrations of hydroxyl and lattice of phengite at high temperature and high pressure. J. Earth Sci. 2021, 32, 1278–1286. [Google Scholar] [CrossRef]
- Johnson, E.A. Water in nominally anhydrous crustal minerals: Speciation, concentration, and geologic significance. Rev. Mineral. Geochem. 2006, 62, 117–154. [Google Scholar] [CrossRef]
- Shannon, R.D. Revised effective ionic-radii and systematic studies of interatomic distances in halides and chalcogenides. Acta Crystallogr. A 1976, 32, 751–767. [Google Scholar] [CrossRef]
- Pavese, A.; Ferraris, G.; Prencipe, M.; Ibberson, R. Cation site ordering in phengite 3T from the Dora-Maira massif (western Alps): A variable-temperature neutron powder diffraction study. Eur. J. Miner. 1997, 9, 1183–1190. [Google Scholar] [CrossRef]
- Pavese, A.; Ferraris, G.; Pischedda, V.; Ibberson, R. Tetrahedral order in phengite 2M1 upon heating, from powder neutron diffraction, and thermodynamic consequences. Eur. J. Miner. 1999, 11, 309–320. [Google Scholar] [CrossRef]
- Libowitzky, E. Correlation of O–H stretching frequencies and O–H⋯O hydrogen bond lengths in minerals. Monatsh. Chem. 1999, 130, 1047–1059. [Google Scholar] [CrossRef]
- Robert, J.L.; Kodama, H. Generalization of the correlations between hydroxyl-stretching wavenumbers and composition of micas in the system K2O-MgO-Al2O3-SiO2-H2O: A single model for trioctahedral and dioctahedral micas. Am. J. Sci. 1988, 288, 196–212. [Google Scholar]
- Lin, J.C.; Guggenheim, S. The crystal structure of a Li, Be-rich brittle mica: A dioctahedral-trioctahedral intermediate. Am. Miner. 1983, 68, 130–142. [Google Scholar]


| a | b | c | β | Volume a | Space Group | |
|---|---|---|---|---|---|---|
| 9.014(6) | 5.202(4) | 20.223(14) | 99.3302 | 935.59 | C2/c | |
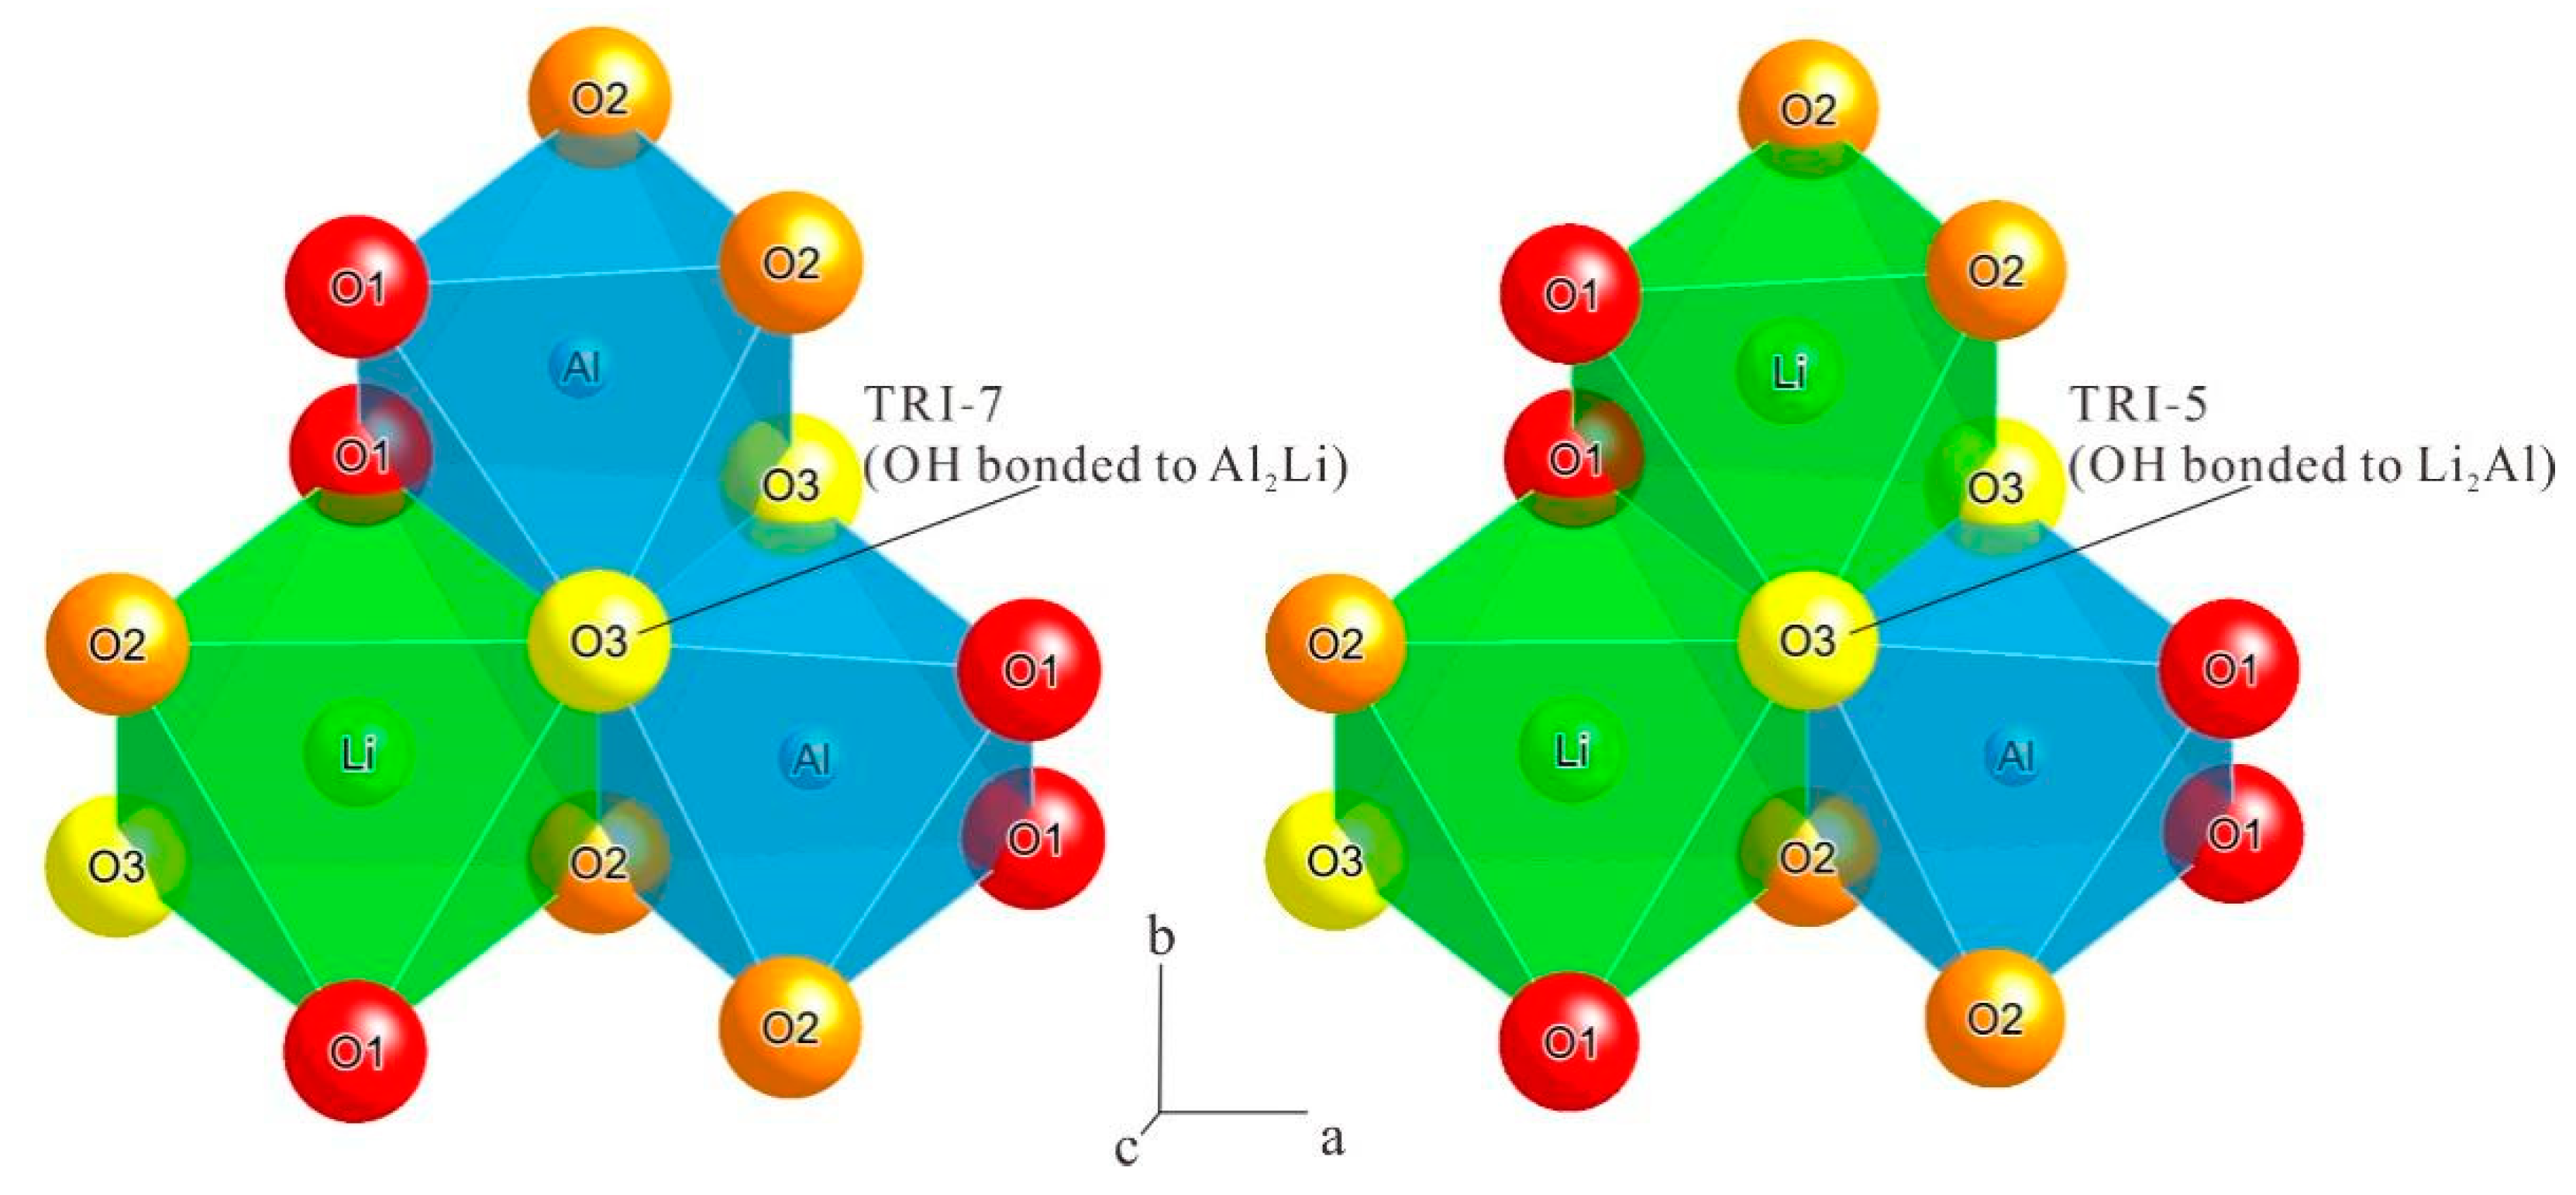
| □ | M2 (Al/Li) | K | M1 (Li) | Si1 (Si/Al) | Si2 (Si/Al) | □ |
| X | 0.579(3) | 0.5 | 0.25 | 0.790(4) | 0.131(5) | |
| Y | 0.220(11) | 0.422(6) | 0.25 | 0.417(10) | 0.405(7) | |
| Z | 0 | 0.25 | 0 | 0.130(1) | 0.135(3) | |
| Volume b | 10.203 | – | 12.118 | 2.254 | 2.147 | |
| □ | O1 | O2 | O3(F) | O4 | O5 | O6 |
| X | 0.770(5) | 0.100(5) | 0.442(5) | 0.702(8) | 0.254(9) | 0.975(8) |
| Y | 0.387(7) | 0.425(8) | 0.424(6) | 0.179(12) | 0.179 | 0.403(11) |
| Z | 0.050(3) | 0.059(4) | 0.047(1) | 0.168(5) | 0.164(5) | 0.166(3) |
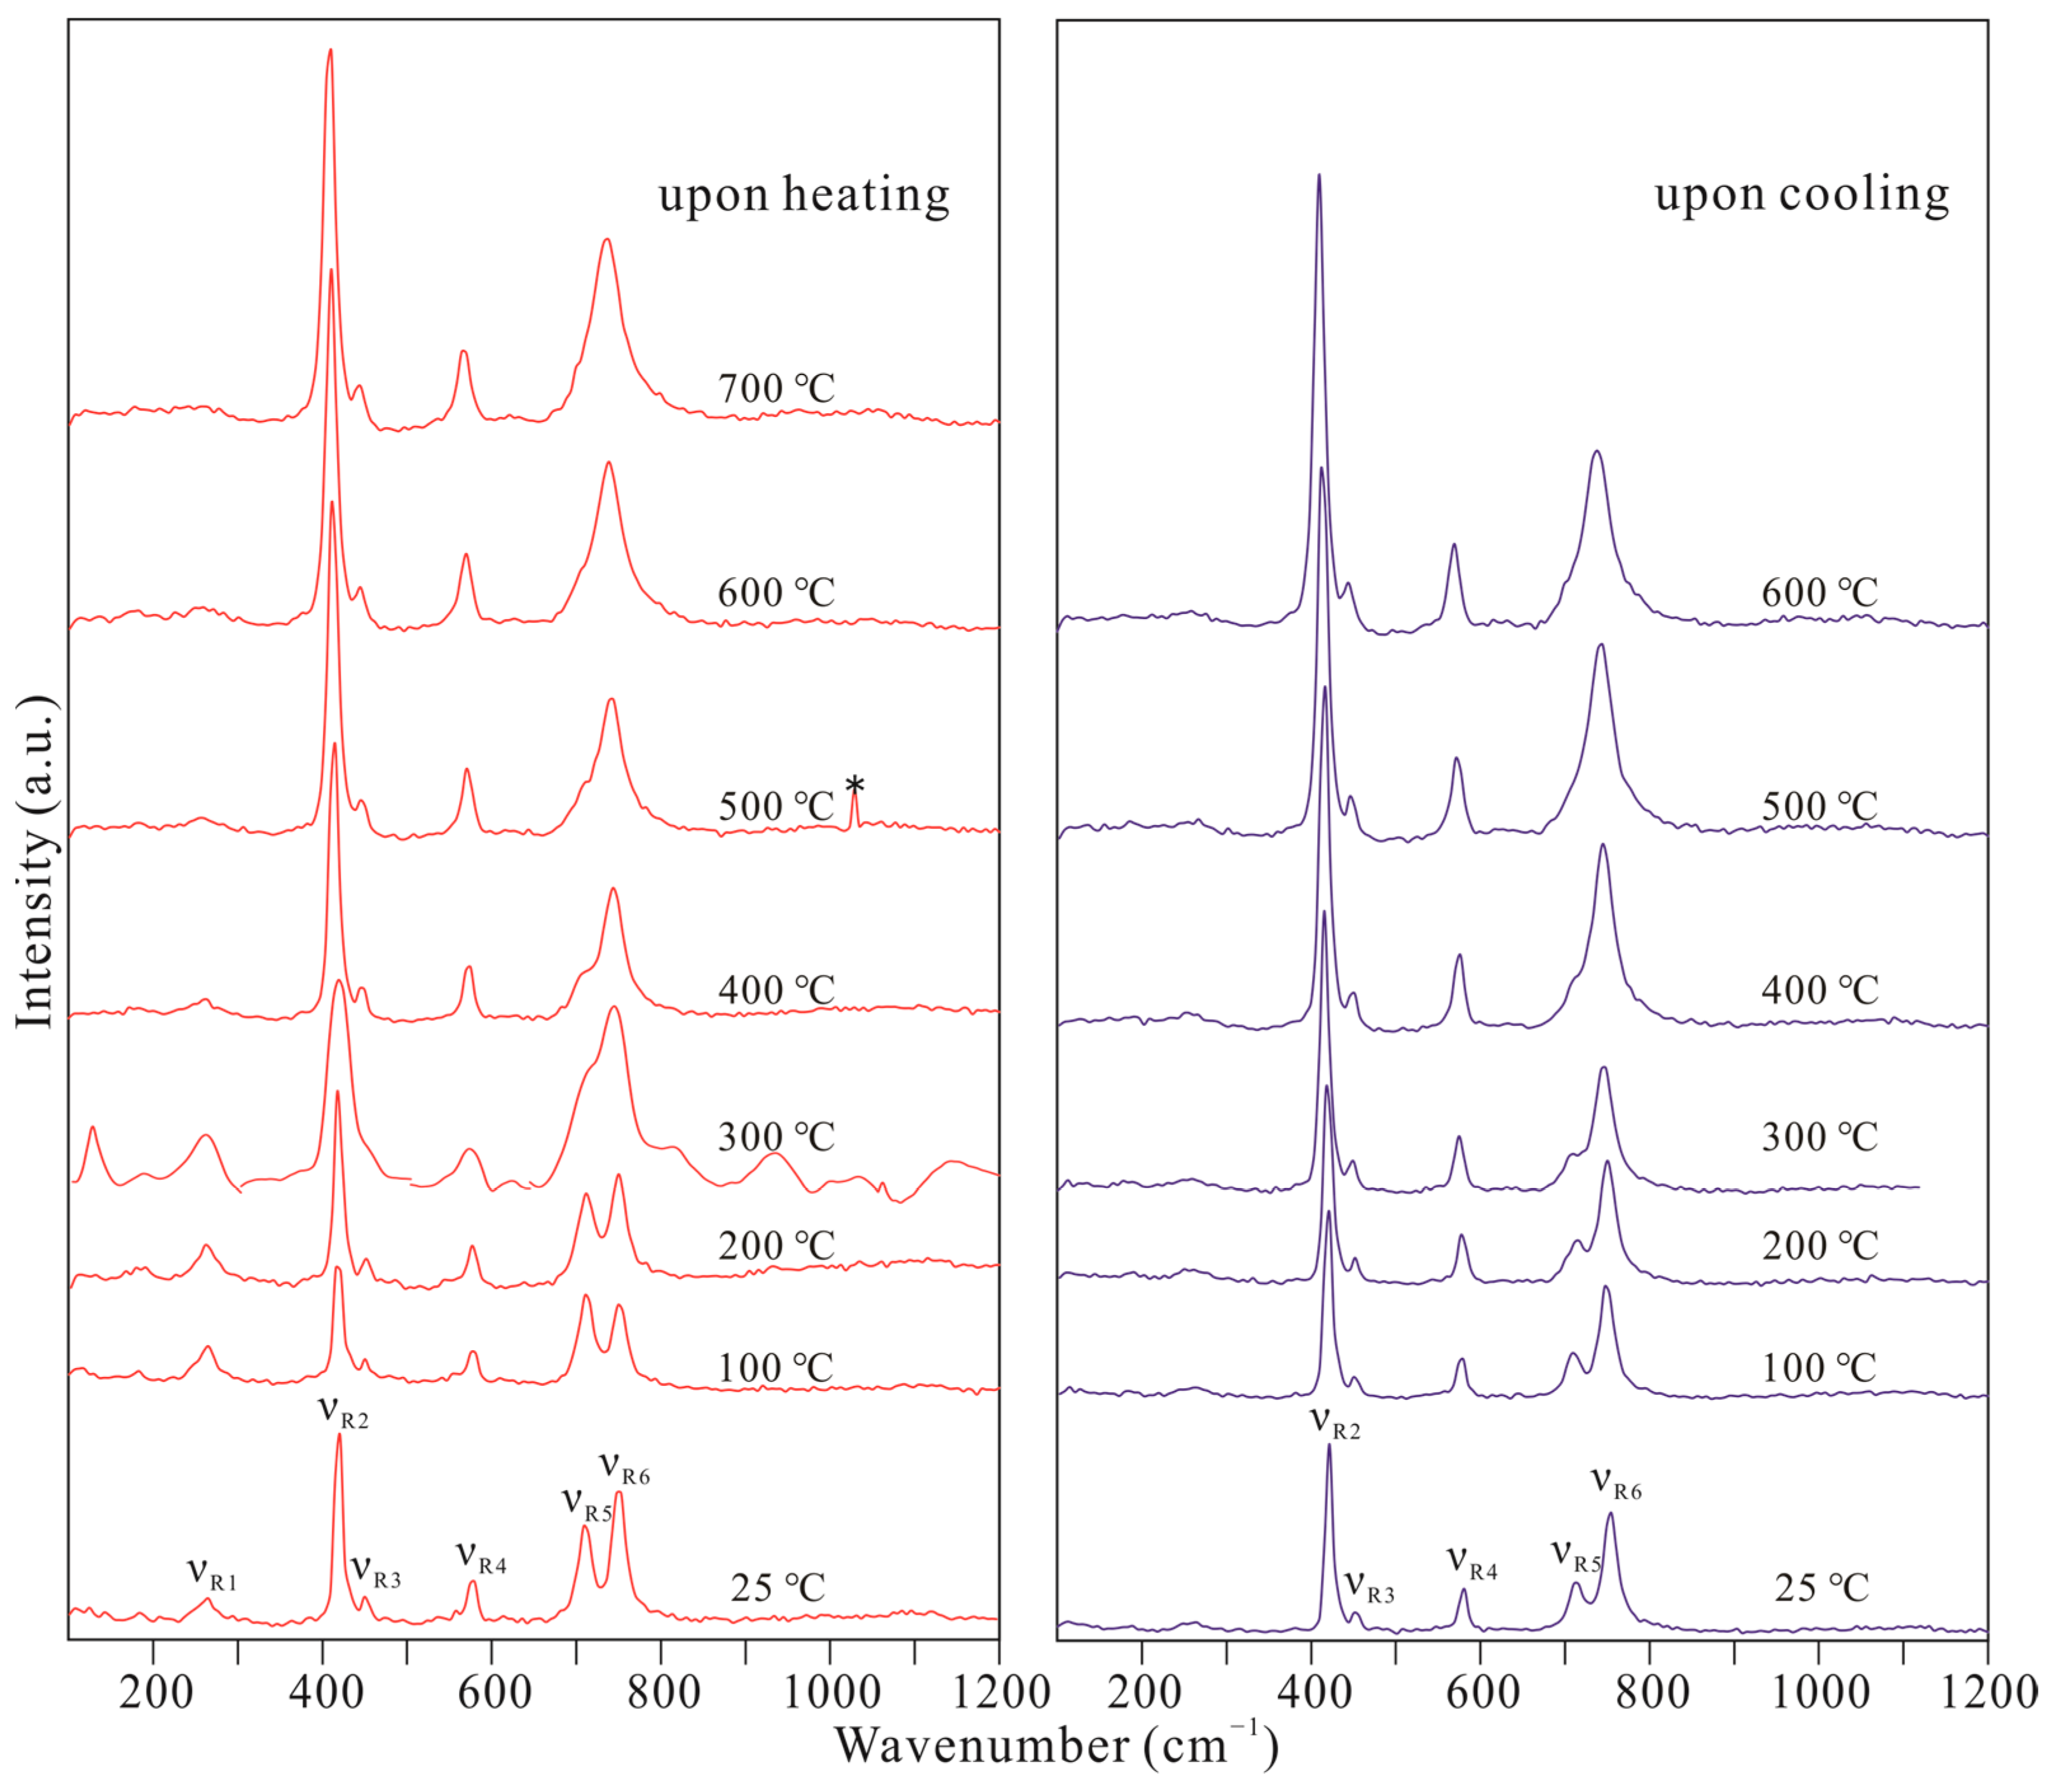
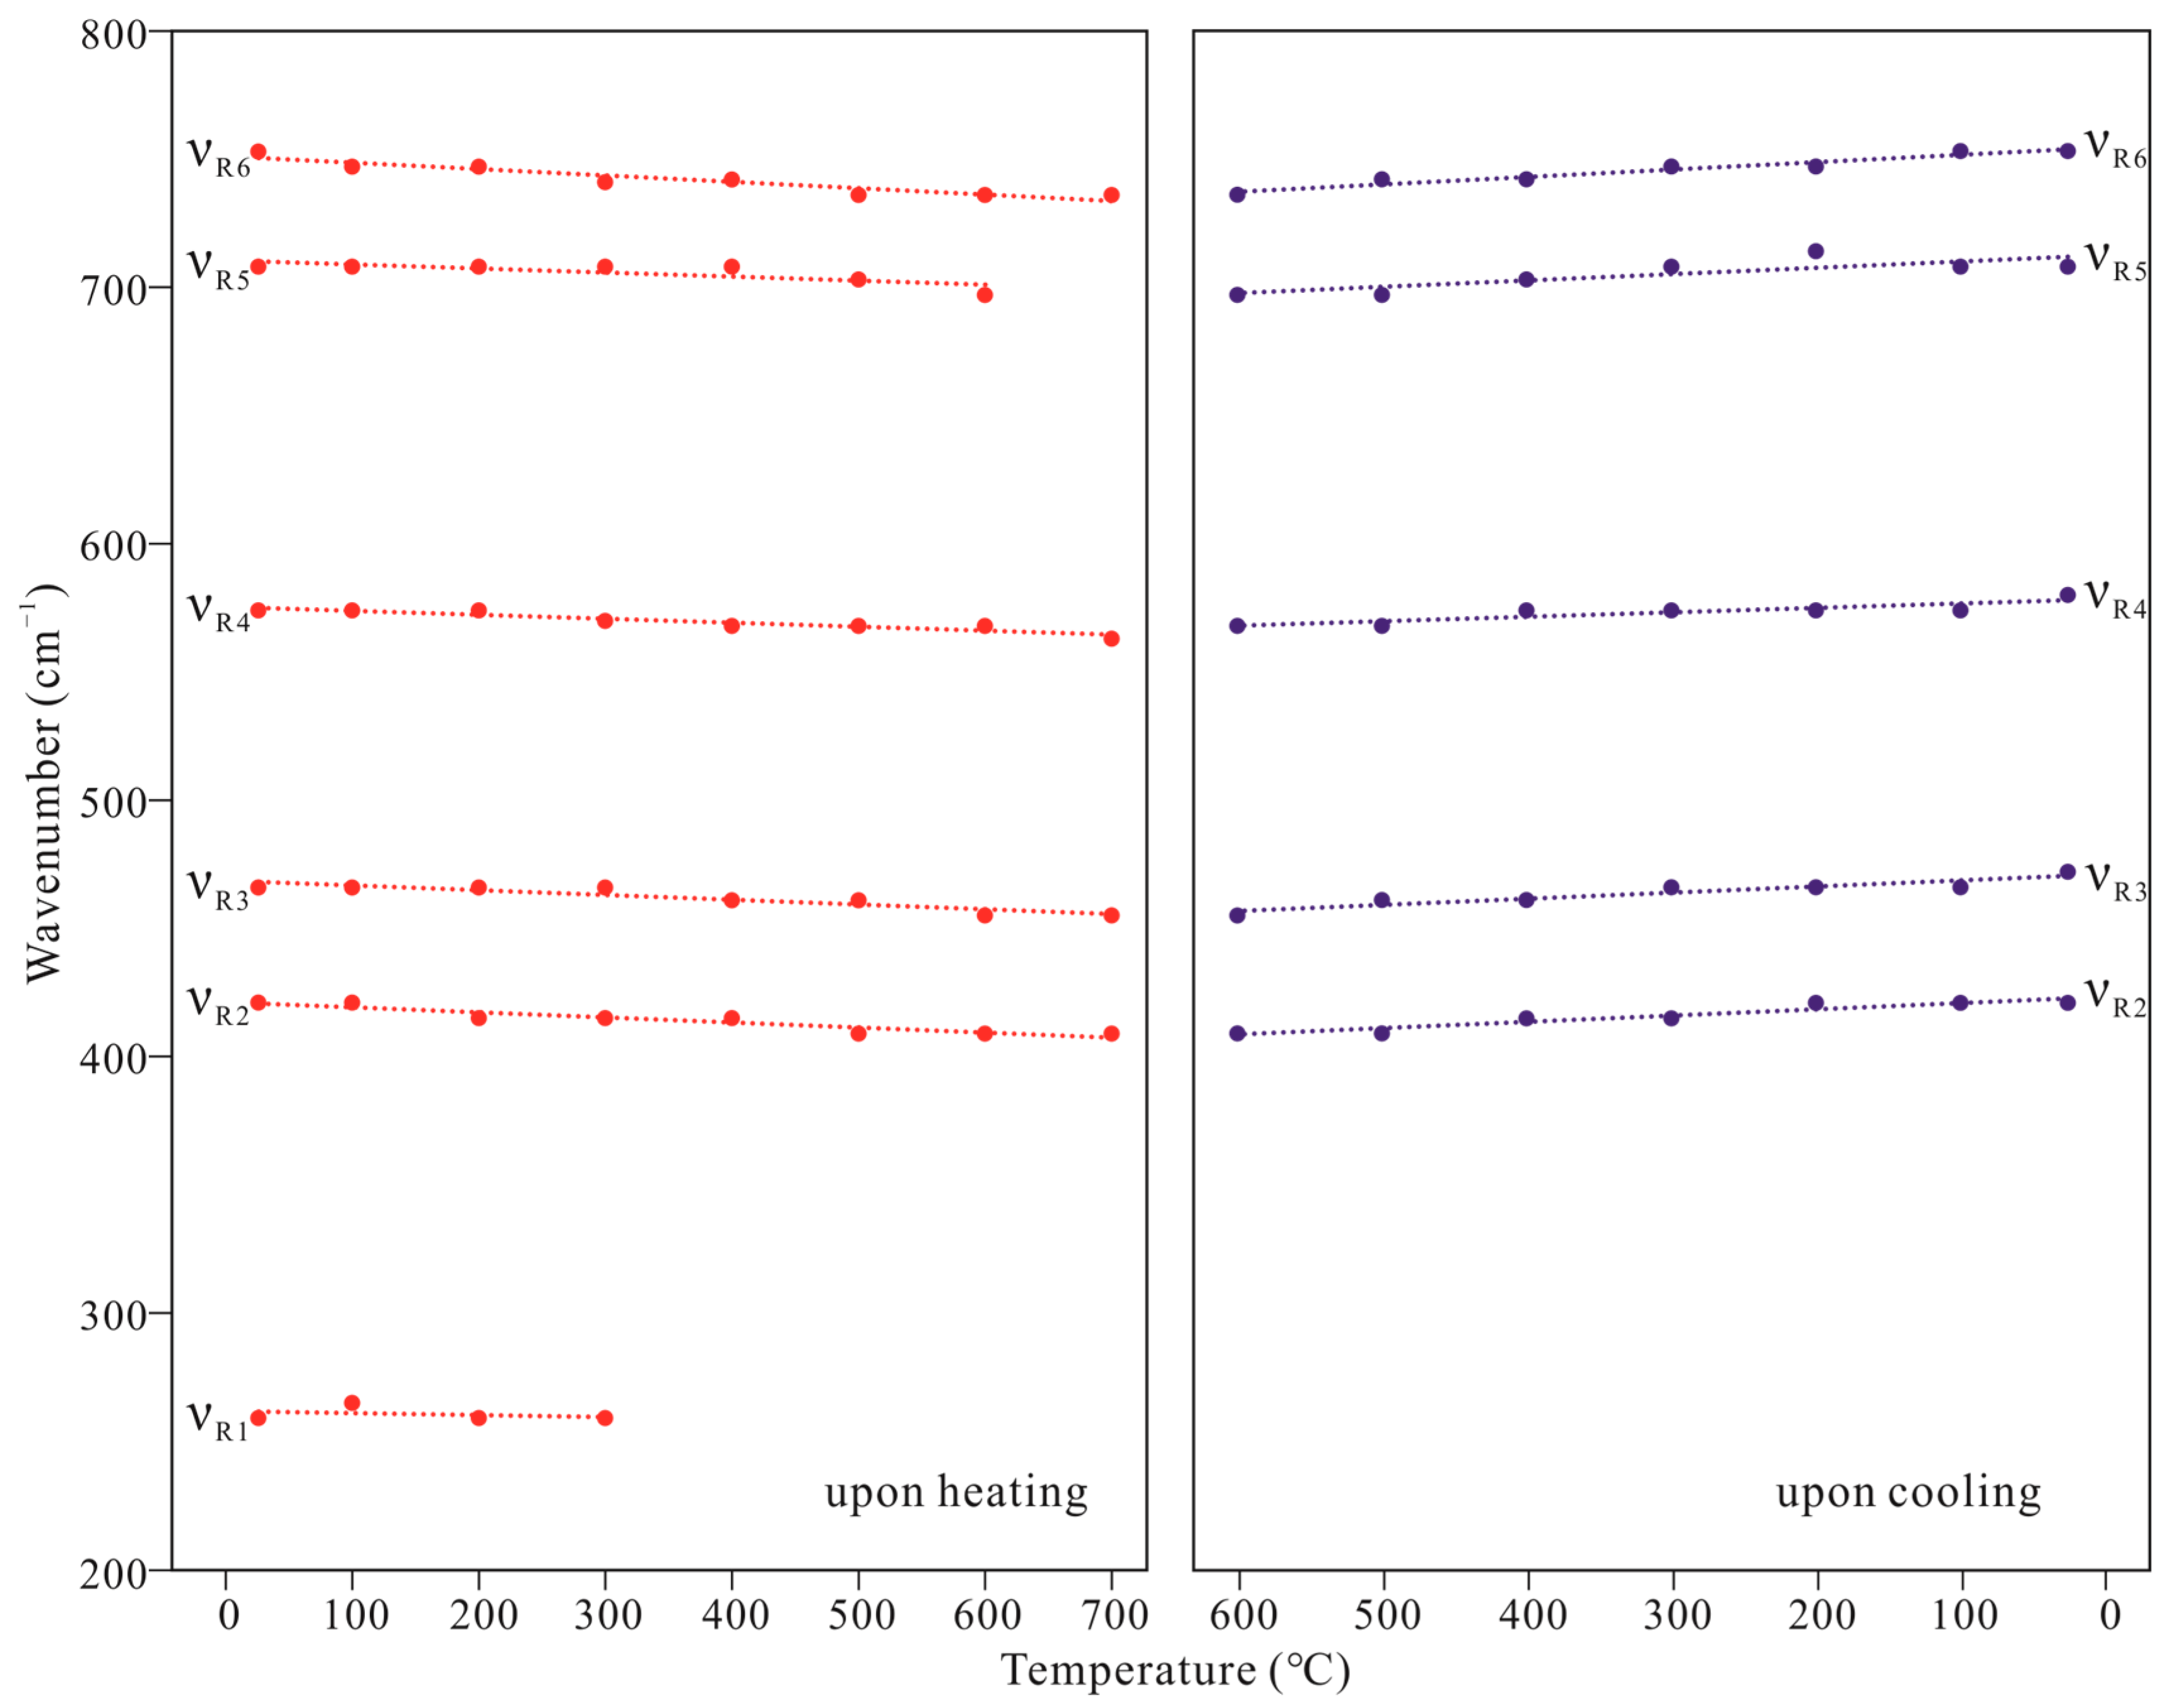
| T (°C) | Upon Heating | |||||
| νR1 | νR2 | νR3 | νR4 | νR5 | νR6 | |
| 25 | 259 | 421 | 466 | 574 | 708 | 753 |
| 100 | 265 | 421 | 466 | 574 | 708 | 747 |
| 200 | 259 | 415 | 466 | 574 | 708 | 747 |
| 300 | 259 | 415 | 466 | 570 | 708 | 741 |
| 400 | 415 | 461 | 568 | 708 | 742 | |
| 500 | 409 | 461 | 568 | 703 | 736 | |
| 600 | 409 | 455 | 568 | 697 | 736 | |
| 700 | 409 | 455 | 563 | 736 | ||
| T (°C) | Upon cooling | |||||
| νR1 | νR2 | νR3 | νR4 | νR5 | νR6 | |
| 600 | 409 | 455 | 568 | 697 | 736 | |
| 500 | 409 | 461 | 568 | 697 | 742 | |
| 400 | 415 | 461 | 574 | 703 | 742 | |
| 300 | 415 | 466 | 574 | 708 | 747 | |
| 200 | 421 | 466 | 574 | 708 | 747 | |
| 100 | 421 | 466 | 574 | 708 | 753 | |
| 25 | 421 | 472 | 580 | 708 | 753 | |
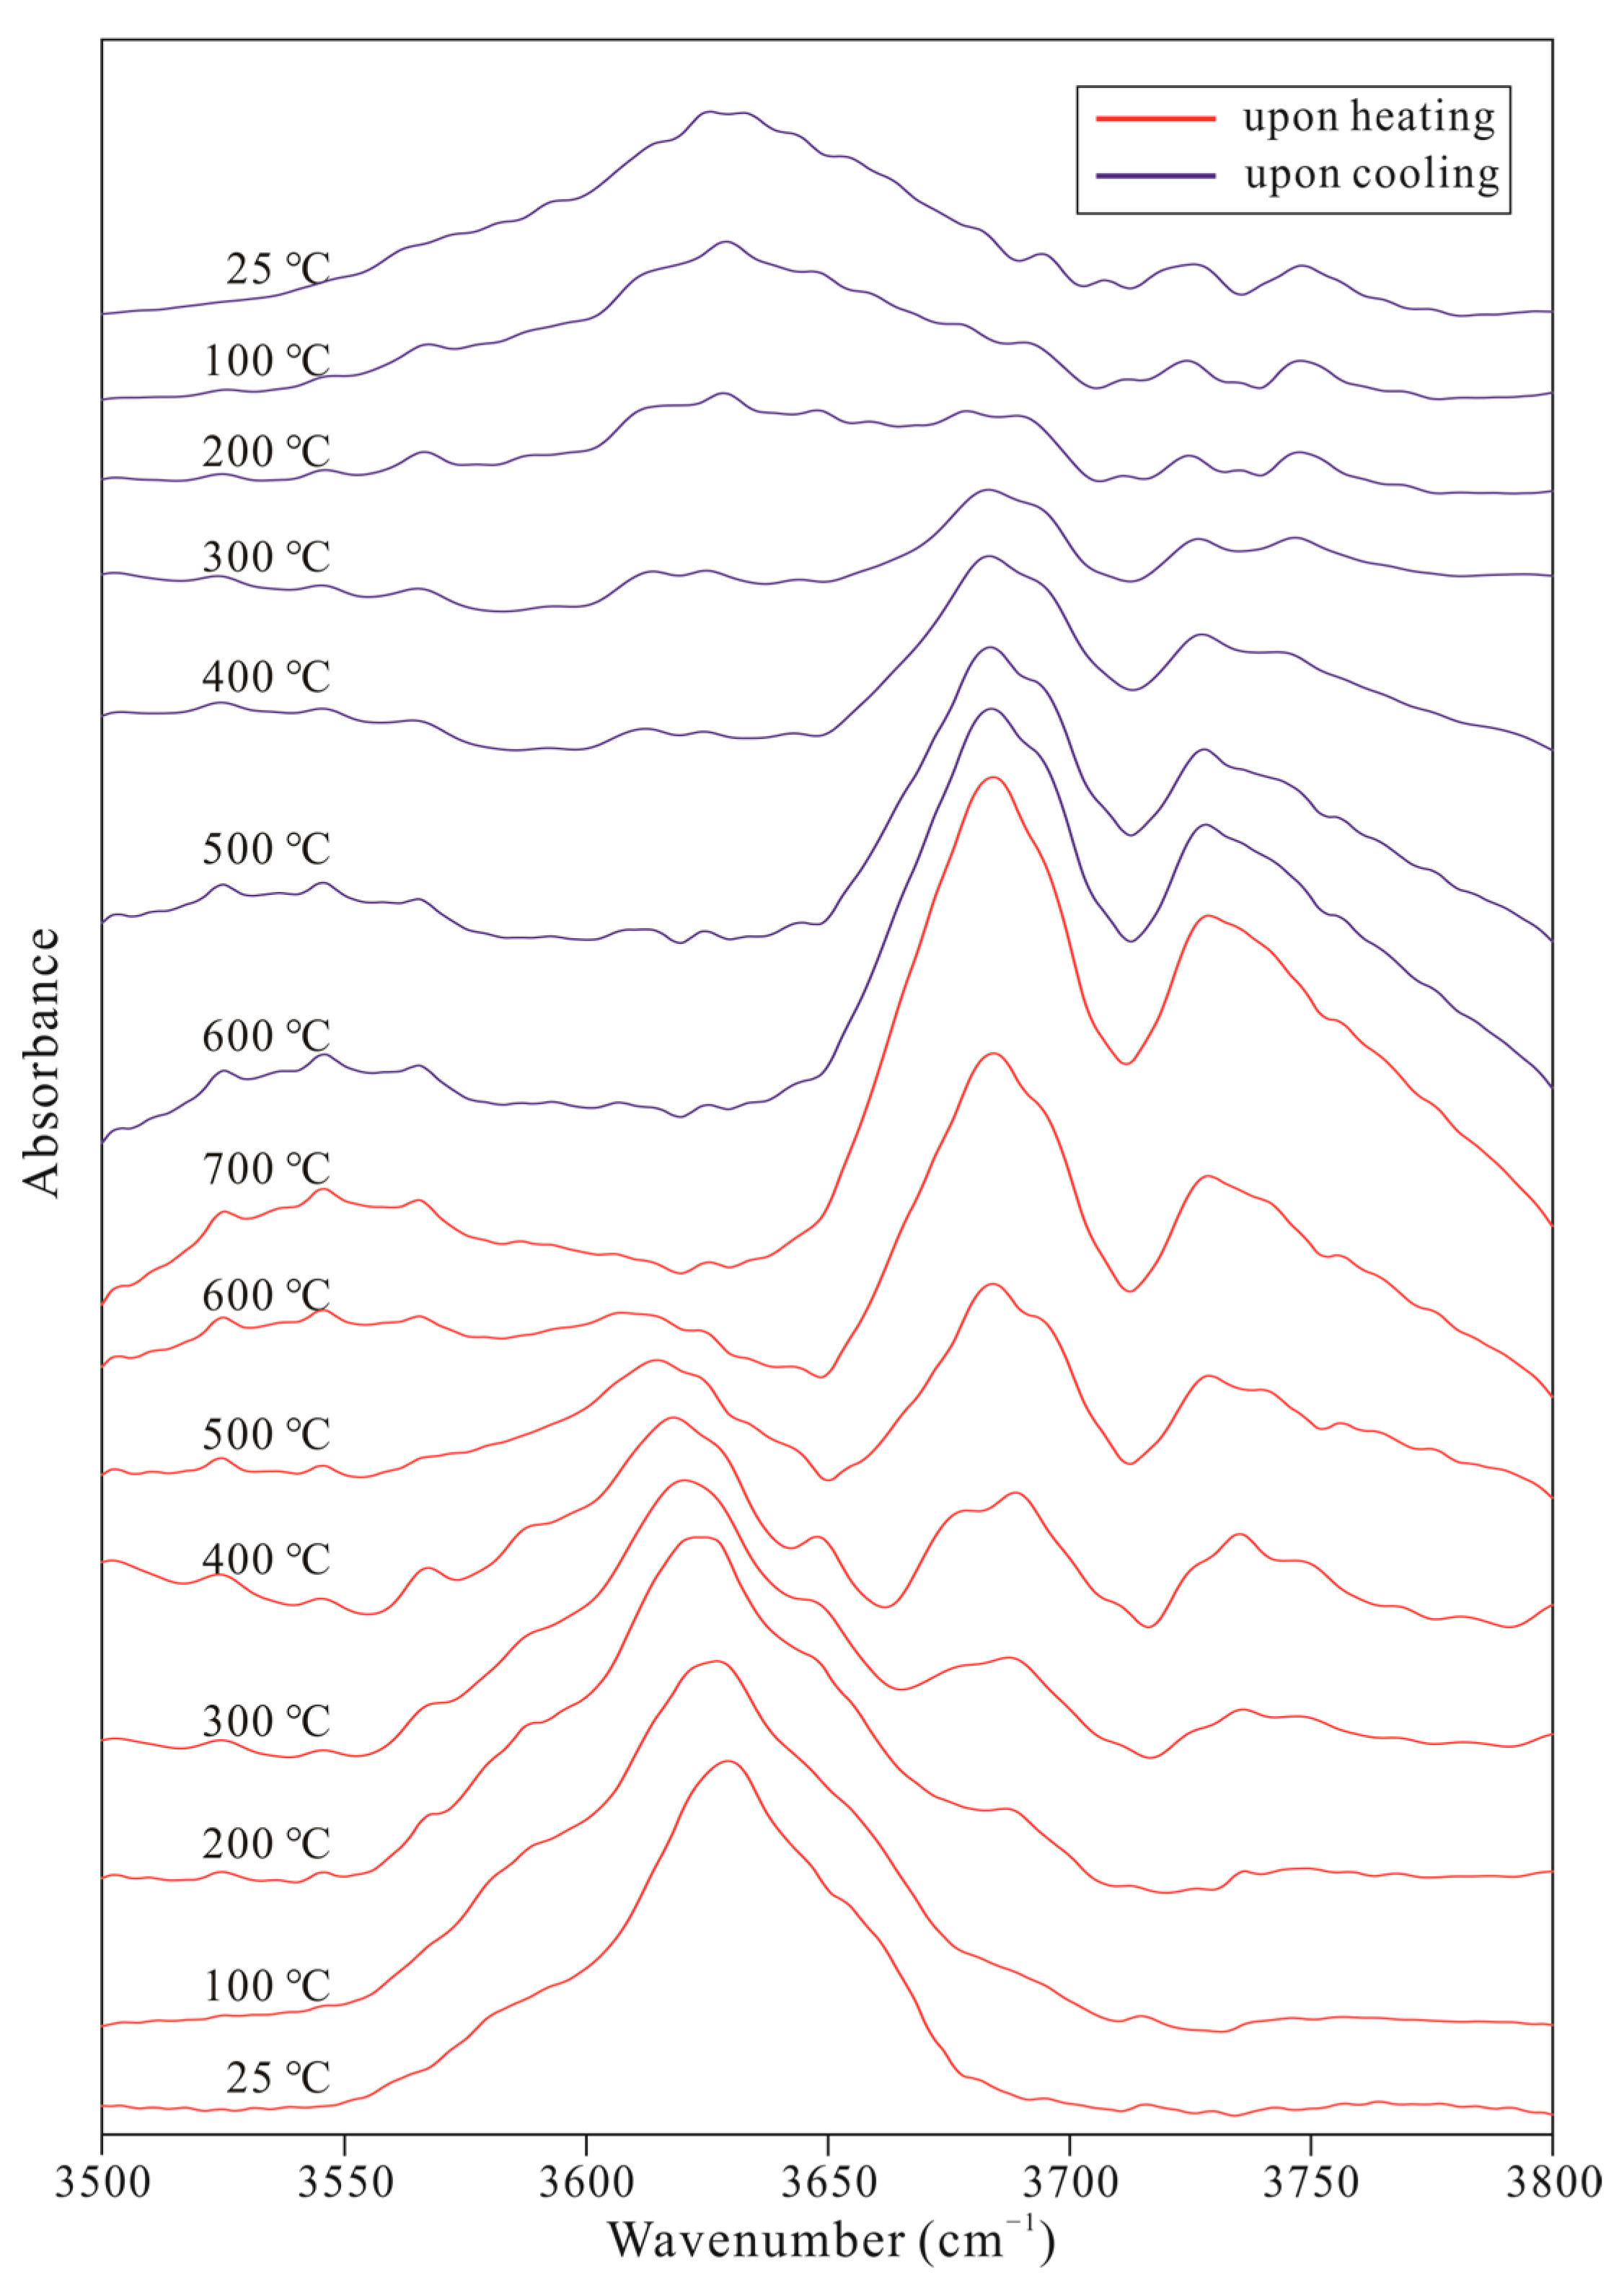
| T(°C) | Upon Heating | ||||||||||||||||
| νIR1 | νIR2 | νIR3 | νIR4 | νIR5 | νIR6 | νIR7 | νIR8 | νIR9 | νIR10 | νIR11 | νIR12 | νIR13 | νIR14 | νIR15 | νIR16 | νIR17 | |
| 25 | 3560 | 3581 | 3625 | — | — | 3645 | 3660 | — | — | — | — | — | — | — | — | — | — |
| 100 | 3565 | 3581 | 3625 | — | — | 3646 | 3658 | — | — | — | 3687 | 3693 | — | — | — | — | — |
| 200 | 3565 | 3587 | 3623 | — | — | 3646 | — | — | 3673 | — | 3689 | — | — | 3735 | — | 3749 | — |
| 300 | 3565 | 3587 | 3621 | — | — | 3648 | — | — | 3673 | — | 3689 | — | — | 3735 | — | 3749 | — |
| 400 | 3565 | 3587 | 3617 | — | — | 3648 | — | — | 3673 | — | — | — | — | — | — | — | — |
| 500 | 3567 | 3590 | — | — | — | — | — | 3666 | — | 3681 | — | 3696 | 3725 | — | 3741 | — | 3758 |
| 600 | — | — | — | — | — | — | — | 3666 | — | 3683 | — | 3696 | 3725 | — | 3741 | — | 3758 |
| 700 | — | — | — | — | — | — | — | 3668 | — | 3683 | — | 3695 | 3725 | — | 3741 | — | 3760 |
| T (°C) | Upon cooling | ||||||||||||||||
| νIR1 | νIR2 | νIR3 | νIR4 | νIR5 | νIR6 | νIR7 | νIR8 | νIR9 | νIR10 | νIR11 | νIR12 | νIR13 | νIR14 | νIR15 | νIR16 | νIR17 | |
| 600 | — | — | — | — | — | — | 3666 | — | — | 3683 | — | 3695 | 3725 | — | 3743 | — | 3758 |
| 500 | — | — | — | — | — | — | 3666 | — | — | 3681 | — | 3695 | 3725 | — | 3743 | — | 3760 |
| 400 | — | — | — | — | — | — | 3660 | — | — | 3681 | — | 3695 | 3725 | — | 3745 | — | 3760 |
| 300 | — | — | — | — | — | — | 3658 | — | — | 3681 | — | 3695 | 3725 | — | 3747 | — | 3766 |
| 200 | 3565 | 3588 | — | 3612 | 3629 | 3646 | 3658 | — | — | — | — | 3693 | 3723 | — | 3747 | — | — |
| 100 | 3565 | 3590 | — | 3612 | 3629 | 3642 | 3660 | — | — | 3677 | — | 3693 | 3723 | — | 3747 | — | — |
| 25 | 3561 | — | — | 3610 | 3629 | 3642 | — | — | — | 3681 | — | 3695 | 3725 | — | 3747 | — | — |
Disclaimer/Publisher’s Note: The statements, opinions and data contained in all publications are solely those of the individual author(s) and contributor(s) and not of MDPI and/or the editor(s). MDPI and/or the editor(s) disclaim responsibility for any injury to people or property resulting from any ideas, methods, instructions or products referred to in the content. |
© 2023 by the authors. Licensee MDPI, Basel, Switzerland. This article is an open access article distributed under the terms and conditions of the Creative Commons Attribution (CC BY) license (https://creativecommons.org/licenses/by/4.0/).
Share and Cite
Zhang, Z.; Cheng, H.; Zhang, L.; Li, X.; Lu, X.; He, H.; Zhang, Z.; Chen, T. High-Temperature Vibrational Analysis of the Lithium Mica: 2M2 Lepidolite. Minerals 2023, 13, 1112. https://doi.org/10.3390/min13091112
Zhang Z, Cheng H, Zhang L, Li X, Lu X, He H, Zhang Z, Chen T. High-Temperature Vibrational Analysis of the Lithium Mica: 2M2 Lepidolite. Minerals. 2023; 13(9):1112. https://doi.org/10.3390/min13091112
Chicago/Turabian StyleZhang, Ziyu, Hang Cheng, Li Zhang, Xiaoguang Li, Xiaofeng Lu, Haoxiong He, Zhuoran Zhang, and Tianze Chen. 2023. "High-Temperature Vibrational Analysis of the Lithium Mica: 2M2 Lepidolite" Minerals 13, no. 9: 1112. https://doi.org/10.3390/min13091112
APA StyleZhang, Z., Cheng, H., Zhang, L., Li, X., Lu, X., He, H., Zhang, Z., & Chen, T. (2023). High-Temperature Vibrational Analysis of the Lithium Mica: 2M2 Lepidolite. Minerals, 13(9), 1112. https://doi.org/10.3390/min13091112