

Innovative Structural Characterization of Natural Villiaumite Crystal


Abstract
:1. Introduction
2. Materials and Methods
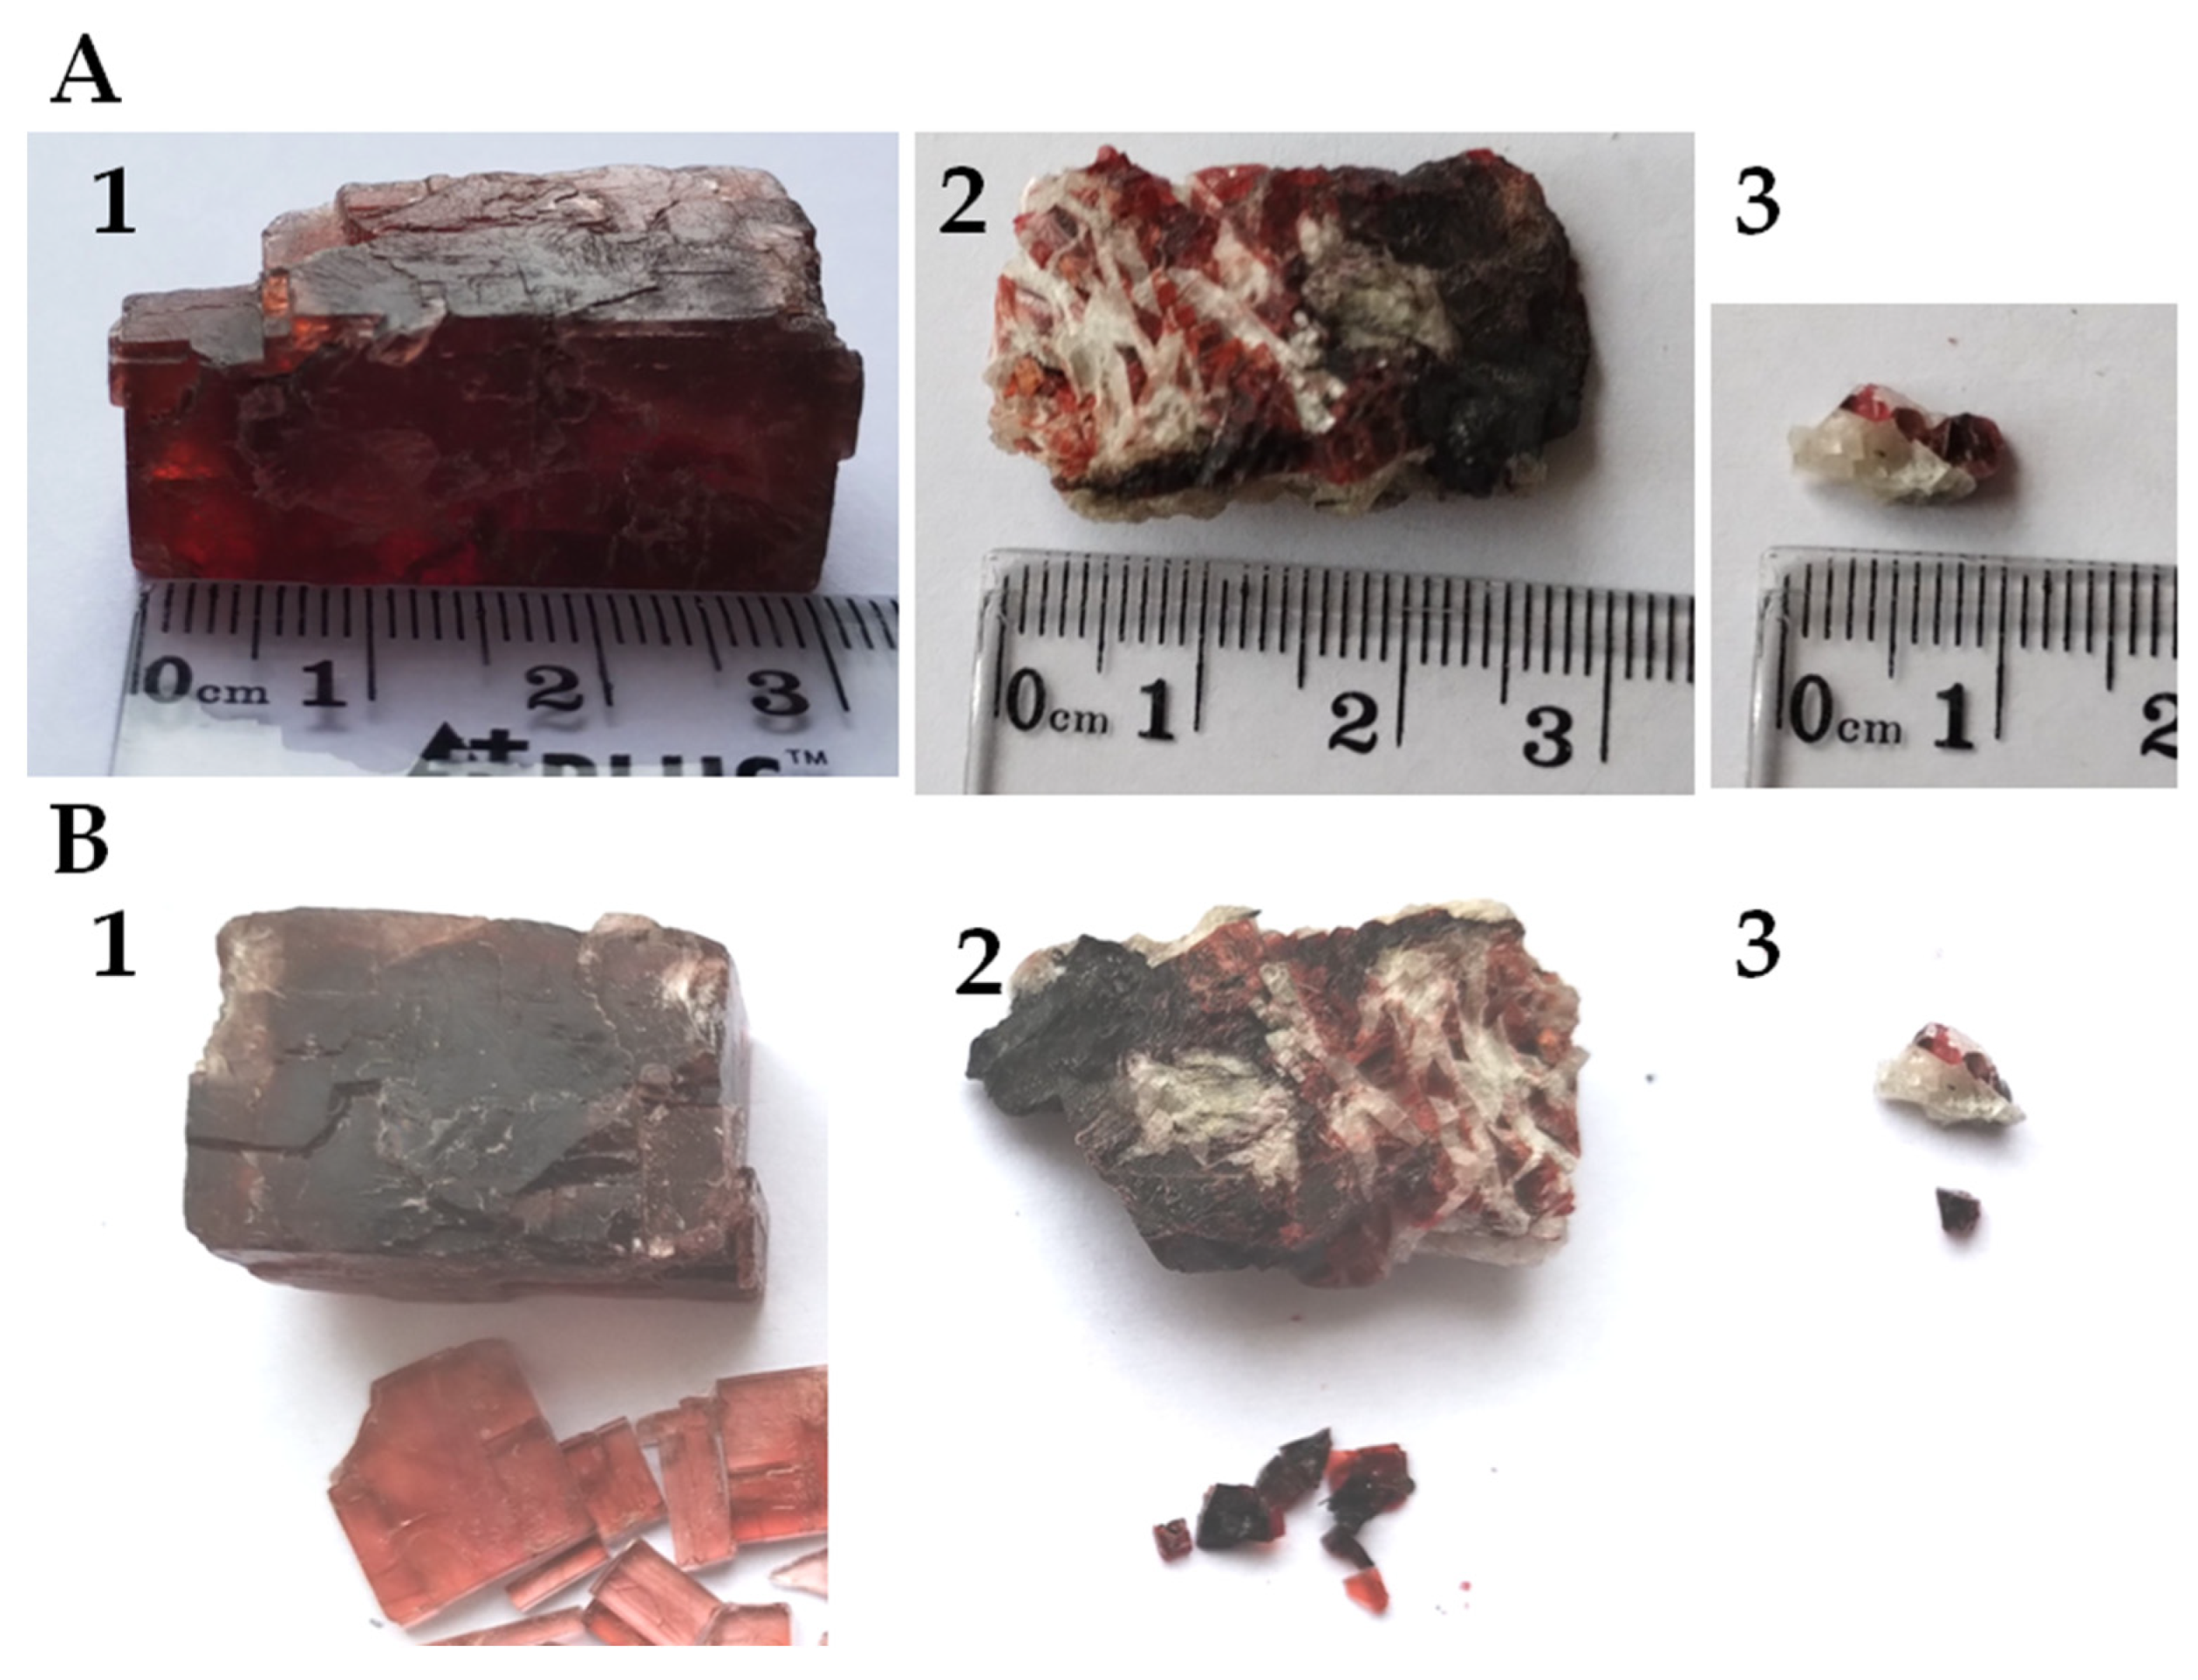
2.1. Samples
2.2. Far Infrared Spectroscopy
2.3. XRD Measurements
2.4. DFT Calculations
3. Results
3.1. Far Infrared Spectrum of Villiaumite
3.2. XRD Measurements
3.3. DFT Calculations
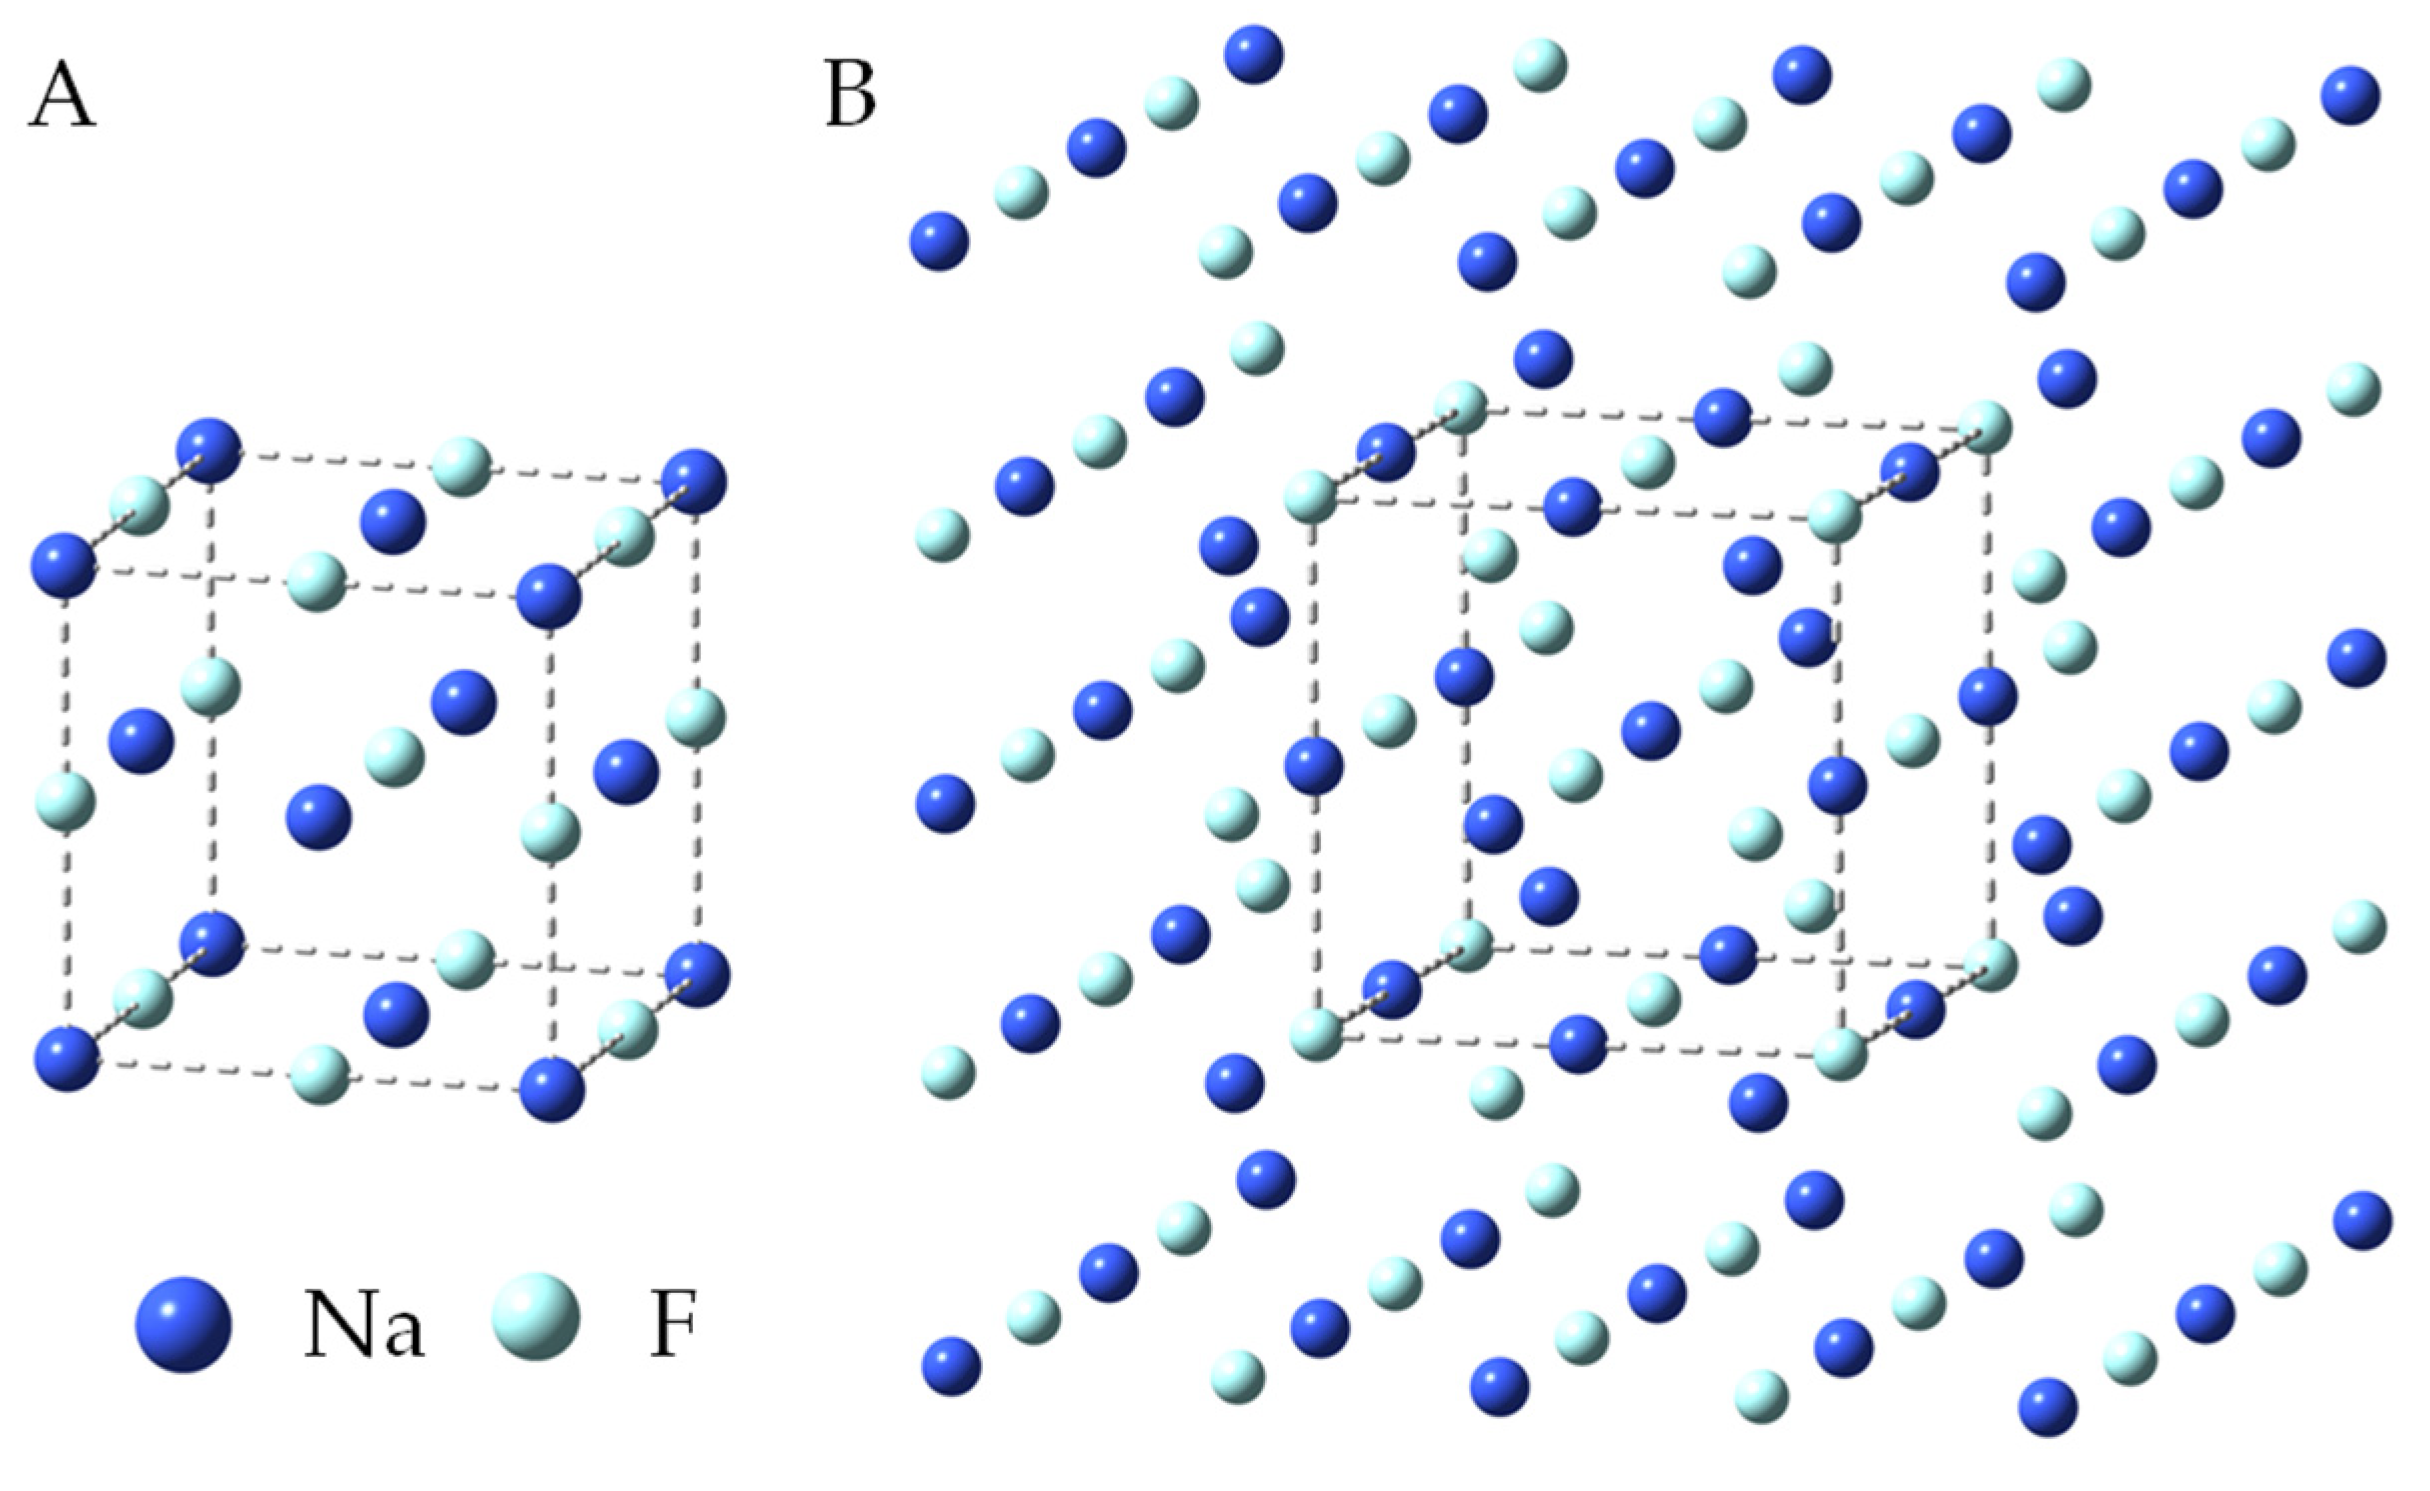
3.3.1. Geometry
3.3.2. Calculated Infrared Frequency of NaF
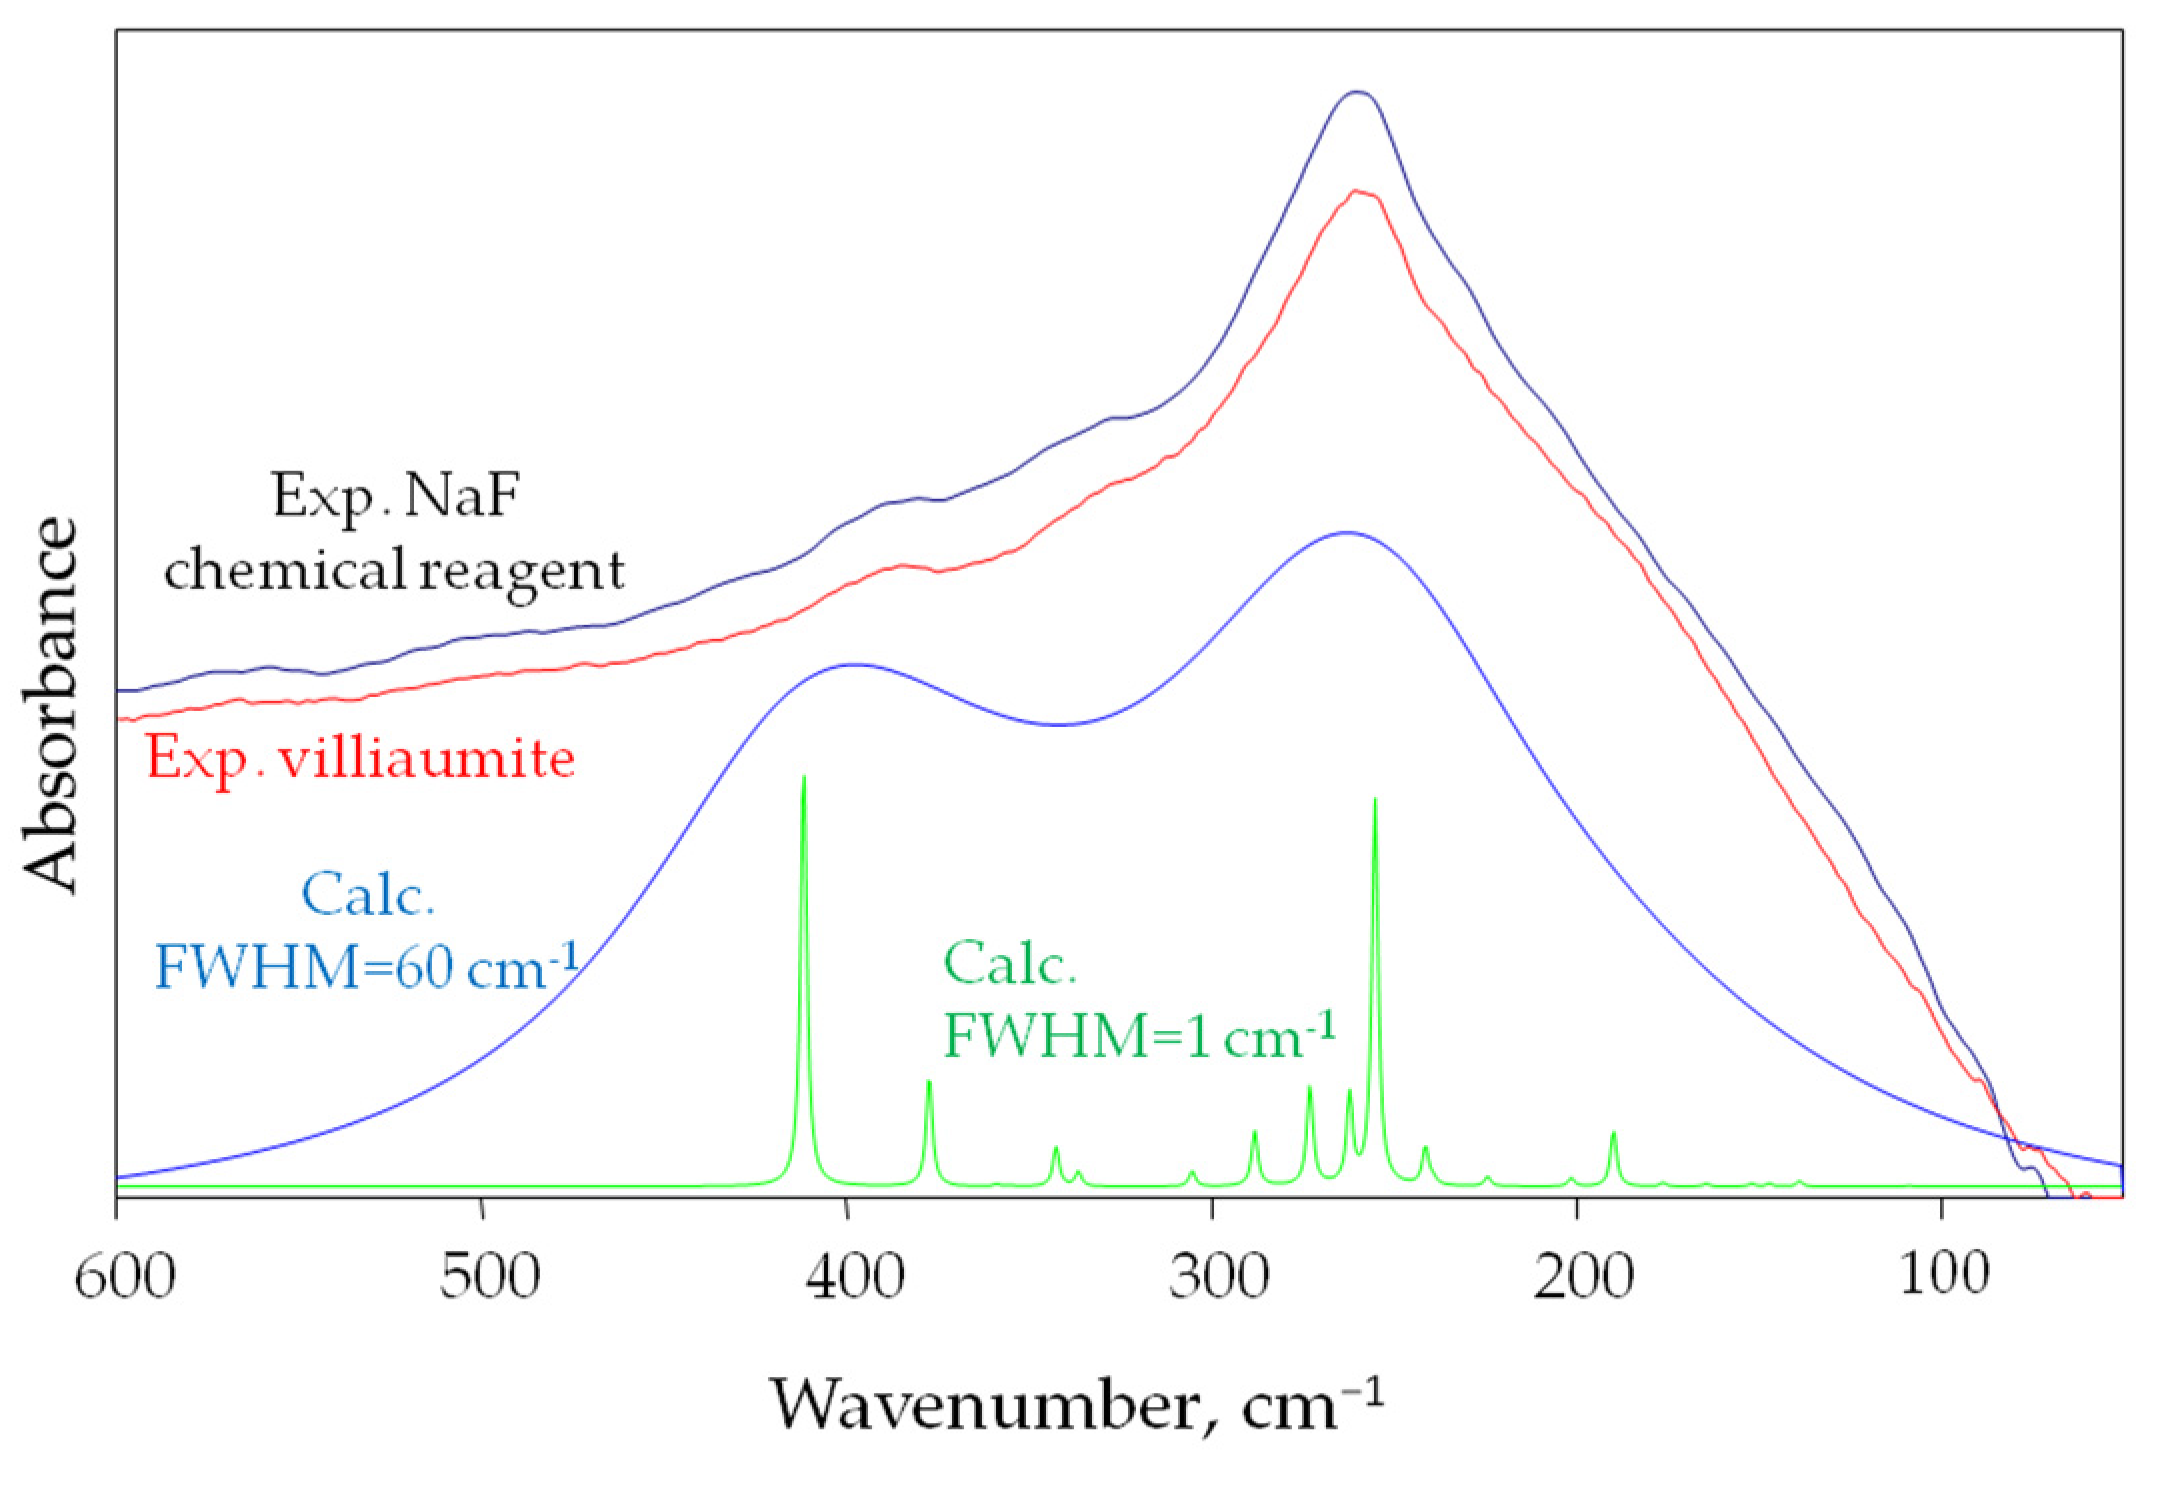
3.3.3. Comparison of Calculated and Experimental Spectra of NaF
4. Conclusions
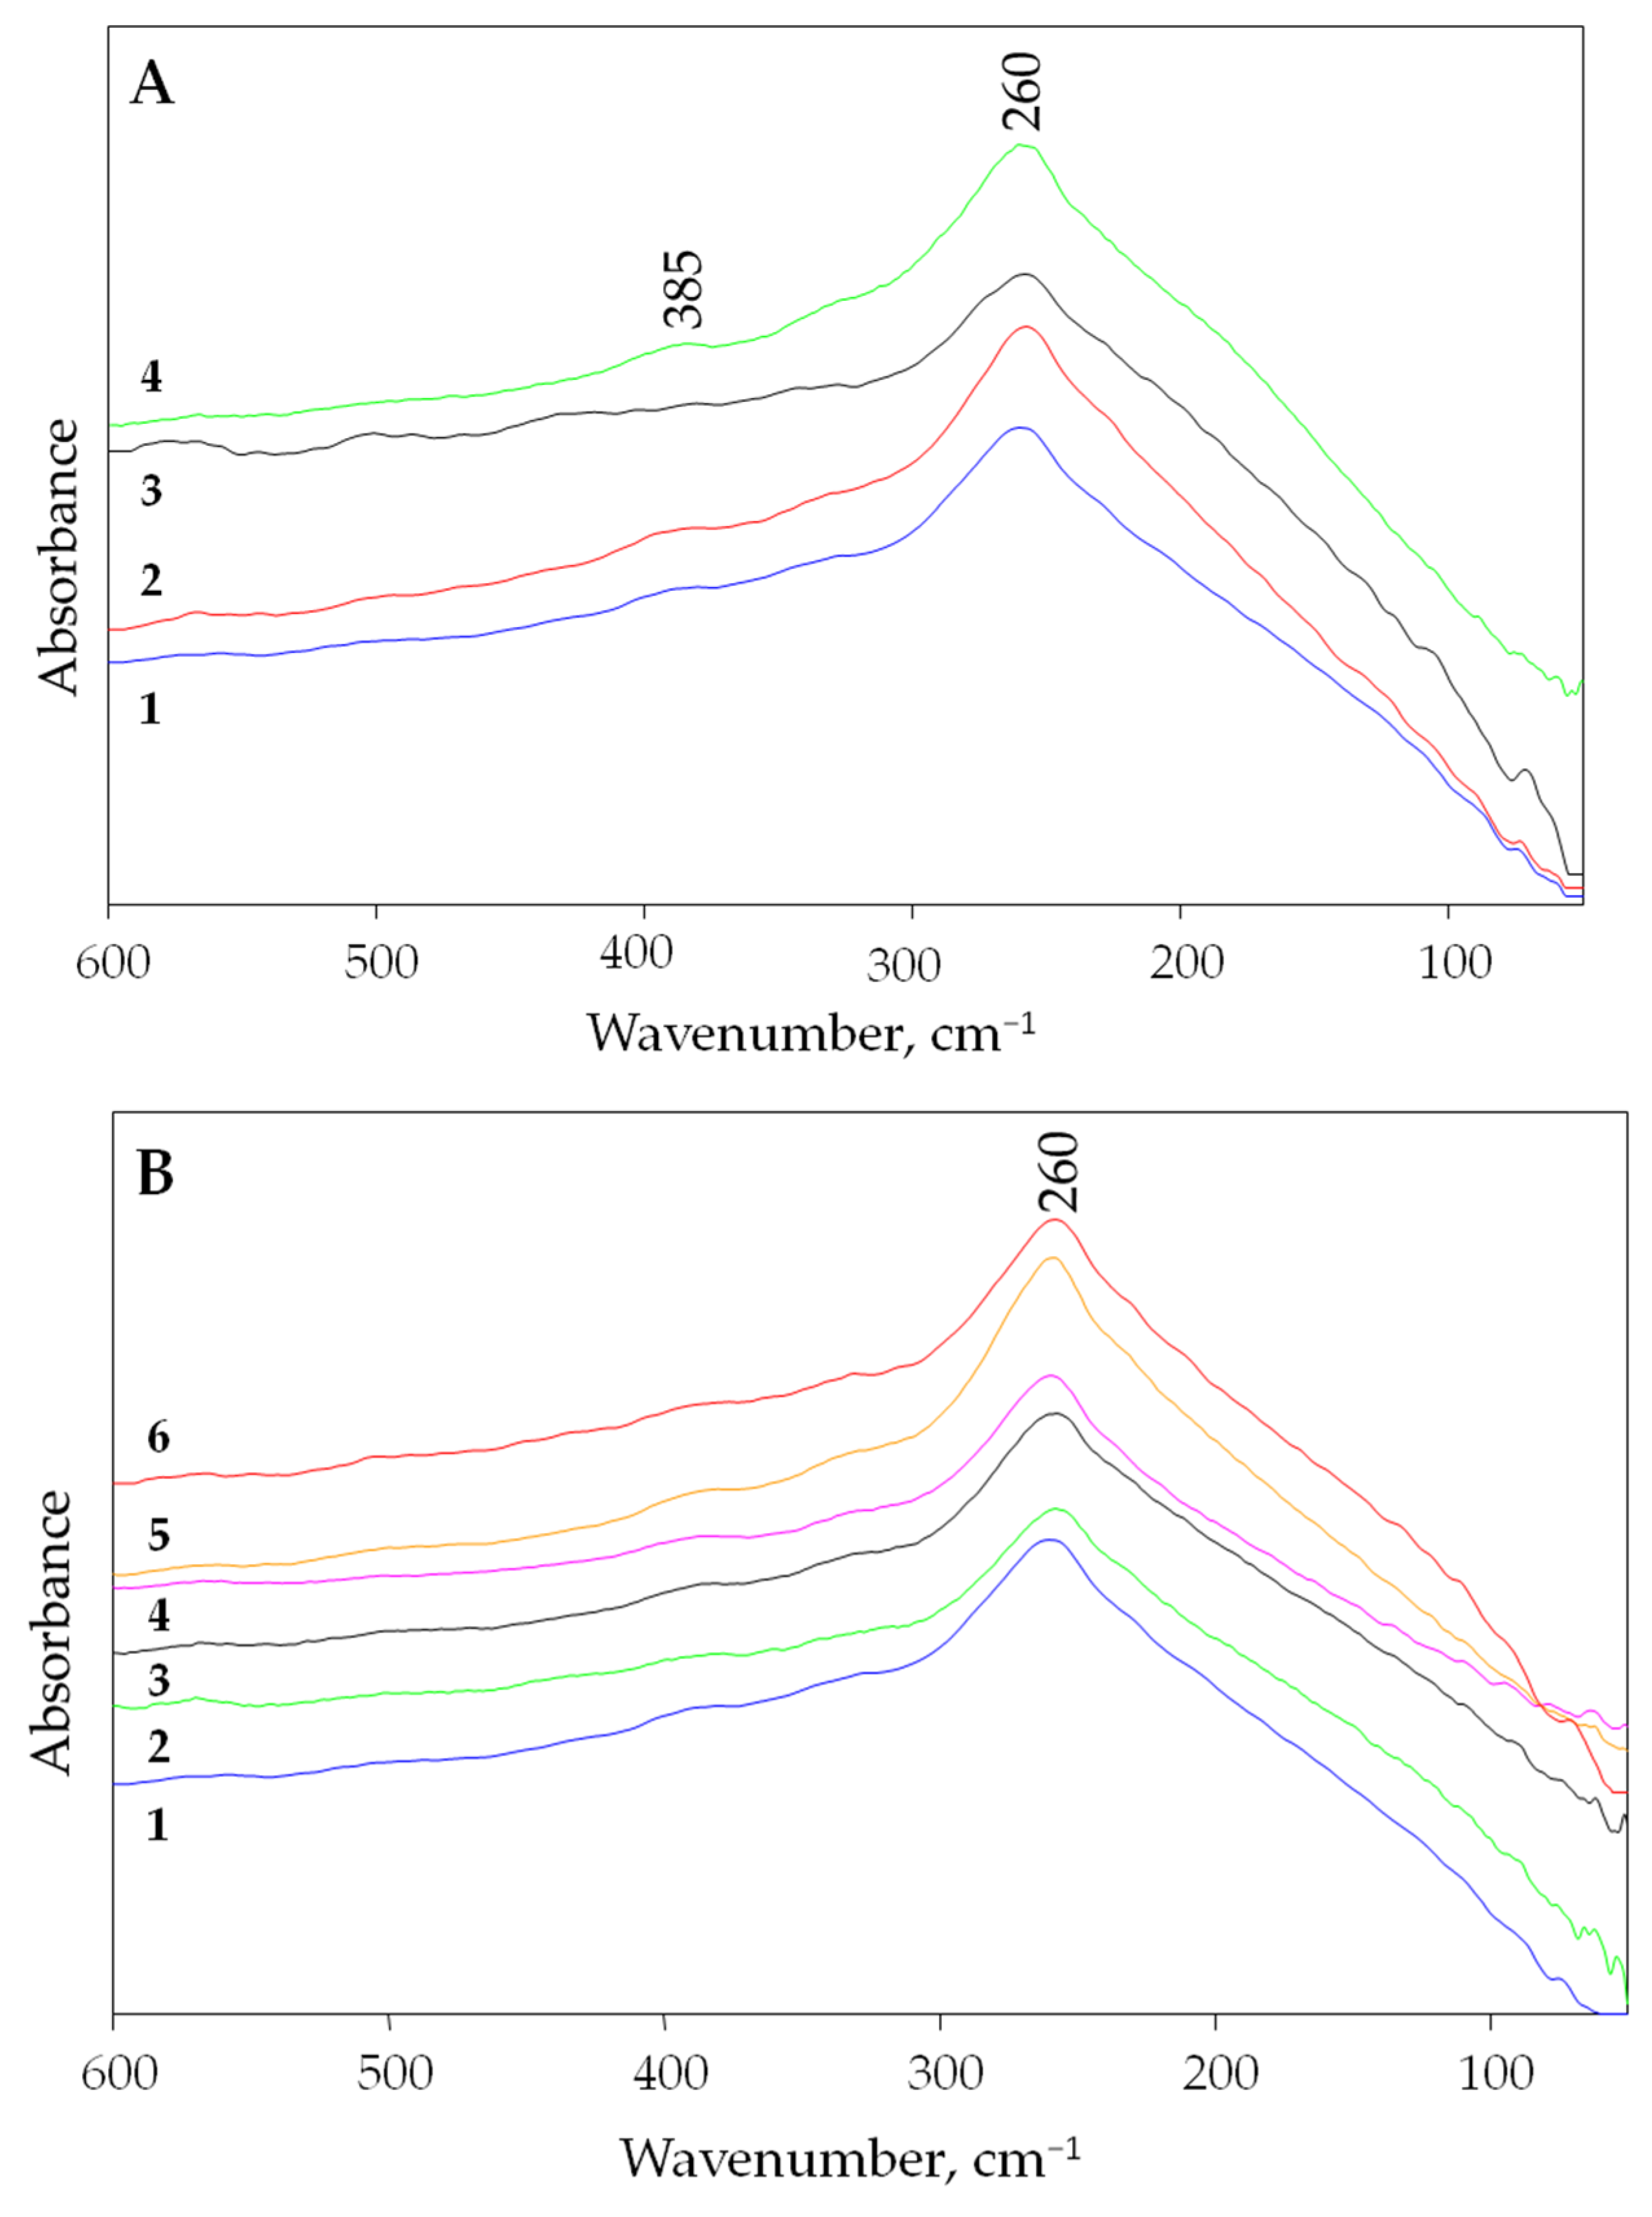
- The far infrared spectra of the natural mineral villiaumite (NaF) were measured. The maximum infrared absorption of villiaumite was observed at about 260 cm−1.
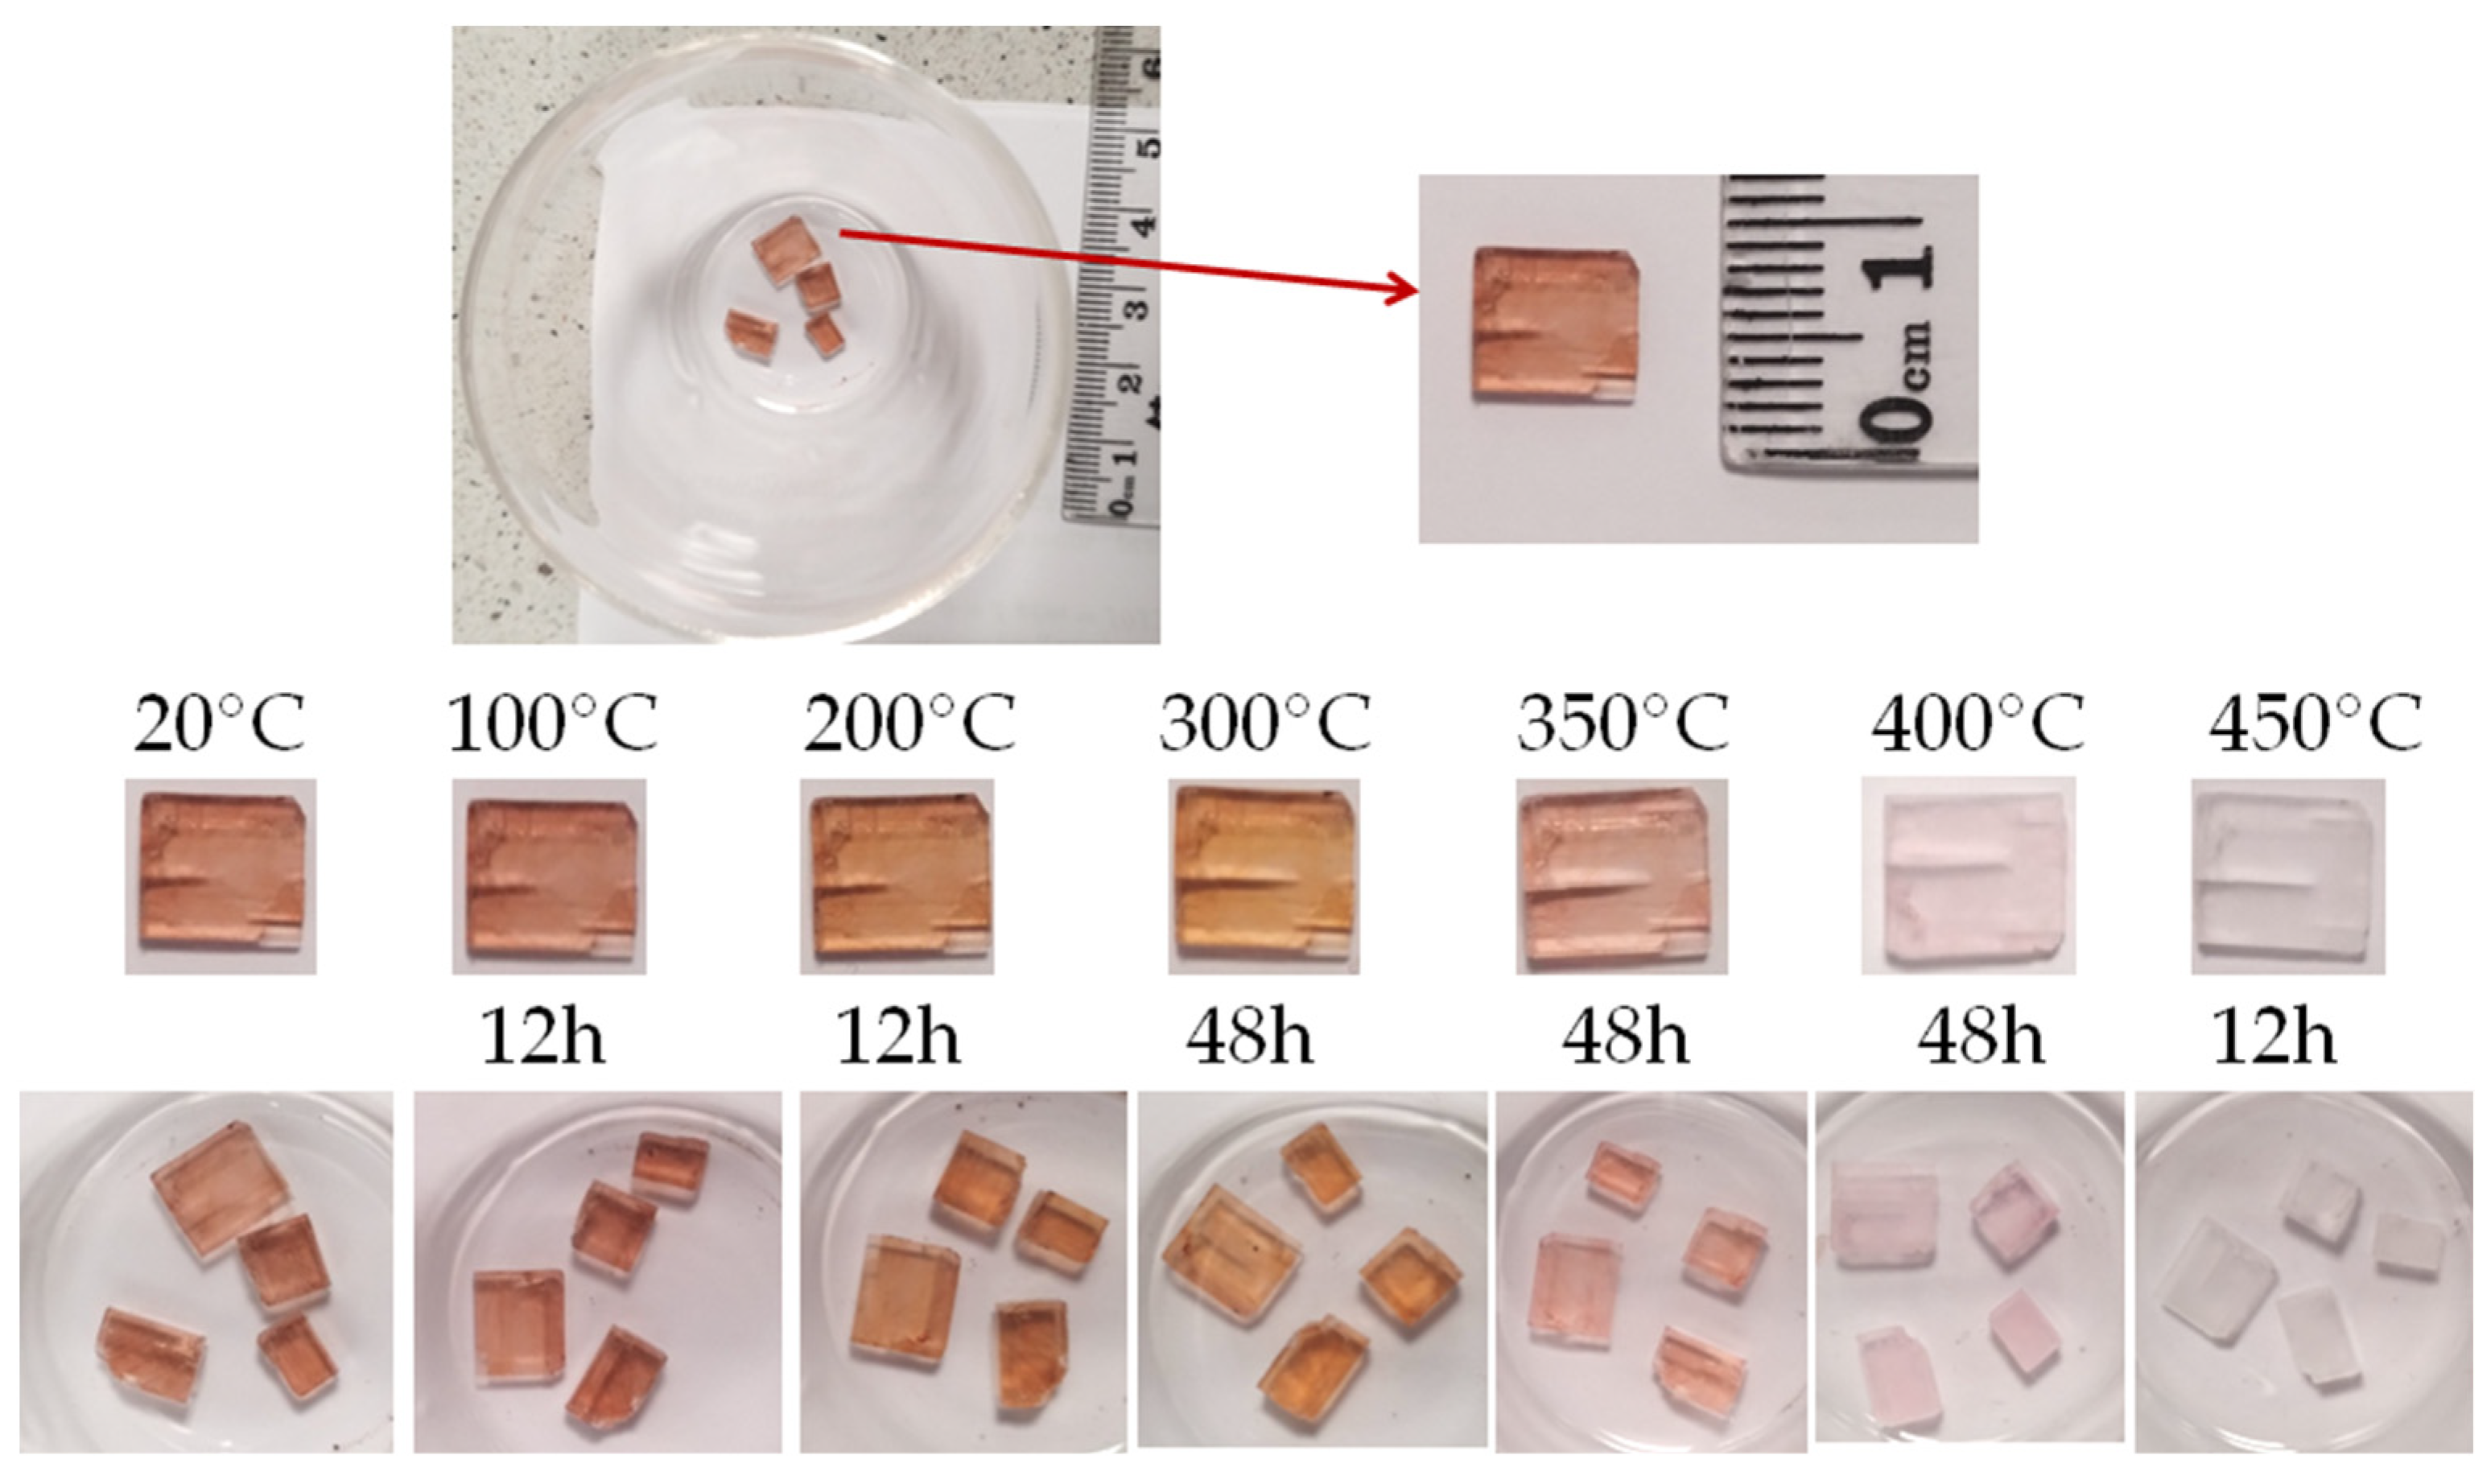
- The tested villiaumite samples began to change color very slowly after being heated above 300 °C. When heated, the samples of the reddish mineral villiaumite turn orange, pink and finally colorless at appropriate temperatures. The tested samples remained colorless after 3 days of heating at 430 °C. This observation is not consistent with previously reported data in the literature and probably requires confirmation by other researchers.
- Because the color of villiaumite changes from red to colorless under the influence of temperature, far infrared spectra were measured for samples at room temperature (red) and at 100, 200, 300, 400 and 500 °C (colorless). It was observed that the spectra of sodium fluoride are independent of its color. Red villiaumite and orange, pink and colorless villiaumite (after heating the red sample) and white chemical reagent (NaF) have almost identical far infrared spectra.
- The calculation (DFT/B3LYP/6-31+g*) for the 125-atom model of the crystal structure of NaF provided results that very good reflect the geometric parameters of the NaF unit cell and the range of absorption of the sample in infrared light.
Author Contributions
Funding
Data Availability Statement
Acknowledgments
Conflicts of Interest
References
- Anthony, J.W.; Bideaux, R.A.; Bladh, K.W.; Nichols, M.C. Handbook of Mineralogy; Mineral Data Publishing: Tucson, AZ, USA, 1990. [Google Scholar]
- Sørensen, E. On the adsorption of some anionic collectors on fluoride minerals. J. Colloid Interface Sci. 1973, 45, 601–607. [Google Scholar] [CrossRef]
- Calas, G.; Galoisy, L.; Geisler, A. Sodium nanoparticles in alkali halide minerals: Why is villiaumite red and halite blue? Am. Mineral. 2021, 106, 838–842. [Google Scholar] [CrossRef]
- Reynolds, J.G.; Belsher, J.D. A review of sodium fluoride solubility in water. J. Chem. Eng. Data 2017, 62, 1743–1748. [Google Scholar] [CrossRef]
- Johnston, N.R.; Strobel, S.A. Principles of fluoride toxicity and the cellular response: A review. Arch. Toxicol. 2020, 94, 1051–1069. [Google Scholar] [CrossRef]
- García, M.G.; Borgnino, L. Fluoride in the context of the environment. In Fluorine Chemistry, Analysis, Functions and Effects; Preedy, V., Ed.; Royal Society of Chemistry: Cambridge, UK, 2015; pp. 3–21. [Google Scholar]
- Grohol, M.; Veeh, C. Study on the Critical Raw Materials for the EU 2023—Final Report. Directorate-General for Internal Market, Industry, Entrepreneurship and SMEs; European Commission: Brussels, Belgium, 2023. [Google Scholar]
- Poulain, M.; Poulain, M.; Lucas, J. Verres fluores au tetrafluorure de zirconium proprietes optiques d’un verre dope au Nd3+. Mat. Res. Bull. 1975, 10, 243–246. [Google Scholar] [CrossRef]
- Zhu, X.; Peyghambarian, N. High-power ZBLAN glass fiber lasers: Review and prospect. Adv. OptoElectron. 2010, 2010, 501956. [Google Scholar] [CrossRef]
- Marinov, M.; Kozhukharov, V.; Vasilev, S. Glass formation and properties in the Ba(PO3)2-AIF3-NaF system. J. Mater. Sci. Lett. 1986, 5, 1129–1130. [Google Scholar] [CrossRef]
- Ahammed, S.; Chandra Sekhar, K.; Narasimha Chary, M.; Shareefuddin, M. The role of sodium fluoride on CdO-B2O3 glasses doped with chromium ions. Appl. Phys. A 2019, 125, 882. [Google Scholar] [CrossRef]
- Lumeau, J.; Glebova, L.; Glebov, L.B. Influence of UV-exposure on the crystallization and optical properties of photo-thermo-refractive glass. J. Noncryst. Solids 2008, 354, 425–430. [Google Scholar] [CrossRef]
- Fokin, V.M.; Guilherme, P.; Souza, G.P.; Zanotto, E.D. Sodium fluoride solubility and crystallization in photo-thermo-refractive glass. J. Am. Ceram. Soc. 2010, 93, 716–721. [Google Scholar] [CrossRef]
- Tustison, R.W. Fluorinated silicate glass for conventional and holographic optical elements. In Window and Dome Technologies and Materials X; Glebov, L., Ed.; Proceedings of SPIE; SPIE: Bellingham, WA, USA, 2007; Volume 6545, p. 654507. [Google Scholar]
- Sadegh, F.; Akman, E.; Prochowicz, D.; Tavakoli, M.M.; Yadav, P.; Akin, S. Facile NaF treatment achieves 20% efficient ETL-free perovskite solar cells. ACS Appl. Mater. Inter. 2022, 14, 38631–38641. [Google Scholar] [CrossRef] [PubMed]
- Takahiro, M.; Shin, T.; Tatsuo, F. Improving the photovoltanic performance of co-evaporated Cu2ZnSnS4 thin-film solar cells by incorporation of sodium from NaF layers. Prog. Photovolt. Res. Appl. 2016, 24, 1009–1015. [Google Scholar]
- Ehira, H.; Jimbo, K.; Katagiri, H. Impact of Na-addition effect into CZTS thin film solar cells. AIP Conf. Proc. 2016, 1865, 050004. [Google Scholar]
- Irfan, M.; Banu, S.R.; Manjunath, A.; Mahesh, S.S. Electrical and structural characterization of NaF doped PVA-PEG solid polymer blend electrolyte films. AIP Conf. Proc. 2019, 2115, 030594. [Google Scholar]
- Comparative Studies on Plasticized and Unplasticized Polyacrylonitrile (PAN) Polymer Electrolytes Containing Lithium and Sodium Salts. Available online: www.researchgate.net/publication/252932759_Comparative_Studies_on_Plasticized_and_Unplasticized_Polyacrylonitrile_PAN_Polymer_Electrolytes_Containing_Lithium_and_Sodium_Salts (accessed on 15 September 2023).
- Irfan, M.; Manjunath, A.; Mahesh, S.S. Study on the optical properties of polyvinyl alcohol doped sodium fluoride polymer electrolyte films. AIP Conf. Proc. 2020, 2220, 080063. [Google Scholar]
- Koga, K.T.; Rose-Koga, E.F. Fluorine in the Earth and the solar system, where does it come from and can it be found? C. R. Chim. 2018, 21, 749–756. [Google Scholar] [CrossRef]
- Allibone, R.; Cronin, S.J.; Charley, D.T.; Neall, V.E.; Stewart, R.B.; Oppenheimer, C. Dental fluorosis linked to degassing of Ambrym volcano, Vanuatu: A novel exposure pathway. Environ. Geochem. Health. 2012, 34, 155–170. [Google Scholar] [CrossRef]
- Lubojanski, A.; Piesiak-Panczyszyn, D.; Zakrzewski, W.; Dobrzynski, W.; Szymonowicz, M.; Rybak, Z.; Mielan, B.; Wiglusz, R.J.; Watras, A.; Dobrzynski, M. The safety of fluoride compounds and their effect on the human body—A narrative review. Materials 2023, 16, 1242. [Google Scholar] [CrossRef]
- Wang, J.; Zheng, N.; Liu, H.; Cao, X.; Teng, Y.; Zhai, Y. Distribution, formation and human health risk of fluorine in groundwater in Songnen plain, NE China. Water 2021, 13, 3236. [Google Scholar] [CrossRef]
- Dar, M.A.; Sankar, K.; Dar, I.A. Fluorine contamination in groundwater: A major challenge. Environ. Monit. Assess. 2011, 173, 955–968. [Google Scholar] [CrossRef]
- Martinez-Mier, E.A. Fluoride: Its metabolism, toxicity, and role in dental health. J. Evid. Based Complement. Altern. Med. 2012, 17, 28–32. [Google Scholar] [CrossRef]
- Bergmann, R. Fluorid in der Ernährung des Menschen. Biologische Bedeutung für den Wachsenden Organismus; Habilitationsschrift Medical Faculty, Free University Berlin: Berlin, Germany, 1994. [Google Scholar]
- Guth, S.; Hüser, S.; Roth, A.; Degen, G.; Diel, P.; Edlund, K.; Eisenbrand, G.; Engel, K.H.; Epe, B.; Grune, T.; et al. Toxicity of fluoride: Critical evaluation of evidence for human developmental neurotoxicity in epidemiological studies, animal experiments and in vitro analyses. Arch. Toxicol. 2020, 94, 1375–1415. [Google Scholar] [CrossRef] [PubMed]
- Grandjean, P.; Landrigan, P.J. Neurobehavioural effects of developmental toxicity. Lancet Neurol. 2014, 13, 330–338. [Google Scholar] [CrossRef] [PubMed]
- The mineral list on the Rruff Project website. Available online: https://rruff.info/Villiaumite (accessed on 8 November 2023).
- Muntianu, A.; Guo, B.; Bernath, P.F. High-resolution infrared emission spectrum of NaF. J. Mol. Spectr. 1996, 176, 274–279. [Google Scholar] [CrossRef]
- Ismail, Z.K.; Hauge, R.H.; Margrave, J.L. Infrared spectra of sodium and potassium fluorides by matrix isolation. J. Inorg. Nucl. Chem. 1973, 35, 3201–3206. [Google Scholar] [CrossRef]
- Manutchehr-Danai, M. Villiaumite. In Dictionary of Gems and Gemology; Manutchehr-Danai, M., Ed.; Springer: Berlin/Heidelberg, Germany, 2009. [Google Scholar]
- García-Cuesta, I.; Serrano-Andrés, L.; Sánchez de Merás, A.; Nebot-Gil, I. Theoretical spectroscopic parameters of the alkali monofluorides LiF, NaF and KF. Chem. Phys. Lett. 1992, 199, 535–544. [Google Scholar] [CrossRef]
- Degen, T.; Sadki, M.; Bron, E.; König, U.; Né-nert, G. The HighScore suite. Powder Diffr. 2014, 29, 13–18. [Google Scholar] [CrossRef]
- Lutterotti, L.; Matthies, S.; Wenk, H.R. MAUD (Material analysis using diffraction): A user friendly Java program for Rietveld texture analysis and more. In Proceedings of the Twelfth International Conference on Textures of Materials (ICOTOM-12), Montreal, QC, Canada, 9–13 August 1999. [Google Scholar]
- Becke, A.D. Density-functional exchange-energy approximation with correct asymptotic behavior. Phys. Rev. A 1988, 38, 3098–3100. [Google Scholar] [CrossRef]
- Lee, C.; Yang, W.; Parr, R.G. Development of the Colle-Salvetti correlation-energy formula into a functional of the electron density. Phys. Rev. B 1988, 37, 785–798. [Google Scholar] [CrossRef]
- Francl, M.M.; Pietro, W.J.; Hehre, W.J.; Binkley, J.S.; DeFrees, D.J.; Pople, J.A.; Gordon, M.S. Self-consistent molecular orbital methods. 23. A polarization-type basis set for 2nd-row elements. J. Chem. Phys. 1982, 77, 3654–3665. [Google Scholar] [CrossRef]
- Frisch, M.J.; Trucks, G.W.; Schlegel, H.B.; Scuseria, G.E.; Robb, M.A.; Cheeseman, J.R.; Scalmani, G.; Barone, V.; Petersson, G.A.; Nakatsuji, H.; et al. Wallingford CT, 2016. Program Gaussian 16, Revision C.01. Available online: https://www.scirp.org/reference/referencespapers?referenceid=2418053 (accessed on 8 November 2023).
- Srivastava, K.K.; Merchant, H.D. Thermal expansion of alkali halides above 300 K. J. Phys. Chem. Solids 1973, 34, 2069–2073. [Google Scholar] [CrossRef]
- Deshpande, V.T. Thermal expansion of sodium fluoride and sodium bromide. Acta Crystallogr. 1961, 14, 794. [Google Scholar] [CrossRef]
- Chruszcz-Lipska, K.; Zelek-Pogudz, S.; Solecka, U.; Solecki, M.L.; Szostak, E.; Zborowski, K.K.; Zając, M. Use of the far infrared spectroscopy for NaCl and KCl minerals characterization—A case study of halides from Kłodawa in Poland. Mineral 2022, 12, 1561. [Google Scholar] [CrossRef]
- Chruszcz-Lipska, K.; Szostak, E.; Zborowski, K.K.; Knapik, E. Study of the structure and infrared spectra of LiF, LiCl and LiBr using density functional theory (DFT). Materials 2023, 16, 5353. [Google Scholar] [CrossRef] [PubMed]
- Mindat.Org Non-Commercial Interactive Online Database of Minerals. Available online: https://www.mindat.org/min-4181.html (accessed on 8 November 2023).
- Ferraro, J.R. Metal halide vibrations. In Low-Frequency Vibration of Inorganic and Coordination Compounds; Ferraro, J.R., Ed.; Springer: New York, NY, USA, 1971; pp. 111–189. [Google Scholar]
- Debye, P.; Scherrer, P. Crystal structure of lithium halides. Phys. Zeitschrif 1918, 19, 474–483. [Google Scholar]
- Hull, A.W. Chemical analysis by X-rays. Trans. Am. Inst. Electr. Eng. 1919, 38, 1445–1466. [Google Scholar] [CrossRef]
- Bragg, W.L. Crystal structure. Nature 1920, 105, 646–648. [Google Scholar] [CrossRef]
- Barth, T.; Lunde, G. Über das Mineral Villiaumit. Zentralblatt Fuer Mineral. Geol. Palaeontol. 1927, 1927, 57–66. [Google Scholar]
- Finch, G.J.; Fordham, S. The effect of crystal-size on lattice-dimensions. Proc. Phys. Soc. 1936, 48, 85–94. [Google Scholar] [CrossRef]
- Streltsov, V.A.; Tsirelson, V.G.; Ozerov, R.P.; Golovanov, O.A. Electronic and thermal parameters of ions in CaF2: Regularized least squares treatment. Kristallografiya 1988, 33, 90–97. [Google Scholar]
- Srinivasa, R.B.; Sanyal, S.P. Structural and elastic properties of sodium halides at high pressure. Phys. Rev. B Condens. Matter Mater. Phys. 1990, 42, 1810–1816. [Google Scholar]
- Shirako, Y.; Shi, Y.G.; Aimi, A.; Mori, D.; Kojitani, H.; Yamaura, K.; Inaguma, Y.; Akaogi, M. High-pressure stability relations, crystal structures, and physical properties of perovskite and post-perovskite of NaNiF3. J. Solid State Chem. 2012, 191, 167–174. [Google Scholar] [CrossRef]

| hkl | dhkl [Å] | Position [°2Ѳ] | Relative Intensity [%] |
|---|---|---|---|
| {111} | 2.67660, 2.67454 | 33.451, 33.48 | 2.4, 0.23 |
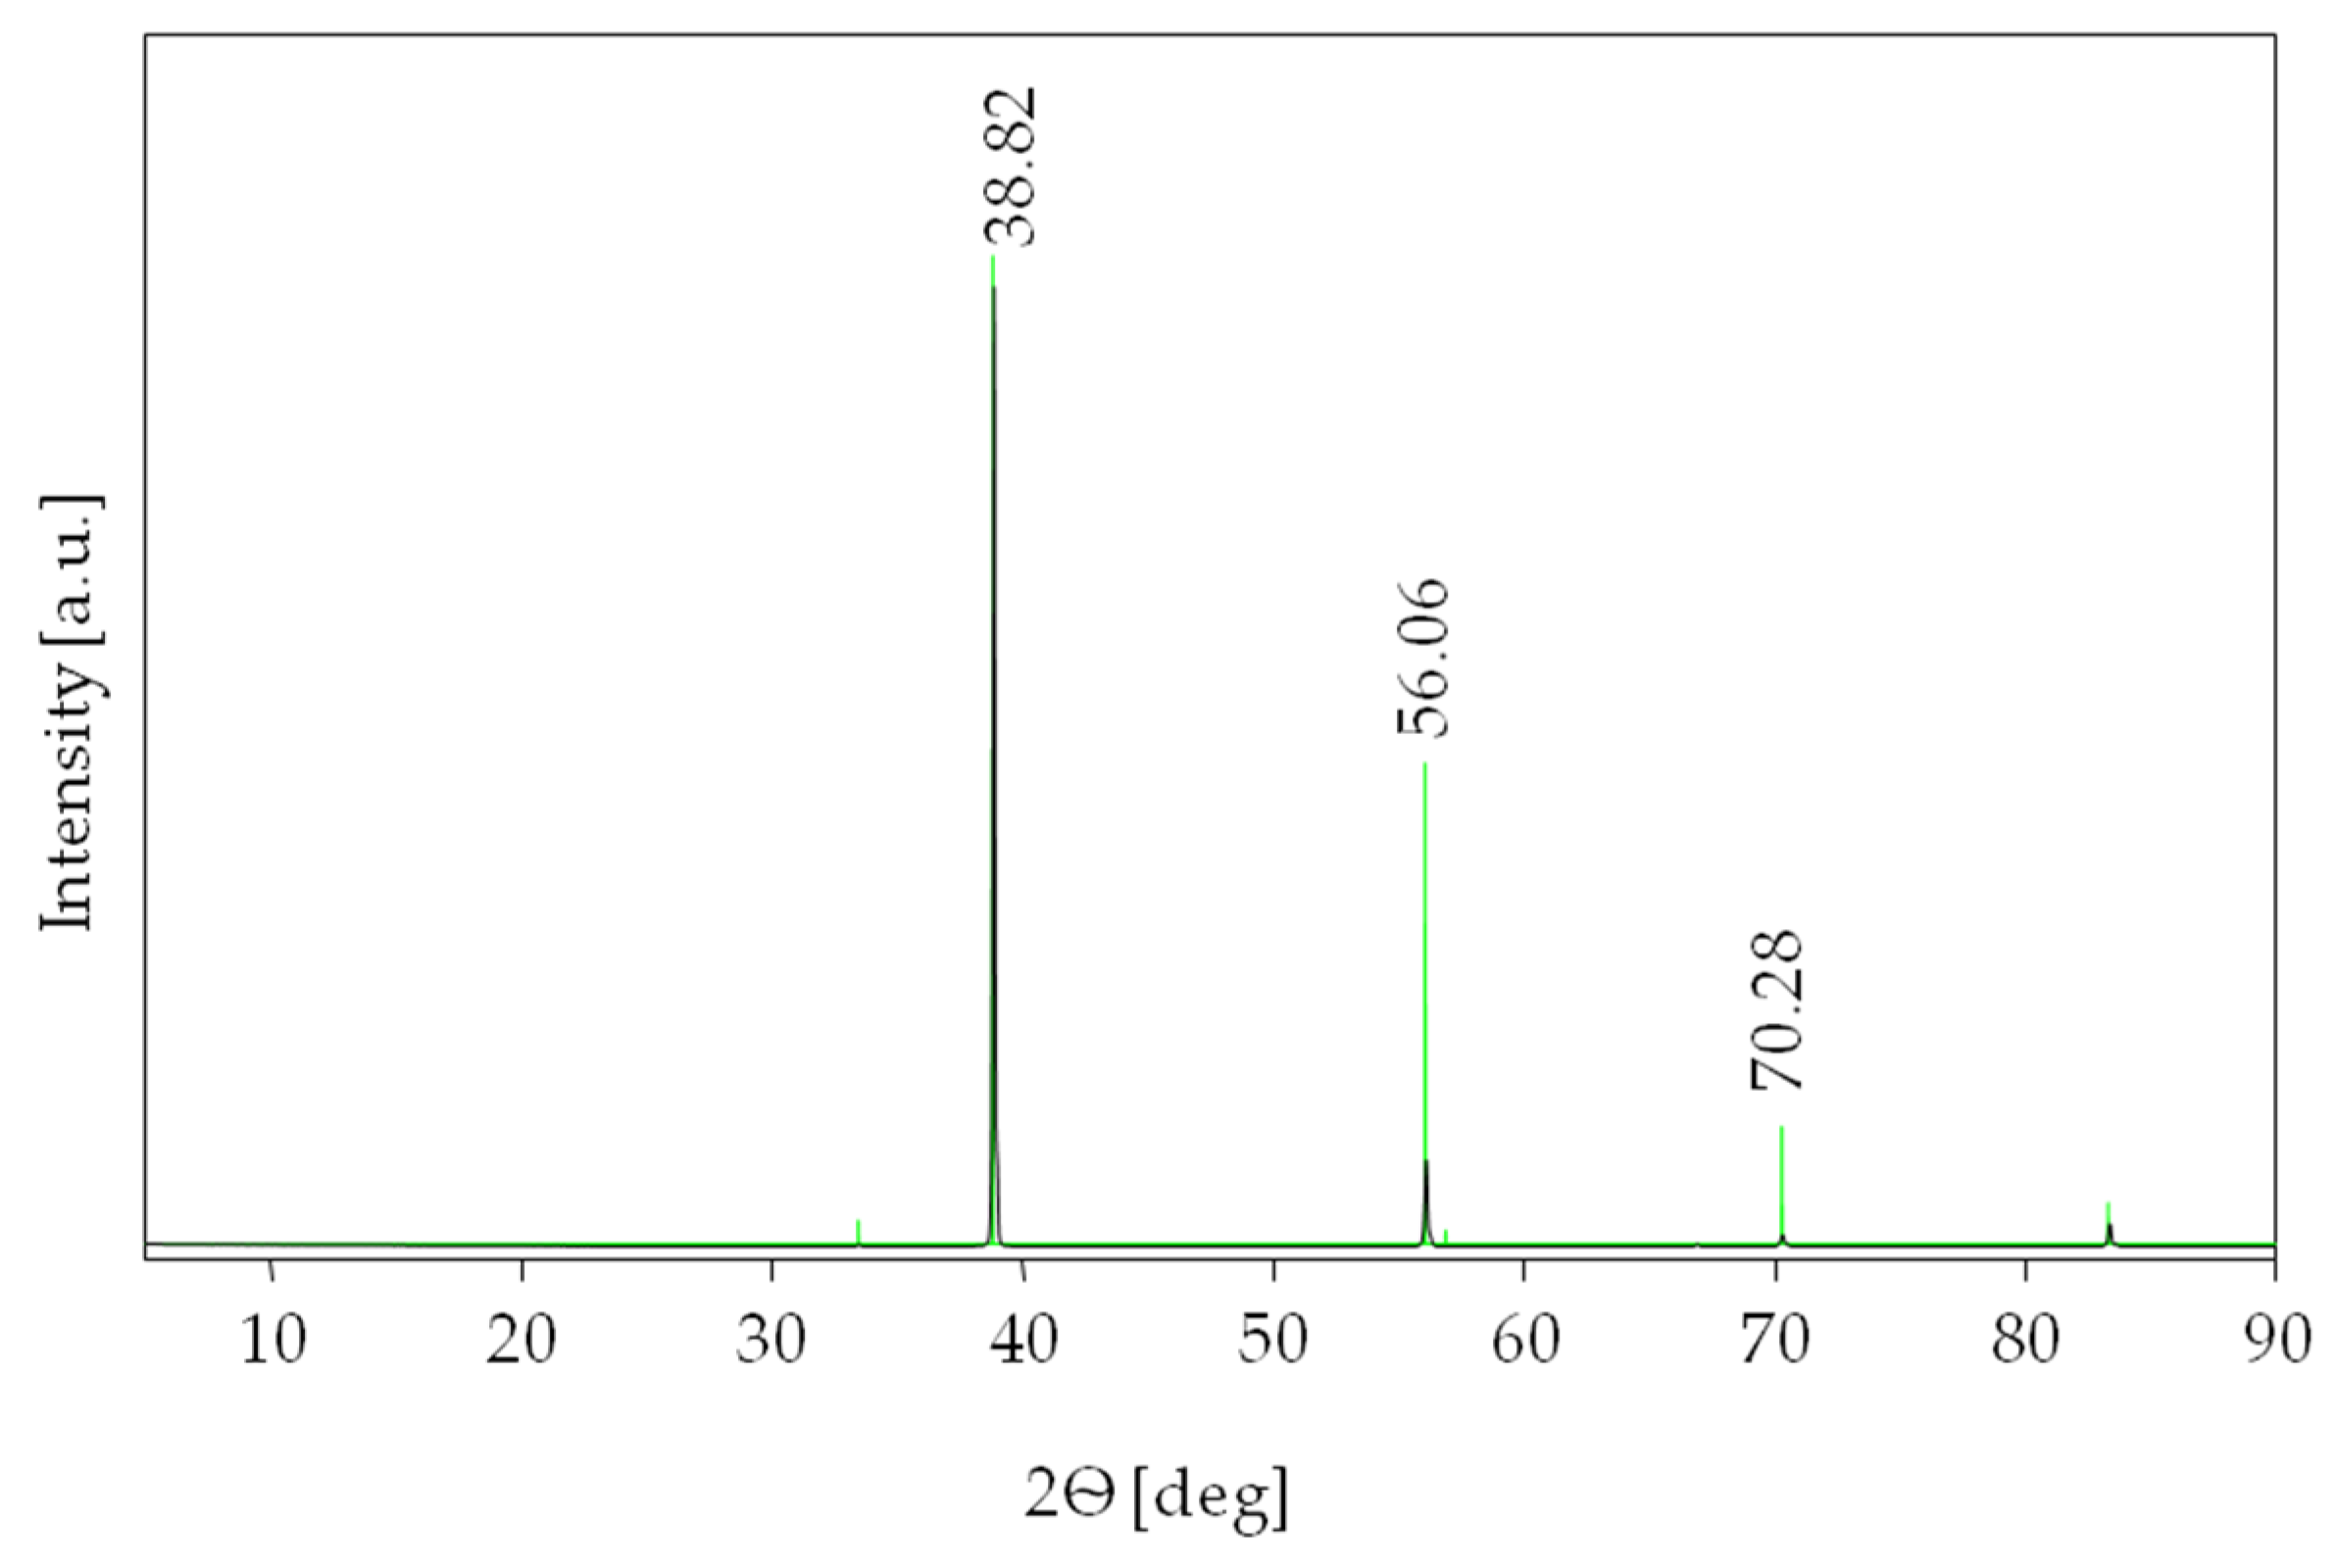
| {200} | 2.31800, 2.31562 | 38.818, 38.86 | 100.0, 100.00 |
| {220} | 1.63910, 1.63807 | 56.062, 56.10 | 48.7, 9.47 |
| {311} | 1.39780, 1.39709 | 66.882, 66.92 | 1.4, 0.27 |
| {222} | 1.33830, 1.33768 | 70.281, 70.32 | 11.9, 1.28 |
| {400} | 1.15900, 1.15826 | 83.307, 83.37 | 4.2, 2.68 |
| Chemical Formula | Crystal Systems | Symmetry Space Group | Unit Cell Parameters | References | |
|---|---|---|---|---|---|
| a = b = c [Å] | α = β = γ [°] | ||||
| NaF | isometric | 4.619 | 90.0 | [47] | |
| 4.63 | 90.0 | [48] | |||
| 4.78 | 90.0 | [49] | |||
| 4.619 | 90.0 | [50] | |||
| 4.650 | 90.0 | [51] | |||
| 4.634 # | 90.0 | [42] | |||
| 4.636 | 90.0 | [41] | |||
| 4.614 | 90.0 | [52] | |||
| 4.632 | 90.0 | [53] | |||
| 4.637 ## | 90.0 | [54] | |||
| 4.600 | 90.0 | Calc. This study | |||
| NaF | ||||||||
|---|---|---|---|---|---|---|---|---|
| No. | Frequency [cm−1] | IR Int. [KM/Mole] | No. | Frequency [cm−1] | IR Int. [KM/Mole] | No. | Frequency [cm−1] | IR Int. [KM/Mole] |
| 1 | 74.41 | 1.46 | 11 | 164.29 | 8.94 | 21 | 281.40 | 1.82 |
| 2 | 98.26 | 0.15 | 12 | 176.11 | 11.12 | 22 | 288.03 | 161.60 |
| 3 | 108.66 | 3.06 | 13 | 189.65 | 163.80 | 23 | 305.20 | 45.35 |
| 4 | 112.14 | 0.81 | 14 | 201.23 | 25.65 | 24 | 336.38 | 43.67 |
| 5 | 129.18 | 1.25 | 15 | 224.19 | 28.24 | 25 | 342.50 | 115.57 |
| 6 | 133.70 | 0.35 | 16 | 239.08 | 17.35 | 26 | 355.00 | 3.00 |
| 7 | 138.69 | 16.43 | 17 | 241.22 | 112.41 | 27 | 358.84 | 6.98 |
| 8 | 146.93 | 9.65 | 18 | 255.05 | 1129.17 | 28 | 377.27 | 325.42 |
| 9 | 151.75 | 8.72 | 19 | 262.01 | 258.56 | 29 | 411.69 | 1242.61 |
| 10 | 155.70 | 0.44 | 20 | 272.90 | 291.27 | |||
Disclaimer/Publisher’s Note: The statements, opinions and data contained in all publications are solely those of the individual author(s) and contributor(s) and not of MDPI and/or the editor(s). MDPI and/or the editor(s) disclaim responsibility for any injury to people or property resulting from any ideas, methods, instructions or products referred to in the content. |
© 2023 by the authors. Licensee MDPI, Basel, Switzerland. This article is an open access article distributed under the terms and conditions of the Creative Commons Attribution (CC BY) license (https://creativecommons.org/licenses/by/4.0/).
Share and Cite
Chruszcz-Lipska, K.; Szostak, E.; Zborowski, K.K. Innovative Structural Characterization of Natural Villiaumite Crystal. Minerals 2023, 13, 1531. https://doi.org/10.3390/min13121531
Chruszcz-Lipska K, Szostak E, Zborowski KK. Innovative Structural Characterization of Natural Villiaumite Crystal. Minerals. 2023; 13(12):1531. https://doi.org/10.3390/min13121531
Chicago/Turabian StyleChruszcz-Lipska, Katarzyna, Elżbieta Szostak, and Krzysztof Kazimierz Zborowski. 2023. "Innovative Structural Characterization of Natural Villiaumite Crystal" Minerals 13, no. 12: 1531. https://doi.org/10.3390/min13121531
APA StyleChruszcz-Lipska, K., Szostak, E., & Zborowski, K. K. (2023). Innovative Structural Characterization of Natural Villiaumite Crystal. Minerals, 13(12), 1531. https://doi.org/10.3390/min13121531