Highlights
- Model-selected input variables for training the GPR model varies in the presence of pulp chemistry data (pH, Eh, dissolved oxygen and temperature).
- RNCA showed the pulp chemistry feature weight in the order dissolved oxygen > pH > Eh > temperature.
- The GPR predictive model performance improves with the addition of pulp chemistry variables.
- Pulp chemistry parameters are essential in predicting rougher copper recovery, particularly for complex ores.
Abstract
Insight about the operation of froth flotation through modelling has been in existence since the early 1930s. Irrespective of the numerous industrial models that have been developed over the years, modelling of the metallurgical outputs of froth flotation often do not involve pulp chemistry variables. As such, this work investigated the influence of pulp chemistry variables (pH, Eh, dissolved oxygen and temperature) on the prediction performance of rougher copper recovery using a Gaussian process regression algorithm. Model performance assessed with linear correlation coefficient (r), root mean square error (RMSE), mean absolute percentage error (MAPE) and scatter index (SI) indicated that pulp chemistry variables are essential in predicting rougher copper recovery, and obtaining r values > 0.98, RMSE values < 0.32, MAPE values < 0.20 and SI values < 0.0034. RNCA feature weights reveal the pulp chemistry relevance in the order dissolved oxygen > pH > Eh > temperature.
1. Introduction
High-grade ores worldwide are depleting due to the increasing demand for valuable metal (e.g., copper, gold, rare earth elements) to satisfy technological advancement and applications in automobiles (e.g., electric vehicles), construction and architecture [1,2,3,4]. This has warranted the treatment of low-grade ores, which are often difficult to process due to their complex association with other gangue minerals [5,6,7,8,9]. For more than a hundred years now, froth flotation has been the main separation technique for the treatment of low-grade copper-bearing ores around the globe [6,10]. In froth flotation, valuable minerals are separated from their associated gangue minerals, based on the difference in their surface wettability, to achieve highest recovery at or above the target grade for sale or subsequent metal extraction processes [11,12]. The performance of froth flotation is known to be affected by several interconnected variables, which can broadly be grouped into ore-related variables (feed grade, feed particle size and liberation), hydrodynamic variables (airflow rate, bubble size, froth depth, impeller speed) and chemical variables (pulp electrochemistry and reagents concentration), with each playing a critical role to ensure valuable mineral selectivity [13,14,15,16,17,18,19,20].
Flotation recovery and concentrate grade are the main performance indicators of the process, and, as such, continuous research efforts have been made toward the maximisation of these two key performance indicators in the area of process automation and optimisation [21]. Such efforts include the development of advanced instruments such as the Multi-Stream Slurry XRF Analyser for online slurry chemical composition [22] and the Magotteaux Pulp Chemistry Monitor (PCM®), which has the ability to measure pulp chemistry variables continuously in real time. These advanced instruments, together with other long-existing instruments that measure variables such as froth depth, bubble size, slurry density, agitator motor power, feed particle size distribution and airflow rate ensure the smooth running of the process [23]. With heaps of real-time and historical data collected on various flotation plants around the globe daily, the strategy has been to predict the overall output of the process in terms of recovery and concentrate grade using data-driven predictive models.
Data-driven models have proven to be more potent than knowledge-based models, particularly for complex nonlinear processes, as detailed operation mechanisms and prior knowledge on research object are not required [21,24,25,26]. Machine learning algorithms have the ability to capture complex nonlinear relationships among flotation variables and also to take on more variables and observations [27,28,29]. Since the early 1990s, several machine learning algorithms, including decision trees, Gaussian process regression (GPR), support vector machine, artificial neural network and random forest, have been applied in the field of minerals engineering [13,26,28,30,31,32,33,34,35]. For instance, in Shahbazi, Chehreh Chelgani [13], a random forest algorithm and its associated variable importance measurement were applied in investigating the effect of particle characteristics and hydrodynamic conditions on flotation rate constant, , and recovery, . The predictive models developed yielded satisfactory results, with R2 values of 0.96 and 0.97 for and , respectively. A GPR model was also applied in Patel, Gorai [34] for the prediction of iron ore grade. An R2 value of 0.9569 was yielded, indicating very good prediction accuracy of the model. It should, however, be noted that, irrespective of the higher predictive accuracy of machine learning models over knowledge-based models, the former require retraining when there is a significant drift in the correlation structure between the various input and output variables.
Going through the literature, it was observed that the various machine learning models that have been developed for predicting the metallurgical outputs of froth flotation do not include comprehensive data on pulp chemistry, and, even when they do, it is only on pH, which is just a component of pulp chemistry (Table 1). Pulp chemical conditions, especially those pertaining to electrochemistry, are known to significantly impact froth flotation, owing to their role in mineral collector interactions [36,37,38,39,40]. Studies have shown that pulp redox potential and pulp oxygen content are factors that strongly affect overall flotation performance [15,17,19,41,42]. For instance, Plaksin and Bessonov [42] established the relationship between oxygen content and floatability by demonstrating that interactions of xanthate with sulphide minerals increases with increasing pulp oxygen content. Furthermore, flotation experiments on chalcopyrite and galena ore from Black Mountain ore revealed that increasing oxygen level in pulp enhances copper recovery significantly [43,44]. In terms of temperature, Lin [45] found out that annual low temperatures (12 °C) had a negative impact on the floatability of a flotation process as compared to ambient temperatures (28 °C). O’Connor and Mills [46] discovered that both recovery and grade increased with increasing temperature during pyrite flotation test work. Foroutan, Abbas Zadeh Haji Abadi [47], Nasirimoghaddam, Mohebbi [48] and Azizi, Masdarian [49] have also carried out studies that have proven the impact of pH on flotation recovery and grade.

Table 1.
Comparison between this work and some froth flotation machine learning models.
Whilst the changing ore characteristics and mineral liberation during grinding affects flotation recovery and concentrate grade, online monitoring is not currently deployed for these variables during mineral processing. The change in ore characteristics mostly reflect in the pulp chemistry due to mineral electrochemical reactions (e.g., galvanic interactions) that occur during processing (e.g., grinding) [40].
In our previous work [26], a regularised neighbourhood component analysis (RNCA) algorithm was used to establish some relevant rougher flotation variables that were able to predict rougher copper recovery using a GPR algorithm. With motivation from our previous article, the main goal of this work is to ascertain the predictive influence of pulp chemistry variables in terms of pH, pulp potential (Eh), dissolved oxygen and temperature on rougher copper recovery. The main research questions that will be addressed in this work are:
- How does pulp chemistry variable addition to existing model-selected variables affect rougher copper recovery performance?
- Does the addition of pulp chemistry variables during input variation selection encourage elimination of some originally model-selected flotation process variables in predicting the rougher copper recovery?
- What is the predictive accuracy of a GPR algorithm in predicting rougher copper recovery with and without pulp chemistry variables?
2. Methodology
This section highlights the various methodologies utilised in this work. The specific subsections that will be captured are data collection and pre-processing, model development and model performance assessment. Variable selection by RNCA algorithm, as well as the theoretical overview of GPR algorithm, will not be captured here, as detailed explanation has already been given in Amankwaa-Kyeremeh, Zhang [26]. MATLAB 2020b (64-bit version) software was used to run all the algorithms.
2.1. Data Collection and Pre-Processing
Data for this work was collected from the rougher bank of BHP Olympic Dam, South Australia. Details of the rougher bank under consideration and the mineralisation of the ore treated at the mine are fully highlighted in Ehrig, McPhie [72] and Amankwaa-Kyeremeh, Zhang [26], respectively. While plant process variables are extensively monitored with sensors and other automatic samplers, the story is not the same for pulp chemistry variables. As such, PCM® was installed on the rougher bank to collect pulp chemistry data on rougher flotation feed for three continuous weeks. The operating principle of PCM® is below:
- Sample from a chosen slurry stream is collected into the PCM® sample vessel;
- The pulp chemistry sensors (e.g., pH, Eh and dissolved oxygen) are contacted for 2 min in the PCM® sample vessel. A time of 2 min was selected as it allows stable sensor readings for each batch slurry sampling;
- The measured data is logged and time-stamped;
- The PCM® sample vessel is then flushed clean for new sample collection. This process is repeated every 3–5 min.
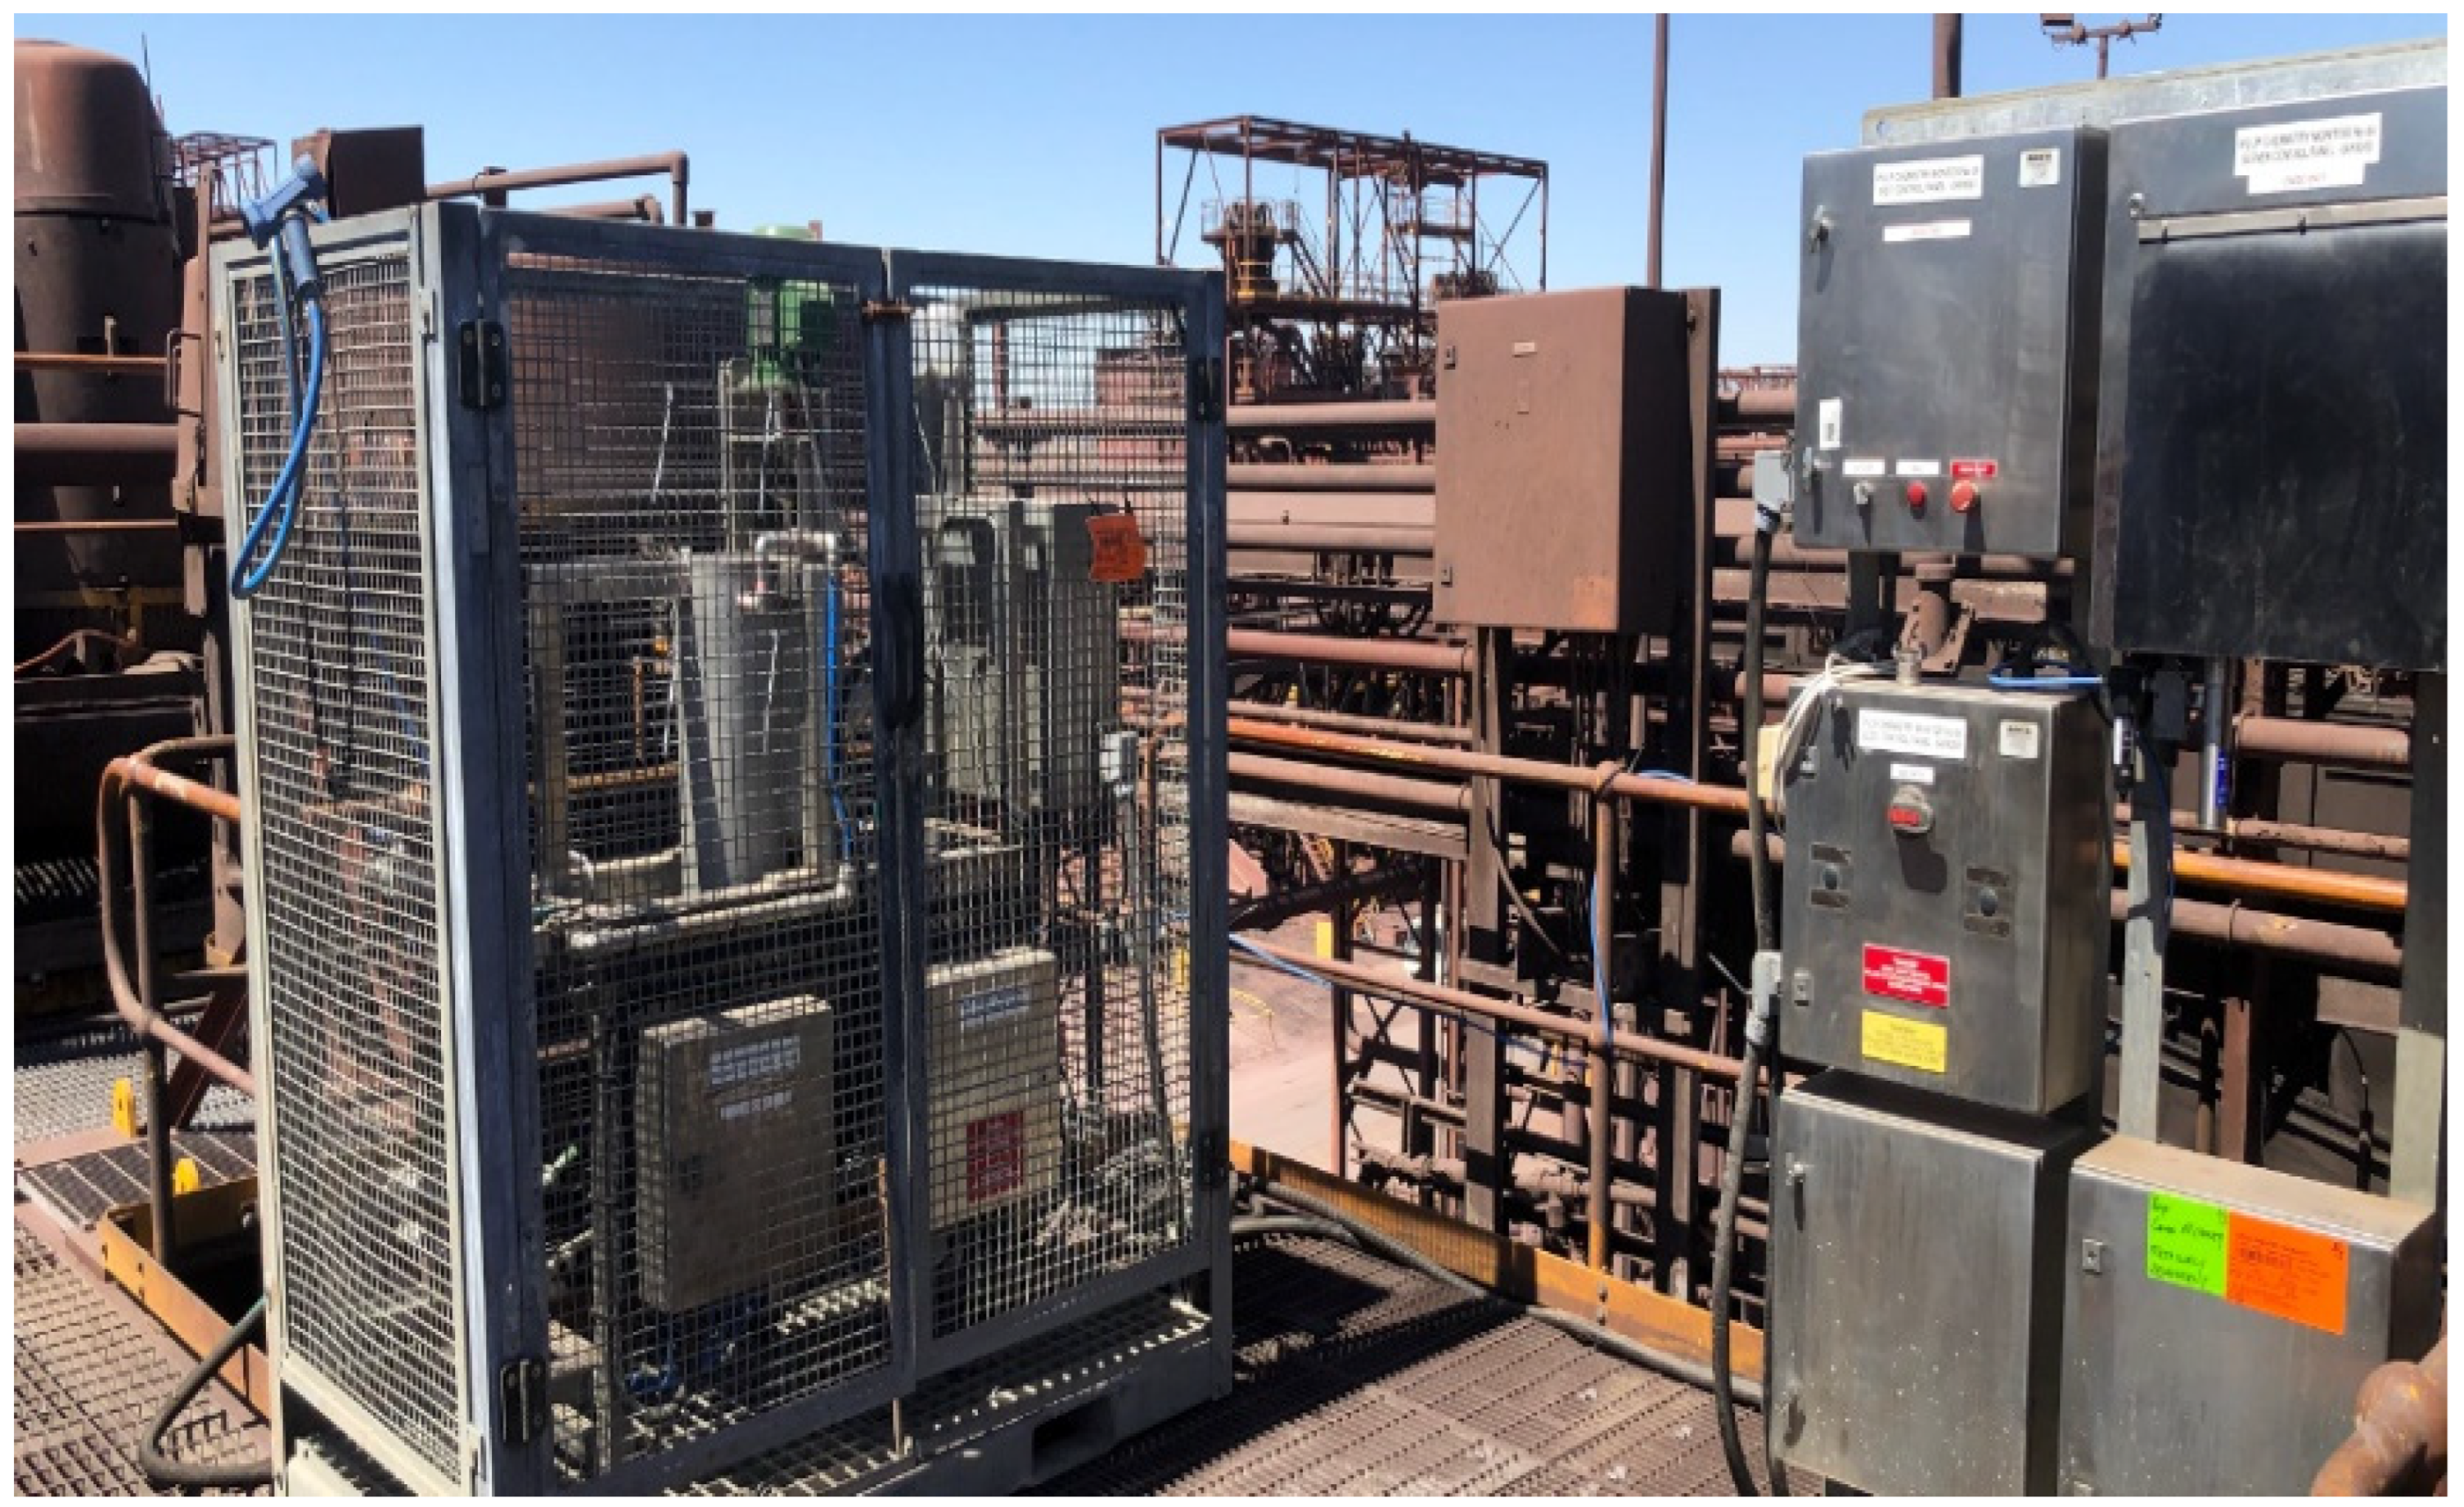
While reading occurs, an impeller mixes the sample to ensure the solids remain in suspension. Figure 1 shows an image of an installed PCM® at BHP Olympic Dam.
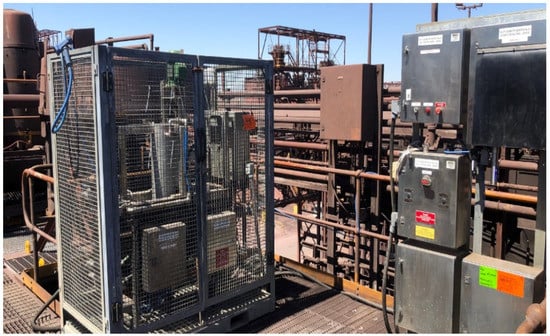
Figure 1.
An installed PCM® at BHP Olympic Dam. The PCM® is installed on the rougher flotation circuit of the concentrator.
To begin the data collection, a three-week span of data on the 9 established rougher flotation variables, together with their corresponding recovery values, were downloaded from the data historian of BHP Olympic Dam. A pseudo-steady state was ensured for the flotation plant in collaboration with the plant operators prior to obtaining the measurements. Due to confidentiality agreement with BHP Olympic Dam, direct measurements of the investigated variables cannot be disclosed. Therefore, the standardized data has been shared with their distribution. Each variable data consisted of 1727 time-stamped observations and had a confidence of 100%. This was further matched with corresponding time-stamped rougher flotation feed pulp chemistry data collected by the PCM®. The extracted plant process variables and the pulp chemistry variables considered for this work are shown in Table 2. Indexes have been assigned to all variables under consideration for easy identification during variable selection by RNCA algorithm. The rougher copper recovery (output variable) was determined from different process streams (rougher feed, cleaner concentrate and scavenger tails) using Online Stream Analyser (OSA) results. For more information on this method, refer to our previous publication [26]. It is evident that an additional feed grade input variable was not added to the list shown in Table 2. This is consistent with our previous work, where RNCA eliminated the feed grade as an additional input variable. The significance of feed grade on flotation behaviour and copper recovery is critical and well-known. It is worth noting that the feed grade implications have been considered and captured for the model development through the rougher copper recovery.

Table 2.
Summary of considered variables.
Following this, the data was cleaned to get rid of all outliers owing to the transient operations of some data collection instruments, which sometimes occur on the plant. The outliers were removed based on domain knowledge of acceptable operating setpoint of each variable, as established by the metallurgical team at BHP Olympic Dam. In order to have same size dataset for the analysis, outliers detected in a particular variable data were deleted alongside values in the remaining variables data. The entire data cleaning resulted in a dataset of 1660 useful observations for this work. Data standardization was also carried out as part of the pre-processing stage using Equation (1).
where
- th standardized observation
- th observation of sample
- mean of sample
- standard deviation of sample
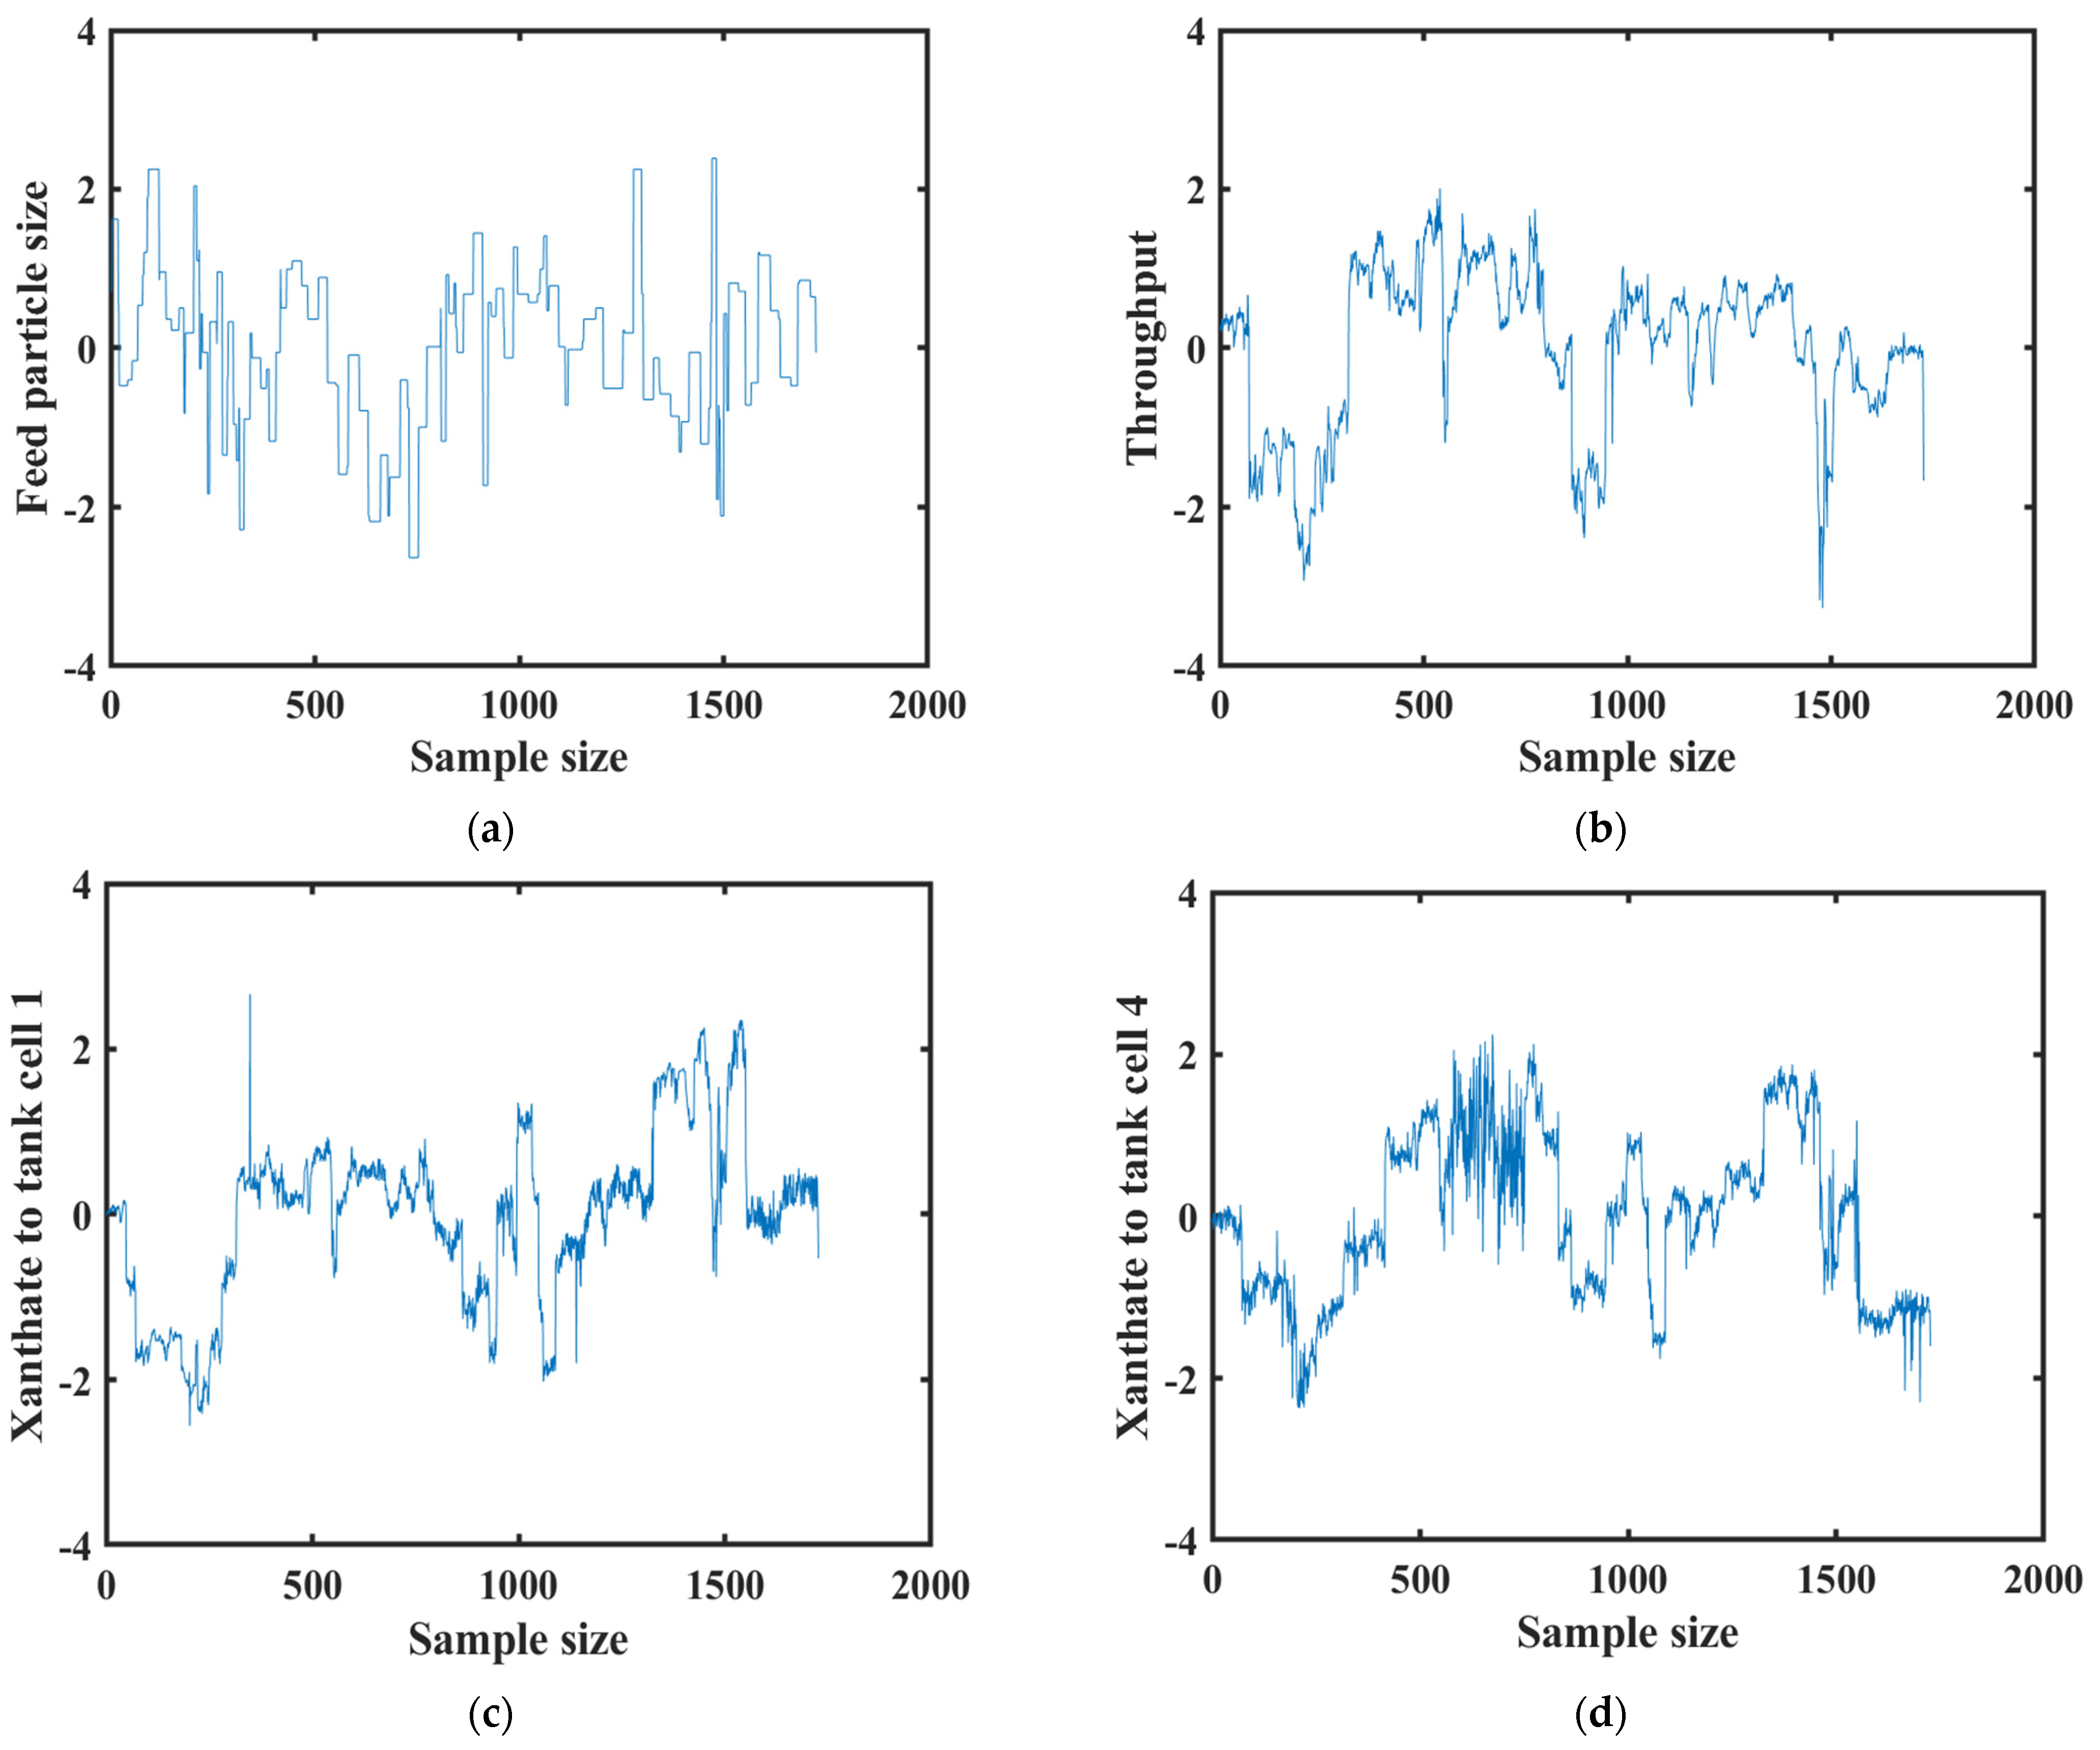
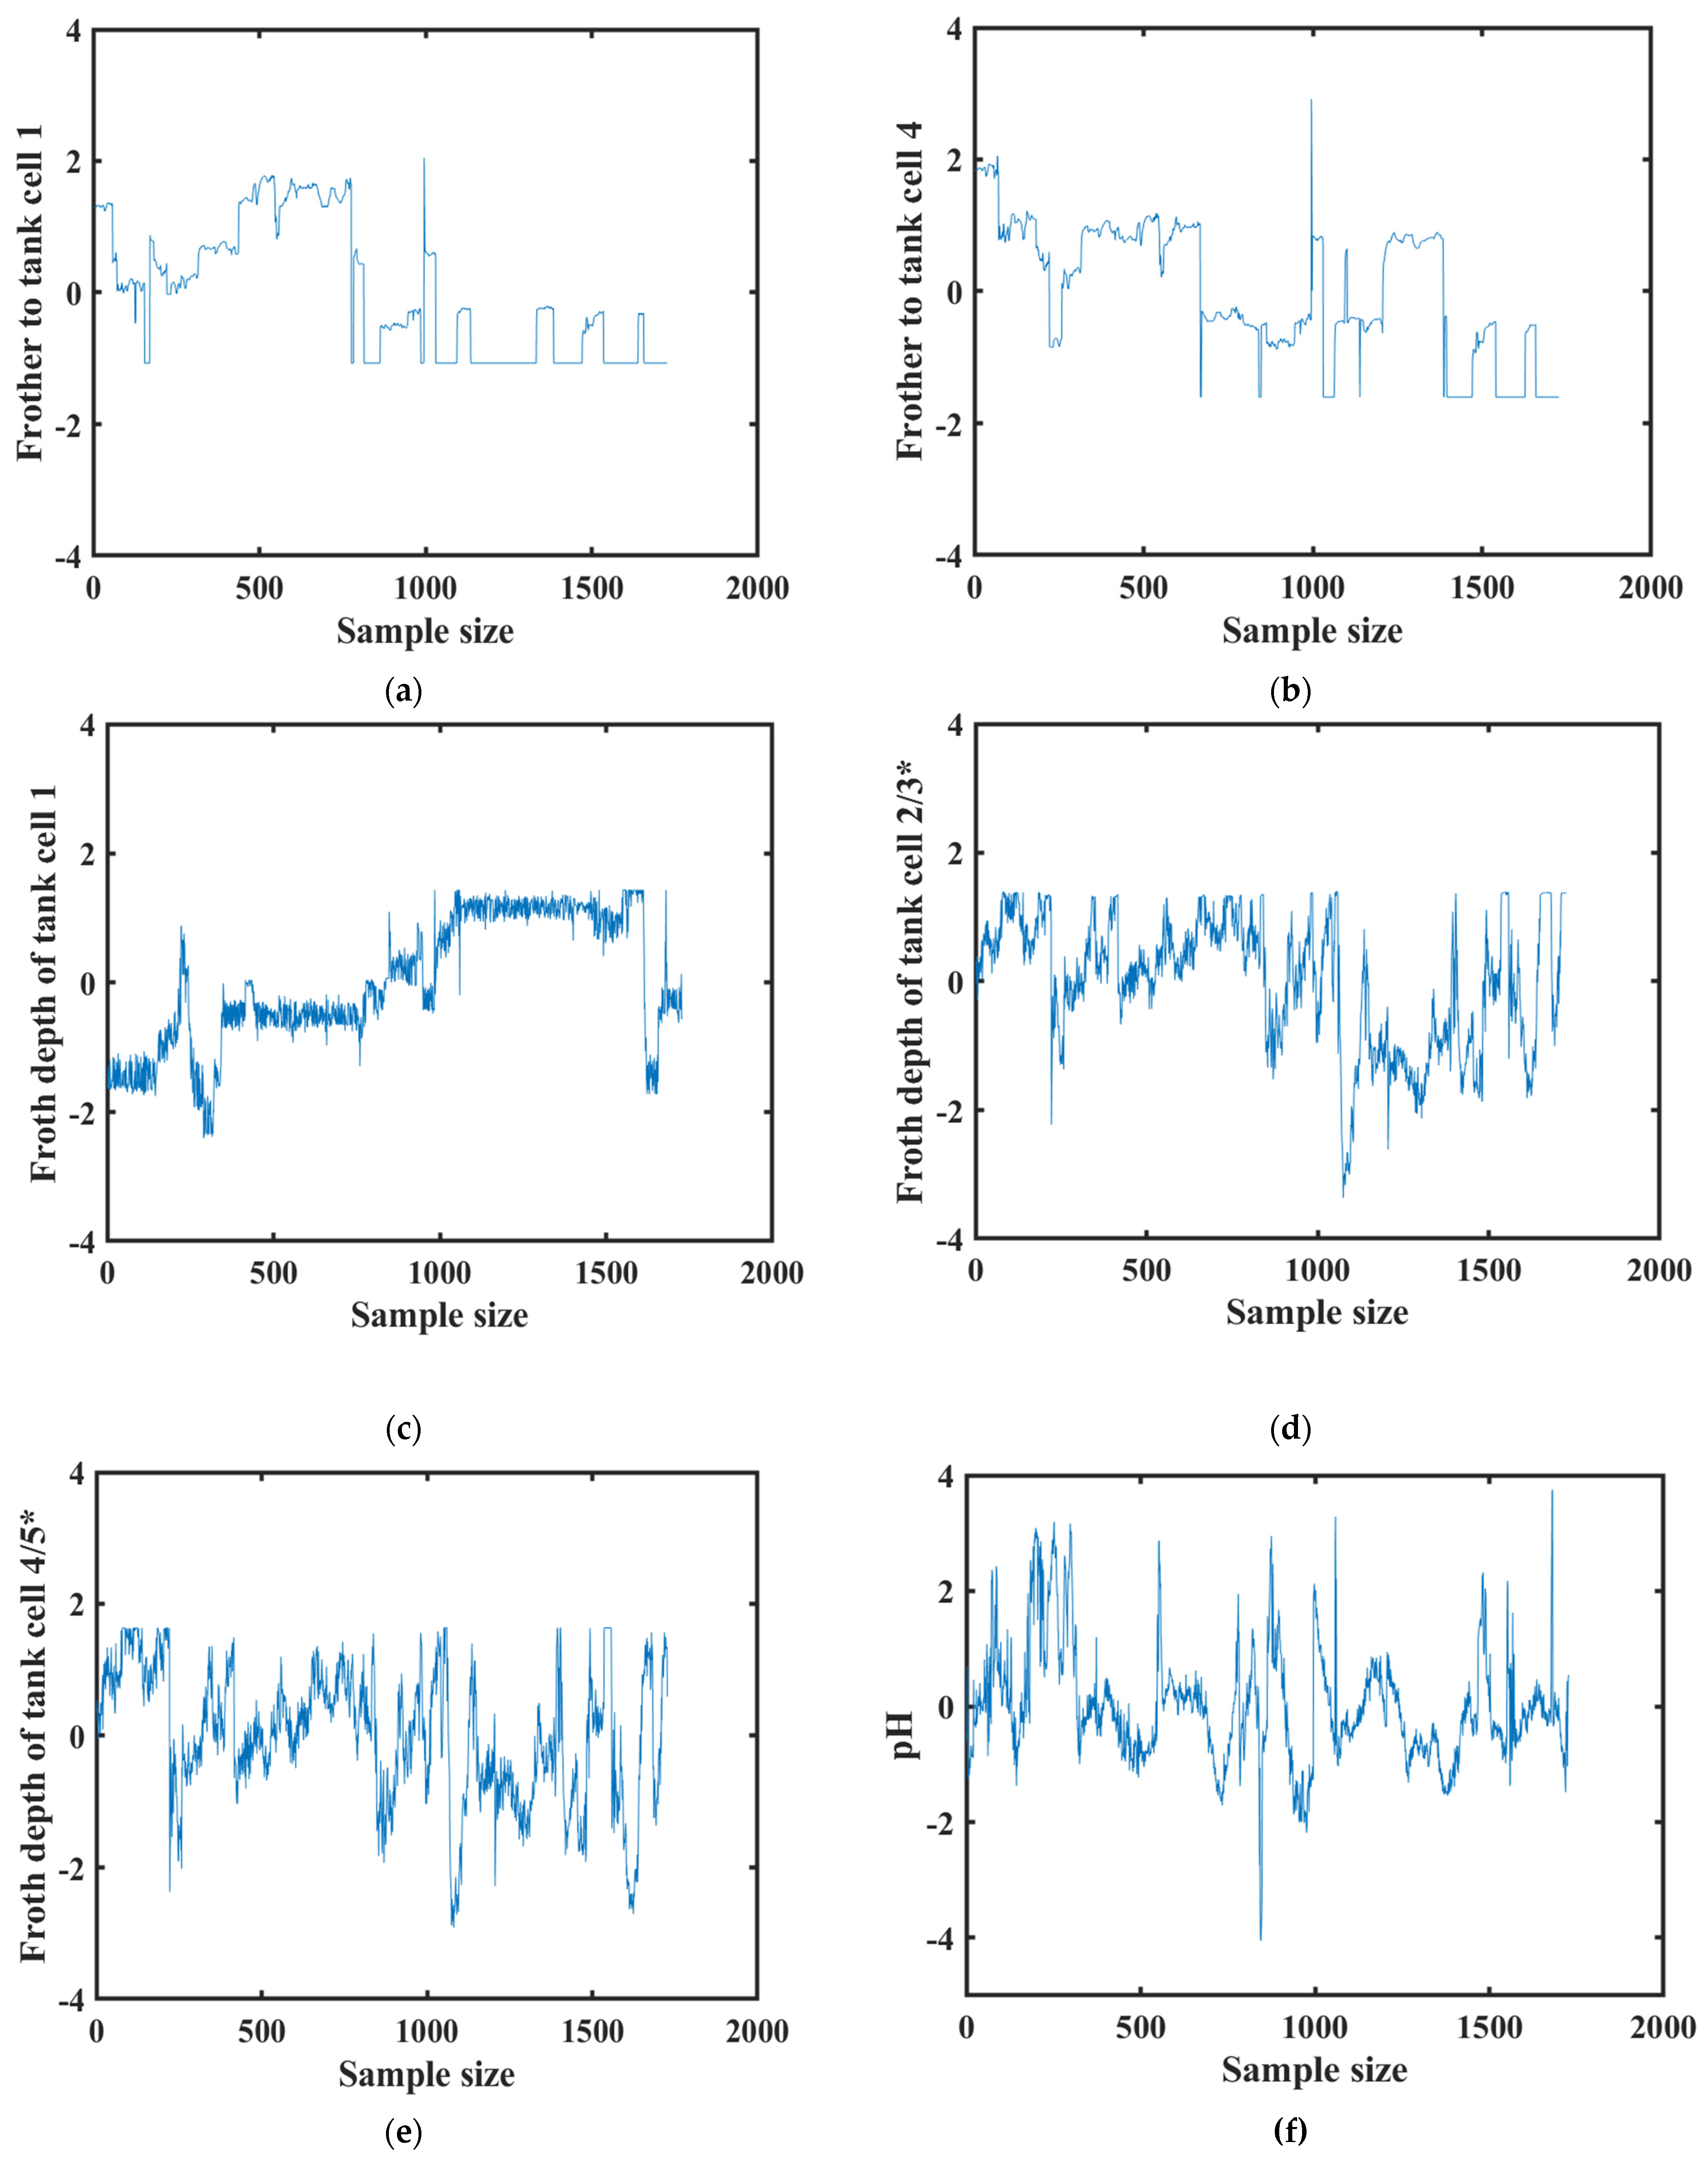
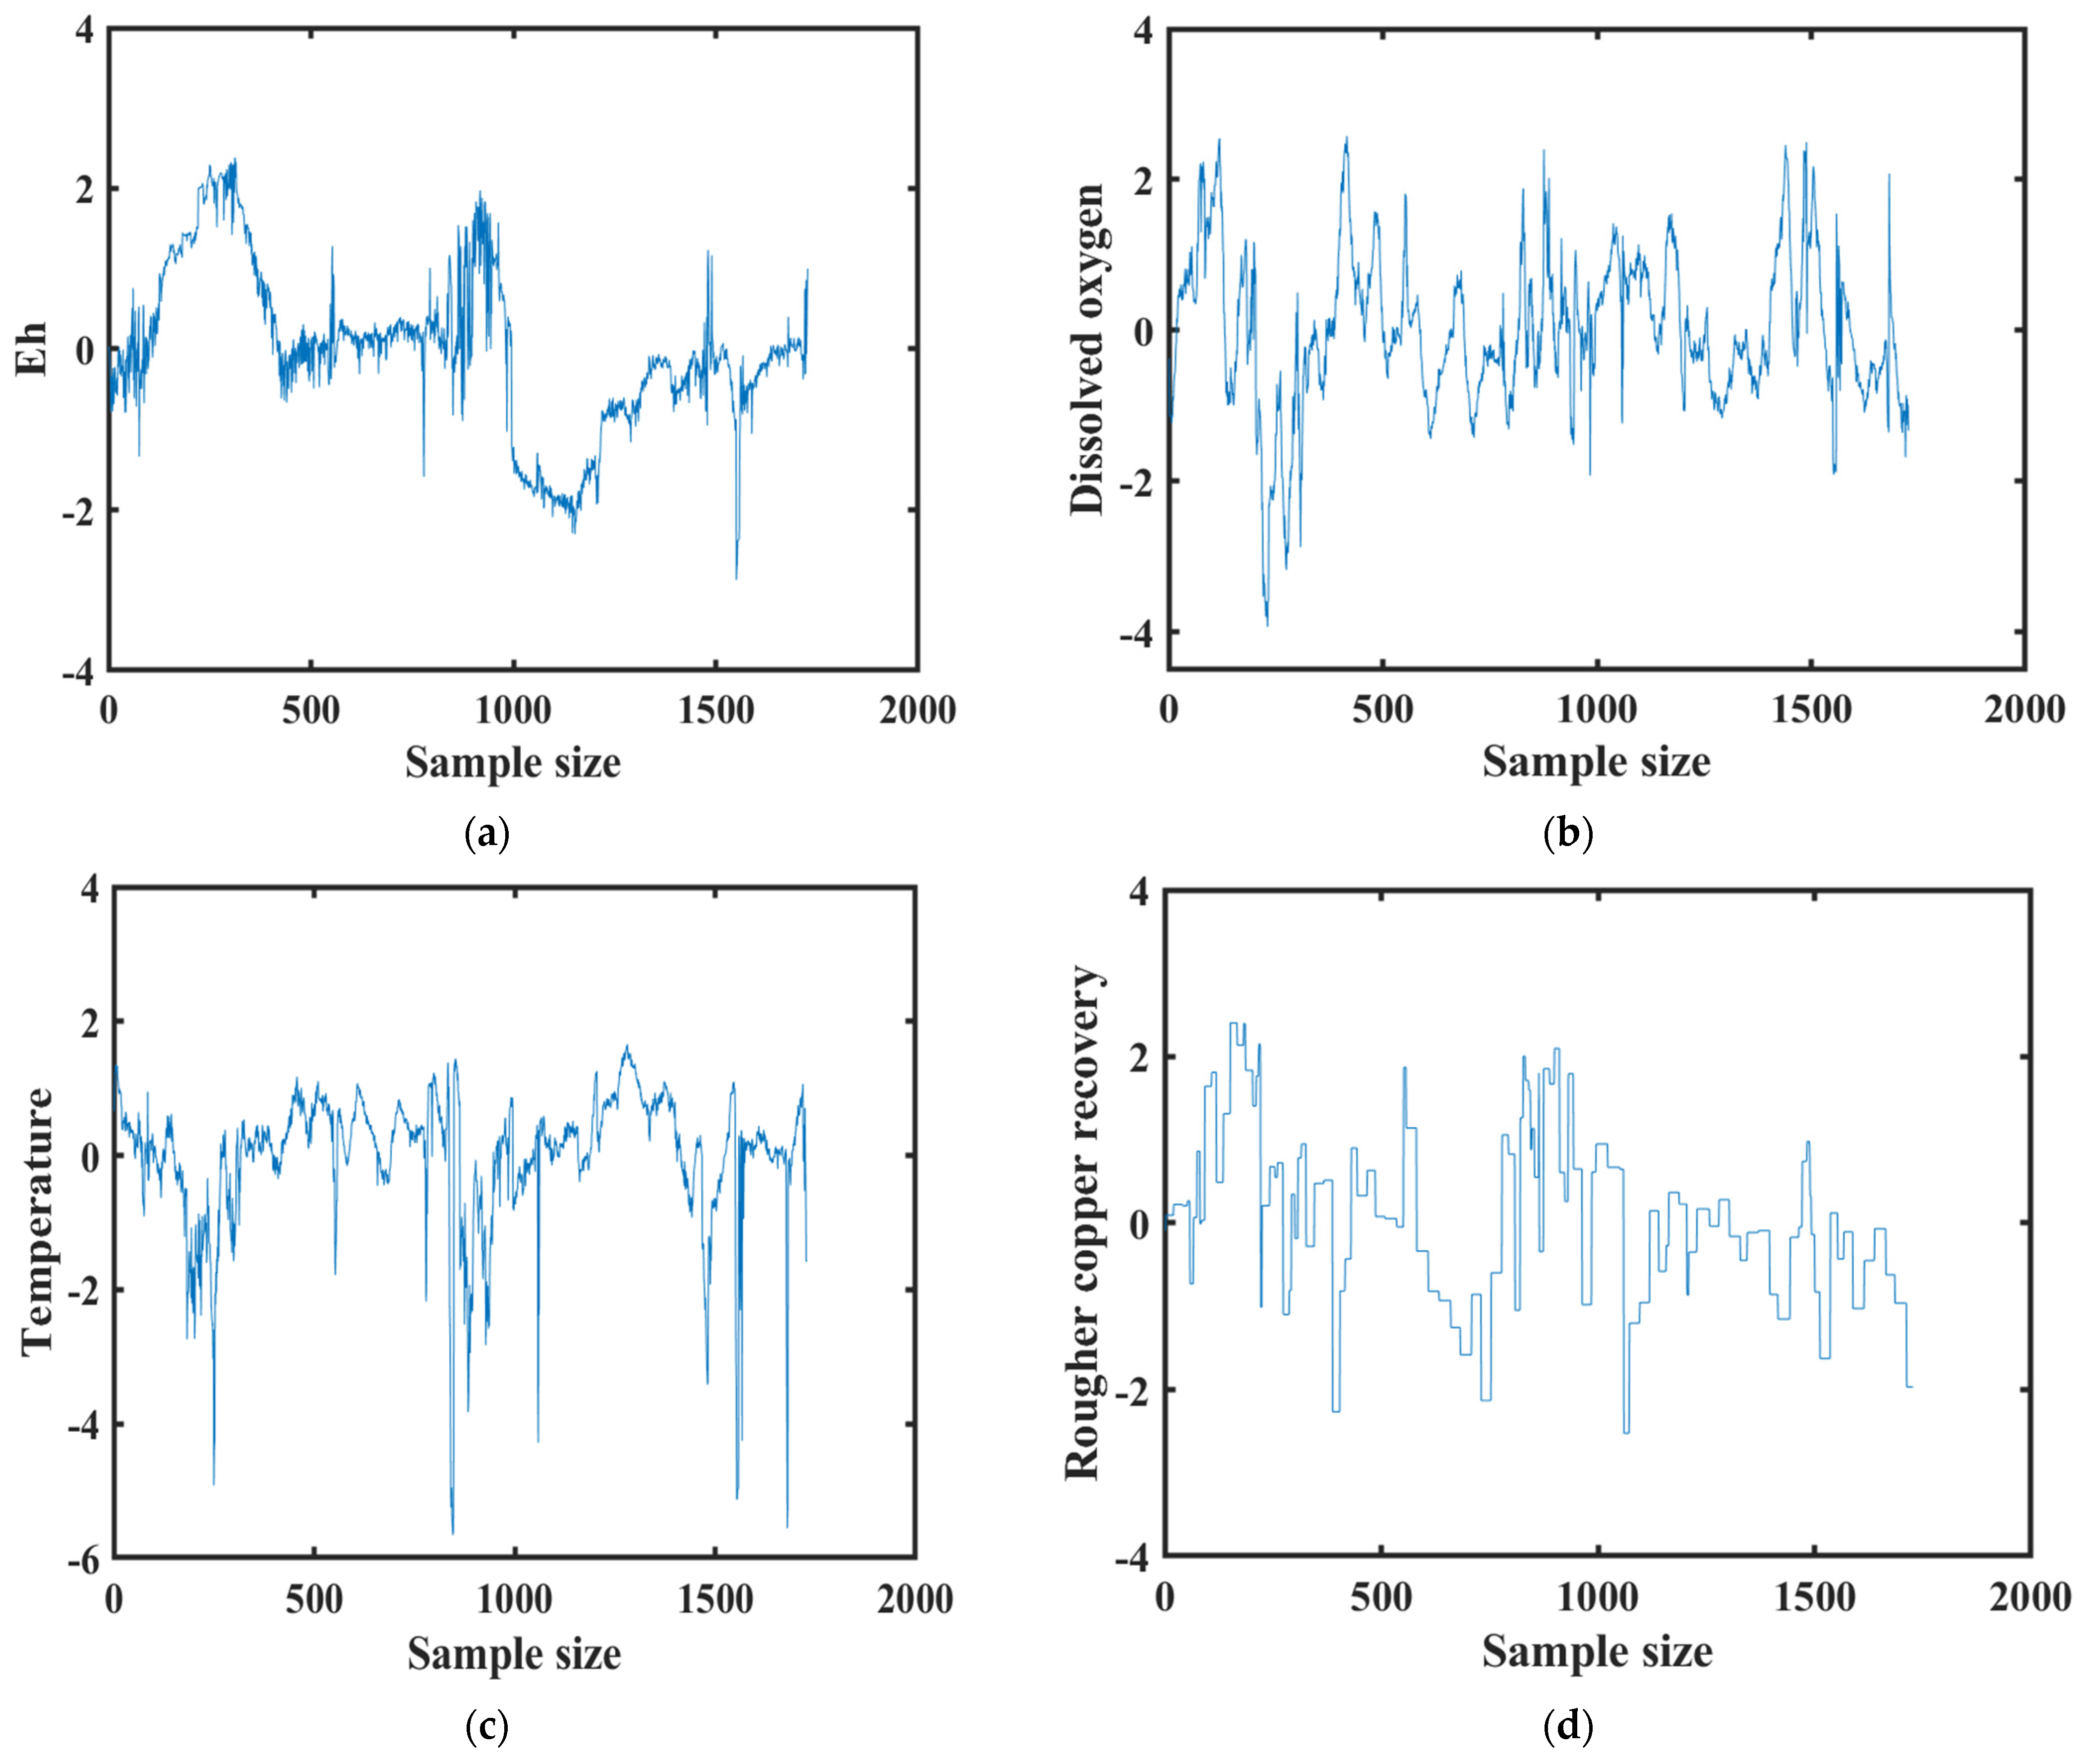
The data was standardized to have a same scale data for the analysis, as extremely different scale data affects model prediction outcome. Results are presented in normalised data state throughout this work for the purpose of data confidentiality. Figure 2, Figure 3 and Figure 4 have been used to provide the visualisation of the variation in the data used for this work.
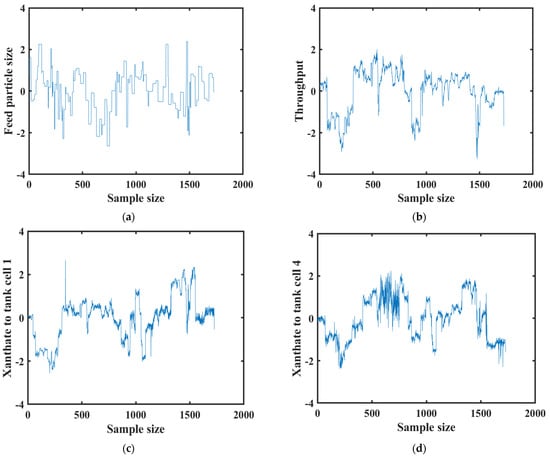
Figure 2.
Visualisation of variation in (a) feed particle size, (b) throughput, (c) xanthate to tank cell 1, (d) xanthate to tank cell 4.
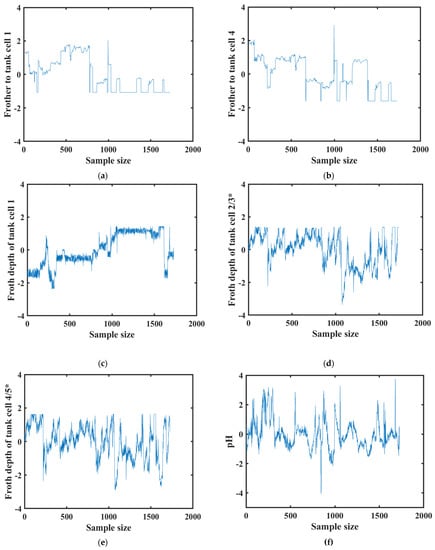
Figure 3.
Visualisation of variation in (a) frother to tank cell 1, (b) frother to tank cell 4, (c) froth depth of tank cell 1, (d) froth depth of tank cell 2/3, (e) froth depth of tank cell 4/5, (f) pH. *Froth depth of tank cells 2 and 4 also represent tank cells 3 and 5, respectively, as they are kept at same level.
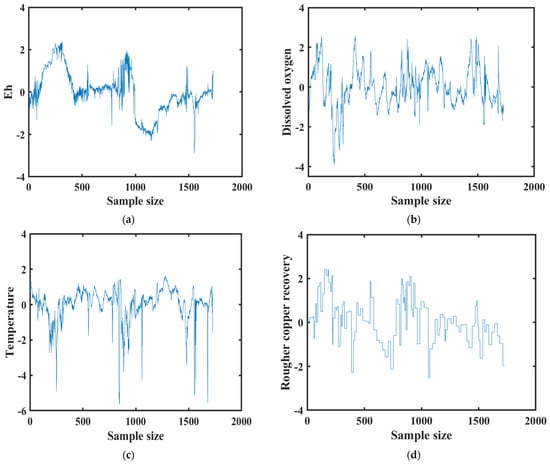
Figure 4.
Visualisation of variation in (a) Eh, (b) dissolved oxygen, (c) temperature, (d) rougher copper recovery.
2.2. Model Development
GPR algorithm with exponential covariance function was used to establish the relationship between input and output variable(s) outlined in Table 2. For this work, three modelling scenarios were considered, using the same output variable in each case but with different input variables. In the first scenario, only the established rougher flotation variables were used as the input variables. The second scenario saw the combination of both the established rougher flotation variables and pulp chemistry variables as input variables. In the last scenario, only variables sub-selected by RNCA algorithm were used as input variables. Table 3 summarises the various modelling scenarios considered in this work.

Table 3.
Summary of modelling scenarios.
In order to avoid overfitting of the models, the pre-processed dataset was randomly divided into 80% training dataset (1328 observations) and 20% testing dataset (332 observations) using the popular hold-out cross validation approach. There is no general rule for the partition ratio; however, the common practice is that the training dataset should be signficantly larger than the testing dataset, capturing the full characteristics of the entire dataset. The models were trained with the training dataset and fitted with the training and testing datasets.
2.3. Model Performance Assessment Criteria
This work made use of correlation coefficient (r), root mean square error (RMSE), mean absolute percentage error (MAPE) and scatter index (SI) as model performance assessment criteria. Mathematically, these criteria are expressed in Equations (2)–(5) [73,74]. It is expected of a good performing model to obtain r values close to 1, with RMSE, NRMSE, MAPE and SI values approaching zero as possible.
where,
- th true rougher copper recovery value
- mean of true rougher copper recovery
- th predicted rougher copper recovery value
- mean of predicted rougher copper recovery
- maximum true rougher copper recovery value
- minimum true rougher copper recovery value
- total number of observations
3. Results and Discussion
Results of this work have been presented in this section. In Section 3.1, the results of variable selection by the RNCA algorithm were captured, and Section 3.2 ends this section with the results on detailed model performance.
3.1. Variable Selection by RNCA Algorithm
An RNCA algorithm was used to select relevant variables for the prediction of rougher copper recovery from a list of variables (Table 2). Variables were selected upon obtaining a feature weight greater than zero. To enhance the performance of the algorithm, lambda value and the number of folds, which are the main hyperparameters of an RNCA algorithm, were tuned simultaneously, as shown in Table 4. The best lambda value was selected after tuning the regularization term, which aids in avoiding RNCA overfitting, for the minimum loss. Additional information on the RNCA algorithm can be found in our previous publication [26]. From Table 4, it can be seen that, as compared to the established rougher flotation variables (x1, x2, x3, x4, x5, x6, x7, x8, x9), where at least one of them was dropped in each instance, the four pulp chemistry variables (x10, x11, x12, x13) were continuously selected among relevant variables for the prediction of rougher copper recovery in all instances.

Table 4.
Results of various k-folds and best lambda values in selecting relevant variables.
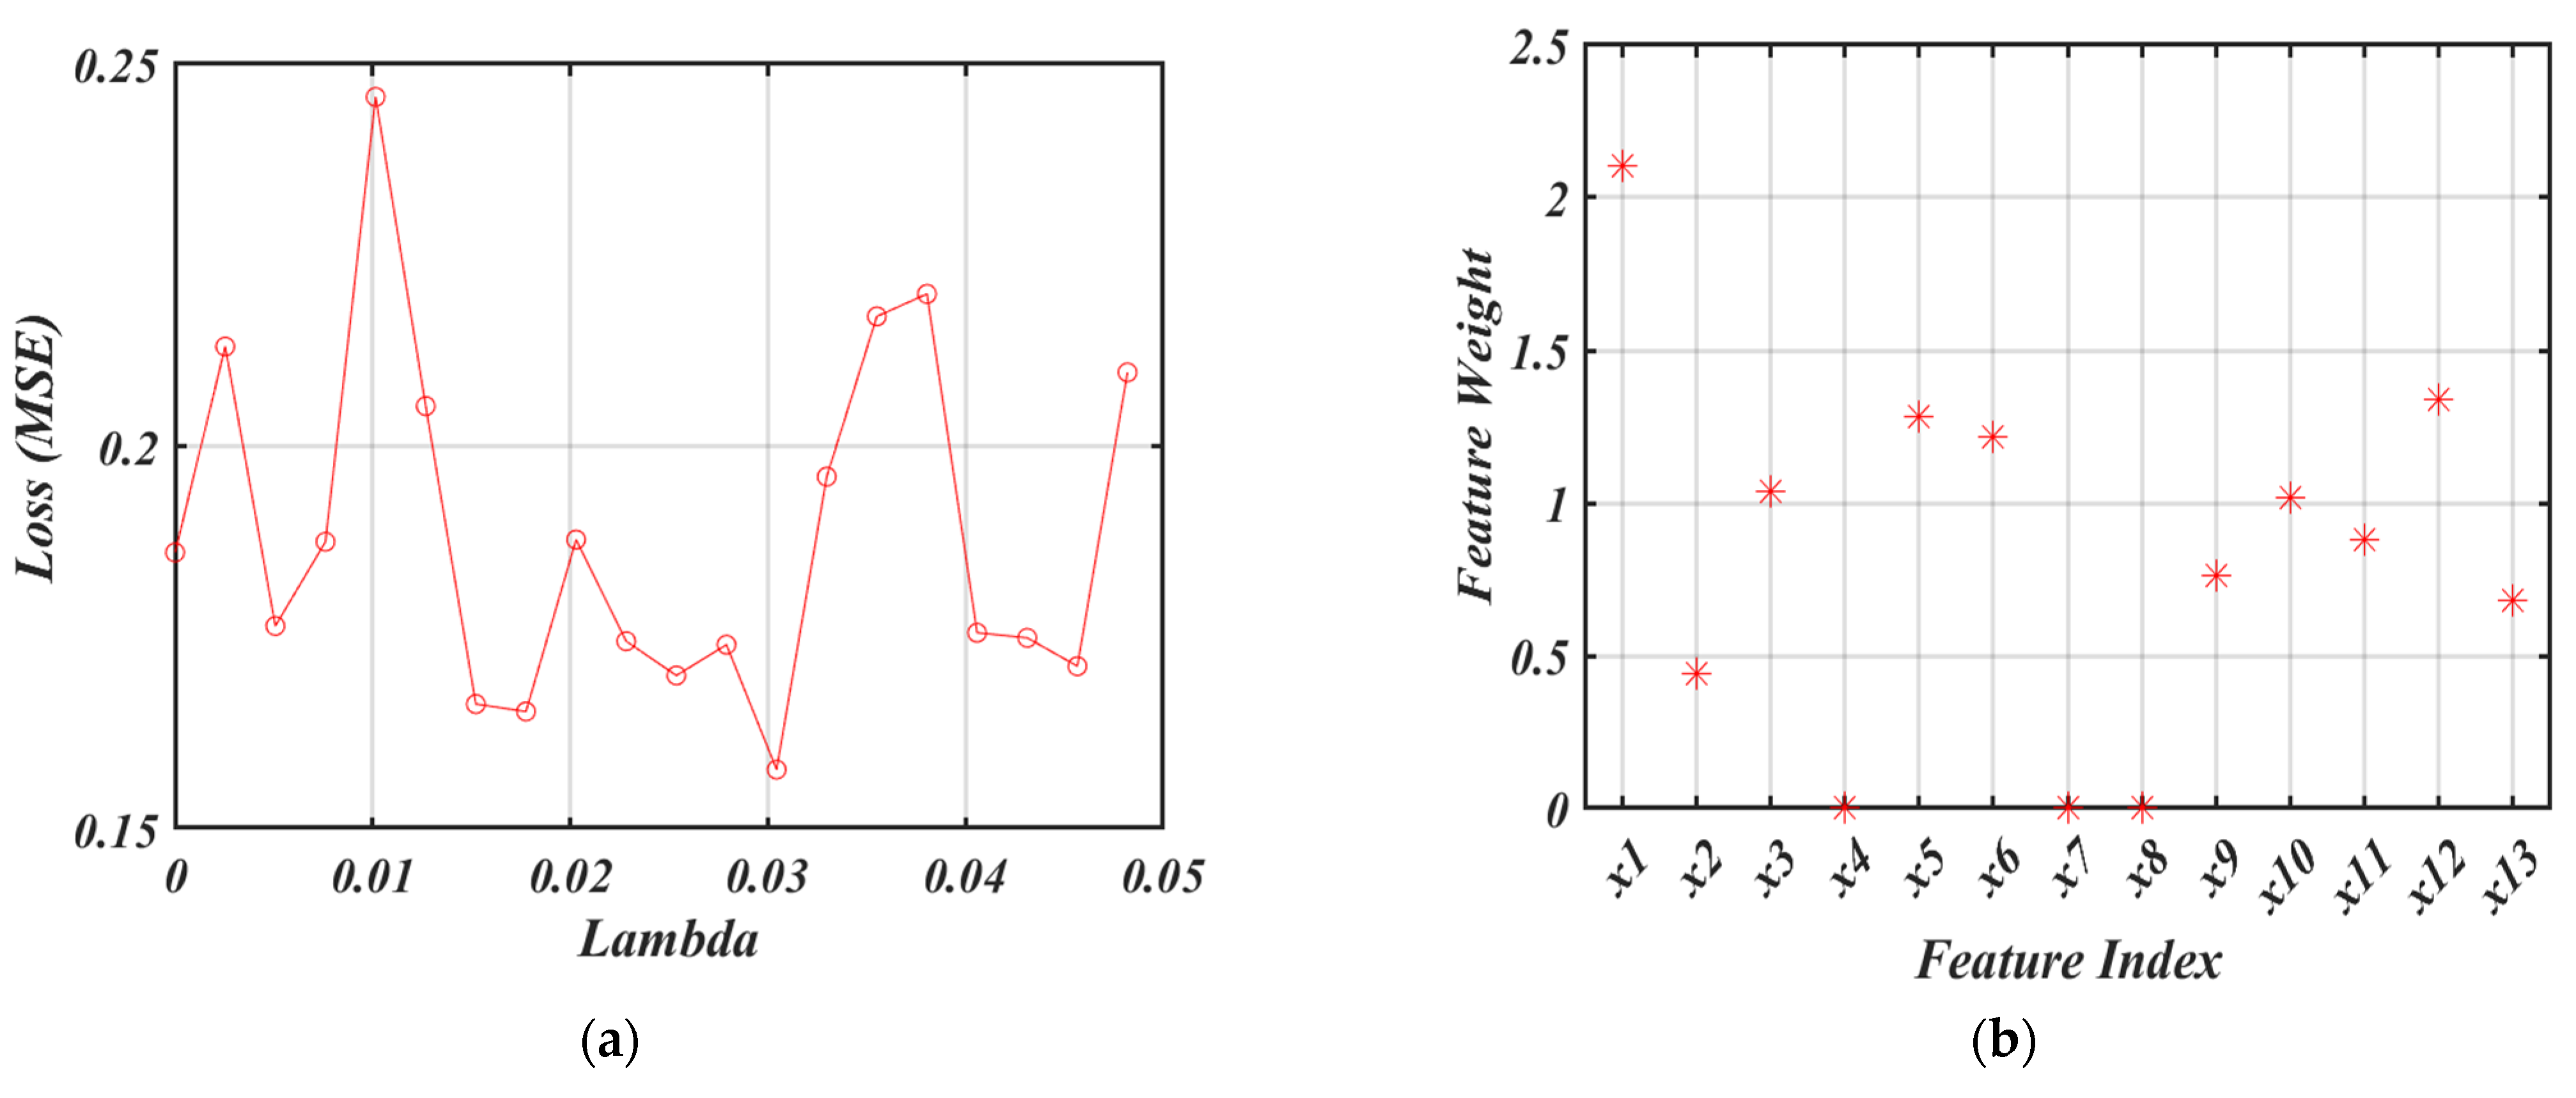
With the goal of selecting the least number of variables for the prediction of rougher copper recovery, results from Table 4 further indicate that a best lambda value of 0.0304 and a 6-fold cross validation selects the least number of variables for the prediction of rougher copper recovery. Selected variables using this combination were feed particle size, throughput, xanthate to tank cell 1, frother to tank cell 1, frother to tank cell 4, froth depth of tank cell 4/5, pH, Eh, dissolved oxygen and temperature. These selected variables were used as input variables for the model development in scenario 3. The tuning of the best lambda value using 6-fold cross validation is visualised in Figure 5. The feed particle size (% passing 75 μm) showed the highest RNCA feature weight, which is consistent with our previous study [26]. The pulp chemistry variables relevant for the prediction of the rougher copper recovery are shown by the RNCA feature weight in the order dissolved oxygen > pH > Eh > temperature.
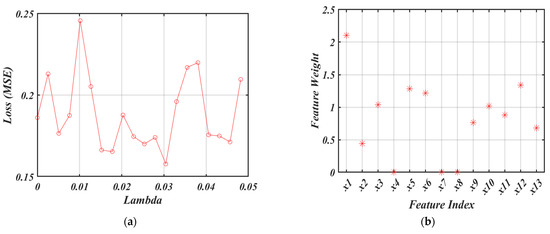
Figure 5.
Optimum conditions for RNCA algorithm (a) estimation of lambda value with the minimum loss using 6-fold cross validation, (b) variable weights of all variables using a best lambda value of 0.0304.
3.2. Model Performance Assessment
The robustness of the developed predictive models was assessed by computing the difference between true and predicted rougher copper recovery values using r, RMSE, MAPE and SI criteria, as shown in Table 5.

Table 5.
Results of model performance assessment.
From Table 5, the results show nearly perfect model performances for all scenarios when predictions were made with the training dataset, recording r values > 0.999, RMSE values < 0.0006, MAPE values < 0.0004 and SI values < 0.0006. This is basically because the training dataset is already known to the algorithm during the training phase, and, as such, a high performance is expected when the same dataset is fed to the model for prediction. However, segregation in performance occurred for the models when predictions were made with the testing dataset, as this was entirely new to the trained models. For this reason, emphasis will only be placed on the testing dataset performances of the models in this discussion.
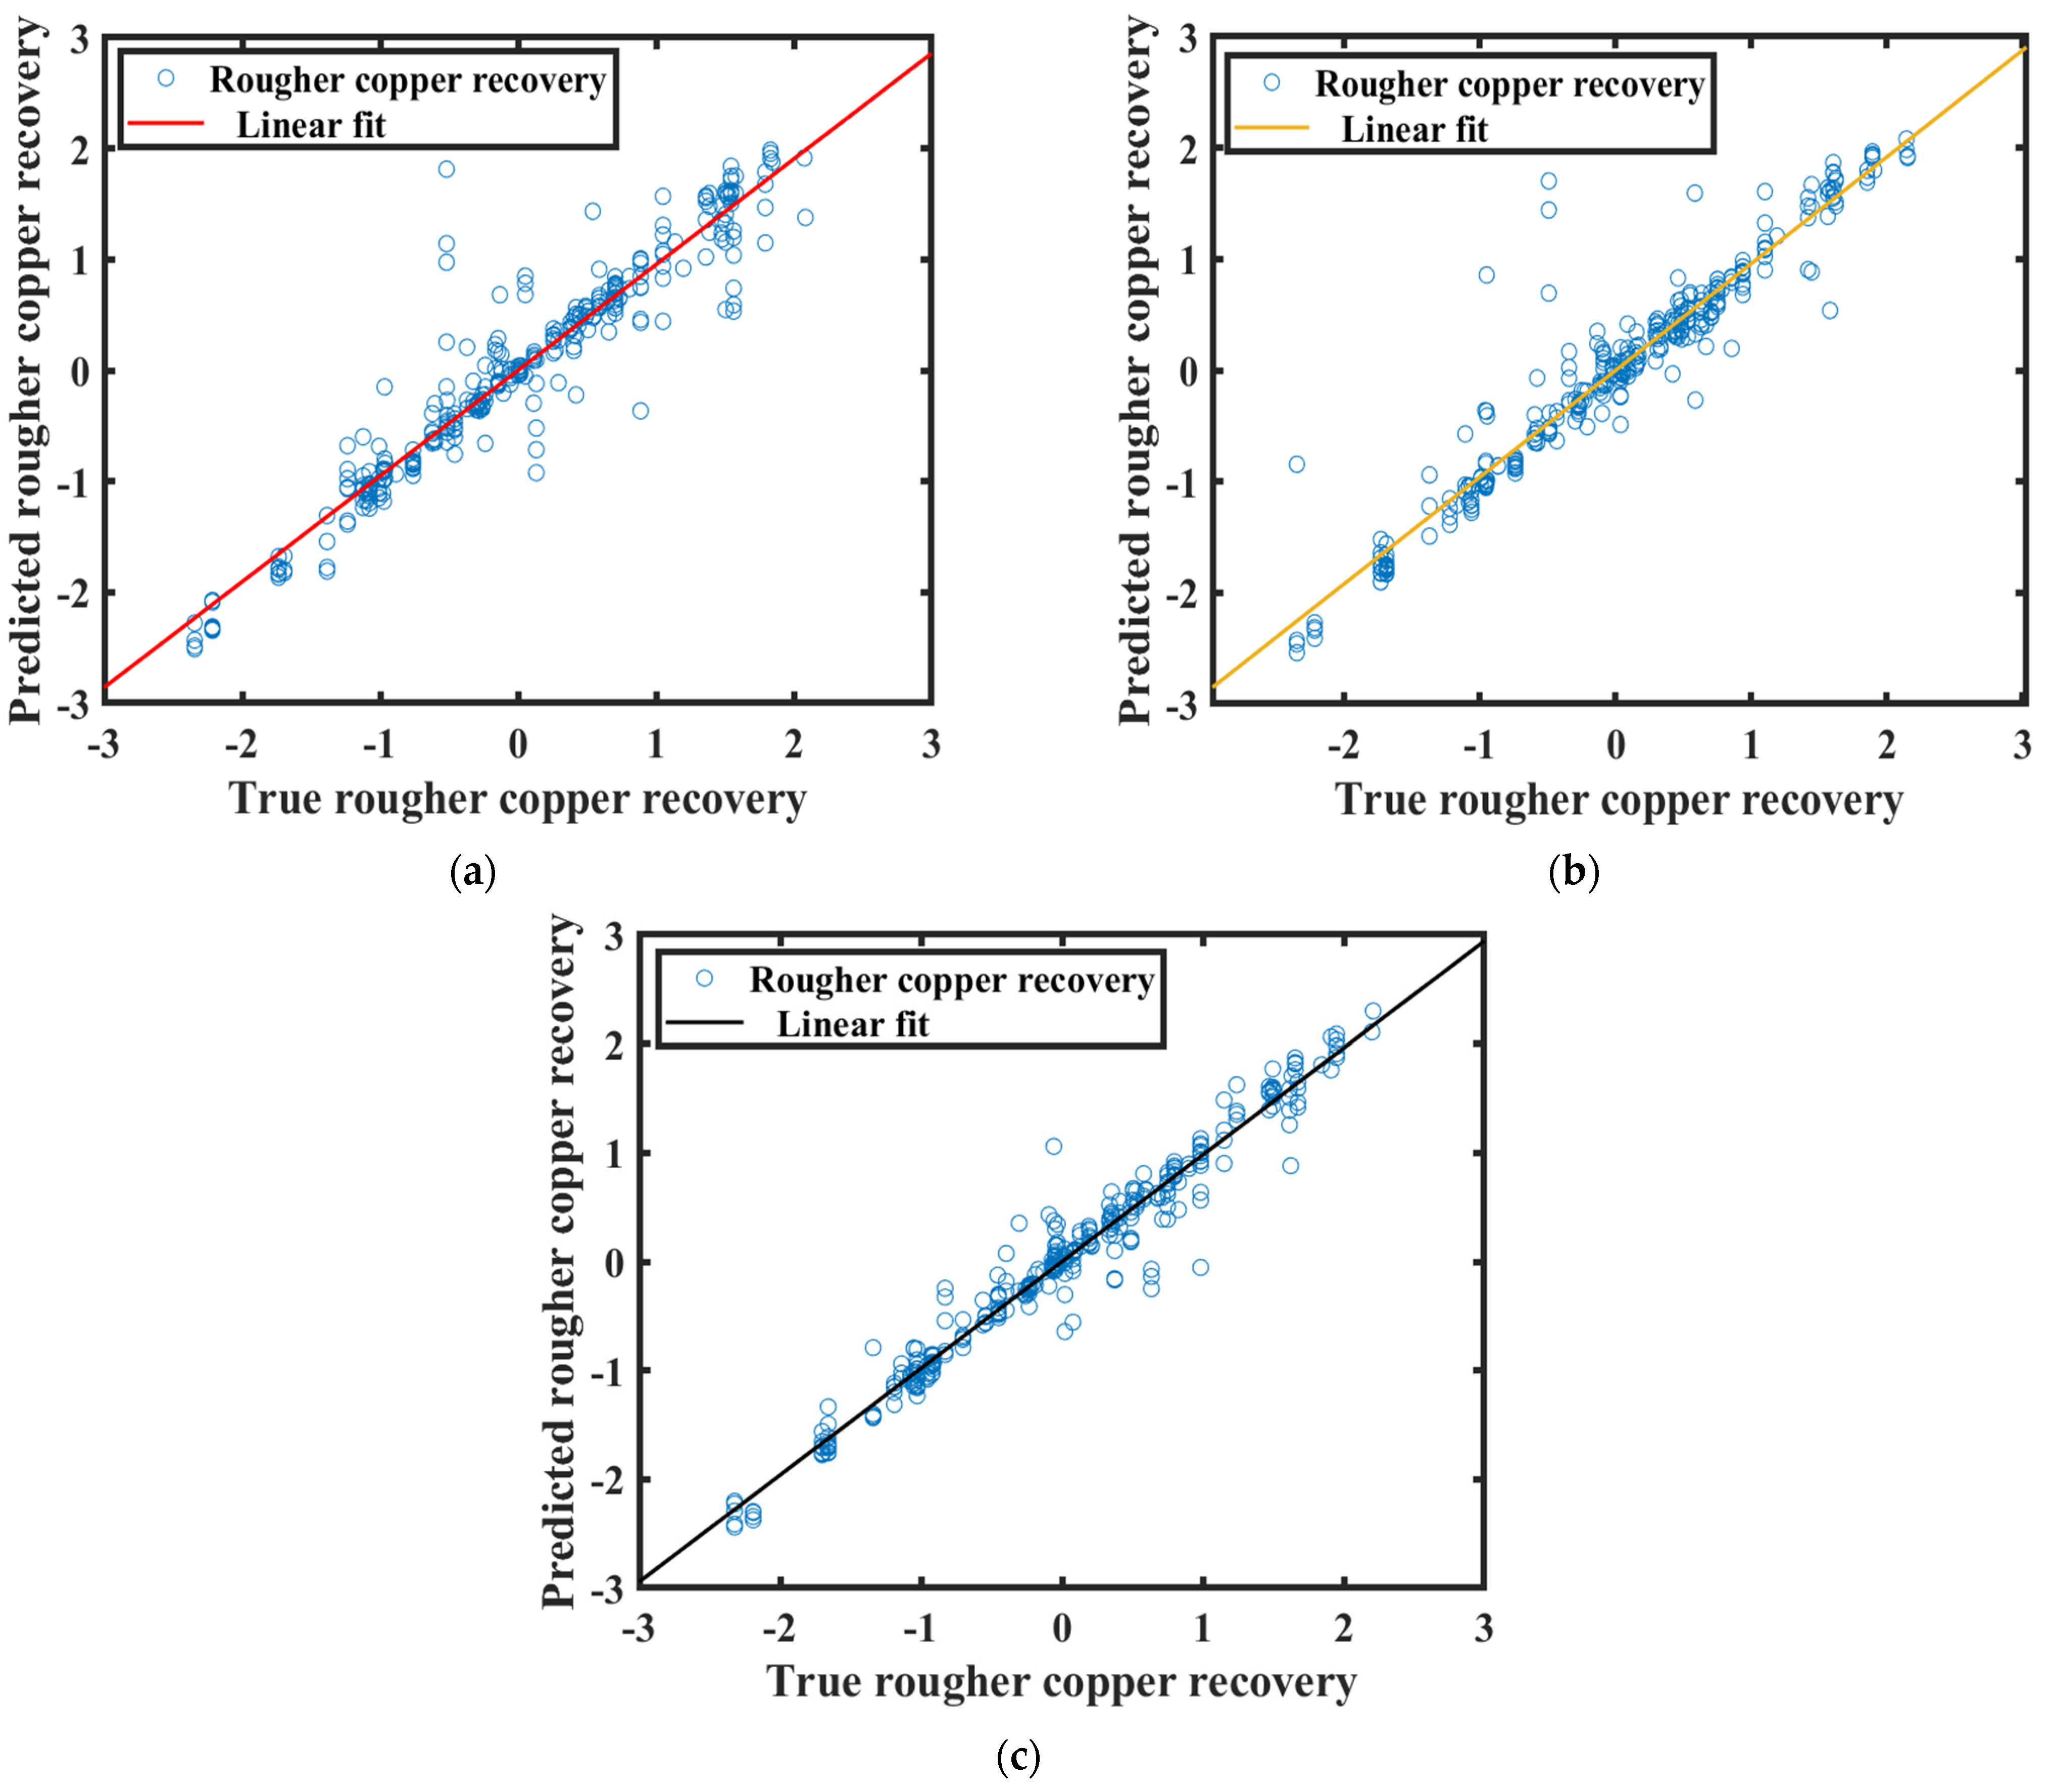
Considering r criterion, as shown in Table 5, 0.9528, 0.9589 and 0.9806 were the values recorded by scenarios 1, 2 and 3, respectively, when predictions were made with their trained models using the testing dataset. This implies that, in effect, scenario 3 had the strongest linear relationship between true and predicted rougher copper recovery values, followed by scenario 2, with scenario 1 having the weakest linear relationship. For the RMSE criterion, which estimates how concentrated data points are around a line of best fit, scenario 3 recorded the least RMSE value of 0.3122, against 0.4897 and 0.4496 for scenarios 1 and 2, respectively, when predictions were made with their trained models using the testing dataset. This shows that scenario 3 produced the shortest distance between true and predicted rougher copper recovery values as compared to scenarios 1 and 2. In other words, scenario 3 attained the minimum spread of true and predicted rougher copper recovery values along its line of best fit as compared to scenarios 1 and 2. This effect has been visualised in Figure 6 using parity plots.
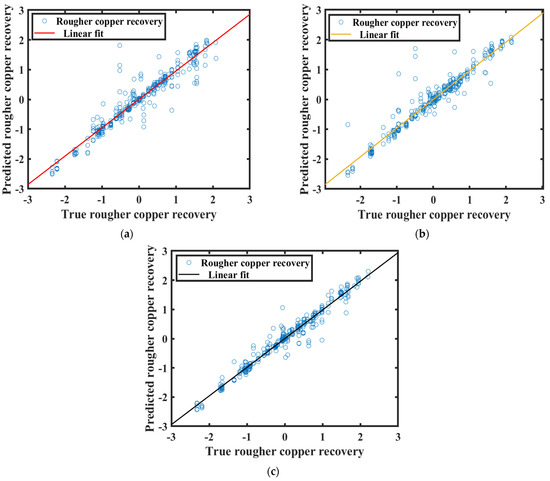
Figure 6.
Parity plot of true and predicted rougher copper recovery values using testing dataset for (a) scenario 1, (b) scenario 2 and (c) scenario 3.
To further assess the performance of the models, computed MAPE values of the models were utilised. From Table 5, MAPE values of 0.2761, 0.2332 and 0.1948 were obtained by scenarios 1, 2 and 3, respectively, when their trained models were used to make predictions with the testing dataset. These results show that in terms of percentages, scenario 3 had the least difference between true and predicted rougher copper recovery values. This was followed by scenario 2, with scenario 1 obtaining the maximum difference between true and predicted rougher copper recovery values. Finally, SI error criterion was used to evaluate model performances. The results, as shown in Table 5, indicate SI values of 0.0052 for scenario 1, 0.0048 for scenario 2 and 0.0033 for scenario 3. Based on the significance of the SI criterion, scenario 3 produced the least expected error, making it a better model than scenarios 1 and 2.
In general, it can be seen that, in as much as a satisfactory performance was obtained using only the established rougher flotation variables as input variables (scenario 1), the predictive accuracy of the GPR algorithm improved with the addition of pulp chemistry variables to the established rougher flotation variables (scenario 2). However, the best predictive performance of the GPR algorithm was obtained when only selected variables by the RNCA algorithm were used as input variables (scenario 3). While the performance in scenario 1 serves as a baseline performance, the improved performance in scenario 2 could be attributed to the inclusion of pulp chemistry variables with the input variables. The inclusion of the pulp chemistry variables helped to increase the amount of explained variance in the rougher copper recovery data, hence the improvement in performance. The superior performance in scenario 3 could be linked to the benefit of variable selection after three of the established rougher flotation variables (xanthate to tank cell 4, froth depth of tank cell 1 and froth depth of tank cell 2/3) were rendered irrelevant upon the introduction of the pulp chemistry variables. Variable selection by the RNCA algorithm helped to remove irrelevant variables and their associated ambiguous data, which make a model complex.
It should be noted that there may be other latent variables that may affect flotation copper recovery; however, the addition of pulp chemistry and the observed results are an indication of the significance of integrating critical process variables. Furthermore, the inclusion of more input variables should be done with caution, as without enough theoretical justification, an overfitting model (a model that performs well on a training dataset but not on an evaluation or testing dataset) may be produced. Additional study, including input variable collinearity examination, Sobol indices and such, for a simple model, is recommended.
4. Conclusions
This work investigated the impact of pulp chemistry variables in predicting rougher copper recovery. Following variable selection by a regularised neighbourhood component analysis (RNCA) algorithm, a Gaussian process regression (GPR) algorithm was used to predict rougher copper recovery considering a different set of input variables.
The variable selection by the RNCA algorithm rendered three of the established rougher flotation variables (xanthate to tank cell 4, froth depth of tank cell 1 and froth depth of tank cell 2/3) irrelevant upon the introduction of pulp chemistry variables (pH, Eh, dissolved oxygen and temperature).
The predictive accuracy of the GPR algorithm, assessed with correlation coefficient, root mean square error, mean absolute percentage error and scatter index, showed a satisfactory performance when only the established rougher flotation variables were used as input variables in predicting rougher copper recovery. This performance was improved when pulp chemistry variables were added to the established rougher flotation variables as input variables. However, the best performance of the algorithm was attained when only selected variables by the RNCA algorithm were used as input variables.
To this end, the data on pulp chemistry variables (pH, Eh, dissolved oxygen and temperature) collected by the Magotteaux Pulp Chemistry Monitor (PCM®) has proven to be essential in predicting rougher copper recovery. However, we recommend future research work where longer periods (at least three continuous months) of pulp chemistry data are collected, in order to capture extensive pulp chemistry behaviour of the different range of ore treated on the plant.
Author Contributions
Conceptualization, B.A.-K., C.G. and R.A.; methodology, B.A.-K. and R.A.; validation, B.A.-K., K.E., C.G. and R.A.; formal analysis, B.A.-K. and R.A.; investigation, B.A.-K. and R.A.; resources, K.E., C.G. and R.A.; data curation, B.A.-K., K.E. and R.A.; writing—original draft preparation, B.A.-K.; writing—review and editing, B.A.-K., K.E., C.G. and R.A.; visualization, B.A.-K., K.E., C.G. and R.A.; supervision, K.E., C.G. and R.A.; project administration, K.E., C.G. and R.A.; funding acquisition, K.E., C.G. and R.A. All authors have read and agreed to the published version of the manuscript.
Funding
This research received no external funding.
Acknowledgments
This research has been supported by the South Australian Government and BHP Olympic Dam through the PRIF RCP Industry Consortium. The authors would also like to acknowledge BHP Olympic Dam for approving the publication of this article. Financial support from the Future Industries Institute of the University of South Australia is also acknowledged. Support from the Australia-India Strategic Research Fund for the Recovery of the Battery Materials and REE from Ores and Wastes is also acknowledged. Support from the Australian Research Council Centre of Excellence for Enabling Eco-Efficient Beneficiation of Minerals (grant number CE200100009) is gratefully acknowledged.
Conflicts of Interest
No conflict of interest.
References
- Backman, C.-M. Global supply and demand of metals in the future. J. Toxicol. Environ. Health Part A 2008, 71, 1244–1253. [Google Scholar] [CrossRef]
- Schipper, B.W.; Lin, H.-C.; Meloni, M.A.; Wansleeben, K.; Heijungs, R.; van der Voet, E. Estimating global copper demand until 2100 with regression and stock dynamics. Resour. Conserv. Recycl. 2018, 132, 28–36. [Google Scholar] [CrossRef]
- Spooren, J.; Binnemans, K.; Björkmalm, J.; Breemersch, K.; Dams, Y.; Folens, K.; González-Moya, M.; Horckmans, L.; Komnitsas, K.; Kurylak, W.; et al. Near-zero-waste processing of low-grade, complex primary ores and secondary raw materials in Europe: Technology development trends. Resour. Conserv. Recycl. 2020, 160, 104919. [Google Scholar] [CrossRef]
- Asamoah, R.K.; Zanin, M.; Amankwah, R.K.; Skinner, W.; Addai-Mensah, J. Characterisation of Tectonic Refractory Gold Ore. In Proceedings of the CHEMECA 2014, Perth, Australia, 28 September–1 October 2014. [Google Scholar]
- Wang, L.; Peng, Y.; Runge, K.; Bradshaw, D. A review of entrainment: Mechanisms, contributing factors and modelling in flotation. Miner. Eng. 2014, 70, 77–91. [Google Scholar] [CrossRef]
- Asamoah, R.; Zanin, M.; Gascooke, J.; Skinner, W.; Addai-Mensah, J. Refractory gold ores and concentrates part 1: Mineralogical and physico-chemical characteristics. Miner. Process. Extr. Met. 2021, 130, 240–252. [Google Scholar] [CrossRef]
- Asamoah, R.; Skinner, W.; Addai-Mensah, J. Alkaline cyanide leaching of refractory gold flotation concentrates and bio-oxidised products: The effect of process variables. Hydrometallurgy 2018, 179, 79–93. [Google Scholar] [CrossRef]
- Asamoah, R.K.; Skinner, W.; Addai-Mensah, J. Pulp mineralogy and chemistry, leaching and rheological behaviour relationships of refractory gold ore dispersions. Chem. Eng. Res. Des. 2019, 146, 87–103. [Google Scholar] [CrossRef]
- Baudet, E.; Giles, D.; Tiddy, C.; Asamoah, R.; Hill, S. Mineralogy as a proxy to characterise geochemical dispersion processes: A study from the Eromanga Basin over the Prominent Hill IOCG deposit, South Australia. J. Geochem. Explor. 2019, 210, 106447. [Google Scholar] [CrossRef]
- Shean, B.; Cilliers, J. A review of froth flotation control. Int. J. Miner. Process. 2011, 100, 57–71. [Google Scholar] [CrossRef]
- Wills, B.A.; Finch, J. Wills’ Mineral Processing Technology: An Introduction to the Practical Aspects of Ore Treatment and Mineral Recovery; Butterworth-Heinemann: Oxford, UK, 2015; p. 512. [Google Scholar]
- Dankwah, J.; Asamoah, R.; Zanin, M.; Skinner, W. Dense liquid flotation: Can coarse particle flotation performance be enhanced by controlling fluid density? Miner. Eng. 2022, 180, 107513. [Google Scholar] [CrossRef]
- Shahbazi, B.; Chelgani, S.C.; Matin, S. Prediction of froth flotation responses based on various conditioning parameters by Random Forest method. Colloids Surf. A Physicochem. Eng. Asp. 2017, 529, 936–941. [Google Scholar] [CrossRef]
- Mathe, Z.; Harris, M.; O’Connor, C. A review of methods to model the froth phase in non-steady state flotation systems. Miner. Eng. 2000, 13, 127–140. [Google Scholar] [CrossRef]
- Forson, P.; Zanin, M.; Skinner, W.; Asamoah, R. Differential flotation of pyrite and Arsenopyrite: Effect of pulp aeration and the critical importance of collector concentration. Miner. Eng. 2022, 178, 107421. [Google Scholar] [CrossRef]
- Forson, P.; Zanin, M.; Abaka-Wood, G.; Skinner, W.; Asamoah, R.K. Flotation of auriferous arsenopyrite from pyrite using thionocarbamate. Miner. Eng. 2022, 181, 107524. [Google Scholar] [CrossRef]
- Ralston, J. Eh and its consequences in sulphide mineral flotation. Miner. Eng. 1991, 4, 859–878. [Google Scholar] [CrossRef]
- Amankwaa-Kyeremeh, B.; Greet, C.; Skinner, W.; Asamoah, R. A brief review of pulp chemistry parameters in relation to flotation feed variation. In Proceedings of the International Mineral Processing Congress, Cape Town, South Africa, 18–22 October 2021; pp. 1855–1863. [Google Scholar]
- Kelebek, S.; Fekete, S.; Wells, P. Selective depression of pyrrhotite using sulphur dioxide-diethylenetriamine reagent combination. In Proceedings of the XIX International Mineral Processing Congress, San Francisco, CA, USA, 22–27 October 1995; pp. 181–187. [Google Scholar]
- Forson, P.; Zanin, M.; Skinner, W.; Asamoah, R. A brief review of auriferous sulphide flotation concentration pyrite and arsenopyrite mineral separation. In Proceedings of the 6th UMaT Biennial International Mining and Mineral Conference, Tarkwa, Ghana, 5–6 August 2020; UMaT Ghana: Tarkwa, Ghana, 2020; pp. 1–12. [Google Scholar]
- Pu, Y.; Szmigiel, A.; Chen, J.; Apel, D.B. FlotationNet: A hierarchical deep learning network for froth flotation recovery prediction. Powder Technol. 2020, 375, 317–326. [Google Scholar] [CrossRef]
- Hodouin, D.; Jämsä-Jounela, S.-L.; Carvalho, M.; Bergh, L. State of the art and challenges in mineral processing control. Control Eng. Pract. 2001, 9, 995–1005. [Google Scholar] [CrossRef]
- Mazzour, E.; Hodouin, D.; Makni, S. Optimal sensor implementation in metallurgical plants—An application to a generic mineral separation plant. Int. J. Miner. Process. 2003, 69, 185–203. [Google Scholar] [CrossRef]
- Hodouin, D. Methods for automatic control, observation, and optimization in mineral processing plants. J. Process. Control 2011, 21, 211–225. [Google Scholar] [CrossRef]
- Owusu, K.B.; Skinner, W.; Asamoah, R.K. Acoustic Sensing and Supervised Machine Learning for In Situ Classification of Semi-Autogenous (SAG) Mill Feed Size Fractions Using Different Feature Extraction Techniques. Powders 2023, 2, 299–322. [Google Scholar] [CrossRef]
- Amankwaa-Kyeremeh, B.; Zhang, J.; Zanin, M.; Skinner, W.; Asamoah, R.K. Feature selection and Gaussian process prediction of rougher copper recovery. Miner. Eng. 2021, 170, 107041. [Google Scholar] [CrossRef]
- Auret, L.; Aldrich, C. Interpretation of nonlinear relationships between process variables by use of random forests. Miner. Eng. 2012, 35, 27–42. [Google Scholar] [CrossRef]
- Amankwaa-Kyeremeh, B.; Greet, C.; Zanin, M.; Skinner, W.; Asamoah, R.K. Predictability of Rougher Flotation Copper Recovery Using Gaussian Process Regression Algorithm. In Proceedings of the 6th UMaT Biennial International Mining and Mineral Conference, Tarkwa, Ghana, 5–6 August 2020; Ghana UMaT: Tarkwa, Ghana; pp. 1–8. [Google Scholar]
- Amankwaa-Kyeremeh, B.; Greet, C.; Zanin, M.; Skinner, W.; Asamoah, R.K. Selecting key predictor parameters for regression modelling using modified Neighbourhood Component Analysis (NCA) Algorithm. In Proceedings of the 6th UMaT Biennial International Mining and Mineral Conference, Tarkwa, Ghana, 5–6 August 2020; Ghana UMaT: Tarkwa, Ghana, 2020; pp. 320–325. [Google Scholar]
- Jahedsaravani, A.; Marhaban, M.; Massinaei, M.; Saripan, M.; Noor, S. Froth-based modeling and control of a batch flotation process. Int. J. Miner. Process. 2016, 146, 90–96. [Google Scholar] [CrossRef]
- Ren, H.-F.; Yang, C.-H.; Zhou, X.; Gui, W.-H.; Yan, F. Froth image feature weighted SVM based working condition recognition for flotation process. J. Zhejiang Univ. Eng. Sci. 2011, 45, 2115–2119. [Google Scholar]
- Aldrich, C.; Moolman, D.; Gouws, F.; Schmitz, G. Machine learning strategies for control of flotation plants. Control. Eng. Pract. 1997, 5, 263–269. [Google Scholar] [CrossRef]
- Patel, A.K.; Chatterjee, S.; Gorai, A.K. Development of machine vision-based ore classification model using support vector machine (SVM) algorithm. Arab. J. Geosci. 2017, 10, 107. [Google Scholar] [CrossRef]
- Patel, A.K.; Gorai, A.K.; Chatterjee, S. Development of Machine vision-based system for iron ore grade prediction using Gaussian Process Regression (GPR). In Proceedings of the Pattern Recognition and Information Processing (PRIP’2016), Minsk, Belarus, 3–5 October 2016; pp. 45–48. [Google Scholar]
- Amankwaa-Kyeremeh, B.; Skinner, W.; Asamoah, R.K. Comparative study on rougher copper recovery prediction using selected predictive algorithms. In Proceedings of the International Future Mining Conference, Online, 6–10 December 2021; Australasian Institute of Mining and Metallurgy: Sydney, Australia, 2021; pp. 1–10. [Google Scholar]
- Jacques, S.; Greet, C.; Bastin, D. Oxidative weathering of a copper sulphide ore and its influence on pulp chemistry and flotation. Miner. Eng. 2016, 99, 52–59. [Google Scholar] [CrossRef]
- Ekmekçi, Z.; Buswell, M.; Bradshaw, D.; Harris, P. The value and limitations of electrochemical measurements in flotation of precious metal ores. Miner. Eng. 2005, 18, 825–831. [Google Scholar] [CrossRef]
- Forson, P.; Skinner, W.; Asamoah, R. Decoupling pyrite and arsenopyrite in flotation using thionocarbamate collector. Powder Technol. 2021, 385, 12–20. [Google Scholar] [CrossRef]
- Amankwaa-Kyeremeh, B.; Greet, C.; Skinner, W.; Asamoah, R.K. Correlating process mineralogy and pulp chemistry for quick ore variability diagnosis. In Proceedings of the International Future Mining Conference, Online, 6–10 December 2021; Australasian Institute of Mining and Metallurgy: Sydney, Australia, 2021; pp. 1–10. [Google Scholar]
- Asamoah, R.K.; Baawuah, E.; Greet, C.; Skinner, W. Characterisation of Metal Debris in Grinding and Flotation Circuits. Miner. Eng. 2021, 171, 107074. [Google Scholar] [CrossRef]
- Rabieh, A.; Albijanic, B.; Eksteen, J. A review of the effects of grinding media and chemical conditions on the flotation of pyrite in refractory gold operations. Miner. Eng. 2016, 94, 21–28. [Google Scholar] [CrossRef]
- Plaksin, I.; Bessonov, S. Role of gases in flotation reactions. In Proceedings of the Second International Congress of Surface Activity; Butterworth, Netherlands, 1957; pp. 361–367. [Google Scholar]
- Berglund, G. Pulp chemistry in sulphide mineral flotation. Int. J. Miner. Process. 1991, 33, 21–31. [Google Scholar] [CrossRef]
- Graham, R.; Heathcote, C. The effect of the oxidation state of the pulp on the selective flotation of chalcopyrite from Black Mountain ore. In Proceedings of the 12th CMMI Congress; Southern African Institute of Mining and Metallurgy: Johannesburg, South Africa, 1982; pp. 867–877. [Google Scholar]
- Lin, I. The effect of seasonal variations in temperature on the performance of mineral processing plants. Miner. Eng. 1989, 2, 47–54. [Google Scholar] [CrossRef]
- O’Connor, C.; Mills, P. The effect of temperature on the pulp and froth phases in the flotation of pyrite. Miner. Eng. 1990, 3, 615–624. [Google Scholar] [CrossRef]
- Foroutan, A.; Abadi, M.A.Z.H.; Kianinia, Y.; Ghadiri, M. Critical importance of pH and collector type on the flotation of sphalerite and galena from a low-grade lead–zinc ore. Sci. Rep. 2021, 11, 3103. [Google Scholar] [CrossRef] [PubMed]
- Nasirimoghaddam, S.; Mohebbi, A.; Karimi, M.; Yarahmadi, M.R. Assessment of pH-responsive nanoparticles performance on laboratory column flotation cell applying a real ore feed. Int. J. Min. Sci. Technol. 2020, 30, 197–205. [Google Scholar] [CrossRef]
- Azizi, A.; Masdarian, M.; Hassanzadeh, A.; Bahri, Z.; Niedoba, T.; Surowiak, A. Parametric Optimization in Rougher Flotation Performance of a Sulfidized Mixed Copper Ore. Minerals 2020, 10, 660. [Google Scholar] [CrossRef]
- Hosseini, M.R.; Shirazi, H.H.A.; Massinaei, M.; Mehrshad, N. Modeling the Relationship between Froth Bubble Size and Flotation Performance Using Image Analysis and Neural Networks. Chem. Eng. Commun. 2014, 202, 911–919. [Google Scholar] [CrossRef]
- Wang, J.-S.; Han, S. Feed-Forward Neural Network Soft-Sensor Modeling of Flotation Process Based on Particle Swarm Optimization and Gravitational Search Algorithm. Comput. Intell. Neurosci. 2015, 2015, 1–10. [Google Scholar] [CrossRef]
- Aldrich, C.; Moolman, D.; Gouws, F.; Schmitz, G. Machine Learning Strategies for Control of Flotation Plants. IFAC Proc. Vol. 1995, 28, 99–105. [Google Scholar] [CrossRef]
- Saravani, A.J.; Mehrshad, N.; Massinaei, M. Fuzzy-based modeling and control of an industrial flotation column. Chem. Eng. Commun. 2014, 201, 896–908. [Google Scholar] [CrossRef]
- Massinaei, M.; Sedaghati, M.R.; Rezvani, R.; Mohammadzadeh, A.A. Using data mining to assess and model the metallurgical efficiency of a copper concentrator. Chem. Eng. Commun. 2014, 201, 1314–1326. [Google Scholar] [CrossRef]
- Al-Thyabat, S. Investigating the effect of some operating parameters on phosphate flotation kinetics by neural network. Adv. Powder Technol. 2009, 20, 355–360. [Google Scholar] [CrossRef]
- Al-Thyabat, S. On the optimization of froth flotation by the use of an artificial neural network. J. China Univ. Min. Technol. 2008, 18, 418–426. [Google Scholar] [CrossRef]
- Nakhaei, F.; Mosavi, M.R.; Sam, A.; Vaghei, Y. Recovery and grade accurate prediction of pilot plant flotation column concentrate: Neural network and statistical techniques. Int. J. Miner. Process. 2012, 110, 140–154. [Google Scholar] [CrossRef]
- Massinaei, M.; Jahedsaravani, A.; Mohseni, H. Recognition of process conditions of a coal column flotation circuit using computer vision and machine learning. Int. J. Coal Prep. Util. 2020, 42, 2204–2218. [Google Scholar] [CrossRef]
- Popli, K.; Maries, V.; Afacan, A.; Liu, Q.; Prasad, V. Development of a vision-based online soft sensor for oil sands flotation using support vector regression and its application in the dynamic monitoring of bitumen extraction. Can. J. Chem. Eng. 2018, 96, 1532–1540. [Google Scholar] [CrossRef]
- Zhang, Z.; Liu, Y.; Hu, Q.; Zhang, Z.; Wang, L.; Liu, X.; Xia, X. Multi-information online detection of coal quality based on machine vision. Powder Technol. 2020, 374, 250–262. [Google Scholar] [CrossRef]
- Zhang, Z.; Yang, J.; Wang, Y.; Dou, D.; Xia, W. Ash content prediction of coarse coal by image analysis and GA-SVM. Powder Technol. 2014, 268, 429–435. [Google Scholar] [CrossRef]
- Allahkarami, E.; Nuri, O.S.; Abdollahzadeh, A.; Rezai, B.; Chegini, M. Estimation of Copper and Molybdenum Grades and Recoveries in the Industrial Flotation Plant Using the Artificial Neural Network. Int. J. Nonferrous Met. 2016, 5, 23–32. [Google Scholar] [CrossRef]
- Nakhaei, F.; Sam, A.; Mosavi, M.R.; Zeidabadi, S. Prediction of copper grade at flotation column concentrate using Artificial Neural Network. In Proceedings of the IEEE 10th International Conference on Signal Processing Proceedings, Beijing, China, 24–28 October 2010; pp. 1421–1424. [Google Scholar]
- Çilek, E. Application of neural networks to predict locked cycle flotation test results. Miner. Eng. 2002, 15, 1095–1104. [Google Scholar] [CrossRef]
- Massinaei, M.; Doostmohammadi, R. Modeling of bubble surface area flux in an industrial rougher column using artificial neural network and statistical techniques. Miner. Eng. 2010, 23, 83–90. [Google Scholar] [CrossRef]
- Nakhaei, F.; Irannajad, M. Comparison between neural networks and multiple regression methods in metallurgical performance modeling of flotation column. Physicochem. Probl. Miner. Process. 2013, 49, 255–266. [Google Scholar]
- Jahedsaravani, A.; Marhaban, M.; Massinaei, M. Prediction of the metallurgical performances of a batch flotation system by image analysis and neural networks. Miner. Eng. 2014, 69, 137–145. [Google Scholar] [CrossRef]
- Cook, R.; Monyake, K.C.; Hayat, M.B.; Kumar, A.; Alagha, L. Prediction of flotation efficiency of metal sulfides using an original hybrid machine learning model. Eng. Rep. 2020, 2, e12167. [Google Scholar] [CrossRef]
- Pu, Y.; Szmigiel, A.; Apel, D.B. Purities prediction in a manufacturing froth flotation plant: The deep learning techniques. Neural Comput. Appl. 2020, 32, 13639–13649. [Google Scholar] [CrossRef]
- Montanares, M.; Guajardo, S.; Aguilera, I.; Risso, N. Assessing machine learning-based approaches for silica concentration estimation in iron froth flotation. In Proceedings of the 2021 IEEE International Conference on Automation/XXIV Congress of the Chilean Association of Automatic Control (ICA-ACCA), Valparaíso, Chile, 22–26 March 2021; pp. 1–6. [Google Scholar]
- Abkhoshk, E.; Kor, M.; Rezai, B. A study on the effect of particle size on coal flotation kinetics using fuzzy logic. Expert Syst. Appl. 2010, 37, 5201–5207. [Google Scholar] [CrossRef]
- Ehrig, K.; McPhie, J.; Kamenetsky, V. Geology and mineralogical zonation of the Olympic Dam iron oxide Cu-U-Au-Ag deposit, South Australia. In Geology and Genesis of Major Copper Deposits and Districts of the World, a Tribute to Richard Sillitoe; Hedenquist, J.W., Harris, M., Camus, F., Eds.; Society of Economic Geologists: Littleton, CO, USA, 2012; Volume 16, pp. 237–268. [Google Scholar]
- Temeng, V.A.; Ziggah, Y.Y.; Arthur, C.K. A novel artificial intelligent model for predicting air overpressure using brain inspired emotional neural network. Int. J. Min. Sci. Technol. 2020, 30, 683–689. [Google Scholar] [CrossRef]
- Seidu, J.; Ewusi, A.; Kuma, J.S.Y.; Ziggah, Y.Y.; Voigt, H.-J. A hybrid groundwater level prediction model using signal decomposition and optimised extreme learning machine. Model. Earth Syst. Environ. 2021, 8, 3607–3624. [Google Scholar] [CrossRef]
Disclaimer/Publisher’s Note: The statements, opinions and data contained in all publications are solely those of the individual author(s) and contributor(s) and not of MDPI and/or the editor(s). MDPI and/or the editor(s) disclaim responsibility for any injury to people or property resulting from any ideas, methods, instructions or products referred to in the content. |
© 2023 by the authors. Licensee MDPI, Basel, Switzerland. This article is an open access article distributed under the terms and conditions of the Creative Commons Attribution (CC BY) license (https://creativecommons.org/licenses/by/4.0/).

