Article

The Effect of Silicon-Containing Minerals on Coal Evolution at High-Temperature Pre-Graphitization Stage

1
School of Geosciences and Surveying Engineering, China University of Mining and Technology (Beijing), Beijing 100083, China
2
Wulanmulun Coal Mine, CHN Energy Shendong Coal Group, Ordos 017205, China
*
Author to whom correspondence should be addressed.
Minerals 2023, 13(1), 20; https://doi.org/10.3390/min13010020
Submission received: 8 November 2022 / Revised: 17 December 2022 / Accepted: 19 December 2022 / Published: 23 December 2022
(This article belongs to the Special Issue Graphite Minerals and Graphene)

Abstract

:
Coal is a carrier of carbon enrichment, so it has the potential for the preparation of coal-based carbon materials. In this paper, LT anthracite and TSG bituminous coal were selected, and the corresponding graphitized samples were prepared from high-temperature treatment. The effects of silicon-containing minerals on coal evolution during the high-temperature pre-graphitization stage were investigated by XRD, Raman spectroscopy, and SEM. The results showed that with increasing temperature, the silicon-containing samples showed smaller d002 and ID1/IG, and higher Lc, while La presented a slight increase. It was found by SEM that the micromorphology of all samples was mainly massive structures. Meanwhile, irregular polyhedral structures also were observed in silicon-containing samples at 1300 °C, which were related to the formation and deposition of SiC. The carbothermal reactions of silicon-containing minerals continued to generate SiC and precipitate with increasing temperature, resulting in the gradual transformation of the needle-like structures into polyhedral structures. However, SiC was completely decomposed at 2800 °C. These changes indicated that during the pre-graphitization stage, silicon-containing minerals form SiC to advance the reduction of the interlayer spacing and the increase of longitudinal layer stacking height, thereby enhancing structural ordering and graphitization degree, while it had less effect on the lateral size. This will help to further understand the role of silicon-containing minerals in the coal pre-graphitization stage and also provide useful information about synthetic coal-based graphite.

1. Introduction

Graphite has been applied in the electrode, chemical, biomedical, refractory, and other traditional industries because of its special structures and excellent properties [1,2,3,4]. With further research on graphite, it will be used for new energy, precision electronic components, nuclear and aerospace, and has become an important strategic resource to support the development of high technology fields [3,4,5,6,7]. Graphite can be divided into natural graphite and artificial graphite. Natural graphite has more intergrowth minerals, and the disseminated grain size is very small [8]; therefore, it is difficult for natural graphite to be sorted and purified, which greatly limits the utilization of natural graphite. Furthermore, with the increase in the price of natural graphite, the utilization of large-scale graphite resources is affected by the cost [3]. Thus, it is necessary to make reasonable use of natural graphite and explore suitable materials to develop artificial graphite. Compared with natural graphite, artificial graphite is usually made of organic carbon materials through high-temperature carbonization and graphitization, which has better performance and adjustability due to the influence of raw materials and temperature [2,4,7].
Coal is a carbon-rich material, and the heteroatoms and small molecular compounds are continuously removed, and the final product of evolution is graphite under the combined effect of stratigraphic temperature and pressure [9,10,11]. Thus, it is a good precursor for preparing artificial graphite and has great potential in the future. A number of researchers have paid more attention to the graphitization of coal and obtained great results [12,13,14,15,16,17,18,19,20]. Franklin experimentally confirmed that anthracite was graphitizable above 2500 °C [21]. Atria et al. [13] studied the structural ordering of three Pennsylvania anthracites at different heat-treated temperatures and reported that the temperature of 2700 °C may be a “graphitization jump”, indicating that temperature played an important role during coal graphitization. By studying anthracite heated at high ambient pressure at temperatures up to 2800 °C, Bustin et al. [22] reported that graphite began to appear at temperatures as low as 600 °C, suggesting that the pressure compensated for the partial strain energy of coal graphitization. Cao et al. [23] concluded that temperature was the fundamental driving force for coal graphitization and the tectonic stress shortened the time of graphitization. Zhang et al. [24] proposed the formation of graphite-like structures was a successive process during high-temperature graphitization of coal, followed by carbonization (<1000 °C), secondary carbonization and pre-graphitization (1000~2000 °C), and graphitization (>2000 °C). The reflectance of vitrinite (Ro) is one of the important parameters to characterize the degree of coalification. The extension of basic structural units in coal sharply increases, which marks the end of coalification and the beginning of graphitization [9,25]. The turbostratic structures begin to evolve into ordered structures when d002 = 0.334 nm, which is also regarded as the starting point of graphitization [26]. In addition, d002 is usually used to divide graphite (<0.338 nm), semi-graphite (0.338~0.340 nm), semi-anthracite (0.340~0.348 nm), and anthracite (>0.344 nm) [9,24].
Besides the treatment temperature and pressure, some characteristics of anthracite have been explored to influence its graphitization process. Among them, minerals have been considered graphitization catalysts [2,6,7,27,28,29,30,31]. Baraniecki et al. [32] found that the addition of iron or ferrosilicon particles considerably reduced the temperature at which coal graphitization occurs. Pappano et al. [28,33] found that the minerals that played a key role during coal graphitization were similar to those contained in high-quality graphite deposits. Lin et al. [34] systematically studied the graphitization process of a graphite block doped with Si and Ti by HRTEM at the atomic scale and proposed the related catalytic mechanisms. Liu et al. [35] reported that the transformation of creating silicon carbide above 1300 °C in carbothermal reduction played a significant catalytic role in the graphite structure of the coal. Li et al. [36] discussed the catalytic graphitization process of coke carbon with iron and pointed out that the carbon dissolution–graphite precipitation mechanism could explain this process very well.
Although many studies have been conducted on coal graphitization, there is still a lack of systematic research on the influence of silica-containing minerals at the coal pre-graphitization stage. In this paper, quartz has been added into demineralized coal as a typical silicon-containing mineral for preparing silicon-containing samples. Longtan No. 6 (LT) anthracite and Tangshangou No. 12 (TSG) bituminous coal were selected, and the related raw coal, demineralized coal, and quartz-added demineralized coal were prepared for high-temperature treatment. XRD, Raman spectroscopy, and SEM were applied to analyze the structural evolution of samples. Based on the above analysis, we also tried to further understand the role of silicon-containing minerals on coal pre-graphitization. The findings of this work provide new ideas for the research of coal-based graphite and the clean efficient utilization of coal. It will also be of great practical significance to improve the added value and resource utilization of coal resources.

2. Samples and Methods

2.1. Sample Selection and Preparation

The experimental coal samples were anthracite collected from the Longtan No. 6 coal seam (LT) and bituminous coal from the Tangshangou No. 12 coal seam (TSG) according to the Chinese National Standard GB/T 482-2008. The samples were crushed into 18 meshes to make polished grain mounts for the mean maximum vitrinite reflectance (Ro) measurement, 80 meshes for proximate and ultimate analysis, and 200 meshes for demineralization and high-temperature experiments. Table 1 lists the results of Ro proximate and ultimate analyses of the samples. For LT raw coal, the minerals were mainly quartz, chlorite-serpentine, kaolinite, calcite, and a small amount of granular pyrite, while the minerals in TSG raw coal were dominated by kaolinite, quartz, and pyrite. The raw coal samples were called TL6 and TSG12, respectively. The demineralization of raw coal was treated via a series of acid treatments (HF and HCl solutions) and was marked as LT6T and TSG12T, respectively. The detailed procedure for demineralization was described in previous work [5]. After demineralized treatment, the silicon-containing minerals were almost removed from raw coal.
Quartz, a typical silicon-containing mineral, was selected to explore the effect of the silicon-containing minerals on the coal pre-graphitization stage. To better observe its role, the quartz was ground into 200 mesh and then thoroughly mixed with the demineralized coal at the mineral mixing ratio of 10%, which were individually called LT6T-Q and TSG12T-Q.

2.2. High-Temperature Treatment

The final temperature of the high-temperature treatment was set as 1300 °C, 1450 °C, 1600 °C, 1900 °C, and 2800 °C, respectively. Every 5 g of the sample within a graphite crucible was placed in a medium-frequency induction graphitization furnace and heated to the final temperature. The heating rate was controlled at 10 °C/min and the temperature was maintained for 3 h after reaching the final temperature. To avoid interference with atmospheric factors such as air, argon was used to preserve the sample during the whole heating process. Then, treated samples were sealed and stored for further analysis and testing.

2.3. X-ray Diffraction

The XRD data collection was recorded by a D8 ADVANCE diffractometer with CuKα radiation. The operating conditions of the X-ray tube: I = 10 mA, U = 30 kV. Powdered samples were scanned from 10° to 80° in the 2θ range with a 0.02° step interval and a 0.012θ step width. The average lateral size (La), stacking height (Lc), and interlayer spacing (d002) of the average crystallite structures have been established as XRD structural parameters. The d002 was determined by Bragg’s Equation (1), and La and Lc were calculated by Scherrer Equations (2) and (3), respectively. The relevant equations are as follows:
d 002 = λ / 2 sin θ 002
L c = 0.89 λ / β 002 cos θ 002
L a = 1.84 λ / β 100 cos θ 100
The λ is the wavelength of the radiation used, which is 0.154056 nm in this experiment. θ002 and θ100 are the positions of the peaks of 002 and 100, respectively, and β002 and β100 are the peak width at half height of the peaks of 002 and 100, respectively.

2.4. Raman Spectroscopy

Raman spectra were measured using a Renishaw Invia Raman spectrometer with microscopy, equipped with 10× and 50× objectives. Raman spectra were excited by an argon ion laser (532 nm) with the experiment power of 50 mW. The sample was scanned in the range of 100~3500 cm−1. Each measurement was accumulated 10 times to reduce noise in average spectra, and the data acquisition time for each spectrum was 20 s. To obtain further data, peak separation Raman spectroscopy analysis was carried out using the Origin software.

2.5. SEM/EDS

SEM examination was used to observe the microstructure characteristics of samples under different heating temperatures by using a SU8220 field emission scanning electron microscope with a magnification of up to 800,000 times and an acceleration voltage of 3~5 kV. Then, the samples treated with 1300 °C, 1900 °C, and 2800 °C were observed by SEM.

3. Results and Discussion

3.1. Mineral Features at the Pre-Graphitization Stage

The XRD profiles of the selected samples are illustrated in Figure 1. Similar to the results reported by other authors [37,38,39], each XRD profile has two obvious peaks in the range of 10/15~30° and 40~50° (2θ), corresponding to the 002 and 100 peaks, respectively. The 002 and 100 peaks individually correlated to the stacking of aromatic layers and the extension of the aromatic molecules in the plane of the layers [40]. The 002 peak of the graphite is symmetrical and sharp [41], but for coal, the shape of the 002 peak was broad and asymmetric, and the intensity of the 002 peak was higher than that of the 100 peak, which was attributed to the γ peak on its left-hand side. The γ peak was associated with the aliphatic side chains or also assigned to the irregular packing of buckled aromatic layers [38,42]. As seen in Figure 1, all samples showed broad 002 and 001 peaks at 1300 °C. From 1300 °C to 1900 °C, the position of the 002 peak shifted to higher angles, the shape became sharper and the intensity increased with increasing temperature. When the temperature reached 2800 °C, only the characteristic graphite peaks—such as the 002, 100, 101, and 004 peaks—were observed in the XRD profile. The clear appearance of the (004) peak, a nearly three-dimensional crystalline order structure in coal-based graphite samples is supposed to exist [41]; however, the difference between the samples was the mineral peaks formed.
For LT6 (Figure 1a), the β-SiC and Fe3Si peaks were found in the XRD profile at 1300 °C and existed almost in the range of 1300~1900 °C, while they disappeared at 2800 °C. However, there was only Fe3Si in TL6T at 1300 °C and presented at 1300~1900 °C (Figure 1c). Up to 2800 °C, the XRD spectrum of LT6T also exclusively observed the characteristic peaks of graphite, which was similar to LT6. The XRD patterns of TSG12 showed significantly similar features to LT6 as the temperature increased (Figure 1b), whereas Fe was observed in TSG12T at 1300 °C and decomposed higher than 1900 °C (Figure 1d). For two quartz-added demineralized samples, their XRD patterns presented similar evolution trends with increasing temperature, shown in Figure 1e,f. It can be seen that β-SiC and Fe2Si were characterized in both quartz-added samples at 1300 °C and were continuously observed at the pre-graphitization stage. Similarly, only graphite characteristic peaks were found at 2800 °C. Therefore, it can be inferred that the original minerals were transformed to form new silicon-containing minerals (such as SiC and Fe3Si) during the pre-graphitization process, promoting the development of graphitization [11,32]. After demineralization treatment, the silicon was removed, and some Fe reacted with carbon to produce austenitic-like structures in TSG12T. As the temperature gradually increased, austenitic-like structures were removed and only the coal-based graphite was left in the reaction system. However, the Fe3Si observed in LT6T may be attributed to incomplete demineralization. For quartz-added demineralized coal, SiC was generated by the reduction of quartz, and Fe3Si was converted into Fe2Si due to the excess of silicon at 1300 °C. This process also kept occurring within the pre-graphitization stage. When the temperature reached 2800 °C, the SiC peaks disappeared and the graphite peaks were clearly observed.

3.2. Chemical Structural Evolution during the Pre-Graphitization Stage

3.2.1. XRD Analysis

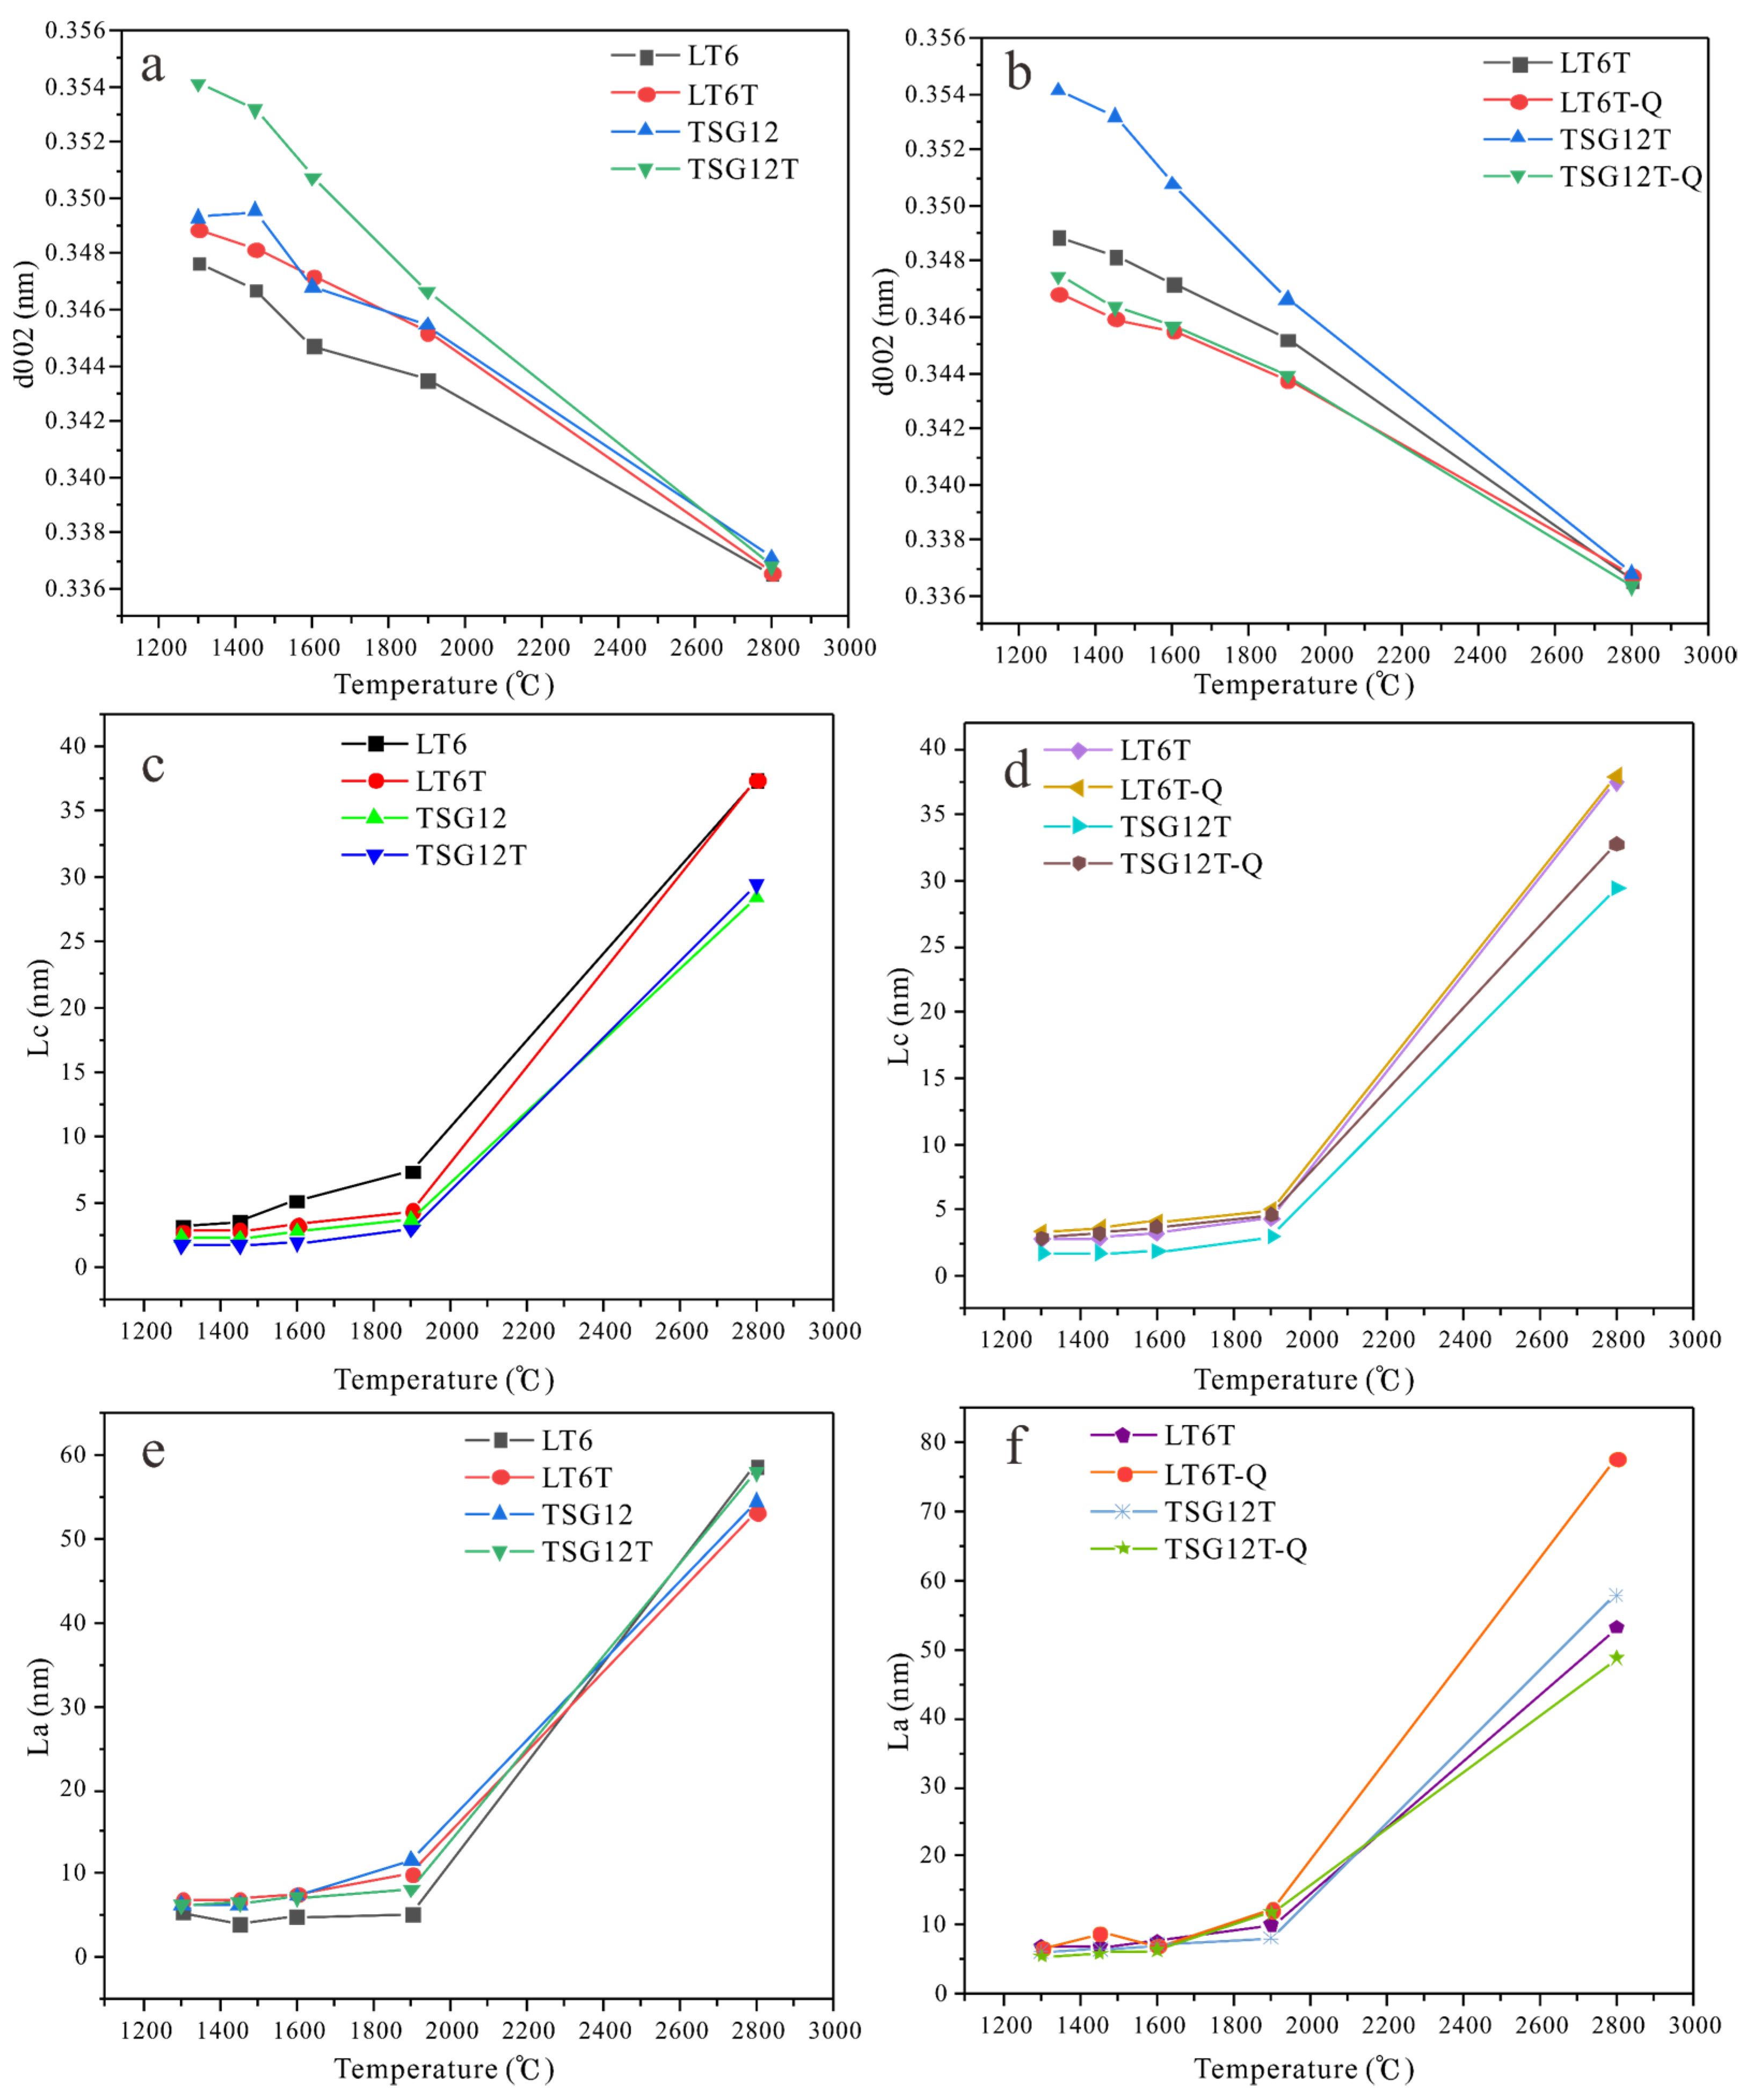
XRD is a non-destructive technique to determine the stacking structure in carbon materials for reflecting the graphitization degree of carbonaceous materials [39,43]. To obtain accurate structural parameters, the 002 and 100 peaks were peak-fitted and the calculated structural parameters (d002, Lc, La) of different samples are shown in Figure 2.
The parameter d002 is a measure of the perfection in the stacking structure periodicity [38]. The d002 values of all samples showed a decreasing trend with the increase in temperature (Figure 2a,b). Compared with raw coal and demineralized coal, the d002 of LT6 and TSG12 at the pre-graphitization stage was always correspondingly smaller than that of LT6T and TSG12T, respectively (Figure 2a). At 1900 °C, the d002 of LT6 was closer to 0.3440 nm, making the beginning of the graphitization of coal [44]. Up to 2800 °C, the d002 of LT6 and LT6 reached almost the same value, while the d002 of TSG12T was slightly larger than that of TSG12. In Figure 3b, the d002 of demineralized coals was also larger than that of the corresponding quartz-added coals at the pre-graphitization stage and then tended to be the same at 2800 °C. This indicated that silicon-containing minerals showed a positive effect on the reduction of interlayer spacing of the coal crystallite structure at the pre-graphitization stage. In addition, the d002 of LT6 coal was relatively smaller at the same preparation conditions, suggesting that anthracite had a better promotion effect.
Figure 2c,d showed the change in Lc for different samples with increasing temperature. All coal samples had similar trends, in which the Lc increased slightly below 1900 °C, and then significantly increased above 1900 °C. For LT coal, the Lc of both LT6 and LT6T-Q was larger than that of LT6T at 1300~1900 °C, while their Lc was closed at 2800 °C. Similarly, the evolution of Lc for three TSG samples also showed the same trend. Therefore, the changes of Lc suggested that silicon-containing minerals were beneficial to the growth of stacking height at the pre-graphitization stage.
As seen in Figure 2e,f, at the pre-graphitization stage, the La of LT6T was larger than that of LT6T and closer to LT6T-Q, while the La of TSG12T was slightly higher than that of TSG12 and TSG12T-Q. This change indicated that silicon-containing minerals presented less effect on the lateral size of coal crystallites or slightly inhibited its extension at the pre-graphitization process.

3.2.2. Raman Spectroscopy Analysis

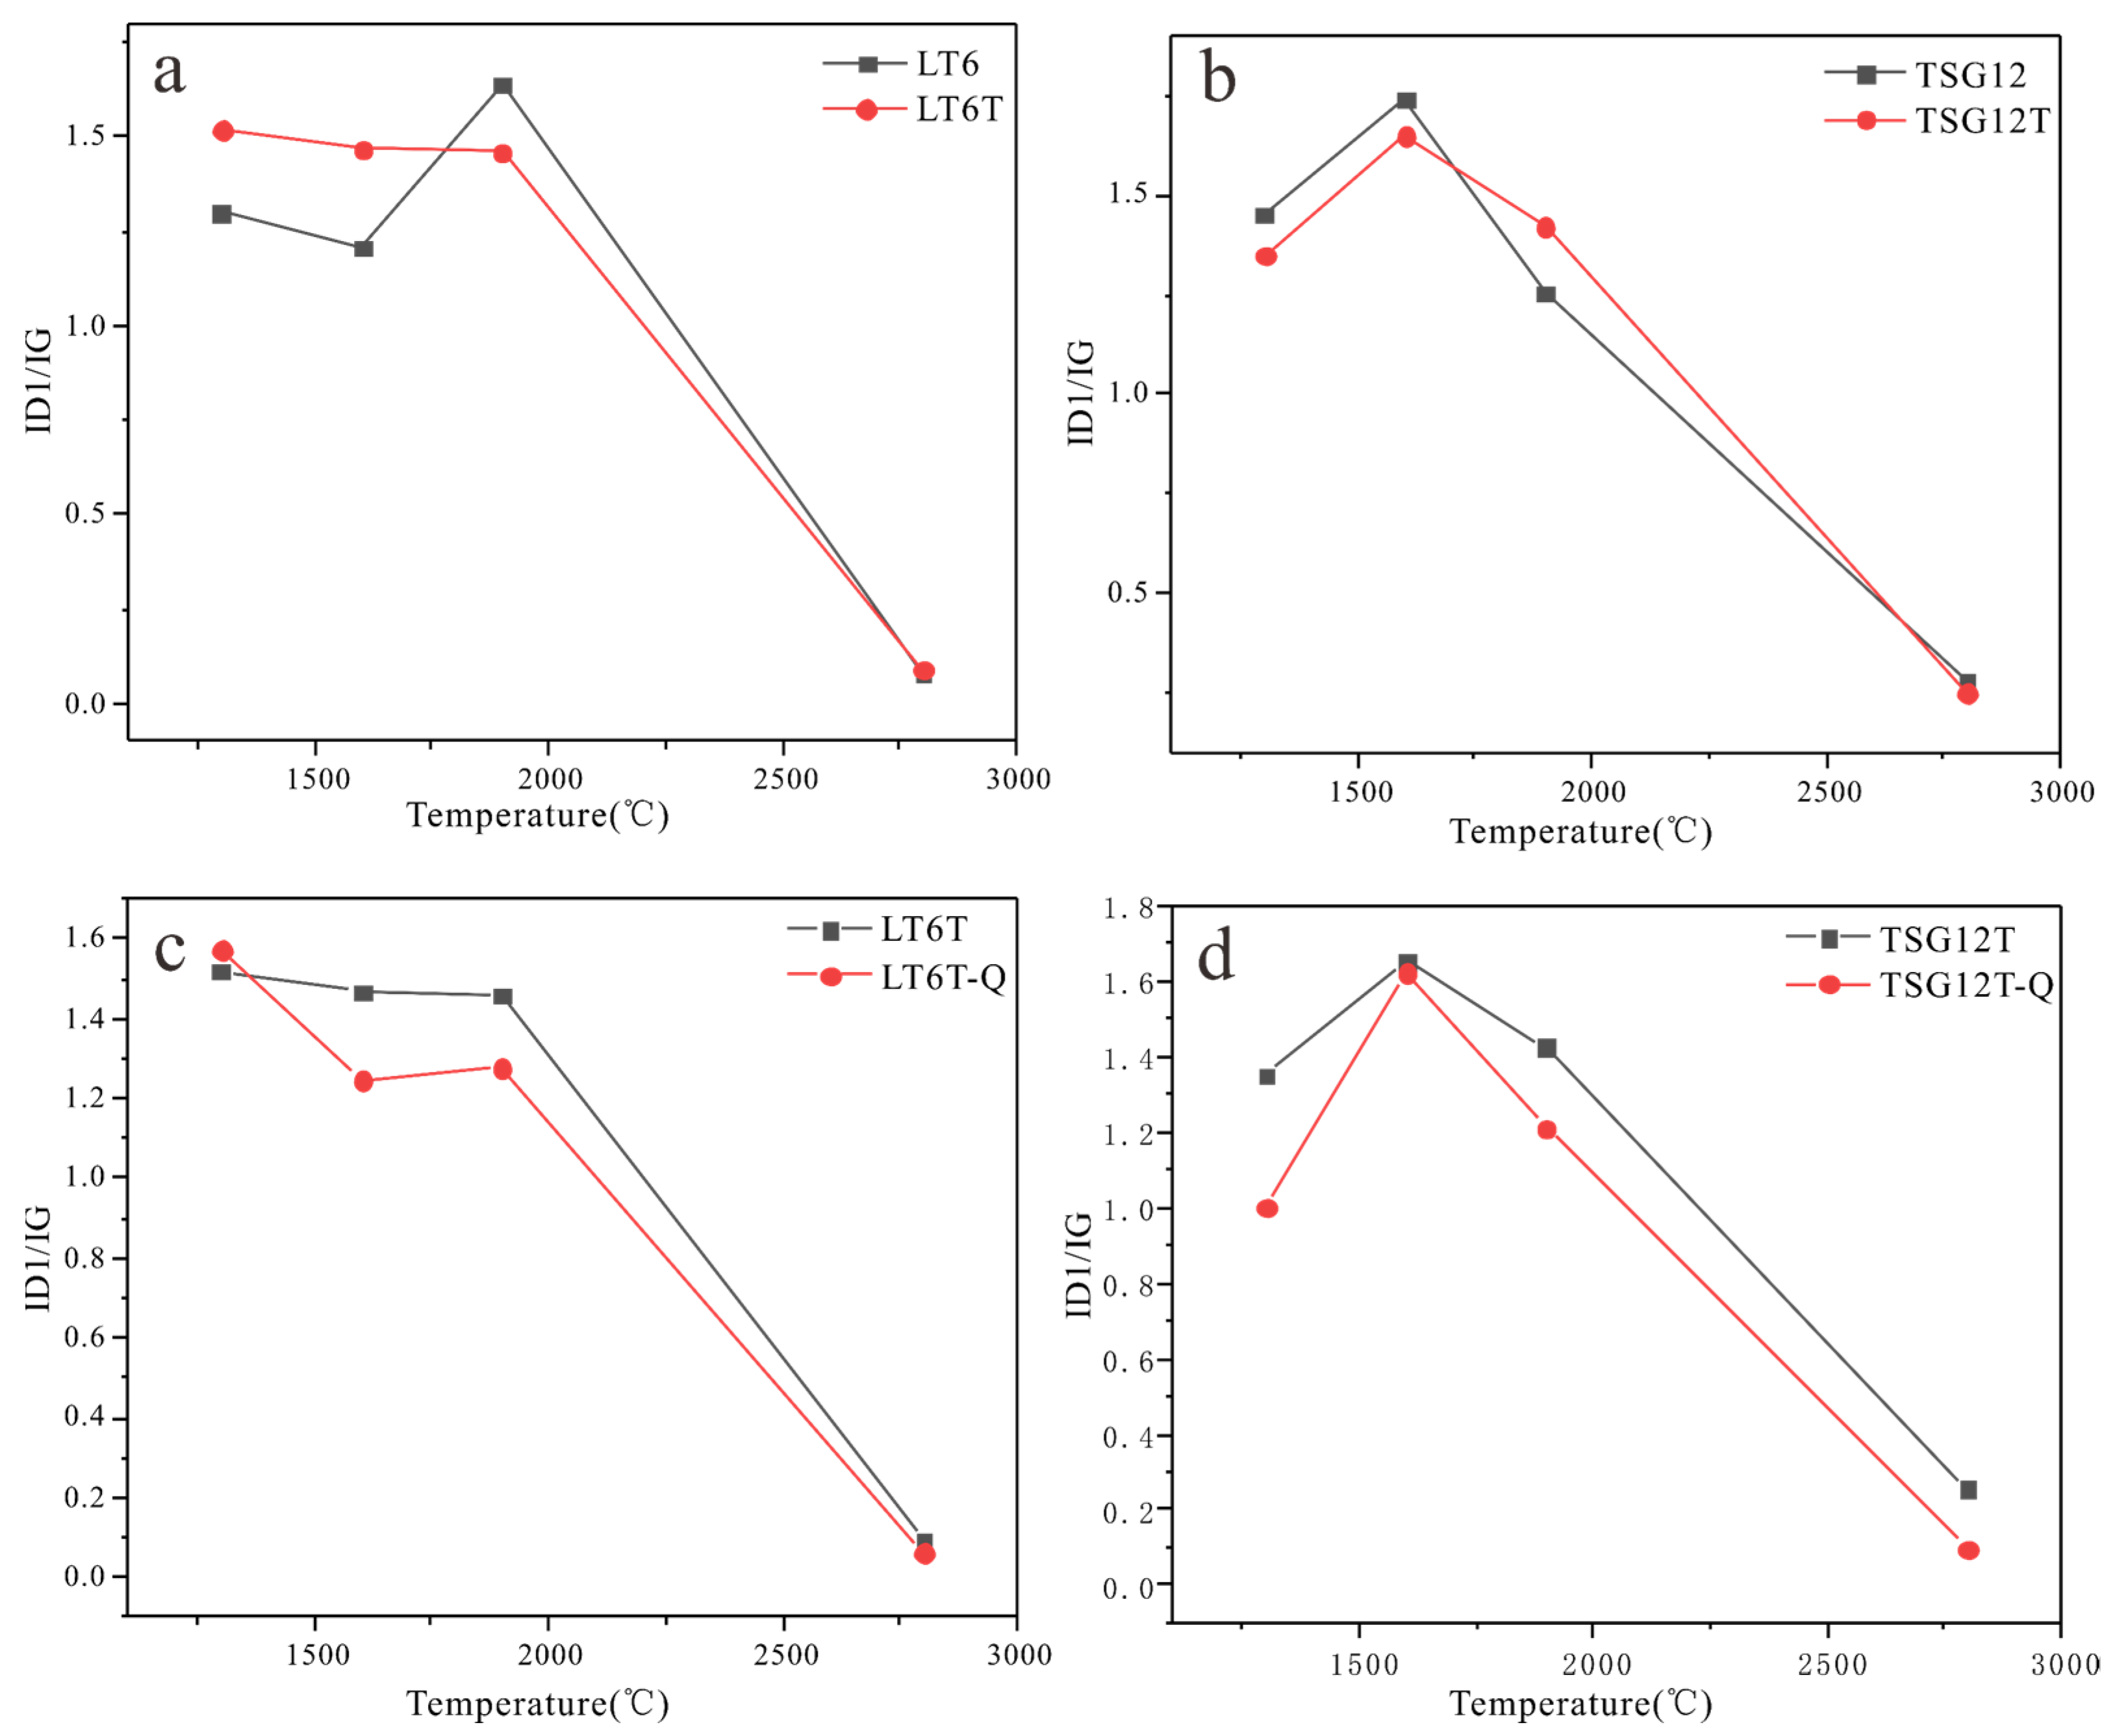
Raman spectroscopy has been widely used to provide important information for the degree of structural order of carbonaceous materials, and its characteristic spectra generally exist in the first-order region and second-order region, which corresponded to 800~2000 cm−1 and 2400~3400 cm−1, respectively [45,46,47,48,49,50,51]. The Raman spectra of all samples exhibited a similar evolution trend, as shown in Figure 3. In the first-order Raman spectrum, just one band at about 1580 cm−1 (G band) for the single crystals of graphite was found and defined as the E2g2 mode of graphite [52,53]. On the other hand, the spectrum of the graphite bar exhibits additional bands (D or “defect” bands), which are known to be characteristic of disordered graphite [54]. Compared with the G peak, the D band becomes more intense with an increasing degree of disorder in the graphitic structure [54]. As seen in Figure 3, the D1 peak was clear, the shape of the D1 and G peaks of samples were wider, and the intensity of the D1 peak was also greater than that of the G peak at the pre-graphitization stage, indicating that the coal structure was disordered in this stage. Up to 2800 °C, the D1 and G peaks of samples became sharp and the intensity of the D1 peak significantly decreased, which was much lower than that of the previous stage, indicating that the coal-based graphite crystals with smaller particles possibly begin to form in the sample and the defects structures still existed [36]. The graphite mainly has three non-overlapping bands located at about 2480, 2670, and 3240 cm−1 in the second-order Raman spectrum, indicating the second-order Raman spectrum of graphite is simple [50]. However, for the samples, it can be seen in Figure 3 that the second-order Raman spectra were complex and significantly different from that of the graphite, which separately were the 2D1 peak (the overtone of the D1 peak), the D1+G peak (the combination of the D1 peak and G peak), and the 2D2 peak (the overtone of the D2 peak). As the temperature increased, the 2D1 peak shape gradually became narrower and more intense, which also indicated that the coal structure tended to be ordered with the increase in temperature. A similar result was reported by Xu et al. that the intensity of 2D1 increased with the enhancement of coalification because the high-temperature treatment of coal was equivalent to the process of coalification [50]. At the same time, a new peak around 2450 cm−1 was observed that is hard to interpret because its origin is still controversial. Li et al. [55,56] considered this a sign of the formation of graphitized structure in the structural evolution of carbon materials, while it was not present during the process of carbonization. As shown in Figure 2, it can be inferred that the existence of silicon-containing minerals in coal strongly promoted the degree of structural order. Raman spectra were peak-fitted to more accurately describe the differences in crystallite structure, and detailed assignments for various functional groups of coals are listed in Table 2 [47,48,49,50]. The ID1/IG (the peak area or integrated intensities) has been extensively used to evaluate crystalline or graphite-like carbon structures, and the ID1/IG ratio normally decreases with an increasing extent of graphitization [57,58]. The band peak is a function of the peak intensity and the FWHM and is virtually a combined parameter of those two parameters [52,57]. Therefore, ID1/IG characterized the peak area ratio between the D1 peak and G peak in this paper, and the variation of ID1/IG for different samples was calculated and shown in Figure 4.
For LT coal (Figure 4a,c), the ID1/IG of LT6 significantly increased at the pre-graphitization stage and then rapidly decreased above 1900°C, whilst ID1/IG of LT6T and LT6T-Q showed a decreasing trend at the pre-graphitization stage and also sharply decreased above 1900 °C. It was obvious that the ID1/IG of LT6T-Q was always relatively smaller than that of LT6T. These changes indicated that the mixed minerals in raw coal would hinder the ordered arrangement of structures at pre-graphitization, but the existence of only silicon-containing minerals in coal would promote structural alignment and become more gradually ordered in this stage. In TSG coal (Figure 4b,d), the turning point of ID1/IG with temperature occurred at 1600 °C for three samples, which showed that the ID1/IG increased at 1300~1600 °C and then significantly decreased above 1600 °C. This indicated that the structural evolution of bituminous coal must first be spliced with disordered microcrystalline layers, which reduced the degree of order, and then the layers gradually became parallel and ordered again as the temperature increased [59]. Similarly, the ID1/IG of TSG12T-Q was always relatively smaller than that of TSG12T. Therefore, the evolution of ID1/IG could prove that silicon-containing minerals promoted structural rearrangement and improved the order of coal at the pre-graphitization stage.

3.3. Characteristics of Minerals and Morphology

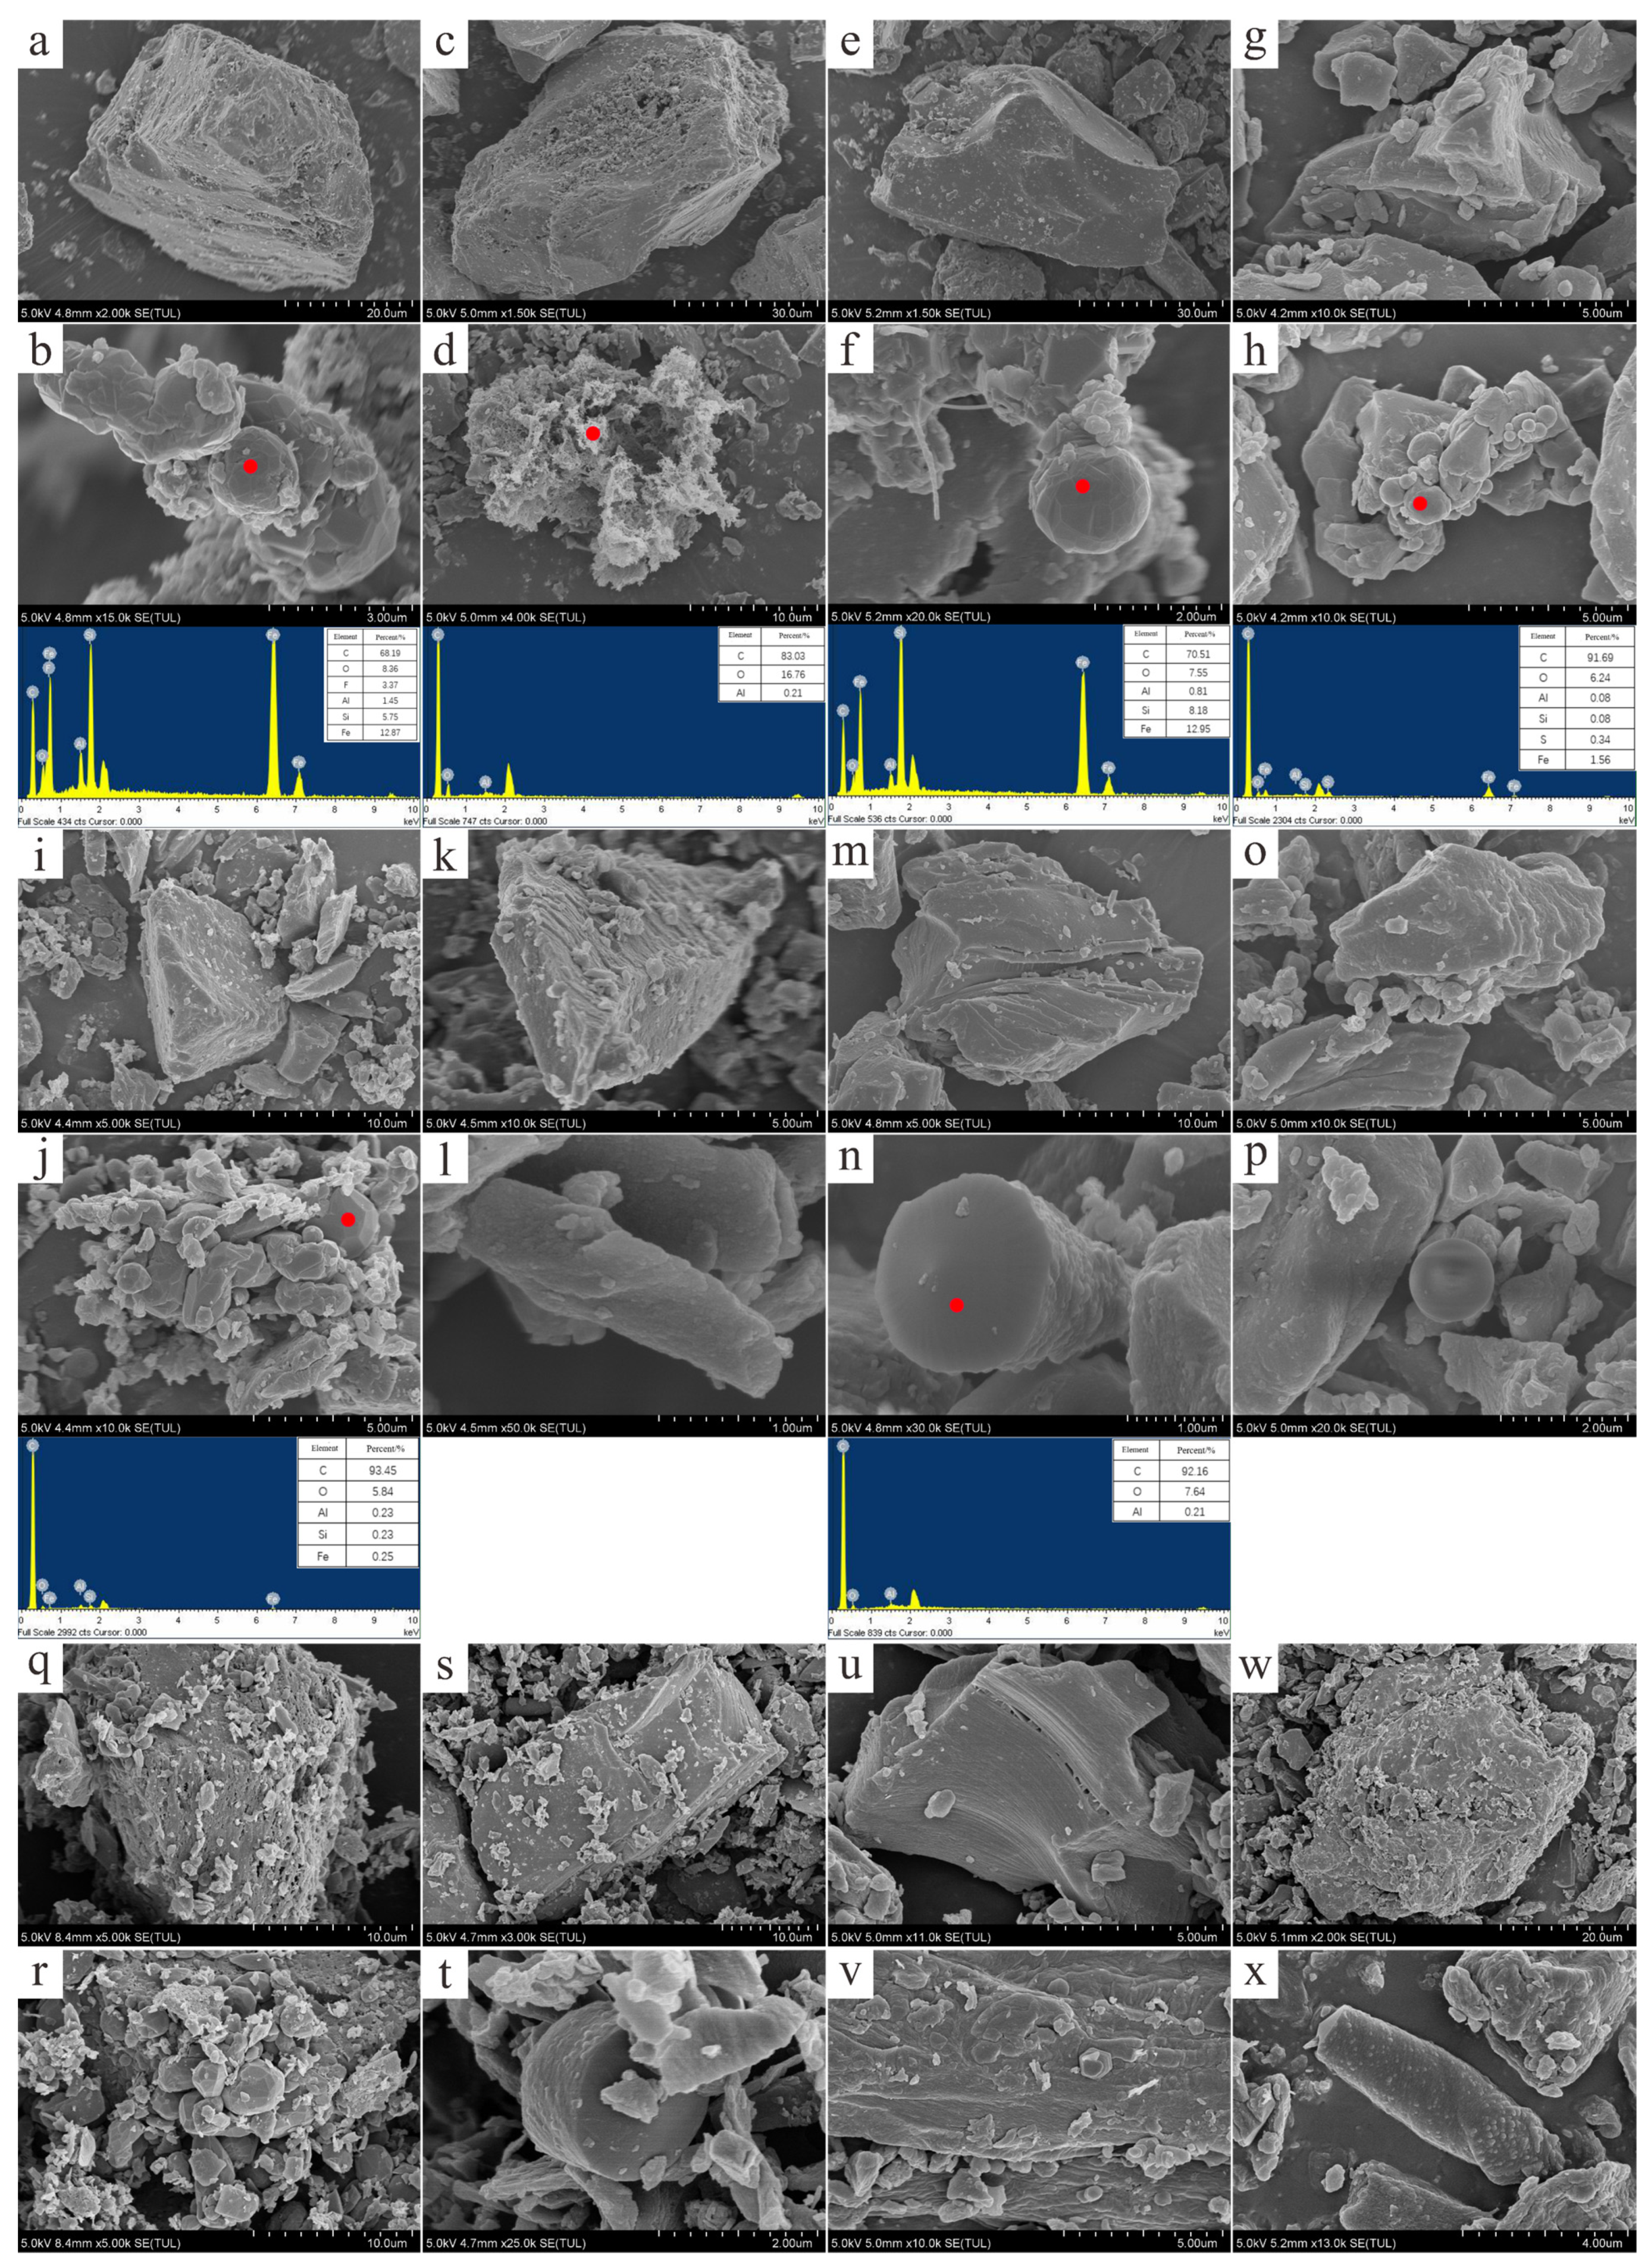
The SEM images of raw coal and demineralized coal at different heating temperatures are presented in Figure 5. At 1300 °C (Figure 5a–h), the micromorphology of the sample was clear, mostly angular and dense massive structures. In addition, some irregular polyhedron structures with a few tiny particles were also found, whose EDS showed that C was the main element. In addition, there were more pore structures on the surface of demineralized coal, which may be caused by the minerals being dissolved during the demineralization. At 1900 °C (Figure 5i–p), the micromorphology of the sample was similar to that at 1300 °C, it was still dominated by clearly distinguishable massive structures. However, the difference was that the surface of the massive structures clearly showed layers at this stage. Up to 2800 °C (Figure 5q–x), similar to the SEM characteristics at other temperatures, it was still dominated by massive structures with porous or layered surfaces, and a small amount of polyhedral structure. Combined with XRD, d002 at this temperature was extremely close to 0.3354 nm, which was the interlayer spacing of the ideal single-crystal graphite. It was inferred that most of the substances in the sample, except graphite, had evaporated at this stage, so it was not conducted for EDS analysis. Therefore, with or without demineralization, the whole micromorphology of the samples was dominated by massive structures, indicating that they did not change with temperature. Based on EDS results, it can be inferred that the formation of the few polyhedral structures observed may be related to the minerals. Meanwhile, based on the samples and test results, pyrite was present in both raw coals, and iron-containing minerals were detected in XRD and SEM of raw coal and demineralized coal, as well as in XRD of quartz-added demineralized coal. Therefore, it was inferred that the polyhedron structures may also be associated with the unremoved pyrite due to the insufficient dissolution of pyrite by the acid used for demineralization [11].
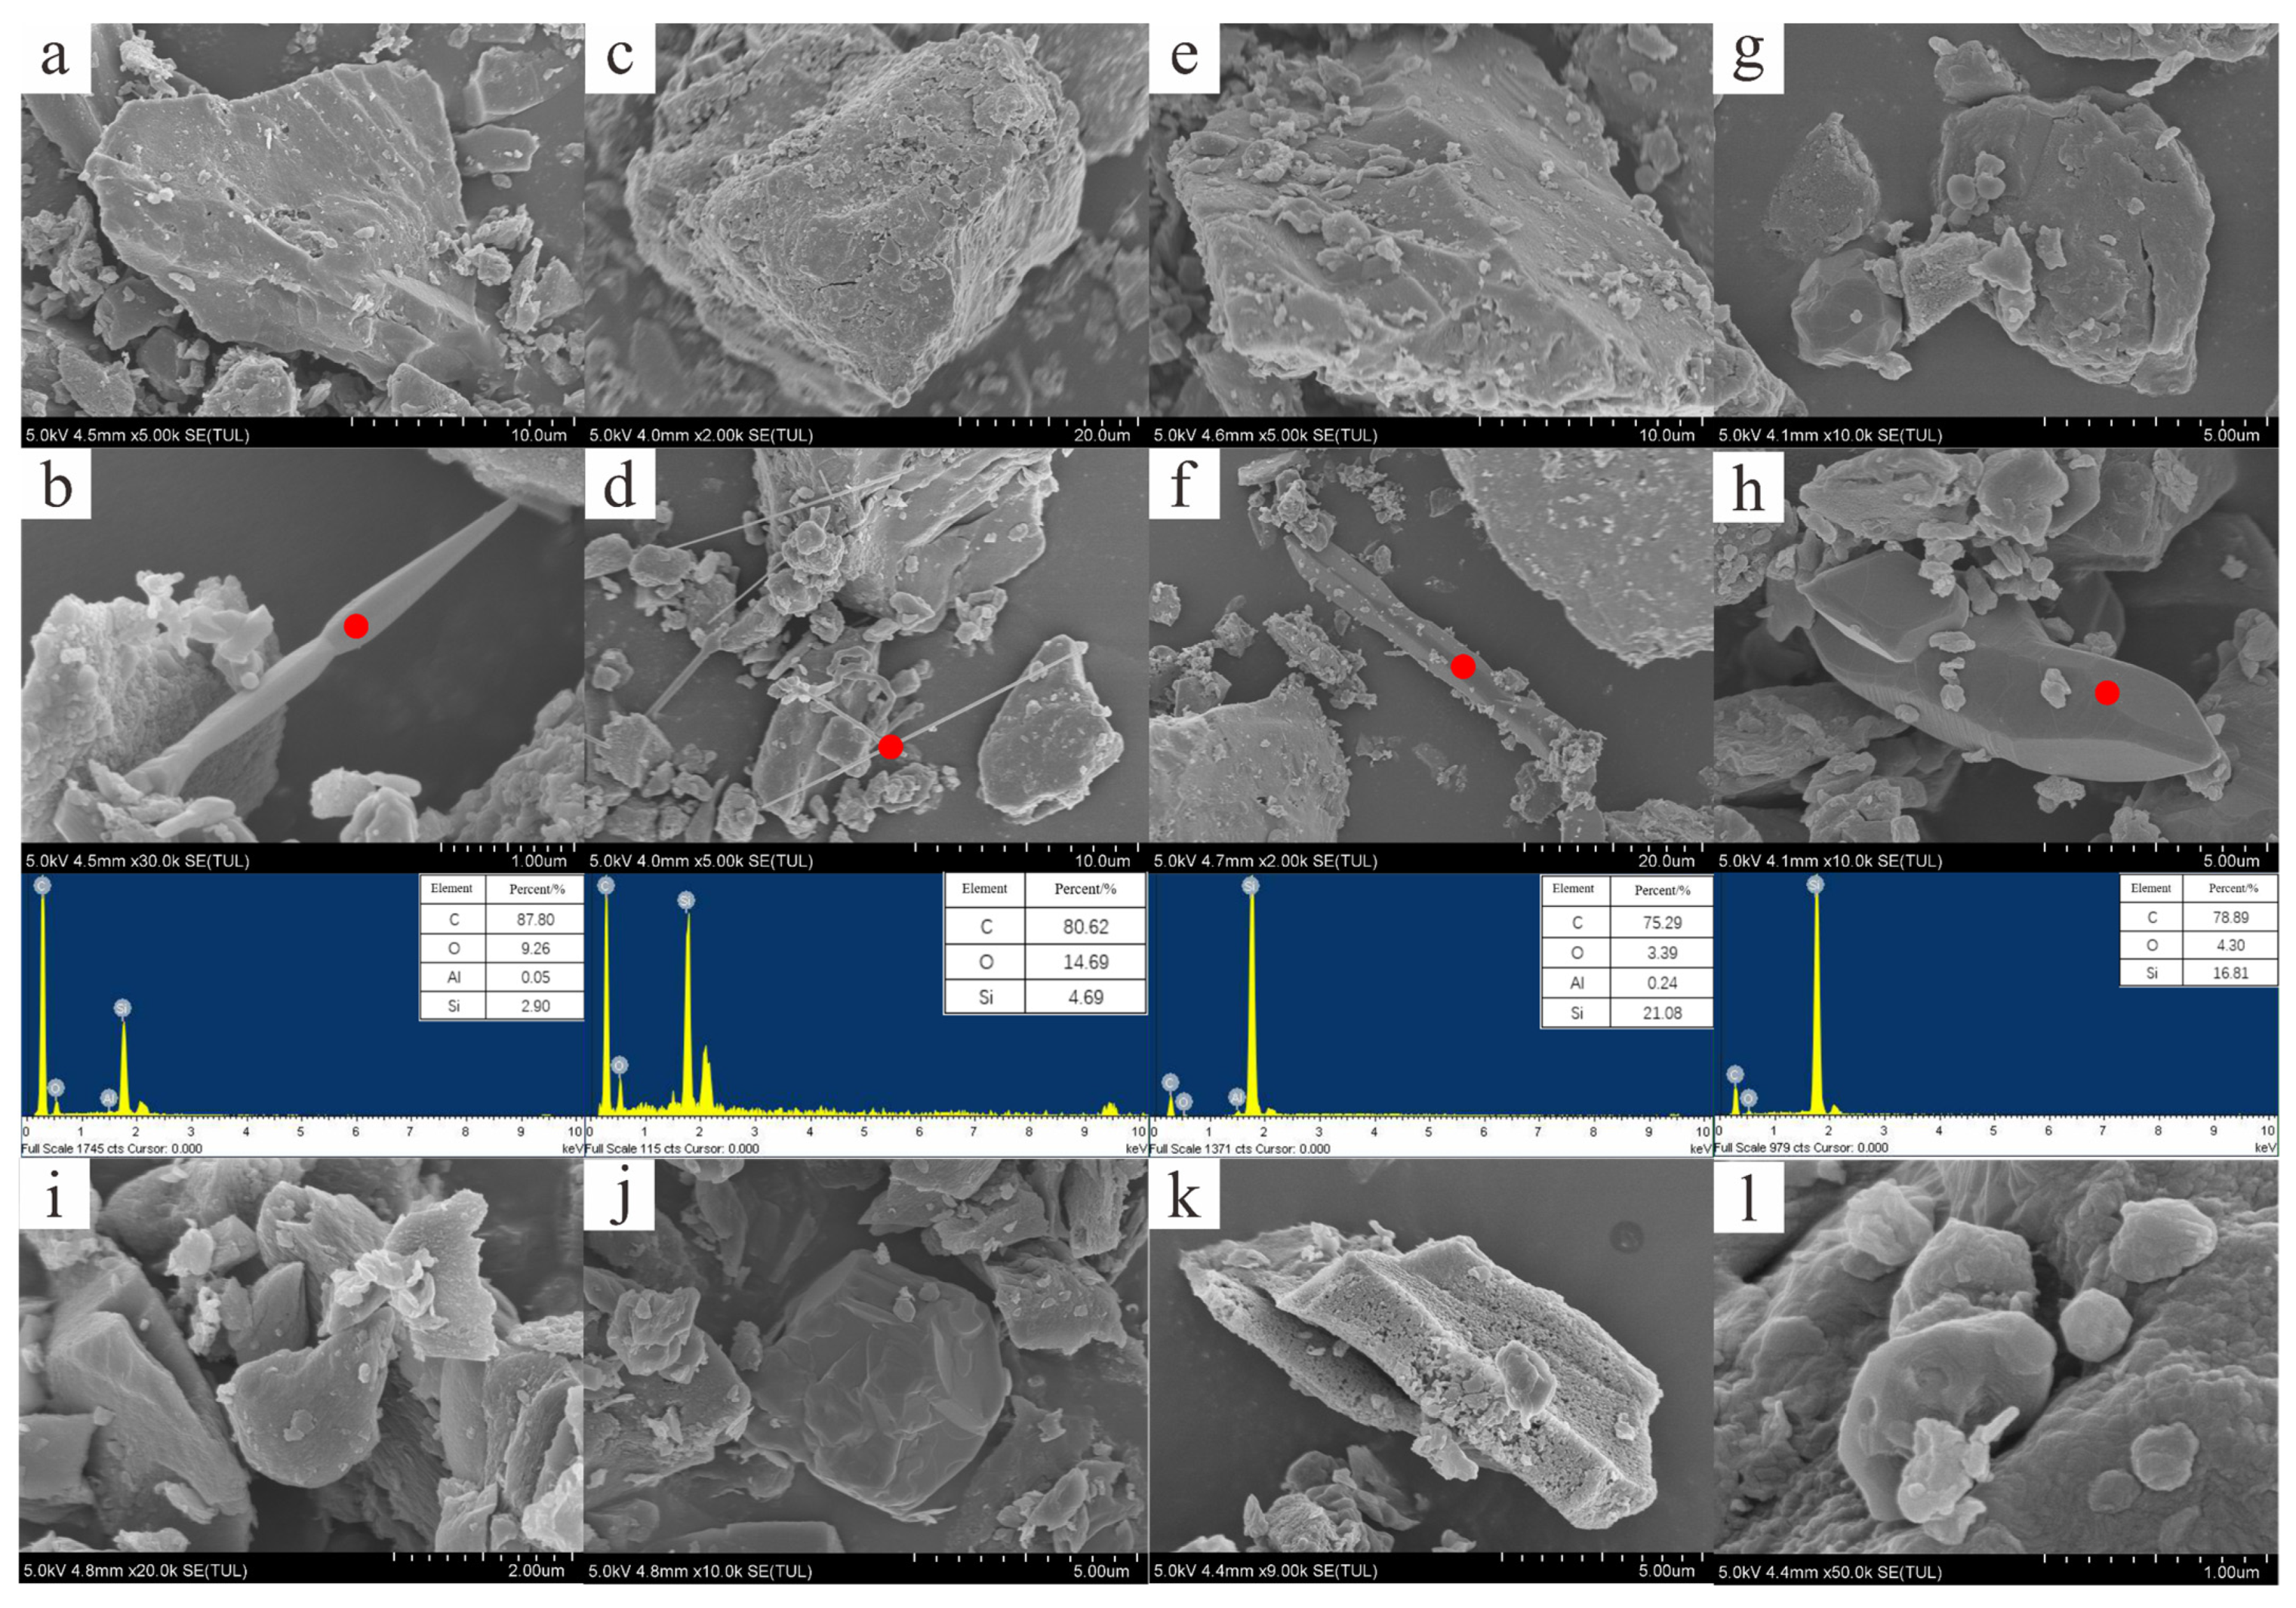
Figure 6 illustrates the SEM images of quartz-added samples. At 1300 °C (Figure 6a–d), the micromorphology of the samples was mainly massive structures, with sizes ranging from 10 to 40μm. In addition, some fine needle-like structures with different lengths were also observed in Figure 6b,d, in which the main element was C with less O and Si. With the increase in temperature, the massive structures were still the main micromorphology in coal with smooth or layered surfaces (Figure 6e–l). Some long columnar structures were also found at 1900 °C, and the constituent elements were unchanged, but the content of Si had a slight increase, as shown in Figure 6f,h. Up to 2800 °C, the long columnar structures were transformed into polyhedral structures (Figure 6i–l). Combined with XRD analysis, the needle-like structures can be attributed to the formation of the needle-like multilayer structures of quartz-SiC-carbon, in which the recrystallized quartz reacted with excess carbon to produce SiC growth based on quartz crystals and the surface of carbonaceous elements [19]. As the temperature increased, the reaction continued to produce SiC attached to the needle-like structures, increasing its length and diameter, and eventually producing the long columnar structure. At 2800 °C, SiC in samples had completely decomposed and the C elements in it were redeposited on the columnar structures to form the polyhedral structure.

3.4. Effect of Silicon-Containing Minerals on the Pre-Graphitization Stage

The comparison of raw and demineralized coals showed that the raw coals exhibited smaller d002 and larger Lc values than the corresponding demineralized coal (Figure 2). Combining Raman and SEM analysis, it can be inferred that the existence of mixed mineral matter in raw coal gave rise to a decrease in interlayer spacing and an increase in stacking height and made it easier for the structure to rearrange into a more ordered structure. In order to further explore the influence of silicon-containing minerals, demineralized samples containing 10wt% quartz were conducted, and significant changes in its chemical structural characteristics and micromorphology were observed. It showed smaller d002 and ID1/IG, and higher Lc, while La presented a slight increase. The reduction of the quartz occurred at 1300 °C, forming needle-like SiC. With increasing temperature, the needle-like structures gradually grew in length and diameter, eventually producing the quartz-SiC-carbon multilayer long columnar structure. Above 1900 °C, SiC was decomposed by heat and the carbon-rich polyhedral structures became the main microstructure. These changes indicated that the formation and dissolution of SiC at the pre-graphitization stage was conducive to the movement and rearrangement of the coal molecular structure, resulting in the reduction of interlayer spacing, the development of longitudinal layer stacking height, and the enhancement of structural ordering. Therefore, the height of the aromatic planes grew during the pre-graphitization stage, and the width increased slightly [34,60].

4. Conclusions

In order to further explain the effect of silica-containing minerals on coal during the pre-graphitization stage, LT anthracite and TSG bituminous coal were selected as the subjects in this paper. Graphitized samples of raw coal, demineralized coal, and quartz-added demineralized coal were prepared via high-temperature treatments. XRD and Raman spectroscopy were applied to reveal structural change, and the micro-morphological features were observed by SEM. The effect of silicon-containing minerals on coal at the pre-graphitization stage was discussed by comparing the characteristics of different samples. The results showed that silicon-containing minerals played a positive role in structural evolution at this stage, as evidenced by the relatively smaller d002 and ID1/IG, and the relatively larger Lc and La of the samples with silicon-containing minerals. Meanwhile, SEM observation found that the main micromorphology of the samples at different temperatures were massive structures, and the increase in temperature did not change the basic morphology but only decreased its mineral content. A small amount of irregular polyhedral structures was also found at the pre-graphitization stage, which was formed by the reaction of silicon-containing minerals with carbon in samples and the continuous accumulation of quartz-SiC-carbon multilayer polyhedral structures. At higher temperatures, SiC was completely decomposed and the carbon element was redeposited to produce graphite. Therefore, it could be inferred that silica-containing minerals promoted structural rearrangement by forming SiC during the pre-graphitization stage, which was beneficial to improve the structural order, reducing the interlayer spacing and promoting the development of longitudinal layer stacking height, thereby accelerating the graphitization process. In addition, it was found that LT anthracite showed a relatively better graphitization effect.

Author Contributions

Conceptualization, S.W., Y.S. and X.L.; investigation, X.L.; validation, Y.S.; experimental analysis, Y.S. and X.L.; writing—original draft preparation, S.W. and Y.S.; writing—review and editing, S.W.; funding acquisition, S.W. All authors have read and agreed to the published version of the manuscript.

Funding

This work was supported by the National Natural Science Foundation of China (grants 42030807 and 42072196), and the Key R & D Program of Ningxia Hui Autonomous Region (grant 2021BEG02015).

Data Availability Statement

The data is available upon reasonable request from the corresponding author.

Acknowledgments

All authors gratefully appreciate Xiaoxia Song for providing Tangshangou coal samples. The authors thank Yixiu Zhang, Jinsong Deng for sample preparation.

Conflicts of Interest

The authors declare no conflict of interest.

References

  1. Klemens, P.G.; Pedraza, D.F. Thermal conductivity of graphite in the basal plane. Carbon 1994, 32, 735–741. [Google Scholar] [CrossRef]
  2. Ōya, A.; Marsh, H. Phenomena of catalytic graphitization. J. Mater. Sci. 1982, 17, 309–322. [Google Scholar] [CrossRef]
  3. Gao, T.M.; Chen, Q.S.; Yu, W.J.; Shen, L. Projection of China’s graphite demand and development prospects. Resour. Sci. 2015, 37, 1059–1067. [Google Scholar]
  4. Kwiecińska, B.; Petersen, H.I. Graphite, semi-graphite, natural coke, and natural char classification—ICCP system. Int. J. Coal Geol. 2004, 57, 99–116. [Google Scholar] [CrossRef]
  5. Zhang, X.M.; Wang, S.Q.; Chen, H.; Li, X.Q.; Zhang, Y.X. An investigation on the graphitization of low-rank coal: Evolutional characteristics of aromatic structure. J. China Coal Soc. 2022, 47, 2768–2778. [Google Scholar]
  6. Liu, X.Y.; Tao, H.C.; Tang, C.Y.; Yang, X.L. Anthracite-derived carbon as superior anode for lithium/potassium-ion batteries. Chem. Eng. Sci. 2022, 248, 117200. [Google Scholar] [CrossRef]
  7. Wang, Q.L.; Yu, M.Q.; Gong, J.N.; Zhang, F.T. Study on the properties of coal-based high-purity graphite. Mater. Express 2019, 9, 668–674. [Google Scholar] [CrossRef]
  8. Guo, R.N.; Li, W.B.; Han, Y.X. Progress on the separation, purification and application of natural graphite. Chem. Ind. Eng. Prog. 2021, 40, 6155–6172. [Google Scholar]
  9. Li, H.T.; Cao, D.Y.; Zhang, W.G.; Wang, L. XRD and Raman spectroscopy characterization of graphitization trajectories of high-rank coal. Spectrosc. Spectr. Anal. 2021, 41, 2491–2498. [Google Scholar]
  10. Tang, Y.G.; Xu, J.J.; Huan, X.; Wang, S.Q.; Chen, P.X. Preparation and spectroscopic characterization of coal-based graphene from anthracite in Xiaofalu, Yunan, China. J. China Coal Soc. 2020, 45, 740–748. [Google Scholar]
  11. Gong, L.B. Research on the Influence of Mineralizers on Coal Graphitization and Its Control Mechanism; Hebei University of Engineering: Handan, China, 2021. [Google Scholar]
  12. Oberlin, A.; Terriere, G. Graphitization studies of anthracites by high resolution electron microscopy. Carbon 1975, 13, 367–376. [Google Scholar] [CrossRef]
  13. Atria, J.V.; Rusinko, F.; Schobert, H.H. Structural ordering of Pennsylvania anthracites on heat treatment to 2000~2900 °C. Energy Fuels 2002, 16, 1343–1347. [Google Scholar] [CrossRef]
  14. Rodrigues, S.; Suárez-Ruiz, I.; Marques, M.; Flores, D.; Camean, I.; García, A.B. Development of graphite-like particles from the high temperature treatment of carbonized anthracites. Int. J. Coal Geol. 2011, 85, 219–226. [Google Scholar] [CrossRef]
  15. Rodrigues, S.; Suárez-Ruiz, I.; Marques, M.; Camean, I.; Flores, D. Microstructural evolution of high temperature treated anthracites of different rank. Int. J. Coal Geol. 2011, 87, 204–211. [Google Scholar] [CrossRef]
  16. Borunova, A.B.; Streletskii, A.N.; Permenov, D.G.; Leonov, A.V. The effect of the mechanical activation dose on the defective structure of artificial graphite. Colloid J. 2015, 77, 125–134. [Google Scholar] [CrossRef]
  17. Qiu, T. Research on the Graphitization Process of Coal and the Migration Rule of Coal-Derived Minerals; China University of Mining and Technology: Xuzhou, China, 2019. [Google Scholar]
  18. Tian, Y. The Influence of Mineralizer on Coal Graphitization and Its Mechanism; Hebei University of Engineering: Handan, China, 2021. [Google Scholar]
  19. Nyathi, M.S.; Clifford, C.B.; Schobert, H.H. Characterization of graphitic materials prepared from different rank Pennsylvania anthracites. Fuel 2013, 114, 244–250. [Google Scholar] [CrossRef]
  20. Zhou, Q.; Zhao, Z.B.; Zhang, Y.T.; Meng, B.; Zhou, A.N.; Qiu, J.S. Graphene sheets from graphitized anthracite coal: Preparation, decoration, and application. Energy Fuels 2012, 26, 5186–5192. [Google Scholar] [CrossRef]
  21. Franklin, R.E. Crystallite growth in graphitizing and non-graphitizing carbons. Proc. R. Soc. Lond. Ser. A Math. Phys. Sci. 1951, 209, 196–218. [Google Scholar]
  22. Bustin, R.M.; Ross, J.V.; Rouzaud, J.-N. Mechanisms of graphite formation from kerogen: Experimental evidence. Int. J. Coal Geol. 1995, 28, 1–36. [Google Scholar] [CrossRef]
  23. Cao, D.Y.; Li, X.M.; Zhang, S.R. Influence of tectonic stress on coalification-stress degradation mechanism and stress polycondensation mechanism. Sci. China (Ser. D Earth Sci.) 2006, 1, 59–68. [Google Scholar] [CrossRef]
  24. Zhang, X.M.; Wang, S.Q.; Chen, H.; Wang, X.X.; Deng, J.S.; Li, X.Q.; Zhang, Y.X. Observation of carbon nanostructure and evolution of chemical structure from coal to graphite by high temperature treatment, using componential determination, X-ray diffraction and high-resolution transmission electron microscope. Fuel 2023, 332, 126145. [Google Scholar] [CrossRef]
  25. Li, J.Q.; Qin, Y.; Chen, Y.L. Occurrence and origin of graphite microcrystal in meta-anthracite. Coal Geol. Explor. 2020, 48, 27–33. [Google Scholar]
  26. Franklin, R.E. The structure of graphitic carbons. Acta Crystallogr. 1951, 4, 253. [Google Scholar] [CrossRef]
  27. González, D.; Montes-Morán, M.A.; Garcia, A.B. Influence of inherent coal mineral matter on the structural characteristics of graphite materials prepared from Anthracites. Energy Fuels 2005, 19, 263–269. [Google Scholar] [CrossRef]
  28. Pappano, P.J.; Schobert, H.H. Effect of natural mineral inclusions on the graphitizability of a Pennsylvania anthracite. Energy Fuels 2009, 23, 422–428. [Google Scholar] [CrossRef]
  29. Rodrigues, S.; Suárez-Ruiz, I.; Marques, M.; Flores, D. Catalytic role of mineral matter in structural transformation of anthracites during high temperature treatment. Int. J. Coal Geol. 2012, 93, 49–55. [Google Scholar] [CrossRef]
  30. Liu, B.; He, Q.H.; Jiang, Z.H.; Xu, R.F.; Hu, B.X. Relationship between coal ash composition and ash fusion temperatures. Fuel 2013, 105, 293–300. [Google Scholar] [CrossRef]
  31. Wang, L.P.; Yao, Z.X.; Guo, Z.M.; Shen, X.F.; Li, Z.A.; Zhou, Z.Q.; Wang, Y.L.; Yang, J.G. Effects of solvent extraction on the microstructure of bituminous coal-based graphite. Carbon Lett. 2022, 32, 741–749. [Google Scholar] [CrossRef]
  32. Baraniecki, C.; Pinchbeck, P.H.; Pickering, F.B. Some aspects of graphitization induced by iron and ferro-silicon additions. Carbon 1969, 7, 213–224. [Google Scholar] [CrossRef]
  33. Pappano, P.J. A Mechanism of Pennsylvania Anthracite Graphitization Involoving Carbide Formation and Decomposition; The Pennsylvania State University: State College, PA, USA, 2003. [Google Scholar]
  34. Lin, Q.Y.; Feng, Z.H.; Liu, Z.J.; Guo, Q.G.; Hu, Z.J.; He, L.L.; Ye, H.Q. Atomic scale investigations of catalyst and catalytic graphitization in a silicon and titanium doped graphite. Carbon 2015, 88, 252–261. [Google Scholar] [CrossRef]
  35. Liu, H.Y.; Xu, L.; Jin, Y.; Fan, B.G.; Qiao, X.L.; Yang, Y.X. Effect of mineral matter on structure and dielectric properties of chars. Fuel 2018, 222, 370–374. [Google Scholar] [CrossRef]
  36. Li, H.T.; Zhang, H.; Li, K.J.; Zhang, J.J.; Sun, M.M.; Su, B.X. Catalytic graphitization of coke carbon by iron: Understanding the evolution of carbon Structure, morphology and lattice fringes. Fuel 2020, 279, 118531. [Google Scholar] [CrossRef]
  37. Lu, L.; Sahajwalla, V.; Kong, C.; Harris, D. Quantitative X-ray diffraction analysis and its application to various coals. Carbon 2001, 39, 1821–1833. [Google Scholar] [CrossRef]
  38. Li, M.F.; Zeng, F.G.; Chang, H.Z.; Xu, B.S.; Wang, W. Aggregate structure evolution of low-rank coals during pyrolysis by in-situ X-ray diffraction. Int. J. Coal Geol. 2013, 116–117, 262–269. [Google Scholar] [CrossRef]
  39. Jiang, J.Y.; Yang, W.H.; Cheng, Y.P.; Liu, Z.D.; Zhang, Q. Molecular structure characterization of middle-high rank coal via XRD, Raman and FTIR spectroscopy: Implications for coalification. Fuel 2019, 239, 559–572. [Google Scholar] [CrossRef]
  40. Takagi, H.; Maruyama, K.; Yoshizawa, N.; Yamada, Y.; Sato, Y. XRD analysis of carbon stacking structure in coal during heat treatment. Fuel 2004, 83, 2427–2433. [Google Scholar] [CrossRef]
  41. Li, J.Q.; Oin, Y.; Chen, Y.L.; Shen, J.; Song, Y.; Wang, Z.W. Structural characteristics and evolution of meta-anthracite to coaly graphite: A quantitative investigation using X-ray diffraction, Raman spectroscopy, and high-resolution transmission electron microscopy. Fuel 2023, 333, 126334. [Google Scholar] [CrossRef]
  42. Lin, Q.; Guet, J.M. Characterization of coals and macerals by X-ray diffraction. Fuel 1990, 69, 821–825. [Google Scholar] [CrossRef]
  43. Wang, S.Q.; Sun, Y.B.; Shu, K.K.; Jiang, D.; Ma, W. Structural characterization of coal components of Late Permian coals from Southern China by X-ray diffraction and Raman spectroscopy. J. Biochem. Anal. Stud. 2017, 2, 1–5. [Google Scholar]
  44. Seehra, M.S.; Pavlovic, A.S. X-ray diffraction, thermal expansion, electrical conductivity, and optical microscopy studies of coal-based graphites. Carbon 1993, 31, 557–564. [Google Scholar] [CrossRef]
  45. Keown, D.M.; Li, X.J.; Hayashi, J.; Li, C.Z. Evolution of biomass char structure during oxidation in O2 as revealed with FT-Raman spectroscopy. Fuel Process. Technol. 2008, 89, 1429–1435. [Google Scholar] [CrossRef]
  46. Morga, R. Micro-Raman spectroscopy of carbonized semifusinite and fusinite. Int. J. Coal Geol. 2011, 87, 253–267. [Google Scholar] [CrossRef]
  47. Baysal, M.; Yürüm, A.; Yıldız, B.; Yürüm, Y. Structure of some western Anatolia coals investigated by FTIR, Raman, 13C solid state NMR spectroscopy and X-ray diffraction. Int. J. Coal Geol. 2016, 163, 166–176. [Google Scholar] [CrossRef]
  48. Zhang, Y.L.; Li, Z.S. Raman spectroscopic study of chemical structure and thermal maturity of vitrinite from a suite of Australia coals. Fuel 2019, 241, 188–198. [Google Scholar] [CrossRef]
  49. Vranjes-Wessely, S.; Misch, D.; Issa, I.; Kiener, D.; Fink, R.; Seemann, T.; Liu, B.; Rantitsch, G.; Sachsenhofer, R.F. Nanoscale pore structure of Carboniferous coals from the Ukrainian Donets Basin: A combined HRTEM and gas sorption study. Int. J. Coal Geol. 2020, 224, 103484. [Google Scholar] [CrossRef]
  50. Xu, J.; Tang, H.; Su, S.; Liu, J.W.; Han, H.D.; Zhang, L.P.; Xu, K.; Wang, Y.; Hu, S.; Zhou, Y.B.; et al. Micro-Raman spectroscopy study of 32 kinds of Chinese coals: Second-order Raman spectrum and its correlations with coal properties. Energy Fuels 2017, 31, 7884–7893. [Google Scholar] [CrossRef]
  51. Xu, J.; Xiang, X.R.; Xu, K.; He, L.M.; Han, H.D.; Su, S.; Wang, Y.; Hu, S.; Xiang, J. Developing micro-Raman spectroscopy for char structure characterization in the scale of micro- and bulk: A case study of Zhundong coal pyrolysis. Fuel 2021, 291, 120168. [Google Scholar] [CrossRef]
  52. Sheng, C.D. Char structure characterised by Raman spectroscopy and its correlations with combustion reactivity. Fuel 2007, 86, 2316–2324. [Google Scholar] [CrossRef]
  53. Hinrichs, R.; Brown, M.T.; Vasconcellos, M.A.Z.; Abrashev, M.V.; Kalkreuth, W. Simple procedure for an estimation of the coal rank using micro-Raman spectroscopy. Int. J. Coal Geol. 2014, 136, 52–58. [Google Scholar] [CrossRef]
  54. Sadezky, A.; Muckenhuber, H.; Grothe, H.; Niessner, R.; Pöschl, U. Raman microspectroscopy of soot and related carbonaceous materials: Spectral analysis and structural information. Carbon 2005, 43, 1731–1742. [Google Scholar] [CrossRef]
  55. Li, K.; Rimmer, S.M.; Liu, Q.; Zhang, Y.M. Micro-Raman spectroscopy of microscopically distinguishable components of naturally graphitized coals from Central Hunan province, China. Energy Fuels 2019, 33, 1037–1048. [Google Scholar] [CrossRef]
  56. Li, K.; Rimmer, S.M.; Liu, Q. Geochemical and petrographic analysis of graphitized coals from Central Hunan, China. Int. J. Coal Geol. 2018, 195, 267–279. [Google Scholar] [CrossRef]
  57. Li, X.J.; Hayashi, J.I.; Li, C.Z. FT-Raman spectroscopic study of the evolution of char structure during the pyrolysis of a Victorian brown coal. Fuel 2006, 85, 1700–1707. [Google Scholar] [CrossRef]
  58. Tai, F.C.; Lee, S.C.; Wei, C.H.; Tyan, S.L. Correlation between ID/IG ratio from visible Raman spectra and sp2/sp3 ratio from XPS spectra of annealed hydrogenated DLC film. Mater. Trans. 2006, 47, 1847–1852. [Google Scholar] [CrossRef] [Green Version]
  59. Wang, X.L.; Wang, S.Q.; Hao, C.; Zhao, Y.G.; Song, X.X. Quantifying orientation and curvature in HRTEM lattice fringe micrographs of naturally thermally altered coals: New insights from a structural evolution perspective. Fuel 2022, 309, 122180. [Google Scholar] [CrossRef]
  60. Wang, J.; Morishita, K.; Takarada, T. High-temperature interactions between coal char and mixtures of calcium oxide, quartz, and kaolinite. Energy Fuels 2001, 15, 1145–1152. [Google Scholar] [CrossRef]
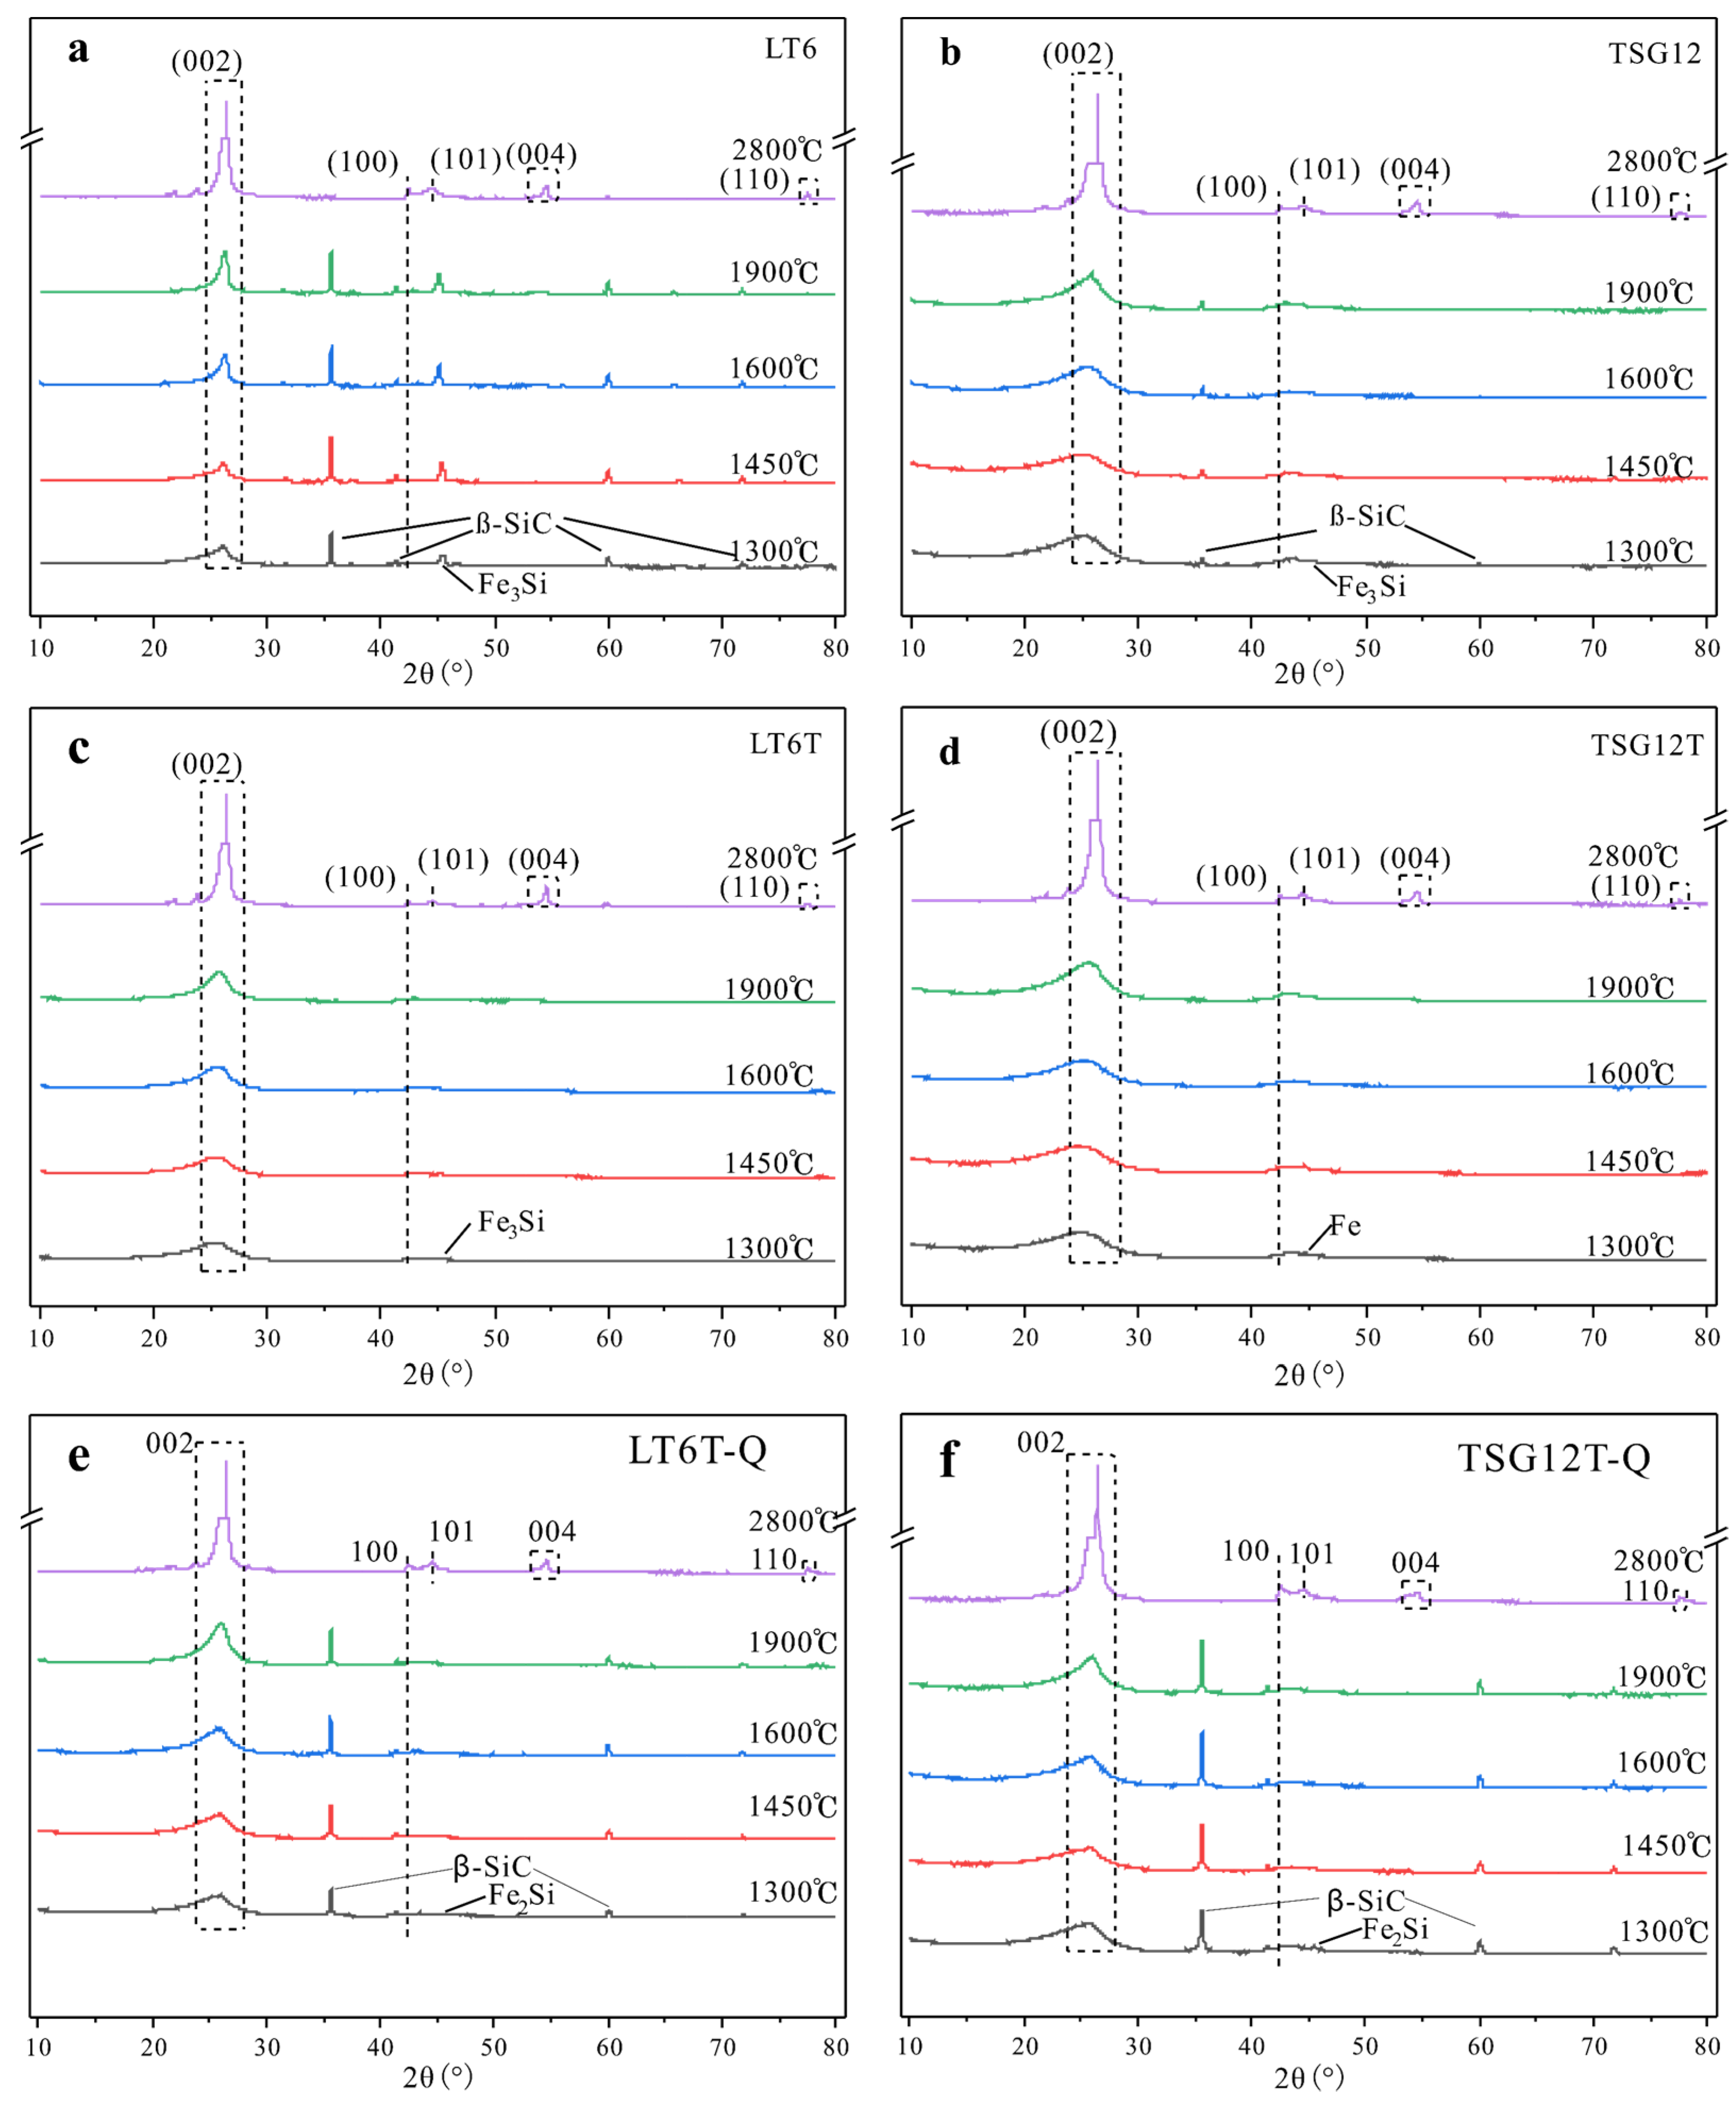
Figure 1. XRD patterns of samples at different temperatures. (a) LT6; (b) TSG12; (c) LT6T; (d) TSG12T; (e) LT6T-Q; (f) TSG12T-Q.
Minerals 13 00020 g001
Figure 2. Comparison of XRD structure parameters at different temperatures. d002: (a) LT6, LT6T, TSG12, and TSG12T; (b) LT6T, LT6T-Q, TSG12T, and TSG12T-Q; Lc: (c) LT6, LT6T, TSG12, and TSG12T; (d) LT6T, LT6T-Q, TSG12T, and TSG12T-Q; La: (e) LT6, LT6T, TSG12, and TSG12T; (f) LT6T, LT6T-Q, TSG12T and TSG12T-Q.
Minerals 13 00020 g002
Figure 3. Raman spectra of samples at different temperatures. (a) LT6; (b) LT6T; (c) TSG12; (d) TSG12T; (e) LT6T-Q; (f) TSG12T-Q.
Minerals 13 00020 g003
Figure 4. Comparison of Raman structure parameters at different temperatures. (a) LT6 and LT6T; (b) TSG12 and TSG12T; (c) LT6t and LT6T-Q; (d) TSG12T and TSG12T-Q.
Minerals 13 00020 g004
Figure 5. SEM and EDS analysis of raw coal and demineralized coal. LT6: (a,b) 1300 °C, (i,j) 1900 °C, and (q,r) 2800 °C; LT6T: (c,d) 1300 °C, (k,l) 1900 °C, and (s,t) 2800 °C; TSG12: (e,f) 1300 °C, (m,n) 1900 °C, and (u,v) 2800 °C; TSG12T: (g,h) 1300 °C, (o,p) 1900 °C, and (w,x) 2800 °C.
Minerals 13 00020 g005
Figure 6. SEM and EDS analysis of coal samples with quartz added. LT6T-Q: (a,b) 1300 °C, (e,f) 1900 °C, and (i,j) 2800 °C; TSG12T-Q: (c,d) 1300 °C, (g,h) 1900 °C, and (k,l) 2800 °C.
Minerals 13 00020 g006
Table 1. Basic parameters of coal sample.
SampleRoProximate Analysis (%)Ultimate Analysis (wt.%, daf)
MadAdVdafCHO *NS
LT5.673.6419.764.9694.901.182.790.560.56
TSG1.022.3718.2332.0883.653.9110.930.900.60
M: moisture; A: ash; V: volatile; ad: air dry; d: dry; daf: dry ash free; C: carbon; H: hydrogen; O: oxygen; N: nitrogen; St: total sulfur. * By difference.
Table 2. Chemical shifts and assignment of Raman spectrum of coal [45,46,48,49,57].
TypeShift/cm−1Assignment
D11350The ring breathing vibration in the graphite subunit or polycyclic aromatic hydrocarbon compounds (PAHs) or to aromatics with 6 or more rings
D21620Disordered graphite lattice
D31500Caromatic-Calkyl aromatic (aliphatic) ethers, C-C on hydro-aromatic rings, C-C on aliphatic structures or olefin-like structures
D41200Caromatic-Calkyl; aromatic (aliphatic) ethers; C-C on hydro-aromatic rings; hexagonal diamond carbon sp3; C-H on aromatic rings
G1580The aromatic ring breathing in the graphene sheets, aromatic ring quadrant breathing, alkene C=C
2D12560Overtone of the D1 band, C-C between aromatic rings, large aromatic rings system
D1+G2860Combination of D1 band and G band, large aromatic rings system
2G3180Overtone of the G band, the ring breathing vibration
Disclaimer/Publisher’s Note: The statements, opinions and data contained in all publications are solely those of the individual author(s) and contributor(s) and not of MDPI and/or the editor(s). MDPI and/or the editor(s) disclaim responsibility for any injury to people or property resulting from any ideas, methods, instructions or products referred to in the content.