Article

Application of Attainable Region Technique to Optimize Copper Slag’s Desired Size Class

by
Tlotlo Solomon Gabasiane
1,*,
Gwiranai Danha
1,
Tirivaviri Mamvura
1,
Tebogo Mashifana
2 and
Vusumuzi Sibanda
3
1
Department of Chemicals, Materials & Metallurgical Engineering, Botswana International University of Science and Technology, Private Bag 6, Palapye 10071, Botswana
2
Department of Chemical Engineering, School of Mining, Metallurgy and Chemical Engineering, University of Johannesburg, P.O. Box 17011, Doornfontein 2088, South Africa
3
School of Chemical & Metallurgical Engineering, University of Witwatersrand, Private Bag 3, Wits, Johannesburg 2050, South Africa
*
Author to whom correspondence should be addressed.
Minerals 2023, 13(1), 19; https://doi.org/10.3390/min13010019
Submission received: 21 September 2022 / Revised: 6 December 2022 / Accepted: 12 December 2022 / Published: 23 December 2022

Abstract

:
Copper slag is a hard material produced from smelting copper-bearing ores. Over the years, research has prioritized utilizing slag as a secondary source of base metals. This paper focuses on the grinding/milling of copper slag collected from the BCL Mine in Botswana to obtain a maximum amount of material in the desired size class with minimal energy consumption. This will then be followed by an integrated flotation and leaching approach of the desired size class material to recover copper. Our objectives are to determine the grinding time, ball loading, mill filling and desired size class for maximum recovery of copper mineral. The attainable region technique is an equipment-independent optimization tool employed here to determine the optimal specifications of our experimentally manipulated variables to satisfy the set objective function.

1. Introduction

The economy of Botswana over the years to date has been influenced by the mining and metallurgy industry. Table 1 shows evidence of the relative contribution made by minerals to the country’s Gross Domestic Product (GDP). For a country so heavily reliant on the export of minerals, the general depletion of high-grade ores due to their exploitation over time is a cause for concern [1,2,3]. The country has also endured challenges brought by the closure of some of its copper-nickel mines due to the ore grade falling below the economic level of exploitation coupled with old convectional mining and processing techniques employed at the time. Bamangwato Concession Limited (BCL), Tati Nickel and Discovery metals are some of the big mines that ceased operations, as earlier alluded to. The socio-economic hardships associated with their closures ranged from turning their mining locations into ghost towns, thousands of people losing their jobs and businesses supported by those mines closing, to as far as the country, in general, losing millions in revenue due to a decrease in mineral exports. These challenges have prompted the government to invest in mineral processing research to exploit secondary sources of minerals to keep up with the local, regional and global demand for mineral resources and hence generate third-stream sources of revenue [4].
Copper slag is a waste product that is obtained from an electric arc furnace in the process of converting copper concentrate into a matte. This slag is disposed of by way of stockpiling within the concession space. Since the mine started its operations in 1956, over 22 million tons of copper slag has been stockpiled at BCL, awaiting technological developments.

1.1. Flotation

Flotation is a physical separation technique that is used to separate minerals (mostly sulphide ores) from gangue, based on the ability to form bubbles that selectively attach to a specific mineral surface in water/slurry. The particles adhered to the bubble are then carried to the surface and scraped off while the unwanted material remains in the slurry phase. Froth flotation depends on several operational parameters for efficient separation of the desired mineral. Some of these parameters include feed rate, particle size, mineralogy, pulp density and temperature. This paper focuses on specifying optimal conditions to employ in maximizing the desired particle size for flotation. Previous researchers who have studied flotation of copper bearing ores and different metallurgical slags have suggested that the best particle size for flotation is −106 µm +45 µm [6,7].

1.2. Leaching

Leaching is one of the most ancient separating techniques which involves separating a material (solute) from a solid sample by dissolving it in a liquid phase. The main factors that influence leaching include particle size, solvent (lixiviant), temperature and stirring of the fluid medium. Numerous researchers ([6,8]) have studied and investigated leaching of copper slag with the view of recovering cobalt, copper and other metals in sulphate, chloride, sulphuric acid, ferric sulphate, ammonia and other lixiviant mediums. Particle size has a major part in establishing the leaching efficiency and yield enhance vital in maximizing the best particle size for leaching copper slag. Several researchers used a range from −75 µm to −45 µm [9,10,11,12].
The main aim in this research was to apply the attainable region (A.R.) theory to determine an optimal particle size class that can be used for an integrated leaching and flotation approach to recover copper from BCL slag [13]. Size reduction to liberate values in the slag was carried out before classifying the product particle size distribution (PSD) into different size classes. The PSD analysis data was then used in the application of the attainable region technique considering the range of possible size classes for flotation and leaching processes. Khanzandi and Bechood [14] and Wang et al. [15] mentioned that slags all over the world generally have similar properties and only differ due to the type of process they had been exposed to; hence BCL slag has its own unique set of properties. This motivated an investigation to determine the optimum particle size class that will satisfy the aim of this paper.

1.3. Attainable Region (A.R.) Method

The A.R. is a distinctive tool that is presented primarily in reactor classifications to enhance chemical reactor links around irregular kinetics. The technique was developed to use a collection of values for all the output variables that can be attained by some conceivable stable state process using a given feed [16]. The A.R. technique is then used by applying the output variables to describe a probable geometric space where the attainable points can be established. The A.R. technique is used for optimization, and it is dependent on the study of graphical plots to be able to ascertain the optimal value being studied. The method uses raw data from experiments that initially need to be illustrated in a specific manner and is not dependent on any mathematical models. A mill can also be considered essentially as a reactor system [11] as the larger feed material is transformed into smaller product material, which makes it possible to successfully apply the A.R. technique in comminution. Different parameters such as residence time, ball quantity distribution, density of sample (slurry) and mill speed have been investigated using different ores. Due to progress made by using the A.R. technique in the metallurgical sector, this current investigation adds significant value to the pre-existing growing body of knowledge on the A.R. technique. The present article also presents new information to the field, as the A.R. technique is studied to optimize comminution of copper slag, as no work has been undertaken using copper slag with the aim to recover iron and copper from material with a specific particle size. Minor research has used A.R. with respect to discovering ways to decrease the experimental time required to attain a precise outcome. Any effort in reducing this knowledge gap would be a vital accomplishment with respect to the progress of the A.R. method [12].
Comminution is acknowledged to be an energy-intensive process due to the vast amount of power necessary to break down large material to finer material. This makes it very important to monitor the breakage process to avoid overgrinding which may result in wastage of energy and also affect the recovery process which requires a specific particle size. Previous researchers have found this vital in considering a specific ball loading; it is detrimental to either overfill or underfill the mill volume with the feed sample. Both circumstances have negative results with underfilling resulting in wasting energy due to the balls participating more frequently in ball-to-ball surface collisions rather than ball-to-sample material impact which is preferred, while overfilling the feed usually tends to crush the ball to powder, hence reducing ball-to-feed impact, which reduces breakage of material.
In this manuscript the ball-loading parameter is systematically varied while other comminution parameters such as residence time and mill speed are kept constant, before being systematically varied as well. The main objective was to determine the optimal set of parameters which will maximize the amount of material in the desired intermediate size class. Use of the A.R. technique requires that when investigating one parameter, other parameters are kept constant to gain an understanding of how to optimize the parameter being investigated [12].
Since 1964, the A.R. technique has been used to solve various problems associated with optimizing targeted parameters. Given the kinetics and inputs of a system, the technique has been employed to determine all the possible outputs [17,18,19]. These possible outputs were then called the A.R. [20]. The first step in the application of the A.R. technique is to choose a process to assess, such as leaching, flotation or dense medium separation. This paper focuses on the size reduction of a BCL copper slag to specify an optimum particle size class required for maximum recovery of values through an integrated leaching and flotation approach. The second step is to specify the objective function. In our case, this would be to maximize the amount of sample in the preferred size class. The third step was to identify the state variables which influence the main objective purpose, and in this investigation, this includes milling time, milling speed and the quantity of grinding media balls charged. The A.R. technique would then be employed to specify the optimum individual state variables that would result in the attainment of the objective function.
Liberation is a critical aspect of the mineral processing industry and is considered under the milling bracket. It can be foreseen as a rate process where different size classes are liberated (broken down) from large particles to smaller sizes. The A.R. technique has been employed in comminution as it has the advantage of being able to illustrate and define the behavior of diverse size classes during the liberation process. It can embody particle size distribution as a solitary idea in planetary ball mills. This analogy will allow the combination of the points to be employed for the process description and the discovery of the optimal parameter(s) or purpose [17].
In this study, the aim was to find the optimal parameters to be used to achieve the desired size class for later operations (flotation and leaching). The A.R. technique was carried out and analyzed using plots by concentrating on the indispensable features of the liberation process.
These may include grinding time, mass fraction, number of grinding media balls and grinding speed. A variety of size classes can be considered, but with the specification of this study, only three were chosen to be used and these were visualized as the following:
(a)
T1 is the feed size which is collected as the coarse size class
(b)
T2 is the middle size class, which is created by intermediate breakage
(c)
T3 is the undersize or fines class, which is created by relatively intensive breakage
A typical example of an A.R. analysis plot can be seen in Figure 1. A plot was compiled illustrating fraction of mass against the number of drops. The figure shows different size classes, M1 CB, M2 CB and M3 CB, and these are compared. Each point from the plot is different due to the amount of mill operation differing amongst each of the points [18,19].
The notable advantage of the A.R. technique over other optimization methods lies in that this approach is equipment independent and model free. It applies a black-box theory to a system and focuses only on the input and outputs. Table 2 outlines some reviews on the application of the A.R. technique in mineral processing and Table 3 shows alternative ways for analyzing particle size classes.

2. Materials and Methods

2.1. Material

The feed material (−850 µm) was collected from the BCL mine, located in the southeastern region of Botswana. The grab sampling technique was employed in collecting the feed material. This was done to obtain a representative sample from the different heaps of slag. During the mining operation, different smelter operating conditions were employed due to the changing shift system and varying weather conditions within a year. These variations resulted in slag with varying properties being dumped, hence our application of the grab sampling method to collect a more representative and homogenized sample.

Sample Preparation

The sample collected from the BCL mine was stored in 50 kg polyethene bags, kept in a vertical position. Due to agitation during travelling, it was observed that the material had stratified on arrival at the University. To rectify this, the collected sample was poured onto a plastic canvas into a cone shape, which was later flattened and divided into four quarters using shovels per the cone and quartering technique. The quarters opposite each other were then discarded, and the remaining two were mixed together into a new cone shape. The procedure was repeated several times to reduce the size of the collected sample homogeneously. A riffle splitter was then employed to produce 600 g samples of the slag which were used in the next phase of the experimental program.

2.2. Methods

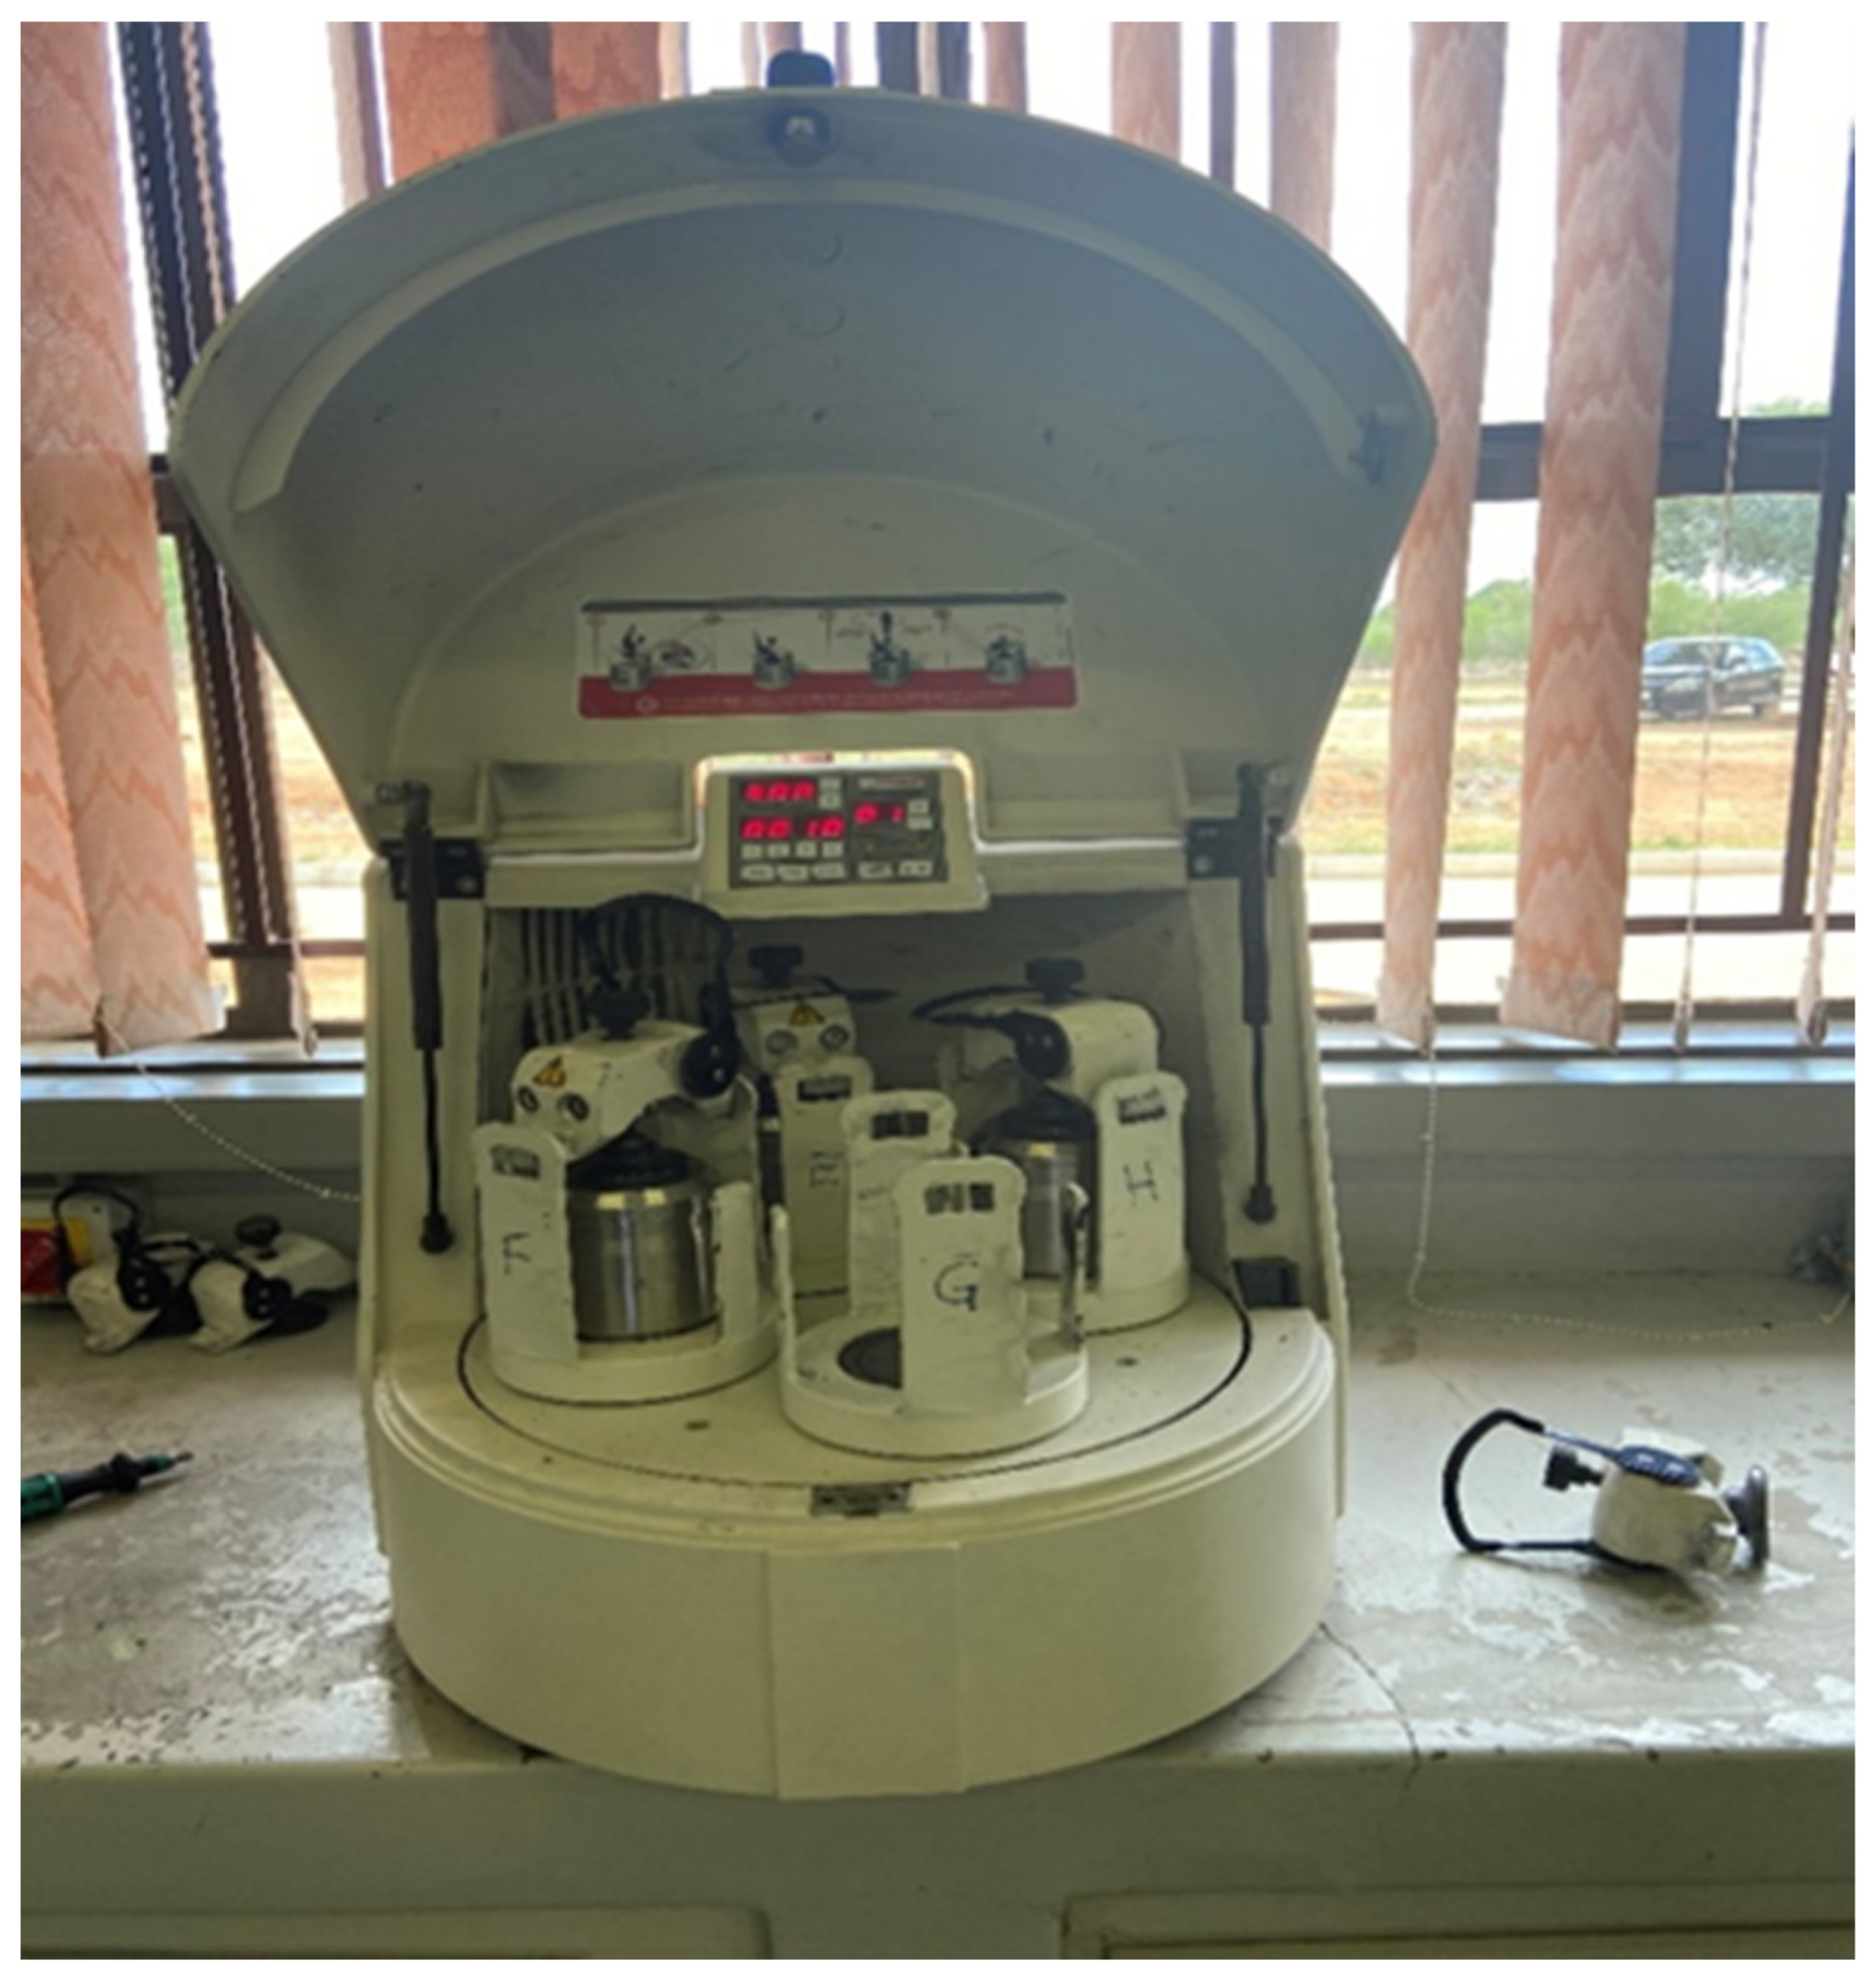
Milling tests were carried out in a 58 by 67 by 57 cm planetary ball mill (Figure 2) fitted with a 5/4 classic line, four grinding bowls and a variable speed ranging between 50 and 400 rpm. The mill, grinding balls and bowls were cleaned before each experimental run to avoid contamination. The mill was then batch fed with material which was kept constant at 600 g, grinding time was varied between 5, 10, 15, 20, 25 and 30 min, and mill speed was varied between 100, 200, 250, 300 and 350 RPM. The number of grinding balls was also varied between 5, 7, 9 and 11, with each grinding ball weighing ~9.73 g. The mass used in the experimental phases was constant at (500 g). Each experimental parameter was systematically varied while others were kept constant, as shown in Table 4. This procedure was repeated for each grinding duration, and the product material was transferred into a bowl.

2.2.1. Sieve Analysis

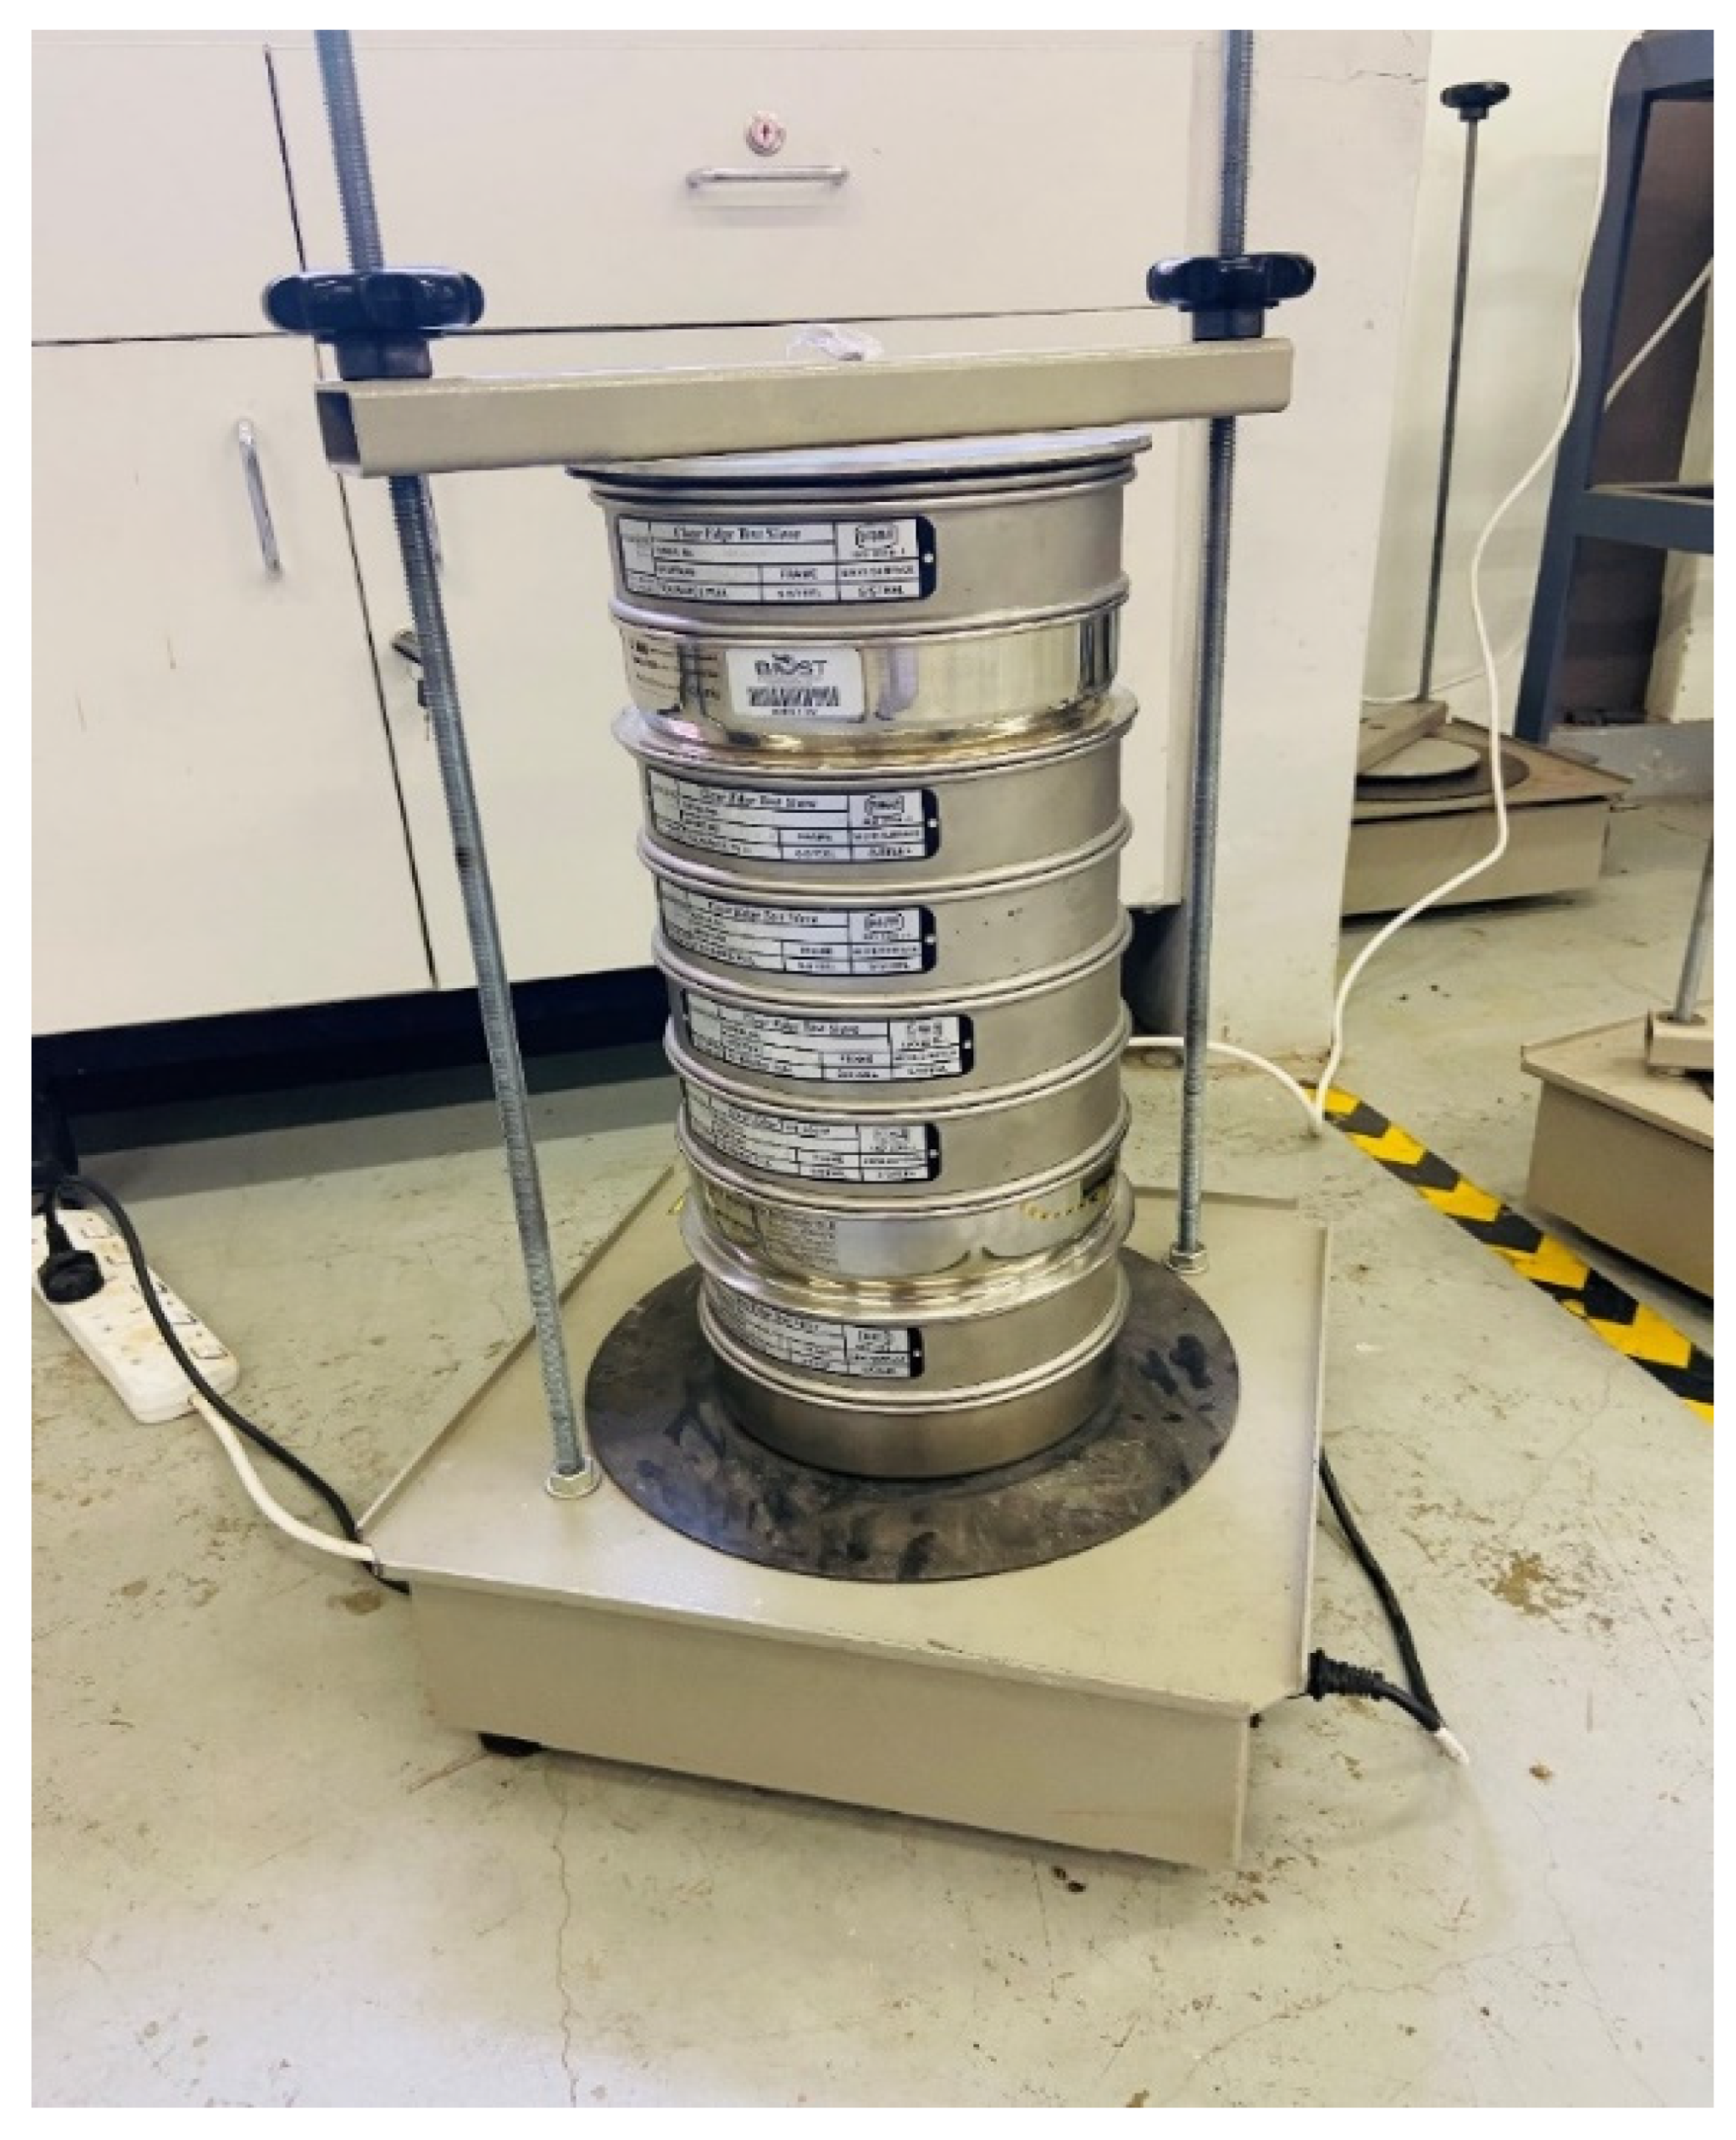
The product material from the bowl was then riffle split into 250 g samples that were then analyzed for PSD and classified using a stack of sieves arranged in a standard square root of two series, with the largest size being 850 µm and mounted on an electric sieve shaker set at 20 min, as shown in Figure 3.

2.2.2. A.R. Technique

Table 5 shows the selected size class specifications used by the A.R. technique. These selected A.R. size classes can vary depending on the intended use of the desired size class. The one we chose is intended for an integrated flotation and leaching recovery approach. Table 5 also shows the particle size class specifications for the copper slag.

3. Results and Discussions

Attainable Region (A.R.) Analysis

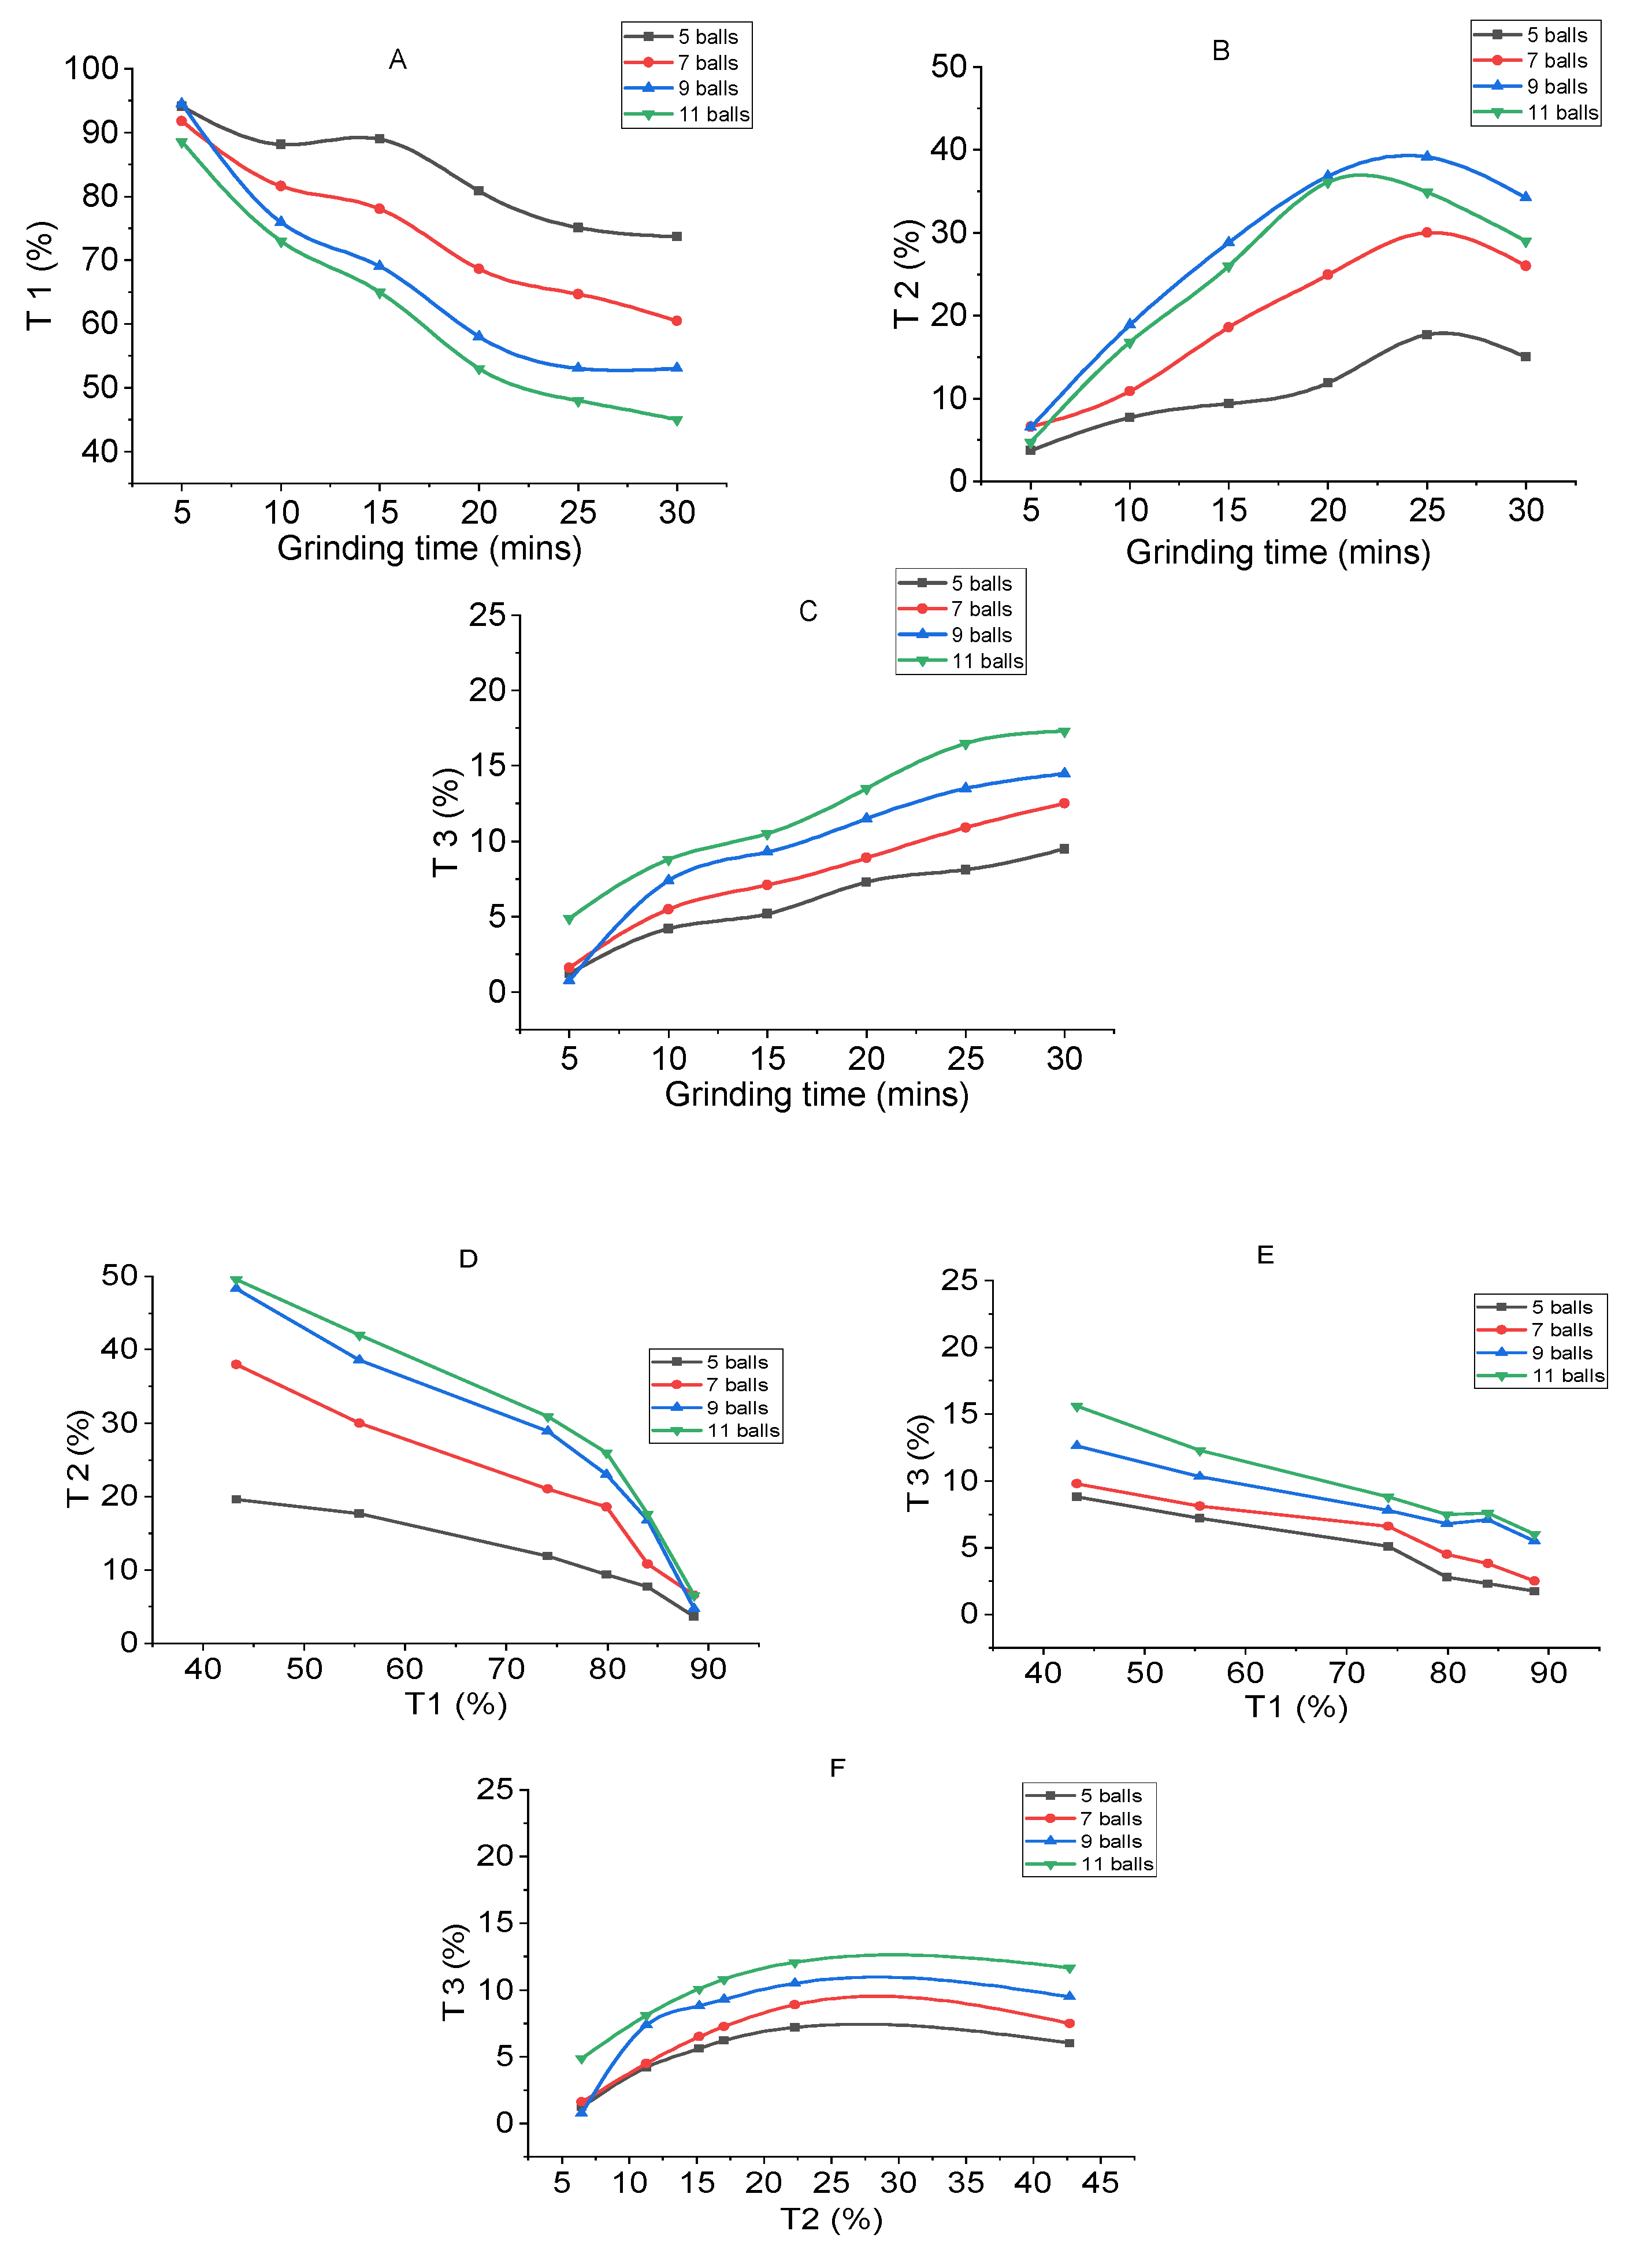
Figure 4A shows the A.R. graphical representations of the mass of material in the coarse size class (T1) vs. grinding time for a different number of grinding balls with the mill speed kept constant at 300 RPM. In line with the A.R. terminology, the manipulated variables are the grinding time and number of balls, while T1 is the state variable. The graphical space confined by the arc (graph line) with axis (y and x) defines an attainable area within the combinations of grinding time and T1. Figure 4A shows that with an increase in grinding time from 5 to 30 min, the mass of material in the coarse size class for all the different numbers of balls slowly reduced due to the particles breaking from this size class to T2 and T3 size classes. Equation (1) was used to calculate the graphs plotted and analyzed.
T i = wti   mass   of   material   in   specific   size   class wt total total   mass  
Figure 4B shows the A.R. graphical representations of the mass of material in the desired size class (T2) against grinding time for a different number of grinding balls with the mill speed kept constant at 300 RPM. Figure 4B shows that with the subsequent continuation of milling, the quantity of sample particles reporting to the T2 size class increases to an optimum and then declines, indicative of material breaking from this size class to the T3 size class. Figure 4B reveals that for a maximum desired size class to be obtained, there is an optimum grinding time and the number of balls that must be specified. If the objective function is to optimize the material in the T2 size class, we would want to mill between 20 and 25 min with a constant amount of grinding balls (9) with the same load of balls (9.73 g) and at a speed of 300 RPM. The A.R. technique helps engineers with this kind of specification and cost optimization by establishing optimum operating conditions, minimizing inputs such as milling time and number of grinding balls to use, and subsequently saving costs.
Figure 4C shows the A.R. graphical representation of the mass of material in the T3 class against grinding time for a different number of balls with the mill speed kept constant at 300 RPM. This figure reveals that, generally, there is a gradual build-up of mass in the fines size class with an increase in both grinding duration and the number of grinding media employed. This may be due to the fact that mass broken from both the coarse and desired size classes report to the fines size class.
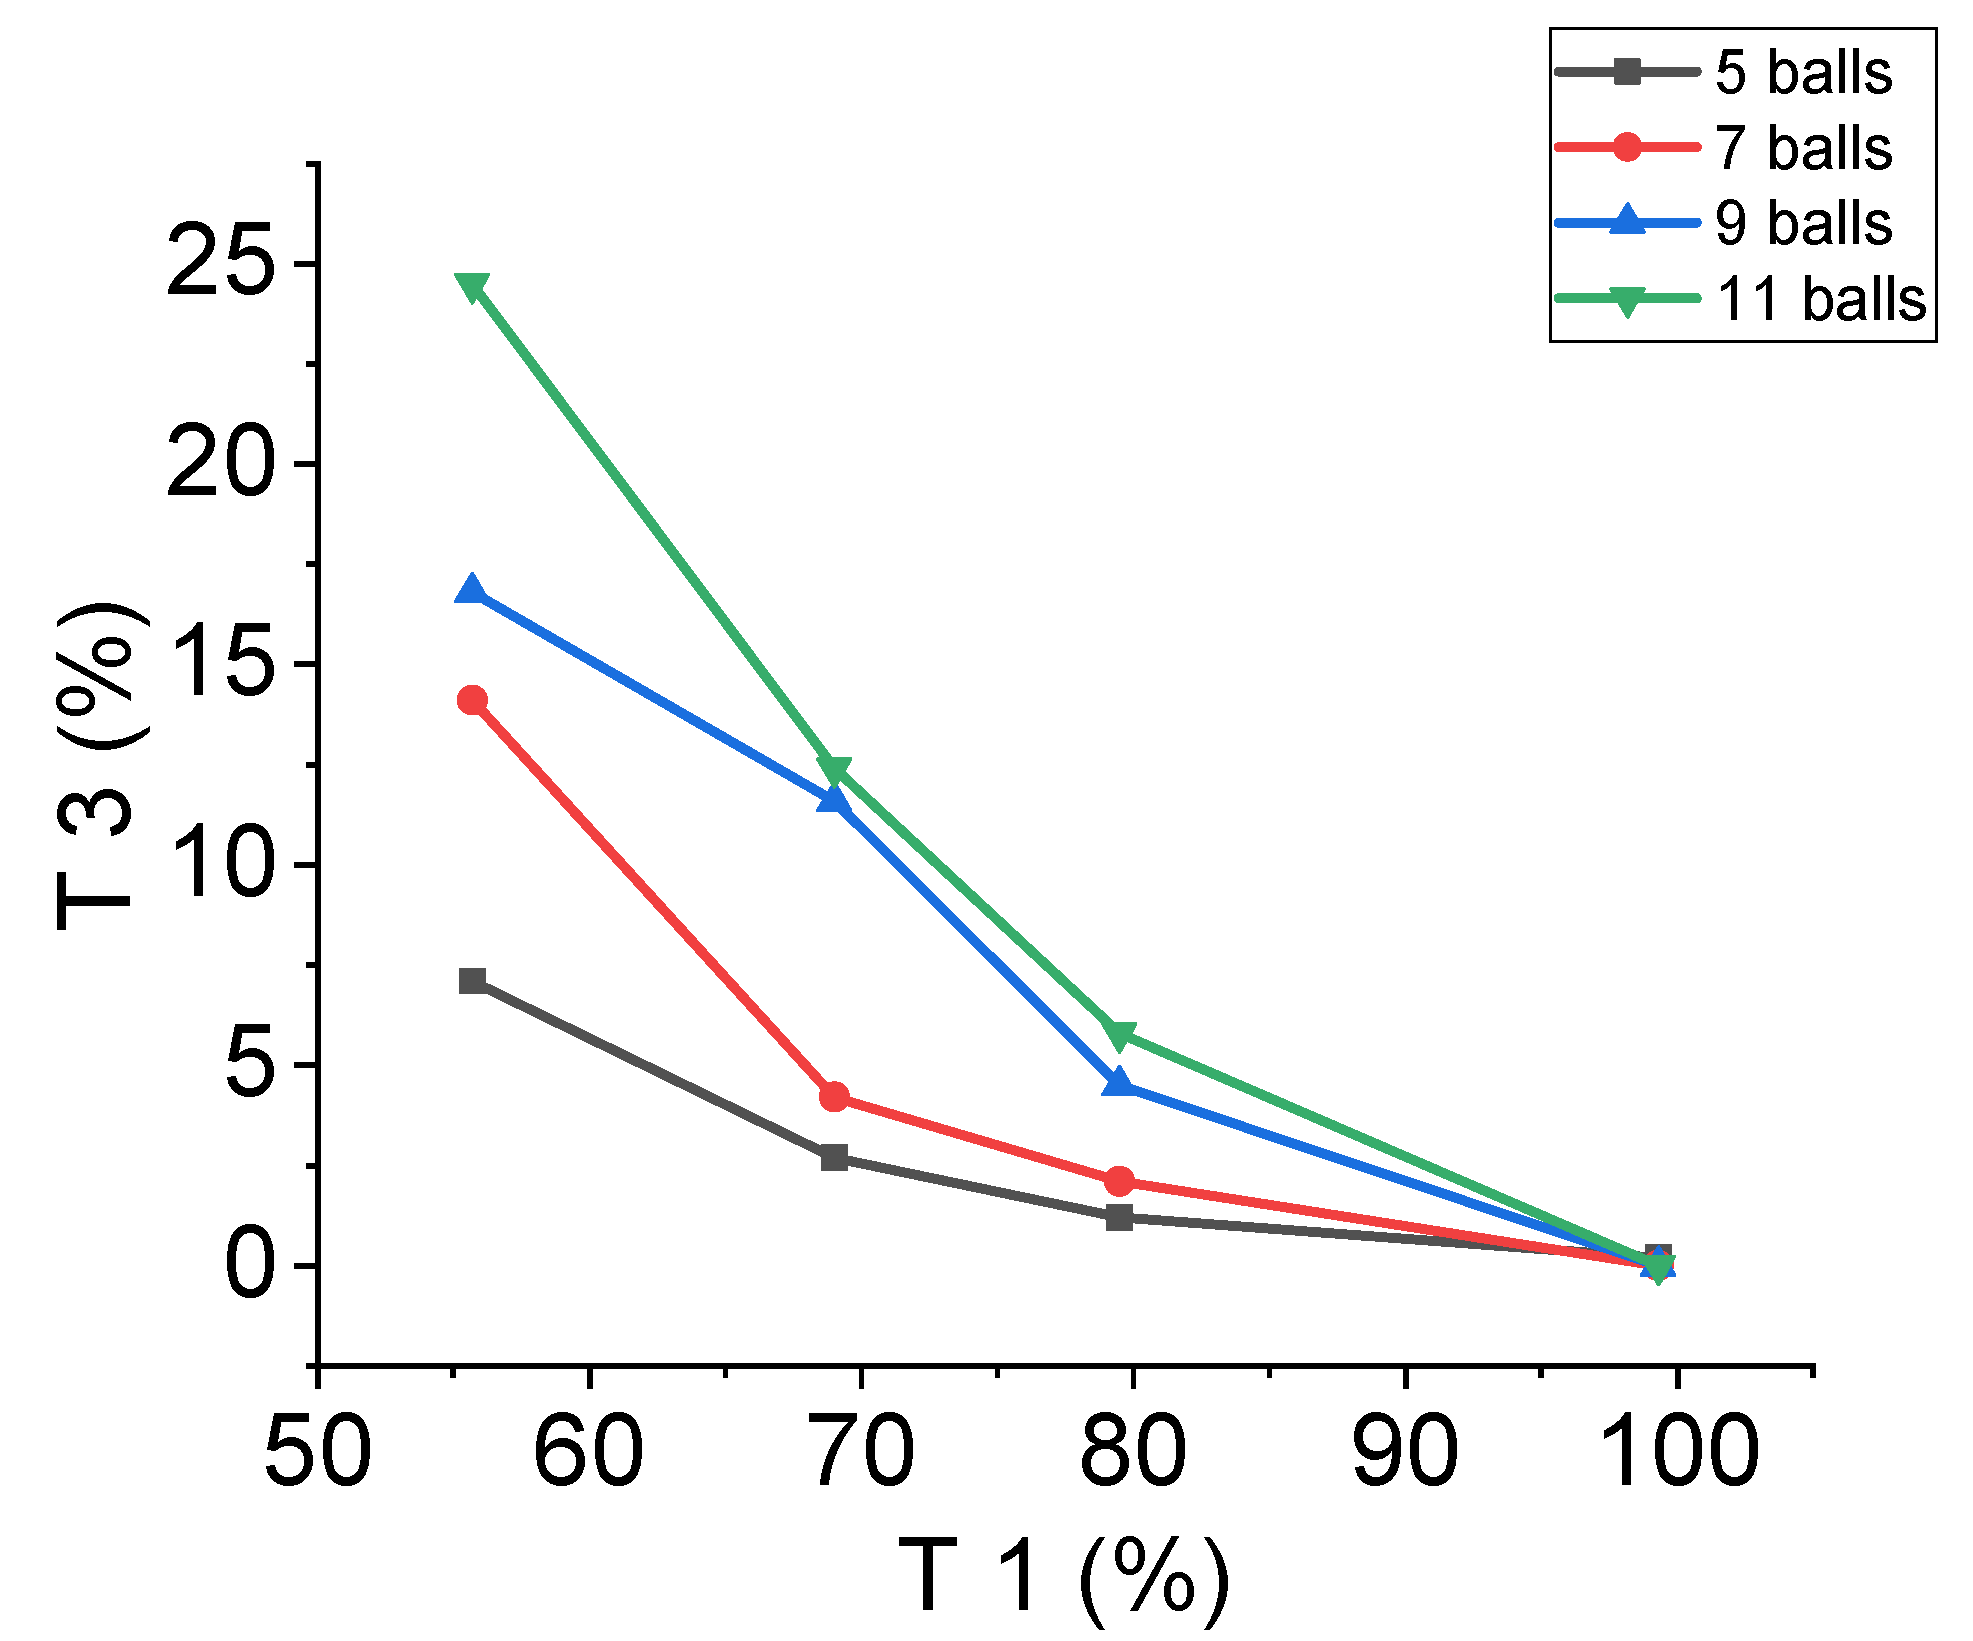
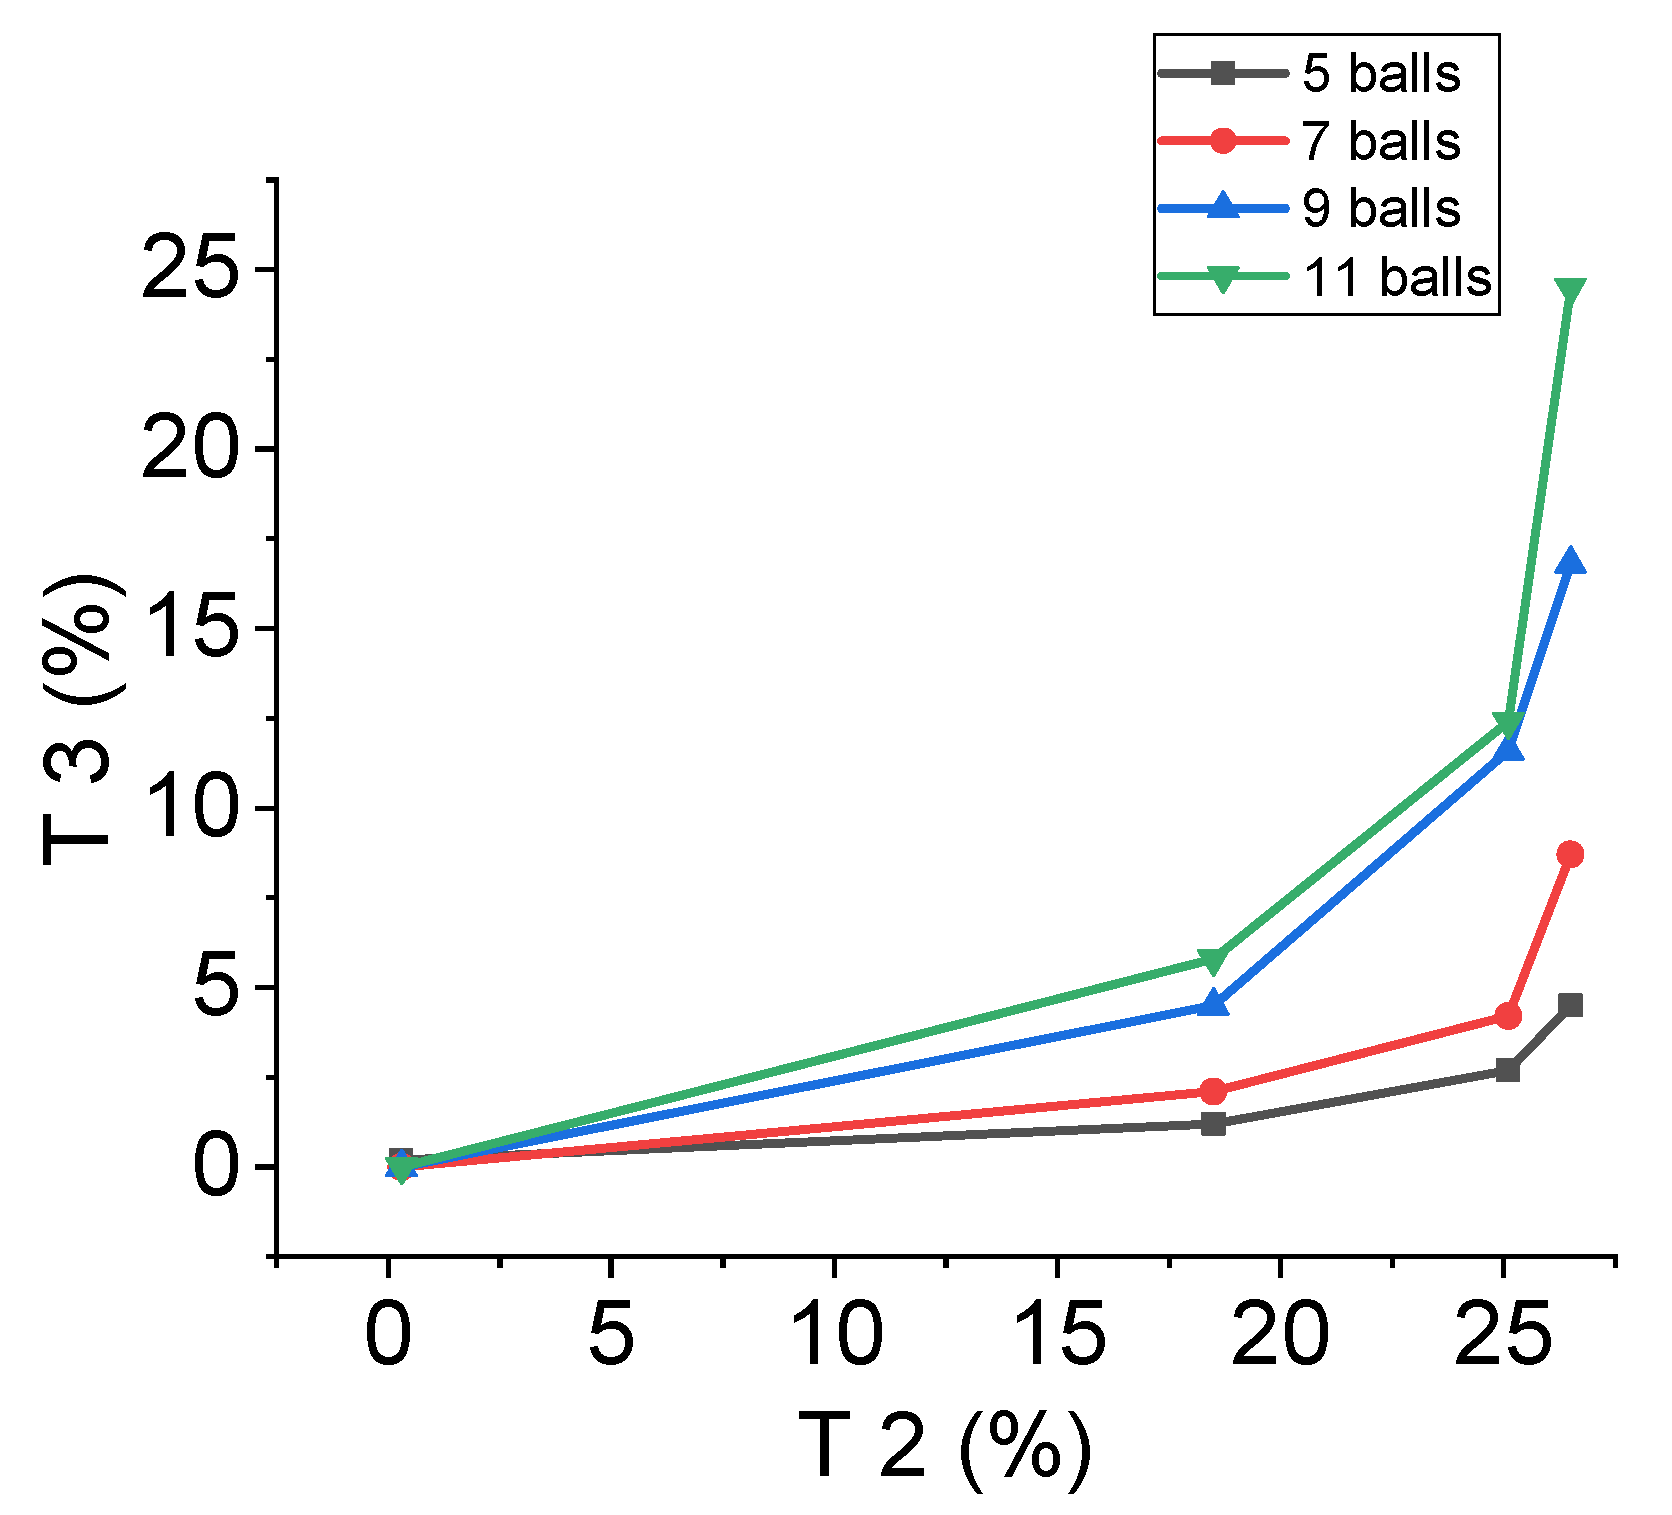
Figure 4D shows that with an increase in the number of grinding balls and an increase in milling time, the material is liberated and escapes from T1 to T3. At the same time, Figure 4E also indicates material liberated from T1 builds up material in T3 (fine material). Material T2 escaping into the T3 size class is shown in Figure 4F, with a build-up in T3 from T2.
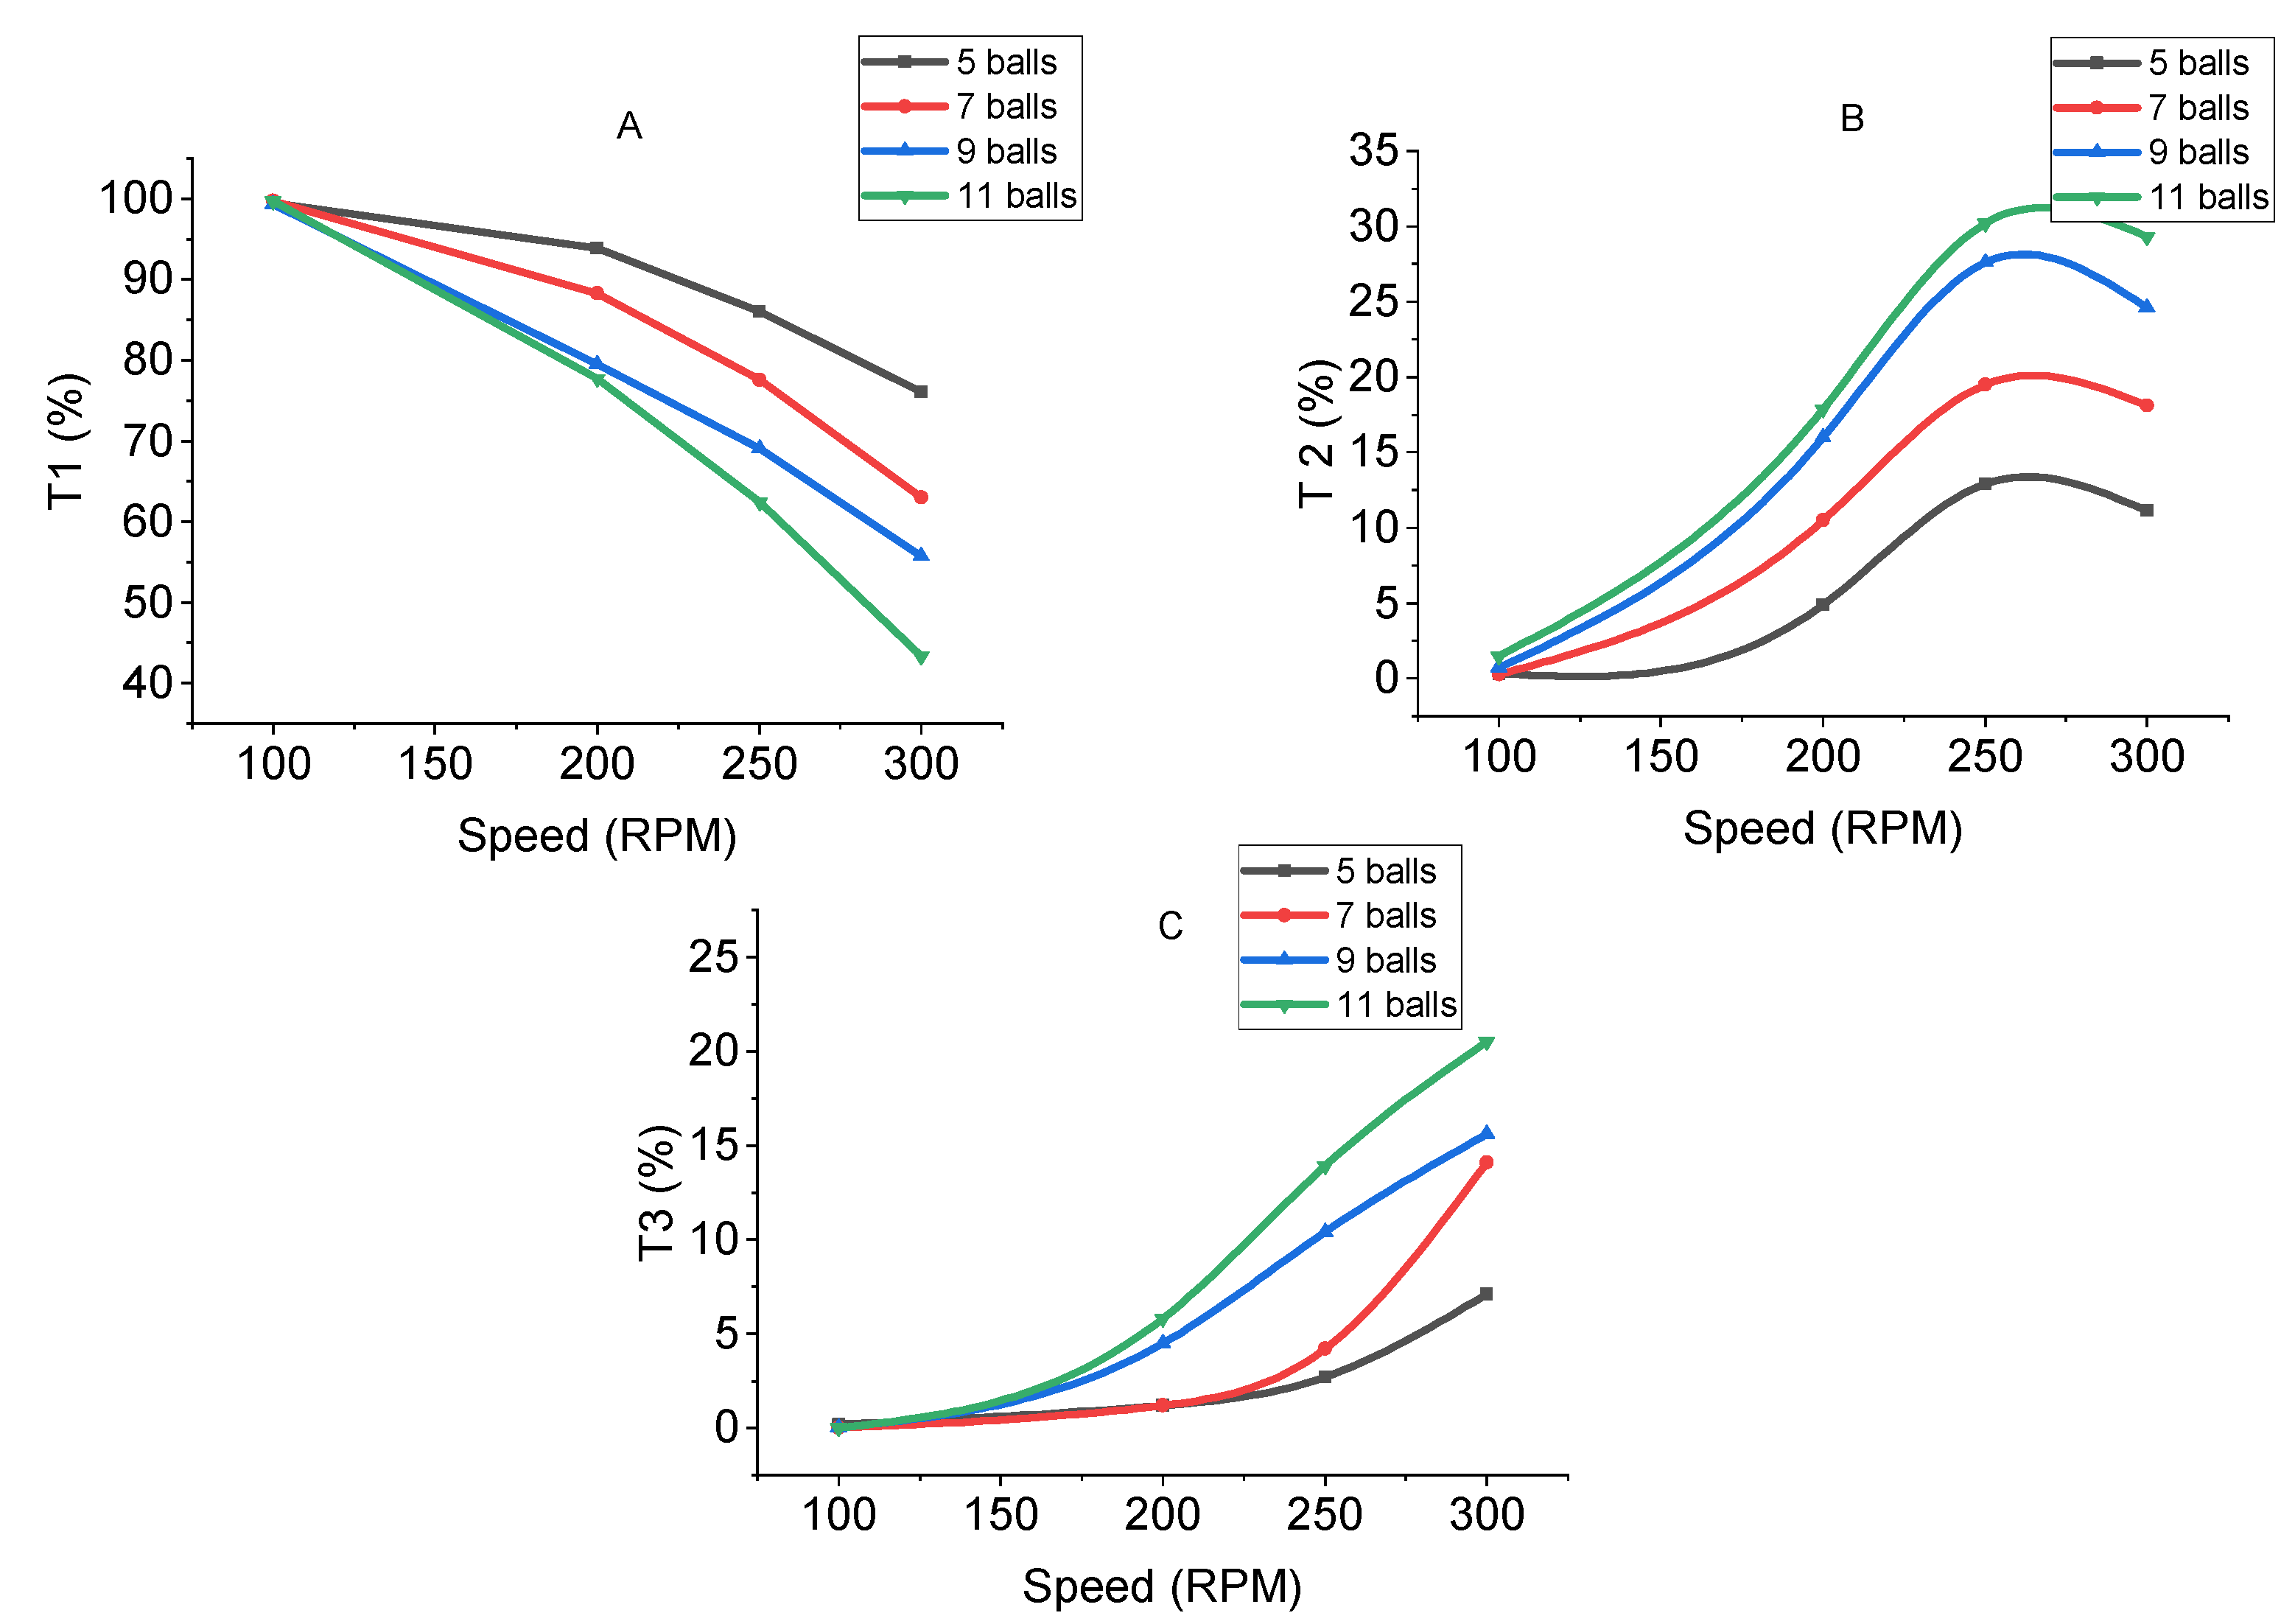
Figure 5A shows that with the increase in grinding speed from 100 to 300 RPM, the mass of material in the coarse size class for all the different numbers of balls is slowly reduced due to the particles breaking from this size class to T2 and T3 size classes. Figure 5B displays the A.R. graphical representations of the mass of material in the desired size class (T2) against milling speed for a different number of balls with the mill time kept constant at 25 min. Figure 5B shows that with the subsequent continuation of milling, the amount of sample particles reporting to the T2 size class increases to an optimum and then declines, indicative of material breaking from this size class to the T3 size class. Figure 5B reveals that for a maximum desired size class to be obtained, there is an optimum milling speed and number of balls that must be specified. If the objective function is to maximize the material in the T2 size class, we will need to mill between 250 and 300 RPM with a constant number of balls (9) and a milling time of 25 min. The A.R. technique helps engineers with this kind of specification and cost optimization by establishing optimum operating conditions, minimizing inputs such as milling time and number of balls to use, and subsequently saving costs.
Figure 5C shows the A.R. graphical representation of the mass of material in the T3 class against milling speed for different numbers of balls with the milling time kept constant at 25 min. This figure reveals that generally, there is a gradual build-up of mass in the fines size class with an increase in both grinding duration and the number of grinding media employed. This may be because mass broken from both the coarse and desired size classes reports to the fines size class due to the surface-to-ball contact enhancing breakage of material.
Figure 6 shows an A.R. graphical plot of T2 against T1 over different speed variations (100 to 300 RPM) and a constant grinding time of 25 min. From the plot, it can be deduced that an optimum amount of the desired T2 size class material was obtained using 9 grinding balls. As the number of balls employed in grinding increased from 5 to 9, there was a gradual rise to a maximum of T2, but a further increase of the number of balls to 11 resulted in a decrease of T2 as mass began to break faster from T2 to T3. The use of the A.R. technique, in this case, demonstrates how it can be employed to decide on the number of balls to use in the mill if the objective is to produce an optimum amount of material in the T2 size class.
Figure 7 shows the A.R. graphical representation of the mass of material in the T3 size class against T1 for different milling speeds and a different number of balls at a constant milling time of 25 min. The figure shows a gradual build-up of T3 resulting from material breaking from T1 associated with an increase in number of balls and milling speed. The greater the number of grinding balls, the better the chances of material particles being involved in ball-particle contacts, increasing the probability of breakage of the material from T1 directly into T3.
Figure 8 shows another A.R. graphical representation of T3 against T2 for different milling speeds and a different number of milling balls at a constant milling time of 25 min. The figure also shows that mass broken from T2 reports to T3, and the choice of grinding conditions such as the number of balls, milling duration and speed can be used to control the rate of breakage of this material and hence specify the desired conditions for a specific objective function.
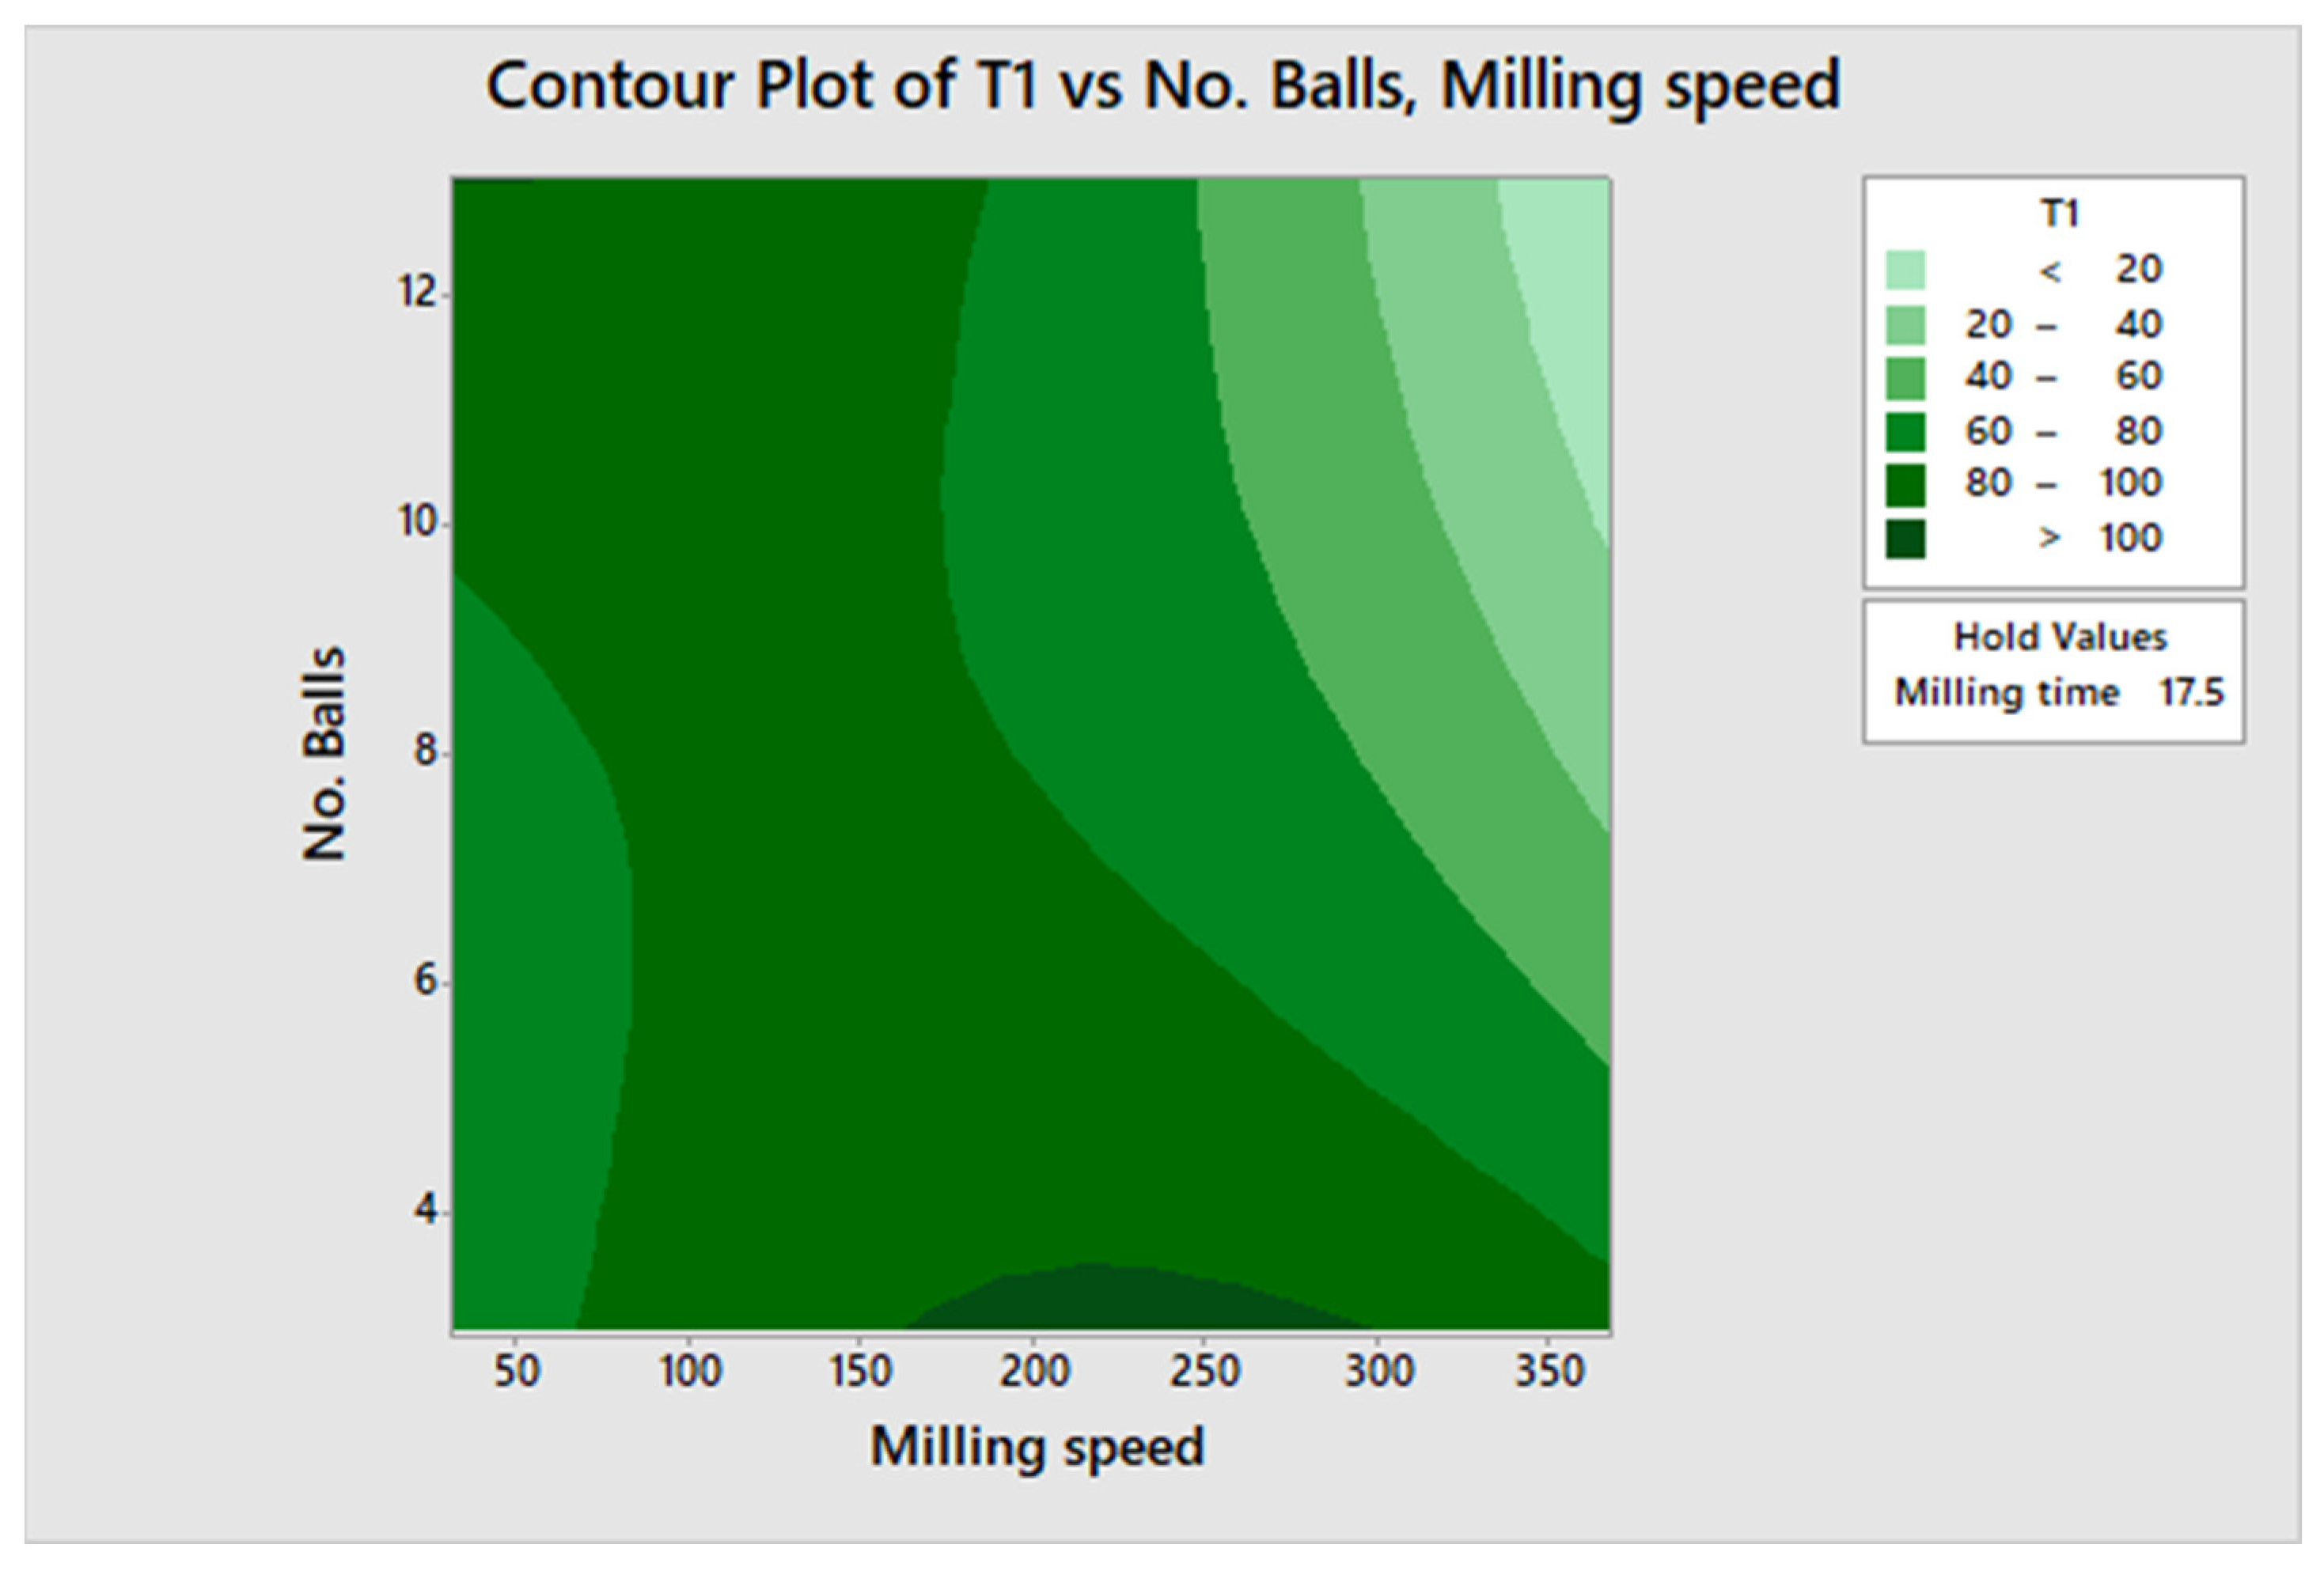
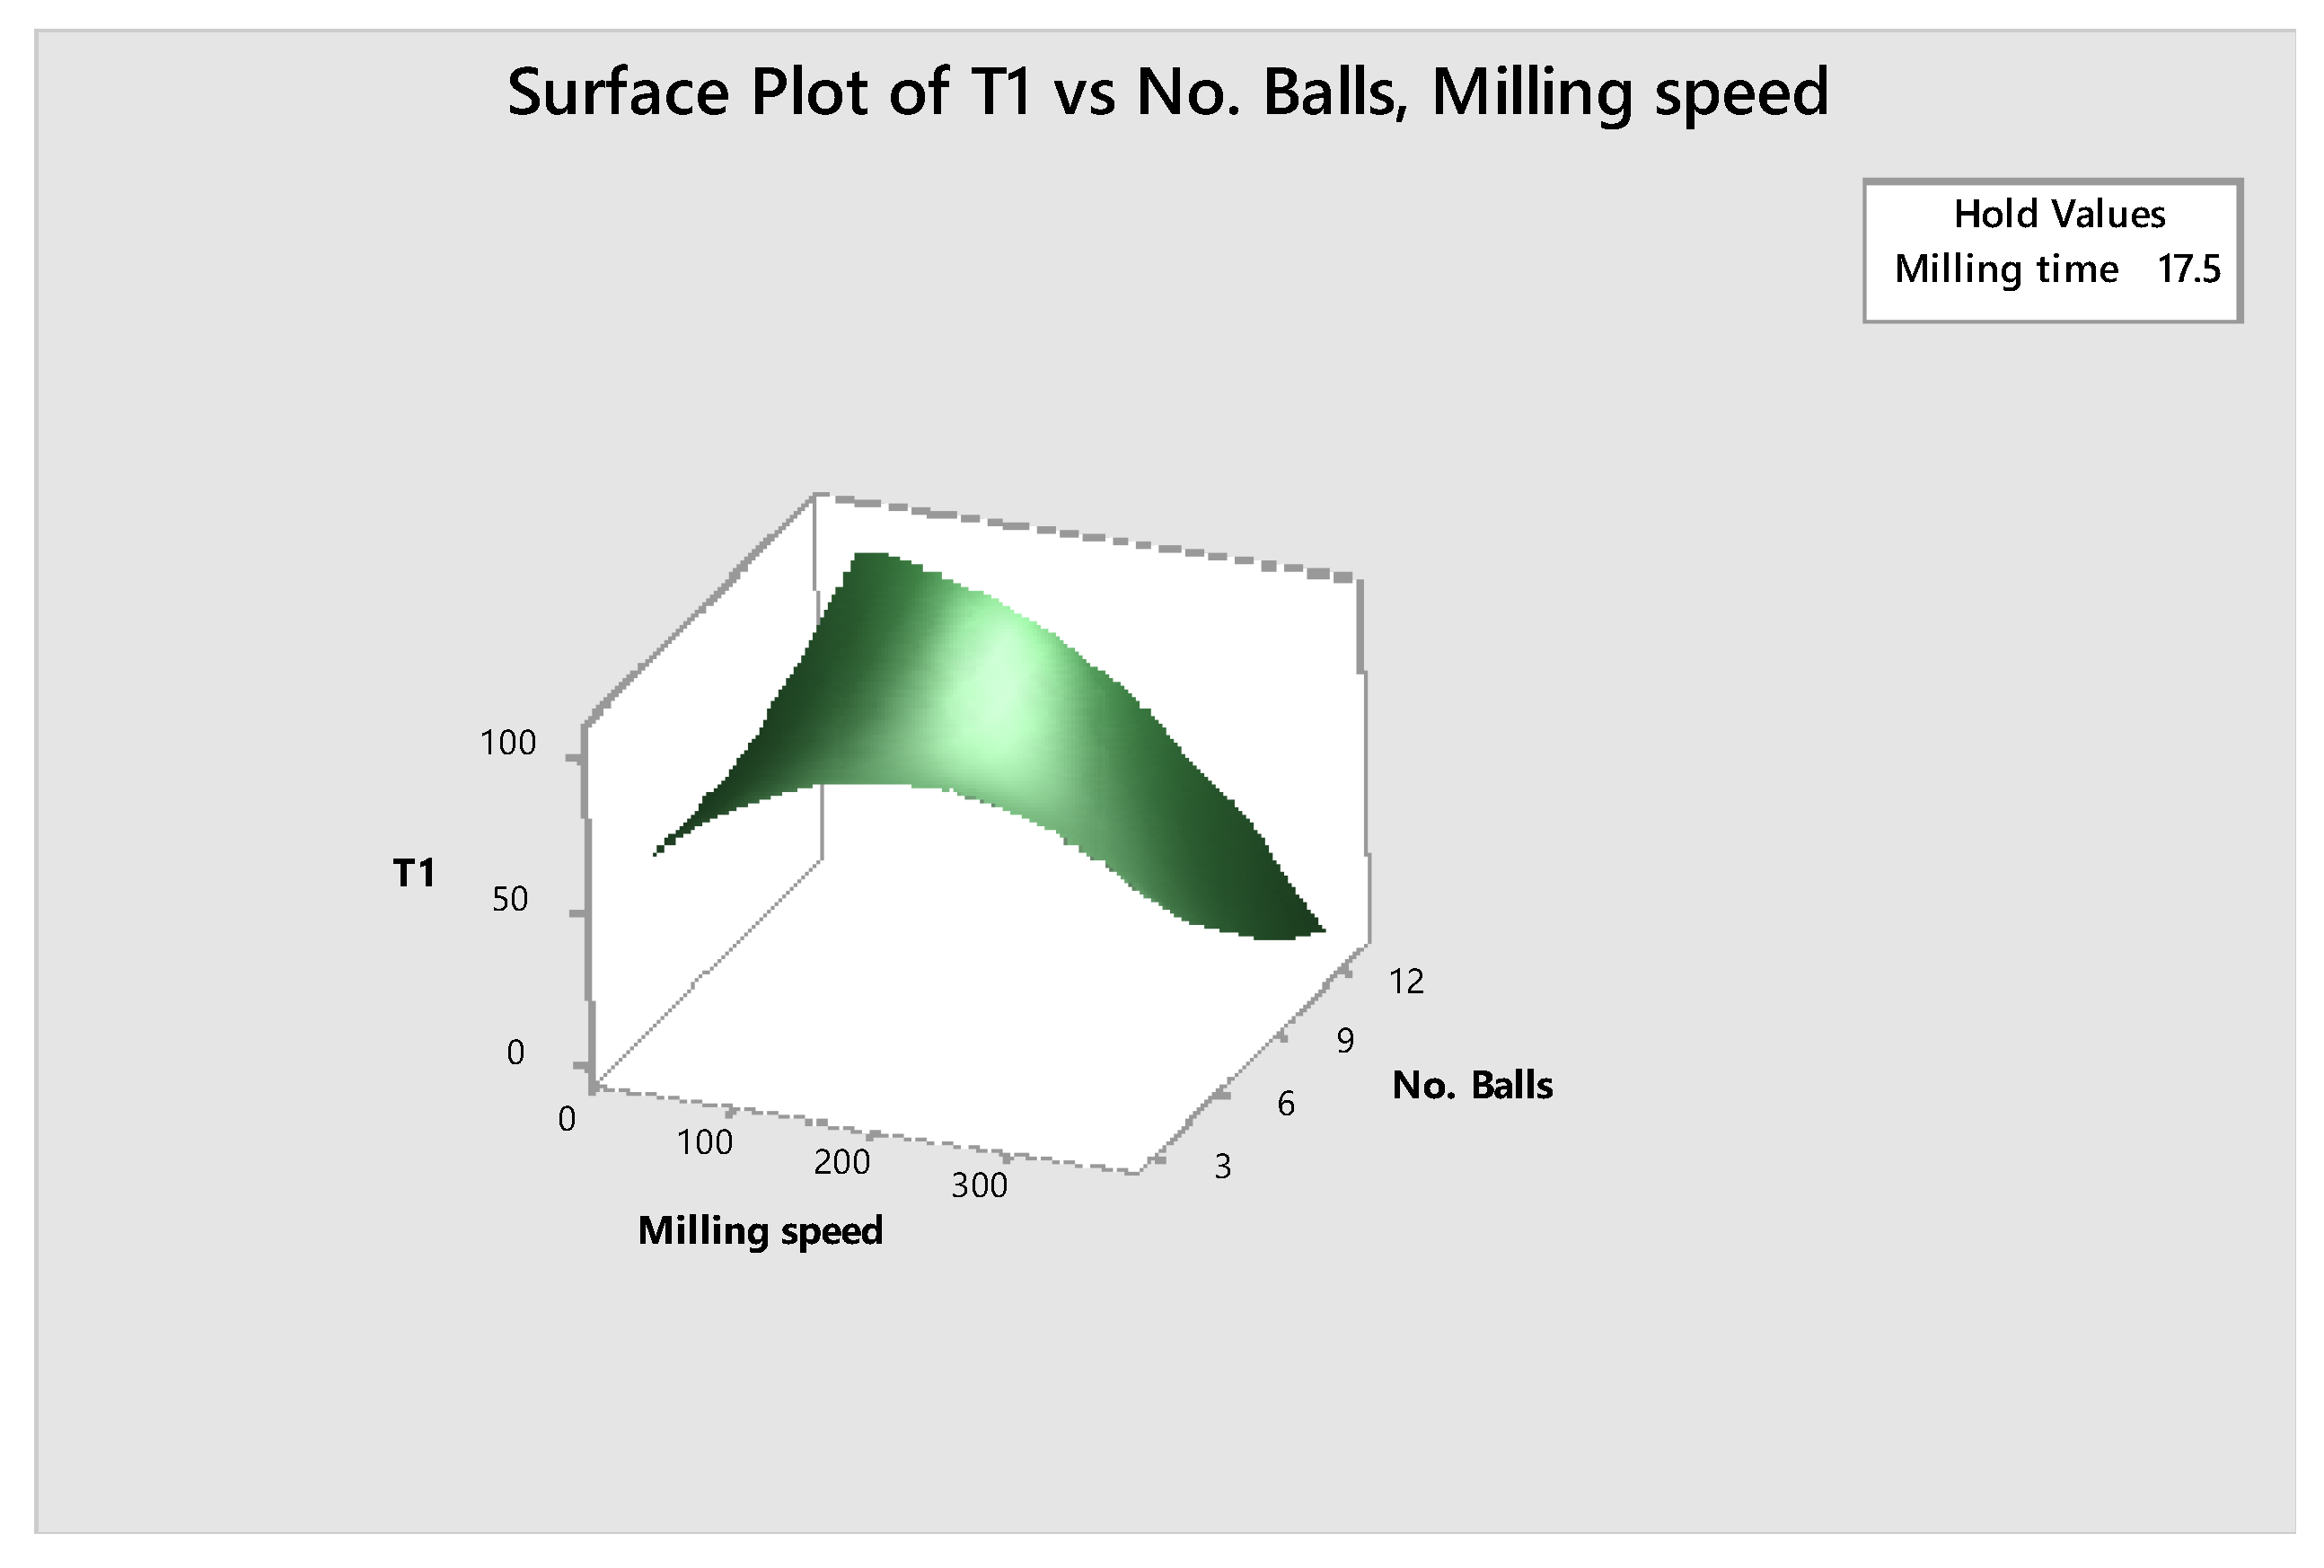
Figure 9 shows the response surface method graphical representation of the mass of material in the T1 class against milling speed for different numbers of balls with the milling time kept constant at 25 min. This figure supports the argument that there is a steady accumulation of mass in the fines size class with an increase between 11 and 9 balls, from 250–300 RPM in the contour graph for Figure 9. Figure 10 illustrates a 3D graphical representation of T1 vs. milling speed vs. no. of balls and confirms the build-up of mass in the T2 stream being ground from T1 maximized between 9 and 11 balls, and 250–300 RPM at 25 min.
Figure 10 shows a 3 – D plot, illustrating that breakage of fee material from T1 size classes escapes into T2 at its highest gradually with an increase of mill speed and increase of quantity of balls. Having a maximum 300 RPM and 9 balls having a significant breakage of material into size class T2.
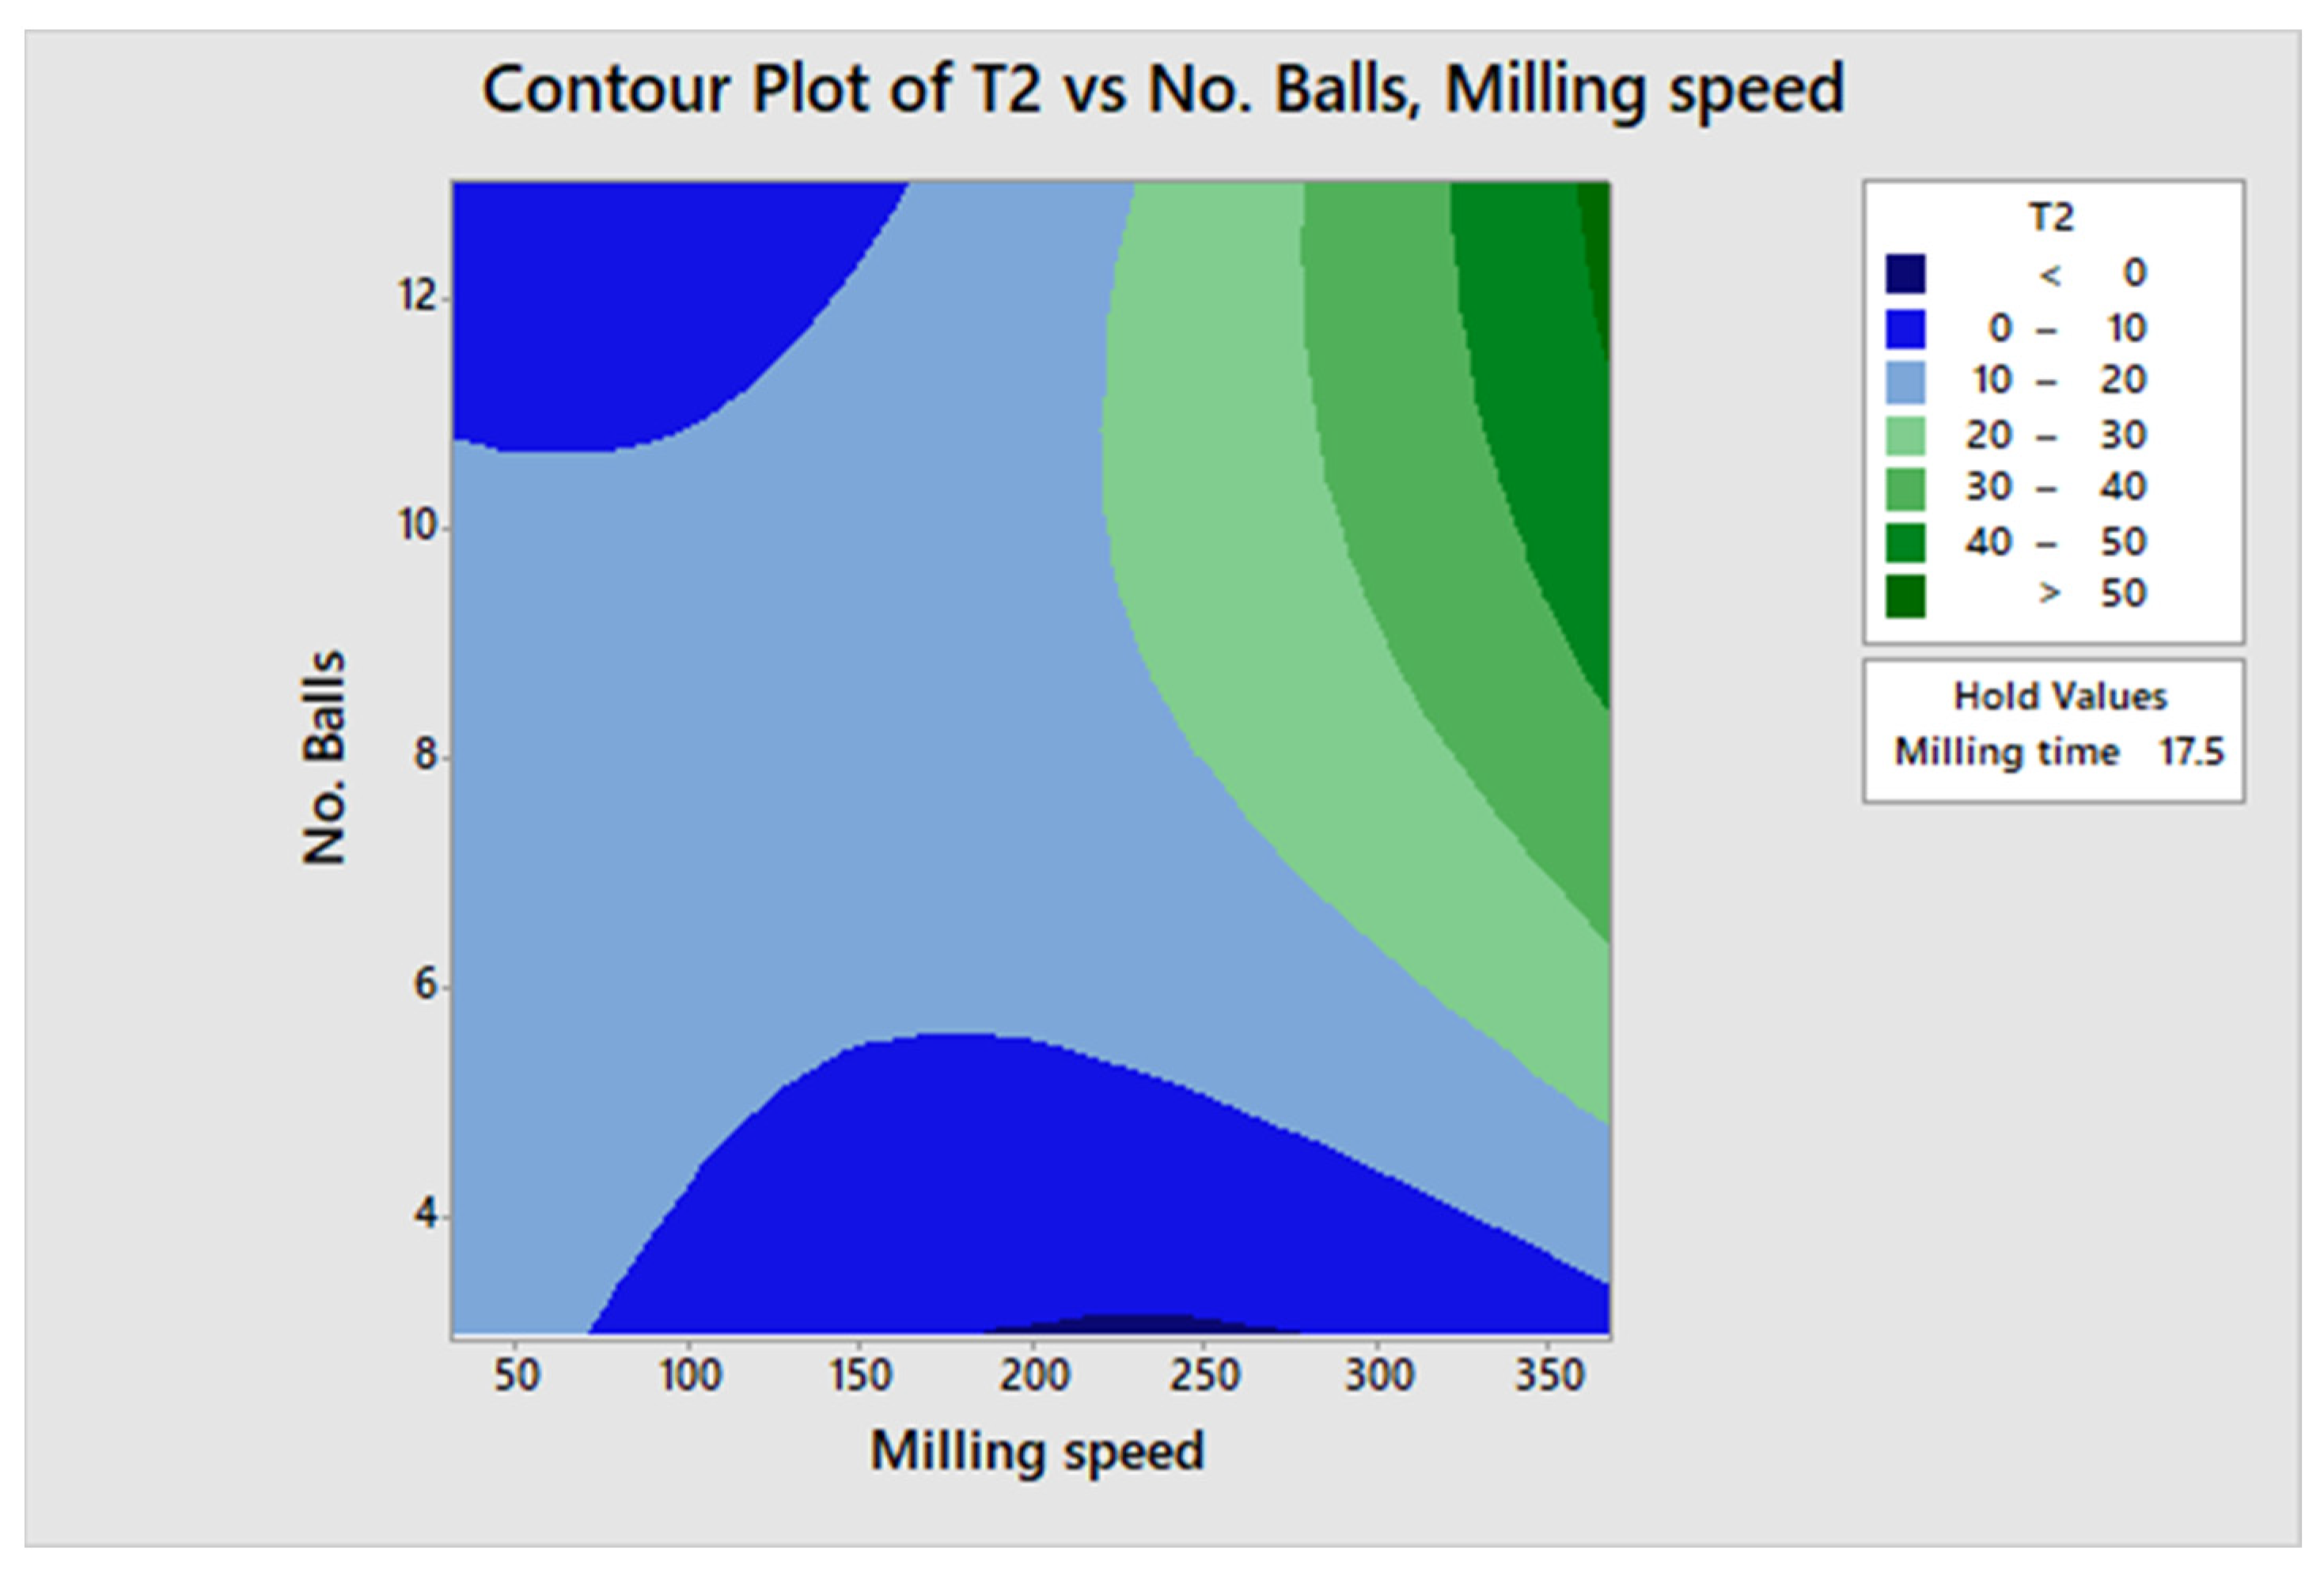
Figure 11 shows a contour response surface graph illustrating build-up of mass from T1 and further liberation of T2 into the T3 stream, with a 3D graphical representation in Figure 12 illustrating and confirming this response output outcome; 9 balls at 300 RPM at 25 min shows the maximum output for a desired size range of 75 microns.
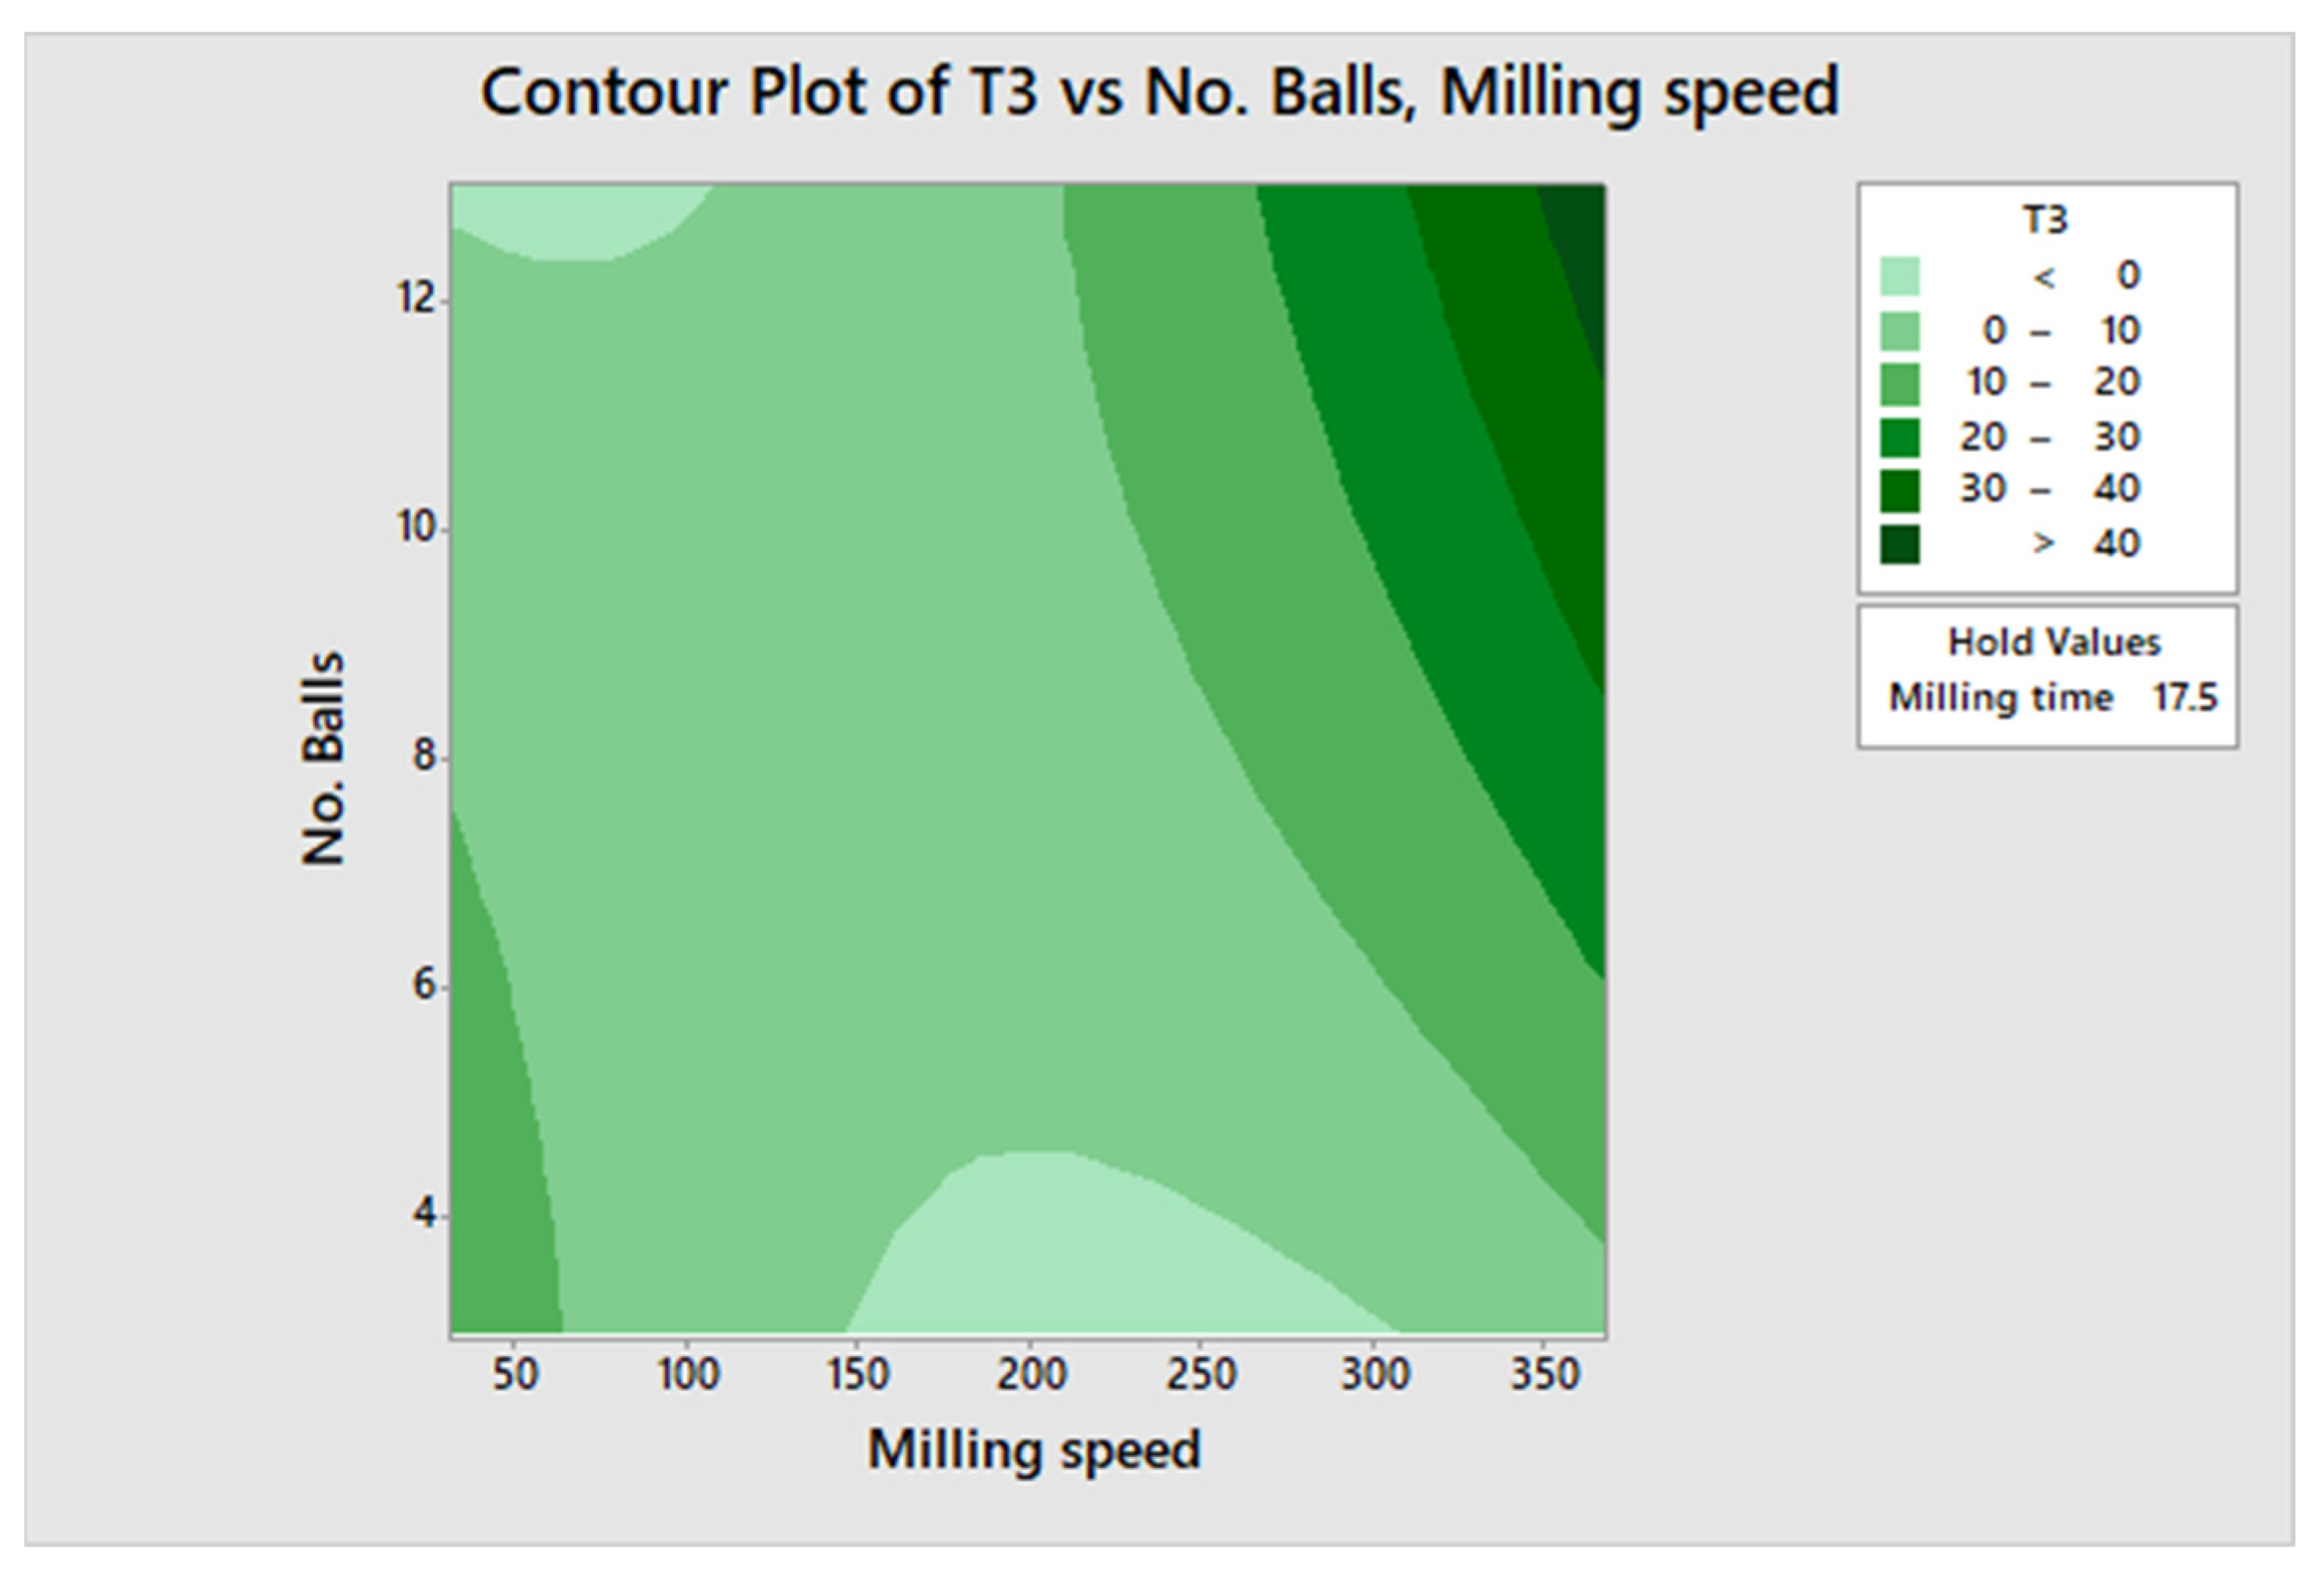
Figure 13 shows a contour response surface graph, which represents the number of balls vs. milling against the T3 size stream. It depicts that most of the material in the T3 class was accumulated from T2 and T1 and is in the range of 10–30 g due to a range of balls of 5 to 9, with fine material being beyond >40 g from the graphical representation which shows it being in low amounts by the full green color. Figure 14 further gives assurance to the results of Figure 13 as it illustrates a decrease in the T3 stream as most of the material was accumulated in the T2 stream with 9 balls and a milling speed showing a gradual increase of mass of T3 hence indicating that these are the optimal operating conditions for liberating the C.S. to the desired size class.

4. Conclusions

This paper applied the attainable region (A.R.) method to milling and particle distribution data series. The main objective was to maximize recovery by optimizing the desired particle size, which will minimize the costs of liberation (milling) with milling requiring much energy in the mineral-processing industry. A planetary ball mill was used for this investigation to assess different variables to find optimum output conditions suitable for leaching and flotation of BCL copper slag with the aim of metal recovery. This investigation is one of the first studies to find optimal conditions for the recovery of metals. The effects of milling time, milling speed and the number of milling balls were studied in this research paper. In previous research by investigators, it can be seen that there is a range of desired particle sizes acceptable for implementing recovery for copper slag. This investigation aims at obtaining that range with the reduction of operational costs mainly by attaining the optimal milling time, milling speed and number of balls required to achieve this goal. The main range is −106 µm + 75 µm, ideal for recovery techniques (flotation and leaching). The discoveries showed that the small size is a variable dependent on the grinding time, milling speed and number of balls of the feed material T2. It can be concluded that using 9 balls, milling for 25 min and using a rate of 300 RPM produces a high mass fraction of −106 µm. It is essential to use the middle size class towards the fines for a leaching and flotation approach, for better recovery.
It is also concluded that to obtain the maximum milling of the copper slag (desired output), keeping the milling ball’s mass constant, and control of the bed mass, control of the milling time, milling speed and number of grinding balls is vital to achieving the desired outcome. In conclusion, the discoveries illustrated that the A.R. technique is effectively used to recognize potential for superior efficiency in the milling of BCL copper slag. This technique has proven and been identified to be an advantage to engineers by saving time, reducing operational costs, and subsequently becoming vastly quicker, to optimize the copper slag size that would be implemented in the recovery of viable metals via leaching and flotation. The findings give an insight into what type of flowsheet and route to take when recovering the metallic elements optimal to the particle size obtained by the A.R. technique.
Looking at Figure 9, Figure 10, Figure 11, Figure 12, Figure 13 and Figure 14, it can be concluded that to obtain maximum milling of copper slag to the desired particle size, the contour and 3D graphical representations were used to recognize the maximum potential parameters to liberation. It is evident from Figure 9 and Figure 10 that at 9 balls, 25 min and 300 RPM a maximum amount of material escapes into the T2 stream, which is the goal. The desired size class is −106 µm to +75 µm, represented by T2 and T3, respectively. Response surface methodology gives a graphical representation analysis of the optimal parameter ranges used to gain the desired size class.

Author Contributions

T.S.G.: conceived, conceptualized and designed methodology, writing original draft and investigation. G.D.: visualization, methodology, supervision and data curation. T.M. (Tebogo Mashifana): supervision, review and editing. T.M. (Tirivaviri Mamvura): formal analysis, supervision. V.S.: investigation and project admiration. All authors have read and agreed to the published version of the manuscript.

Funding

This research received no external funding.

Acknowledgments

The authors would like to acknowledge Lone (Mining Technician), Tshepho Gaogane (Mineral Processing Technician), Gaesenngwe Gaesenngwe and Keagisitswe Setswalo for their assistance in the laboratory.

Conflicts of Interest

The authors declare no conflict of interest.

References

  1. Carranza, F.; Iglesias, N.; Mazuelos, A.; Romero, R.; Forcat, O. Ferric leaching of copper slag flotation tailings Ferric leaching of copper slag flotation tailings. Miner. Eng. 2009, 22, 107–110. [Google Scholar] [CrossRef]
  2. Celep, O.; Deveci, H. New trends in Mining. In Proceedings of the 25 International Mining Congress and Exhibition of Turkey (IMCET 2017), Antalya, Turkey, 11–14 April 2017. [Google Scholar]
  3. Danha, D.; Hildebrandt, D.; Glasser, D.; Bhondayi, C. A laboratory scale application of the attainable region technique on a platinum ore. Powder Technol. 2015, 274, 14–19. [Google Scholar] [CrossRef]
  4. Emmanuel, E.; Anggraini, V.; Asadi, A. An investigation on the breakage behavior of olivine sand particles: An attainable region technique. Adv. Powder Technol. 2022, 33, 103422. [Google Scholar] [CrossRef]
  5. Gabasiane, T.S.; Danha, G.; Mamvura, T.A.; Mashifana, T.; Dzinomwa, G. Characterization of copper slag for beneficiation of iron and copper. Heliyon 2021, 7, e06757. [Google Scholar] [CrossRef]
  6. Taylor, P. Mineral Processing and Extractive Metallurgy Review: Particle size and shape Characteristics of Kemerburgaz quartz sands obtained by sieving, laser diffraction, and digital image processing methods. Miner. Process. Extr. Metall. Rev. 2009, 30, 37–41. [Google Scholar]
  7. Urosevic, D.M.; Dimitrijevic, M.D.; Jankovic, Z.D.; Antic, D.V. Recovery of Copper from Copper Slag and Copper Slag Flotation Tailings. Physicochem. Probl. Miner. Process. 2015, 51, 73–82. [Google Scholar]
  8. Sibanda, V.; Sipunga, E.; Danha, G.; Mamvura, T.A. Enhancing the flotation recovery of copper minerals in smelter slags from Namibia prior to disposal. Heliyon 2020, 6, e03135. [Google Scholar] [CrossRef] [Green Version]
  9. Wang, C.; Harbottle, D.; Liu, Q.; Xu, Z. Current state of mineral tailings treatment: A critical review on theory and practice. Miner. Eng. 2014, 58, 113–131. [Google Scholar] [CrossRef]
  10. Wang, X.; Geysen, D.; Padilla Tinoco, S.V.; D’Hoker, N.V.G.T.; Van Gerven, T.; Blanpain, B. Characterization of copper slag in view of metal recovery. Trans. Institutions Min. Metall. Sect. C Miner. Process. Extr. Metall. 2015, 124, 83–87. [Google Scholar] [CrossRef]
  11. Wills, B.A.; Napier-Munn, T. Mineral Processing Technology: An Introduction to the Practical Aspects of Ore Treatment and Mineral Recovery; Elsevier: Amsterdam, The Netherlands, 2006. [Google Scholar]
  12. You, J.; Solongo, S.K.; Gomez-Flores, A.; Choi, S.; Zhao, H.; Urik, M.; Ilyas, S.; Kim, H. Intensified bioleaching of chalcopyrite concentrate using adapted mesophilic culture in continuous stirred tank reactors. Bioresour. Technol. 2020, 307, 123181. [Google Scholar] [CrossRef]
  13. Guo, W.; Han, Y.; Gao, P.; Li, Y.; Tang, Z. A study of the grinding of magnetite/limestone mixture in a stirred mill by the attainable region method. Powder Technol. 2021, 389, 40–47. [Google Scholar] [CrossRef]
  14. Hlabangana, H.; Danha, D.; Mguni, N.G.; Madiba, M.S.; Bhondayi, C. Determining an optimal interstitial filling condition: An attainable Region approach. Powder Technol. 2018, 327, 9–16. [Google Scholar] [CrossRef]
  15. Hlabangana, N.; Danha, D.; Hildebrandt, D.; Glasser, D. Use of the attainable region approach to determine major trends and optimize particle breakage in a laboratory mill. Powder Technol. 2016, 291, 414–419. [Google Scholar] [CrossRef]
  16. Sibanda, V.; Khan, R.; Danha, G. The effect of chemical reagent on flotation performance of a Pentlandite ore: An attainable region approach. Powder Technol. 2019, 252, 464–469. [Google Scholar] [CrossRef]
  17. Hlabangana, N.; Danha, G.; Bwalya, M.M.; Hildebrandt, D.; Glasser, D. Application of attainable region method to determine optimal conditions for milling and leaching. Powder Technol. 2017, 317, 400–407. [Google Scholar] [CrossRef]
  18. Hlabangana, N.; Danha, G.; Muzenda, E. Effect of ball and feed particle size distribution on the milling efficiency of a ball mill: An attainable region approach. S. Afr. J. Chem. Eng. 2018, 25, 79–84. [Google Scholar] [CrossRef]
  19. Hlabangana, N.; Nhira, E.; Masayile, N.; Tembo, P.M.; Danha, G. A fundamental investigation on the breakage of a bed of PGM ore particles: An attainable region approach, part 2. Powder Technol. 2019, 346, 326–331. [Google Scholar] [CrossRef]
  20. Keith, J. Mineral Accounting, National Wealth and Adjusted Net Savings Calculations in Botswana. 2015. Econsult Botswana. Available online: https://www.wavespartnership.org/sites/waves/files/images/Botswana%20Mineral%20Accounts%20presentation.pdf (accessed on 1 December 2022).
  21. Khanzadi, M.; Behnood, A. Mechanical properties of high-strength concrete incorporating copper slag as coarse aggregate. Constr. Build. Mater. 2019, 23, 2183–2188. [Google Scholar] [CrossRef]
  22. Khumalo, N.; Glasser, D.; Hildebrandt, D.; Hausberger, B.; Kauchali, S. The application of attainable region analysis to comminution. Chem. Eng. Sci. 2006, 61, 5969–5980. [Google Scholar] [CrossRef]
  23. Khumalo, S.; Hlabangana, N.; Danha, G.; Muzenda, E. Effect of media shape on particle breakage in a batch ball mill: Lessons learnt from population balance model and attainable region technique. Procedia Manuf. 2019, 35, 75–79. [Google Scholar] [CrossRef]
  24. Lim, T.T.; Chu, J. Assessment of the use of spent copper slag for land reclamation. Waste Manag. Res. 2006, 24, 67–73. [Google Scholar] [CrossRef] [PubMed]
  25. Metzger, M.J.; Glasser, D.; Hausberger, D.; Glasser, B.J. Use of attainable region analysis to optimize particle breakage in a ball mill. Chem. Eng. Sci. 2009, 64, 3766–3777. [Google Scholar] [CrossRef]
  26. Ming, D.; David, G.; Diane, H.; Benjamin, G.; Matthew, M. Attainable Region Theory: An Introduction to Choosing an Optimal Reactor; John Wiley and Sons: New York, NY, USA, 2016; Volume 1. [Google Scholar]
  27. Muhlare, T.A.; Groot, D.R. Recovery of Copper from Reverberatory Copper Slag and Production of a Leach Residue used as a Portland Cement Additive. In Proceedings of the Copper Cobalt Africa, Incorporating the 8th Southern African Base Metals Conference, Livingstone, Zambia, 6–8 July 2015. [Google Scholar]
  28. Mulenga, F.K. An attainable region perspective on the role of residence time distribution in the ball milling. S. Afr. J. Chem. Eng. 2022, 33, 125–132. [Google Scholar] [CrossRef]
  29. Mulenga, F.K.; Chimwani, N. Introduction to the use of the attainable region method in determing the optimal residence time of the ball mill. Int. J. Miner. Process. 2013, 125, 39–50. [Google Scholar] [CrossRef]
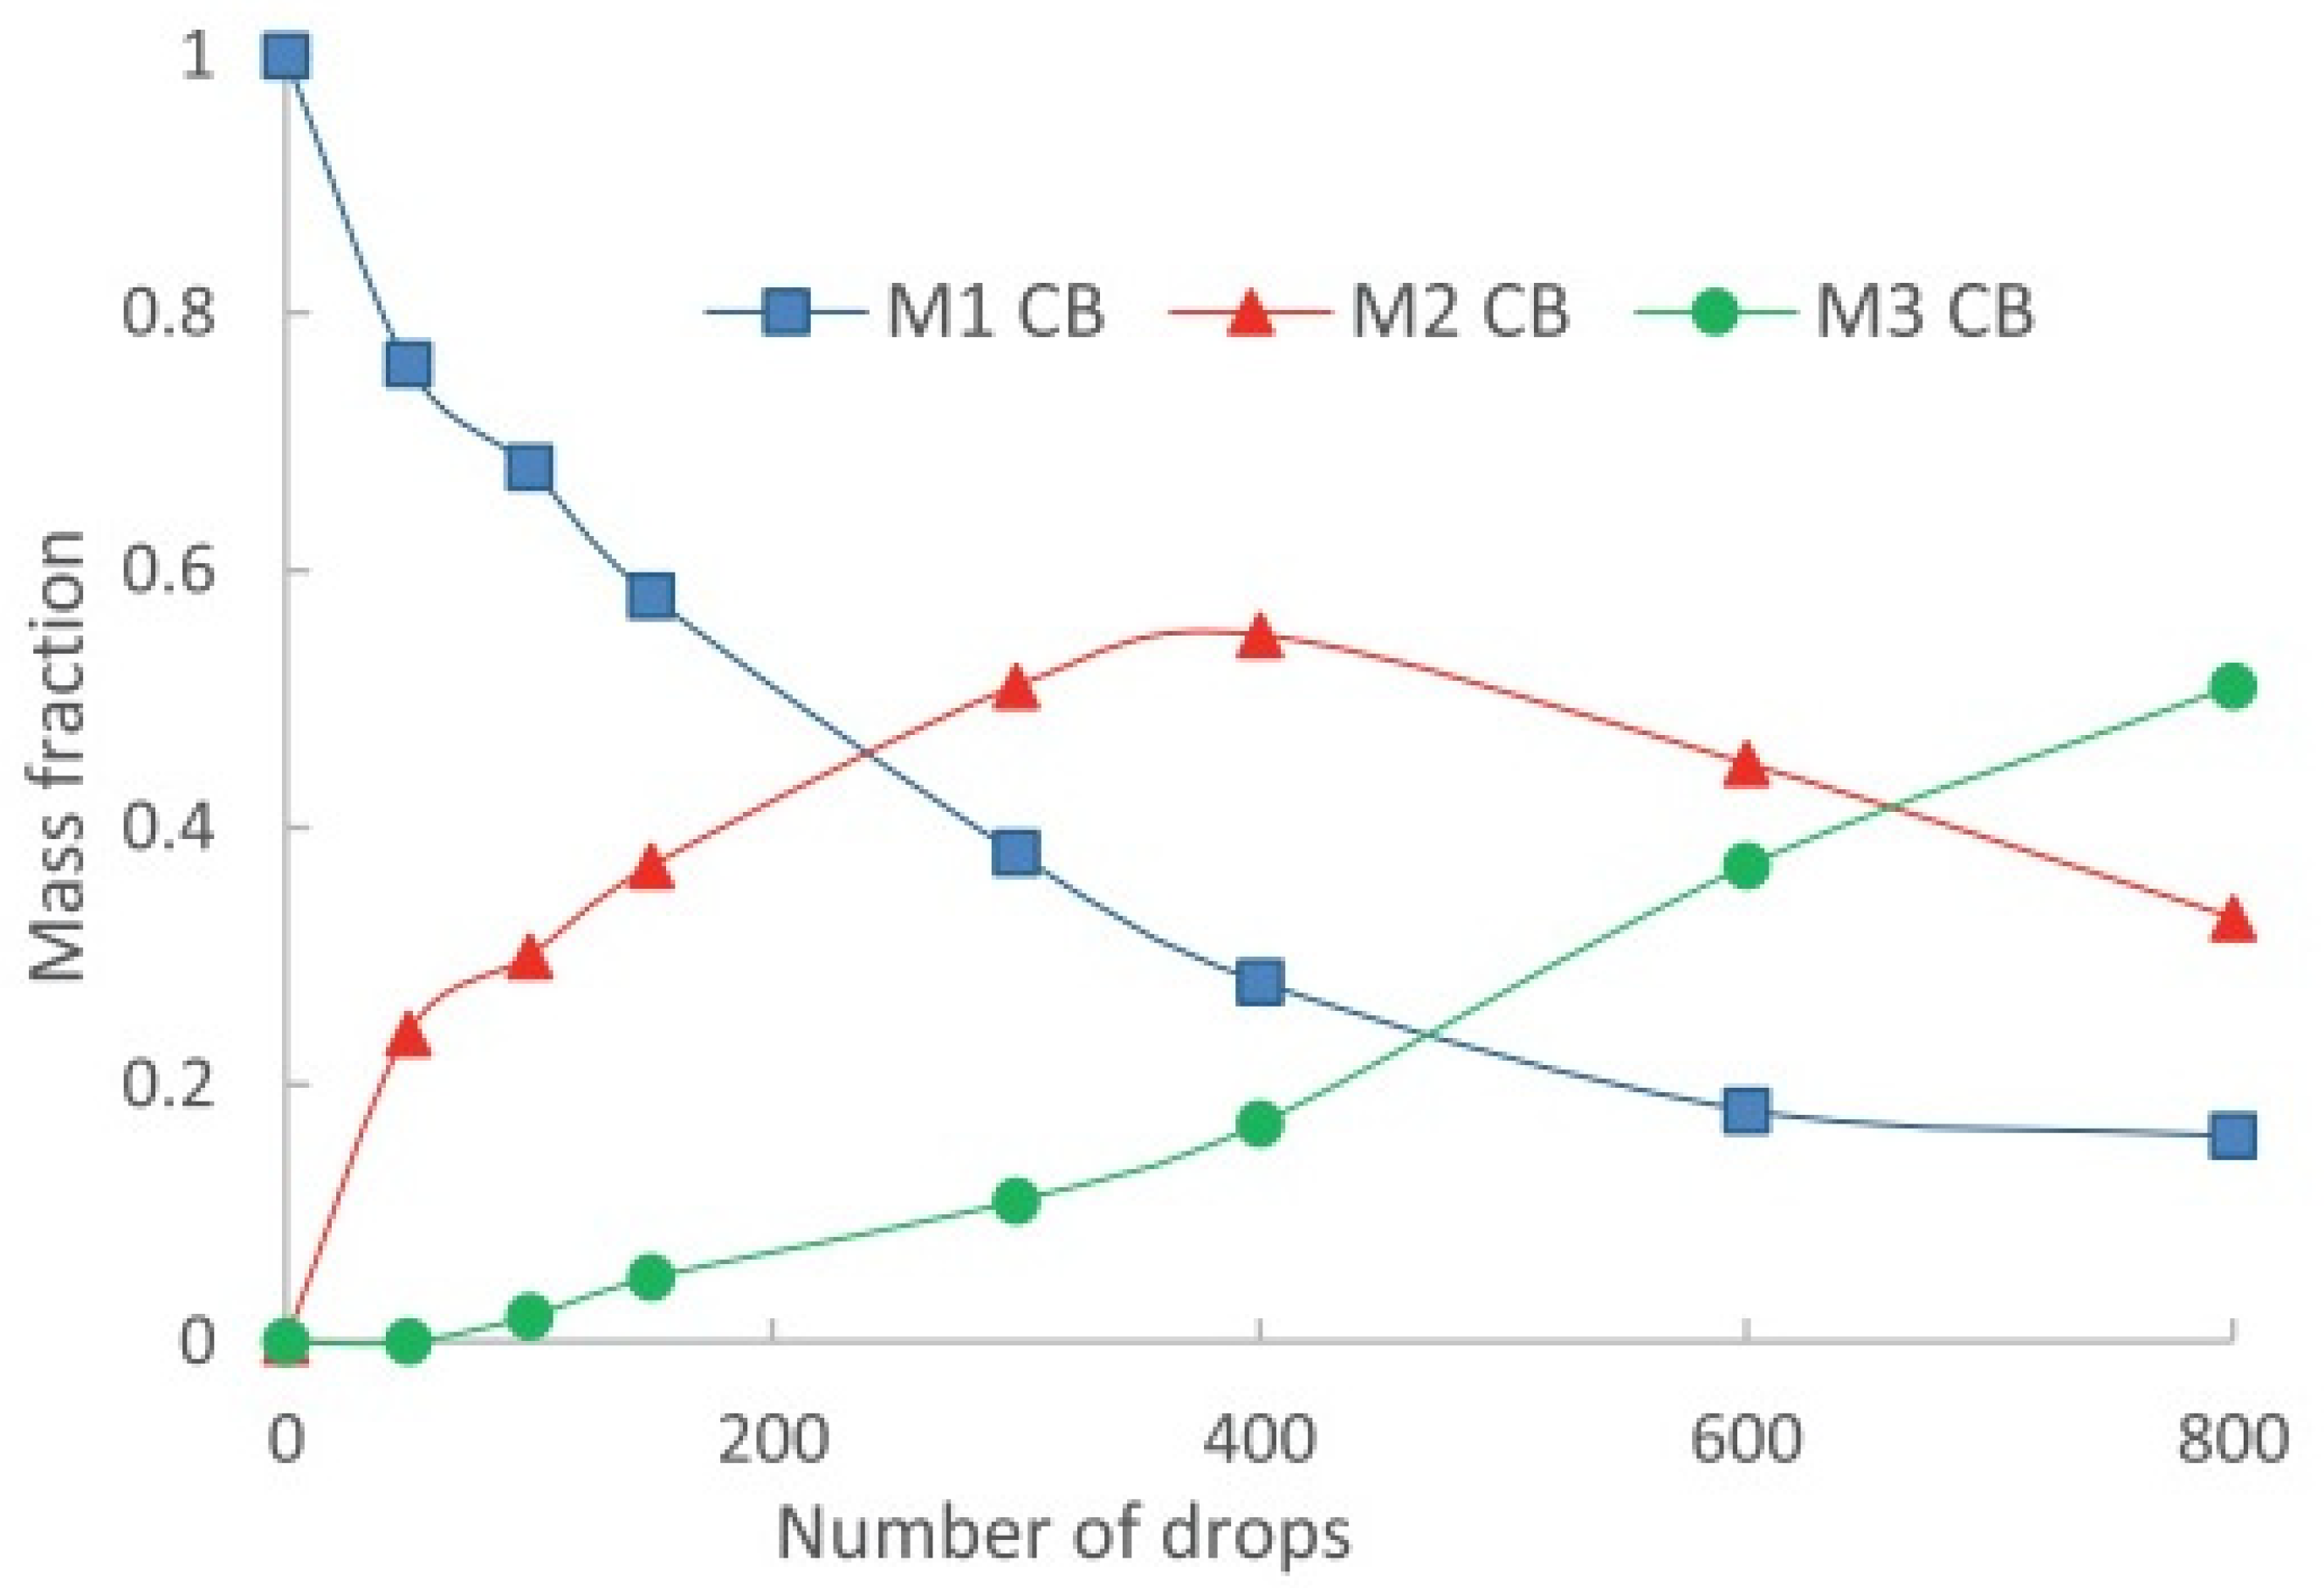
Figure 1. Mass fractions vs. different numbers of drops [19].
Minerals 13 00019 g001
Figure 2. Planetary ball mill used for comminution.
Minerals 13 00019 g002
Figure 3. Sieve analysis method employed.
Minerals 13 00019 g003
Figure 4. (AC) plots of T1, T2 and T3 vs. grinding time, respectively (bed mass = 250 g, varied no. of balls, shaking time 20 min). (DF) plots of T2 vs. T1, T3 vs. T1 andT3 vs. T2, respectively (mass fraction of middle size class against the mass fraction of the feed of the sample for different times).
Minerals 13 00019 g004
Figure 5. (AC) plots of T1, T2 and T3 vs. Milling speeds (bed mass = 250 g, varied number of balls, shaking time 20 min).
Minerals 13 00019 g005
Figure 6. Mass fraction of middle size class (T2) against the mass fraction of the feed (T1) of the sample for different speeds.
Minerals 13 00019 g006
Figure 7. Mass fraction of middle size class (T2) against mass fraction of the feed material (T1) for different speeds.
Minerals 13 00019 g007
Figure 8. Mass fraction of fines size class against mass fraction of the intermediate size class for different speeds).
Minerals 13 00019 g008
Figure 9. T1 vs. no. of balls– milling speed.
Minerals 13 00019 g009
Figure 10. T1 vs. milling speed vs. no. of balls.
Minerals 13 00019 g010
Figure 11. T2 vs. no. of balls– milling speed.
Minerals 13 00019 g011
Figure 12. T2 vs. milling speed vs. no. of balls.
Minerals 13 00019 g012
Figure 13. T3 vs. no. of balls– milling speed.
Minerals 13 00019 g013
Figure 14. T3 vs. milling speed vs. no. of balls.
Minerals 13 00019 g014
Table 1. Components of natural capital in Botswana [5].
TypeDetails
MineralsDiamonds
Base metals
Coal
Gold
Soda ash
LandPasture
Arable farming
Protected areas (national parks)
WaterRivers, dams, aquifers
AnimalsDomestic animals
Wildfire
Table 2. Application of A.R. by different researchers in mineral processing.
The Process Used by A.R.References
Comminution[18,21,22]
Improve material breakage inside a ball mill[23,24,25]
Identify various ways of improving the milling efficiency[23,26,27]
Ball loading and ball mix[20,28]
Slurry density[28,29]
Mill speed[17,23,28]
Table 3. Alternative methods of particle size analysis [7].
MethodWet or DryFractionated SampleApprox. Useful Size Range (Micro)
Test sievingBothYes5–1,000,000
Laser diffractionBothNo0.1–2000
Optical microscopyDryNo0.2–50
Electron microscopyDryNo0.005–100
Elutriation (cyclosizer)WetYes5–45
Sedimentation (gravity)WetYes1–40
Sedimentation (centrifuge)WetYes0.05–5
Table 4. Planetary mill test conditions and varied parameters used in the experiments.
Mill ParameterSpecificationExperimental ParameterSpecification
Diameter of steel balls20 mmNumber of steel balls5, 7, 9 and 11
Weight of each ball9.73 g--
Ball loading (J)20%Grinding time (mins)5, 10, 15, 20, 25, 30
Feed size <850 µmSpeed (RPM)100, 200, 250, 300, 350
% Intestinal filling (U)100Sampled bed mass (g)Constant 250 g
Grinding bowl volume500 mL--
Mill Speed50–400 RPM--
Table 5. Particle size range used for A.R. analysis.
Size ClassUpper Limit (µm)Lower Limit (µm)Classification
T1−850+106Coarse (Feed)
T2−106+45Desired size class (Intermediate)
T3−45To panFines
Disclaimer/Publisher’s Note: The statements, opinions and data contained in all publications are solely those of the individual author(s) and contributor(s) and not of MDPI and/or the editor(s). MDPI and/or the editor(s) disclaim responsibility for any injury to people or property resulting from any ideas, methods, instructions or products referred to in the content.