Article

Minor Elements and Color Causing Role in Spinel: Multi-Analytical Approaches

by
Teerarat Pluthametwisute
1,
Bhuwadol Wanthanachaisaeng
2,
Chatree Saiyasombat
3 and
Chakkaphan Sutthirat
1,*
1
Department of Geology, Faculty of Science, Chulalongkorn University, Bangkok 10330, Thailand
2
Gem and Jewelry Program, College of Creative Industry, Srinakharinwirot University, Bangkok 10110, Thailand
3
Synchrotron Light Research Institute (Public Organization), Nakhon Ratchasima 30000, Thailand
*
Author to whom correspondence should be addressed.
Minerals 2022, 12(8), 928; https://doi.org/10.3390/min12080928
Submission received: 7 June 2022 / Revised: 16 July 2022 / Accepted: 19 July 2022 / Published: 23 July 2022
(This article belongs to the Special Issue Colours in Minerals and Rocks, Volume II)

Abstract

:
Natural spinel (MgAl2O4) usually contains some minor and trace elements (e.g., Cr, Co, Fe, V) that may cause various hues. The ratios of these chromophores directly affect the color composition. The red color in spinel is attributed to the combination of significant Cr and V. Magenta and purple to blue and green colors in spinels are affected by the significant Fe concentration, whereas orange color in spinel shows the contribution of significant V content compared to Cr and Fe. After the heating experiment, advanced gemological investigation reveals some noteworthy characteristic features. X-ray absorption spectroscopy (XAS) indicates a greater change in oxidation state, as well as disordering of Fe and V. Broadening of the dominant peak at around 406 cm−1 with occurrences of additional small peaks at around 715–719 cm−1 in Raman spectra, as well as broadening of the 685 nm (R-line) and poorly defined structure of additional peaks (N-lines) in photoluminescence spectra should be significant indicators of spinel undergone heat treatment.

1. Introduction

Spinel (MgAl2O4) is a mineral consisting of mostly magnesium, aluminum, and oxygen [1]. Spinel has variety of hues, ranging from violet to red. It is generally found in the same deposits of ruby or sapphire. However, gem colored spinel is economically found in a few places across the world, such as significant deposits of bright red in Myanmar and cornflower blue in Vietnam, with other minor sources including Sri Lanka, Tanzania, and Tajikistan [2]. The most popular varieties of natural spinel in the world gem markets are blue and red to magenta colors. These attractive colors of spinel are mainly due to Cr, Fe, and Co that substitute Mg and/or Al in its structure. Spinel, initially, is a Latin word (spina) meaning “thorn”. Recently, the Commission on New Minerals, Nomenclature, and Classification (CNMNC) of the International Mineralogical Association (IMA) has approved that spinel (MgAl2O4) belongs to the spinel subgroup in the oxyspinel group of the spinel supergroup. Spinel-type structure is applied by many compounds with a ratio of 3:4 cations to anions, basically represented by the formula AB2X4 where A and B refer to different cations or vacancies and X refers to the occupancy of anions. For instance, X can be O2− or S2−. The basic structure may be described now as a slightly distorted face-centered cubic array of X anions with A cations occupying 1/8 tetrahedral site and B cations occupying 1/2 of an octahedral site within cubic unit cell. For general understanding, typical spinel formula should be possibly written as TAMB2X4 (T and M, refers to tetrahedrally- and octahedrally-coordinated sites, respectively) or A2+B3+2X4, since spinel subgroup (2–3 spinels) is a group of various mineral species containing different constituents of divalent cations and trivalent cations, for A and B, respectively [1,3,4,5,6]. For site occupation, some studies proposed that Ga3+, In3+, Ti3+, Cr3+, Fe3+ (perhaps a few Fe2+), V3+, Mn3+, Co3+, and Rh3+ may substitute Al3+ in octahedral site [2,7,8,9,10,11,12,13,14,15], while Fe2+, Co2+, Mn2+, Ni2+, Cu2+, Zn2+, and Cd2+ can replace Mg2+ in tetrahedral site [2,7,8,9,10,11,14,15,16,17].
On the basis of 32 oxygen atoms per formula unit, the normal spinel ideally has 24 cation atoms in a cubic unit cell. It is composed of A-divalent cations (eight atoms) inhabited the tetrahedral site (four-fold coordination, T), whereas B-trivalent cations (16 atoms) occupied the octahedral site (six-fold coordination, M) or are described as TA82+MB163+O32 which could be simplified as A2+B23+O4 or A(BB)O4 [2,18]. Mg and Al can then occupy the T and M sites, respectively, for normal spinel (MgAl2O4, or Mg(AlAl)O4). Heating may induce cation disorder towards inverse spinels. Ideally, half of Al in M site (8 of 16 B cations) may occupy T site alternating with 8 atoms of A cations in T site that occupied half of M site. This could be described as TAl83+(MMg82++MAl83+)O32 or simply written as Al(MgAl)O4 [2,18].
Color in spinel has been studied for some decades and it was demonstrated that it is basically influenced by site occupation of the main chromophores, particularly Cr, Fe, and Co. For instance, Cr3+, Fe3+ and/or V3+ in the octahedral site were proved to cause red to magenta color whereas Co2+and/or Fe2+ in the tetrahedral site may impart blue color while the ratio of these elements also affects bluish and purplish color composition [7,9,10,11,12,16,17,19,20,21,22,23,24,25,26]. Orange spinel could be influenced by the proper amount of V3+ in the octahedral site [7]. Fe2+-Fe3+ IVCT was suggested to cause green color in spinel [7,10,27]. V may also have an effect on the green spinels [23]. Moreover, the additional suggestion has appeared lately in 2018 that the blue color in spinel is likely due to the collaboration of Co2+ and Fe3+ in the tetrahedral site with Fe2+ in the octahedral site [28]. However, it should be notified that these previous studies made merely speculation without solid evidence directly related to color-causing elements’ valency, site occupancy, and their alteration after heat treatment.
Natural red spinels were subjected to heat treatment in the oxidizing atmosphere for 5 h with high temperatures varying from 1100 °C to 1700 °C but they showed no improvement of color, only turned darker [29]. Subsequently, potential color enhancement of spinel was experimentally carried out above 1200 °C for more than 30 min using the local heating method at Mogok in Myanmar [2]. Color alterations were presented in three groups including the less orange and brown group, more in magenta and saturation group, and no alteration of hue, tone, and saturation group [2]. Many studies have proposed that the color shades, tints, and tones of spinels relate to specific types of trace impurities and/or their concentrations. However, there is still an ambiguous and imprecise understanding of coloration in heated gem-quality spinels.
X-ray absorption spectroscopy (XAS), a synchrotron radiation utility, is a prospective atomic probe method that is sensitive to the oxidation state and local structure of the absorbing element. XAS is divided into two sections, X-ray absorption near edge structure (XANES) and extended X-ray absorption fine structure (EXAFS). EXAFS are used to characterize the distance, coordination number, the types of surrounding atoms, and the level of disorder, whereas XANES is an effective spectroscopic method for determining oxidation state and structural symmetry. The shift of the absorption edge (edge energy, E0) and distinctive XANES characteristics are affected by a probed element with various oxidation states and local structure [30]. As previously stated, this has induced our research to investigate gem-quality colored spinels focusing particularly on the study of color change after heating and the great advantage of using a multi-analytical approaches including EPMA, UV-Vis, Raman, PL and XAS to reveal heating treatments in spinels.

2. Matrials and Methods

More than twenty rough spinel samples with various hues were clearly separated into 7 groups including red, magenta, orange, red-purple, purple, blue, and green. These samples were then cut and polished into wafers prior to color classification based on Munsell’s color coding system. Absorption spectra were analyzed using a PerkinElmer-LAMBDA 1050 UV-VIS-NIR spectrophotometer, the operating conditions were set with a 2.00 slit size, a data interval of 3.00 nm with a scan speed of 405.07 nm/min, and a recording range between 250 nm and 1500 nm. Raman and photoluminescence (PL) spectra were also analyzed using a Renishaw-inVia Raman microscope with a recording range of 200–2000 Raman shift/cm−1 (excitation at 532 nm edge) for Raman, and a recording range of 537–850 nm for photoluminescence (PL), respectively. The diffraction grating used in this Raman and PL investigation was 1800 grooves per millimeter. The laser output power was 45 mW, and the spot size was 1.5 μm with the exposure time per scan of 10 s. These facilities are based at The Gem and Jewelry Institute of Thailand (Public Organization), GIT.
The chemical compositions of the samples were determined using an Electron Probe Micro-Analyzer (EPMA) model JXA 8100 from JEOL. The EPMA analytical conditions were set at a 15 kV accelerating voltage and a probe current of about 2.5 × 10⁻⁸ with a focus electron beam (<1 µm). Mineral standards and some synthetic oxide standards were selected suitably for calibration, including zinc oxide (ZnO) for Zn, fayalite (Fe2SiO4) for Fe, wollastonite (CaSiO3) for Ca, synthetic corundum (Al2O3) for Al, synthetic periclase (MgO) for Mg, synthetic quartz (SiO2) for Si, synthetic rutile (TiO2) for Ti, synthetic manganosite (MnO) for Mn, synthetic eskolaite (Cr2O3) for Cr, cobalt oxide (CoO) for Co, gadolinium gallium garnet (Ga), and lead vanadium germanium oxide (PbV Geoxide) for V. Three analytical spots in each sample were carried out for statistical analysis. A heating experiment was carried out using a Linn-HT-1800-Vac high temperature furnace in atmospheric conditions at the maximum temperature of 1200 °C with holding time of 1 hour and cooling down naturally. EPMA and the electric furnace were facilitated by the Department of Geology, Faculty of Science, Chulalongkorn University.
XAS was investigated at Beamline 1.1W: Multiple X-ray Techniques (MXT) experimental station at the Synchrotron Light Research Institute (Public Organization) in Thailand. This beamline has a 2.2 Tesla multipole wiggle as the X-ray source and equipped with Si (111) double monochromator. The 19-element Ge detector was used as a florescence detector to detect probed element with low concentration. All XAS analysis were examined with an average of 3–5 scans to improve signal to noise ratio. Analytical parameters for Fe, Cr and V were presented in Table 1. Fe-foil, Cr-foil, and V-foil, as well as FeO, Fe2O3, Cr2O3, CrO3, V2O3 and V2O4 were used as chemical standards for examining oxidation state of Fe, Cr, and V in spinel. Absorption edges of Fe, Cr, and V from XANES spectra were then extracted from their normalized XANES spectra. Pre-edge parameters diagram also presented for the oxidation state and/or co-ordination indication which indicated a variation of assuming binary mixtures of respective endmembers. These procedures have been proposed by many previous researchers [31,32,33,34,35,36,37,38,39,40]. Fitting the spectral region before the pre-edge with a Victoreen function and subtracting this as background absorption were used to normalize the XANES spectra. The pre-edge was modeled using Lorentzian and spline function that was used to interpolate the background data a few eV before and after the pre-edge feature. Normalized height, position, half-width, centroid, and integrated intensity were derived from the pre-edges [38] using the XAS Viewer program [41]. The pre-edge information was gathered by calculating the total integrated area (sum of the integrated intensities of each component) and the centroid (area-weighted average of the pre-edge peak location) of the background subtracted pre-edge [38,39]. The location of the centroid and its integrated intensity are the most relevant features. The approach for determining the pre-edge peak features in XANES spectra was derived from Wilke et al. [38], who developed a methodology described by several previous researchers by subtracting background and adding components of Gaussian model fitting, resulting in the pre-edge fit centroid and integrated intensity (pre-edge peak area). This is apparently the most accurate method for determining the symmetry and oxidation state of Fe XANES spectra, which was utilized in this study. The examination of V pre-edge XANES was primarily performed by applying the Chaurand et al. [31], Giuli et al. [34], and Farges et al. [42] methodology approaches, with the purpose of identifying the ratio of mixed oxides and site symmetry. Several determinations were proposed for analyzing Cr pre-edge XANES spectra, however, this research will be analyzed based on Peterson et al. [36,43] procedure which determined the pre-edge height on normalized XANES spectra. Additional information will be given in Section 4.

3. Results

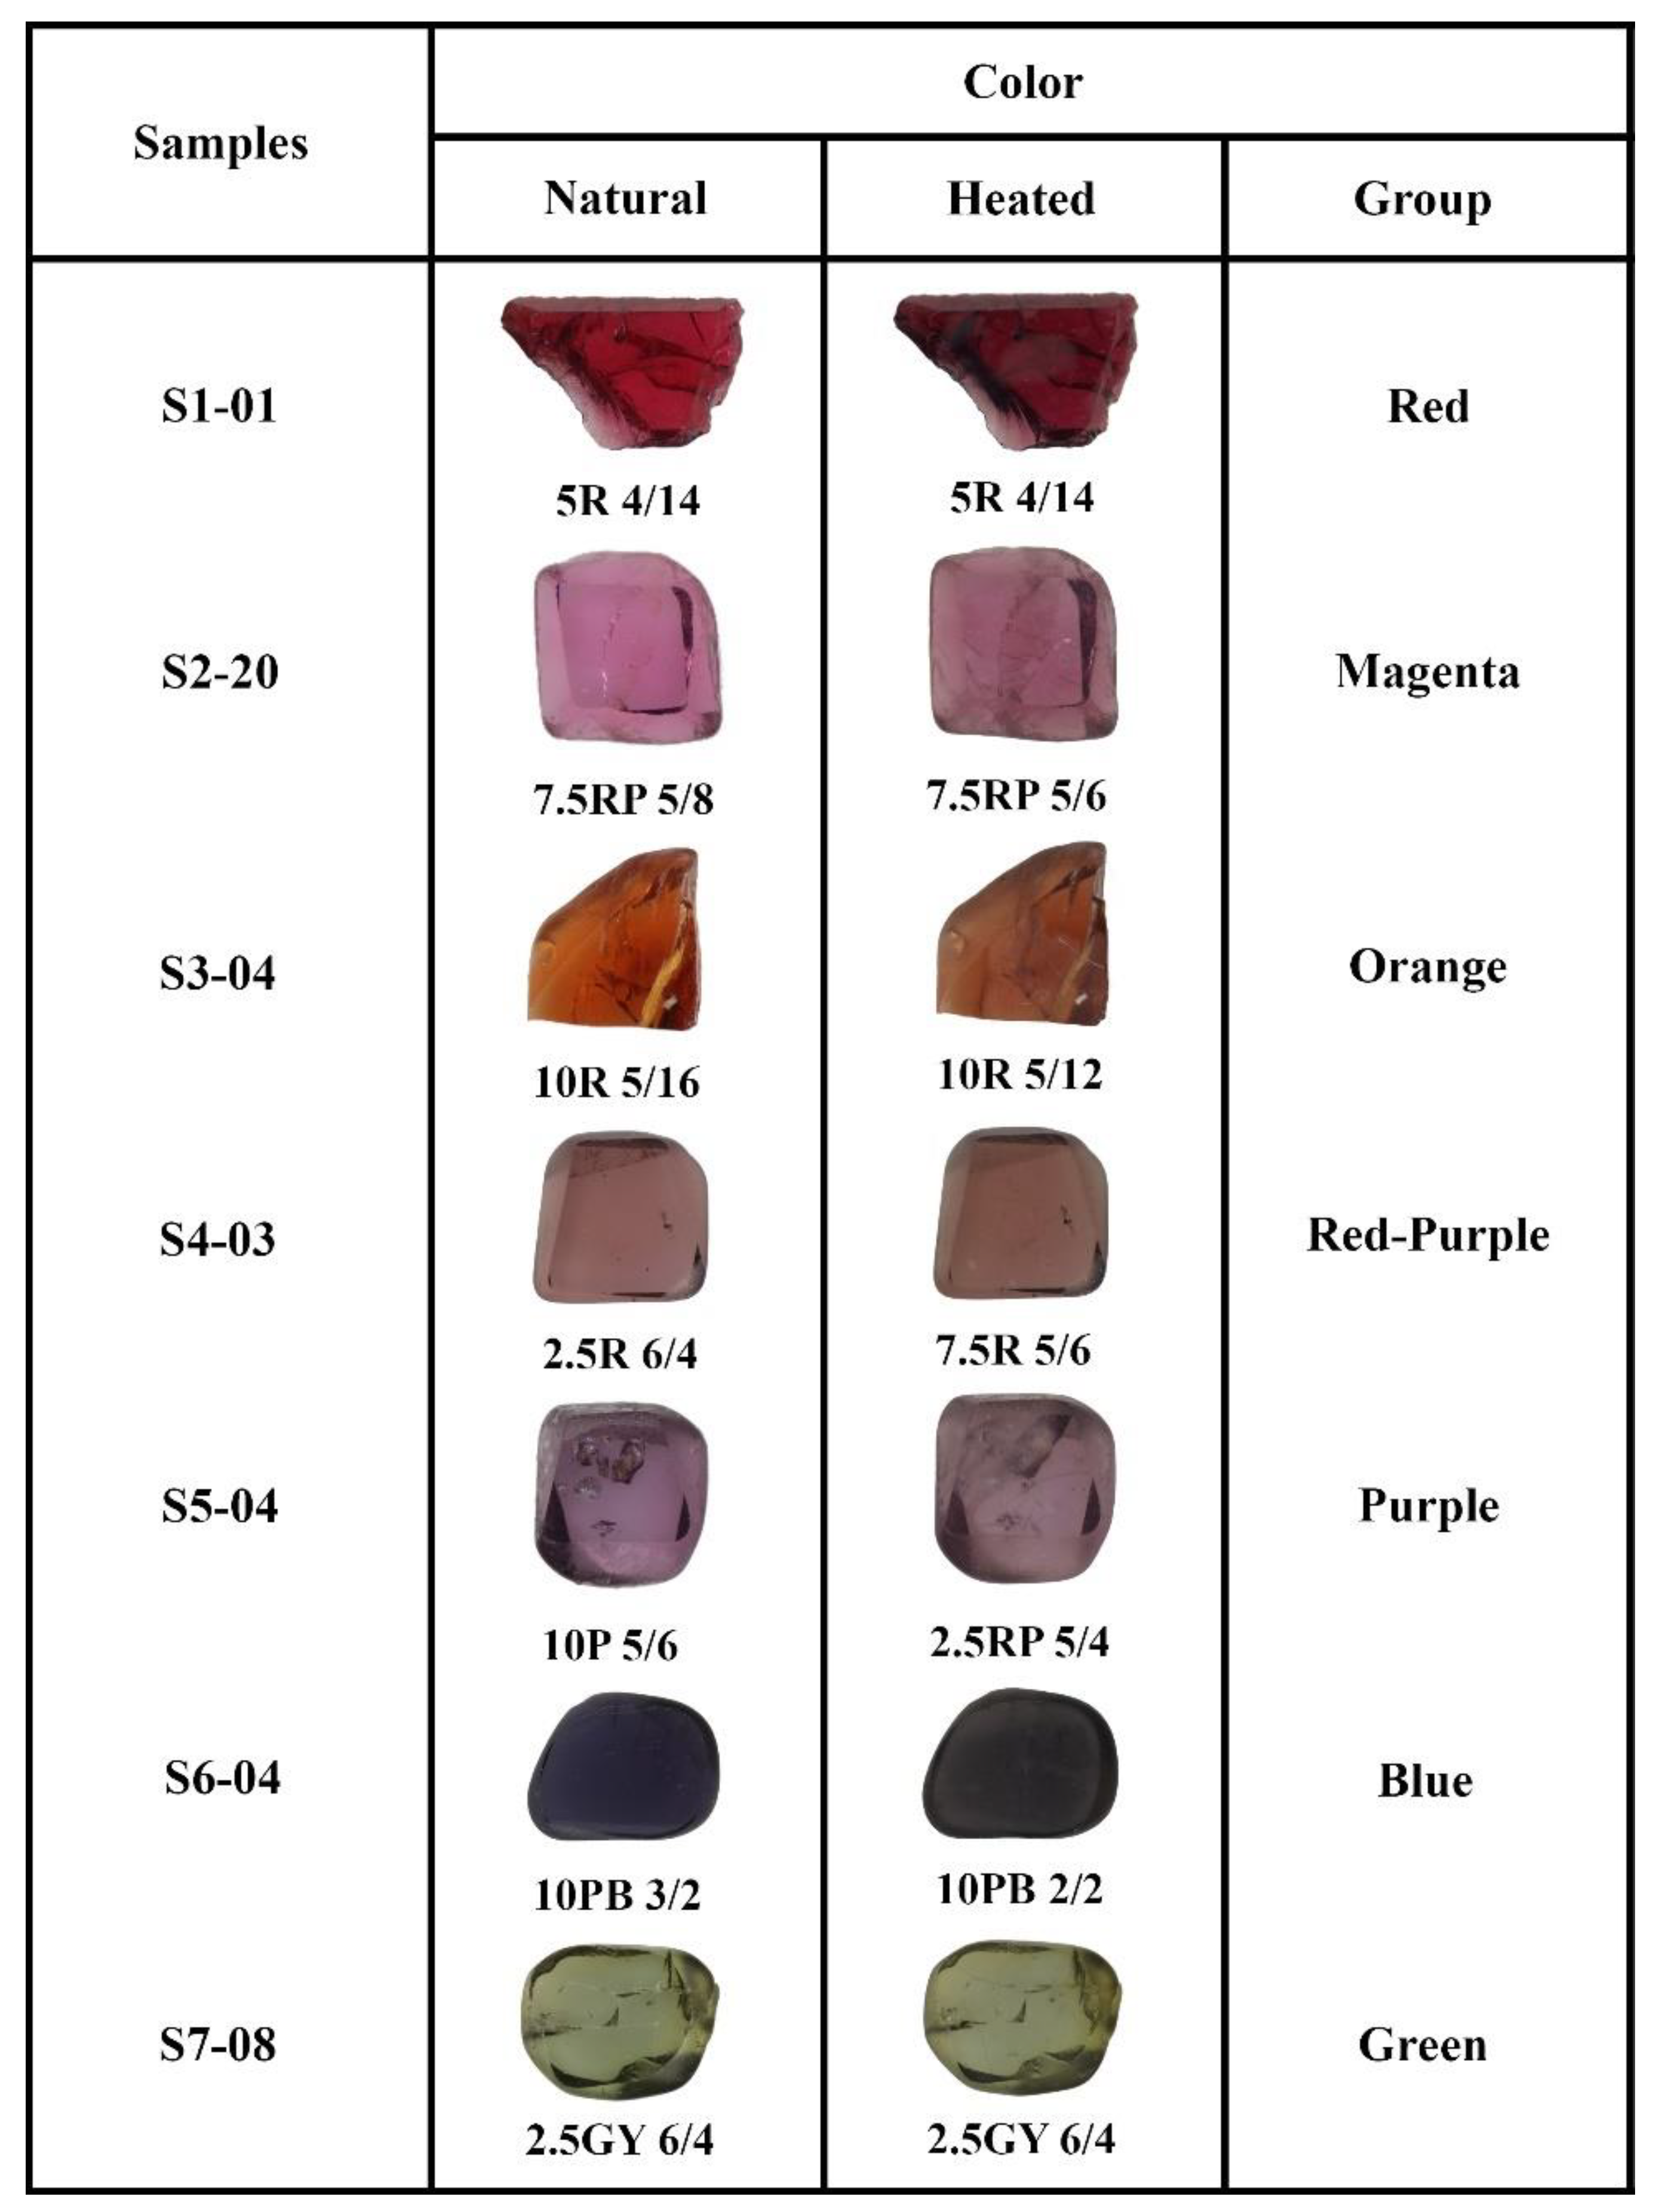
3.1. Physical Properties

Physical properties of all spinel samples are summarized in Table 2. They range from 0.33 to 4.68 carats in weight, with a specific gravity (S.G.) of 3.24–3.68. The Refractive index (R.I.) is within the range of 1.716–1.722. All samples are inert under short-wave UV light while some show red fluorescent under long-wave UV light.

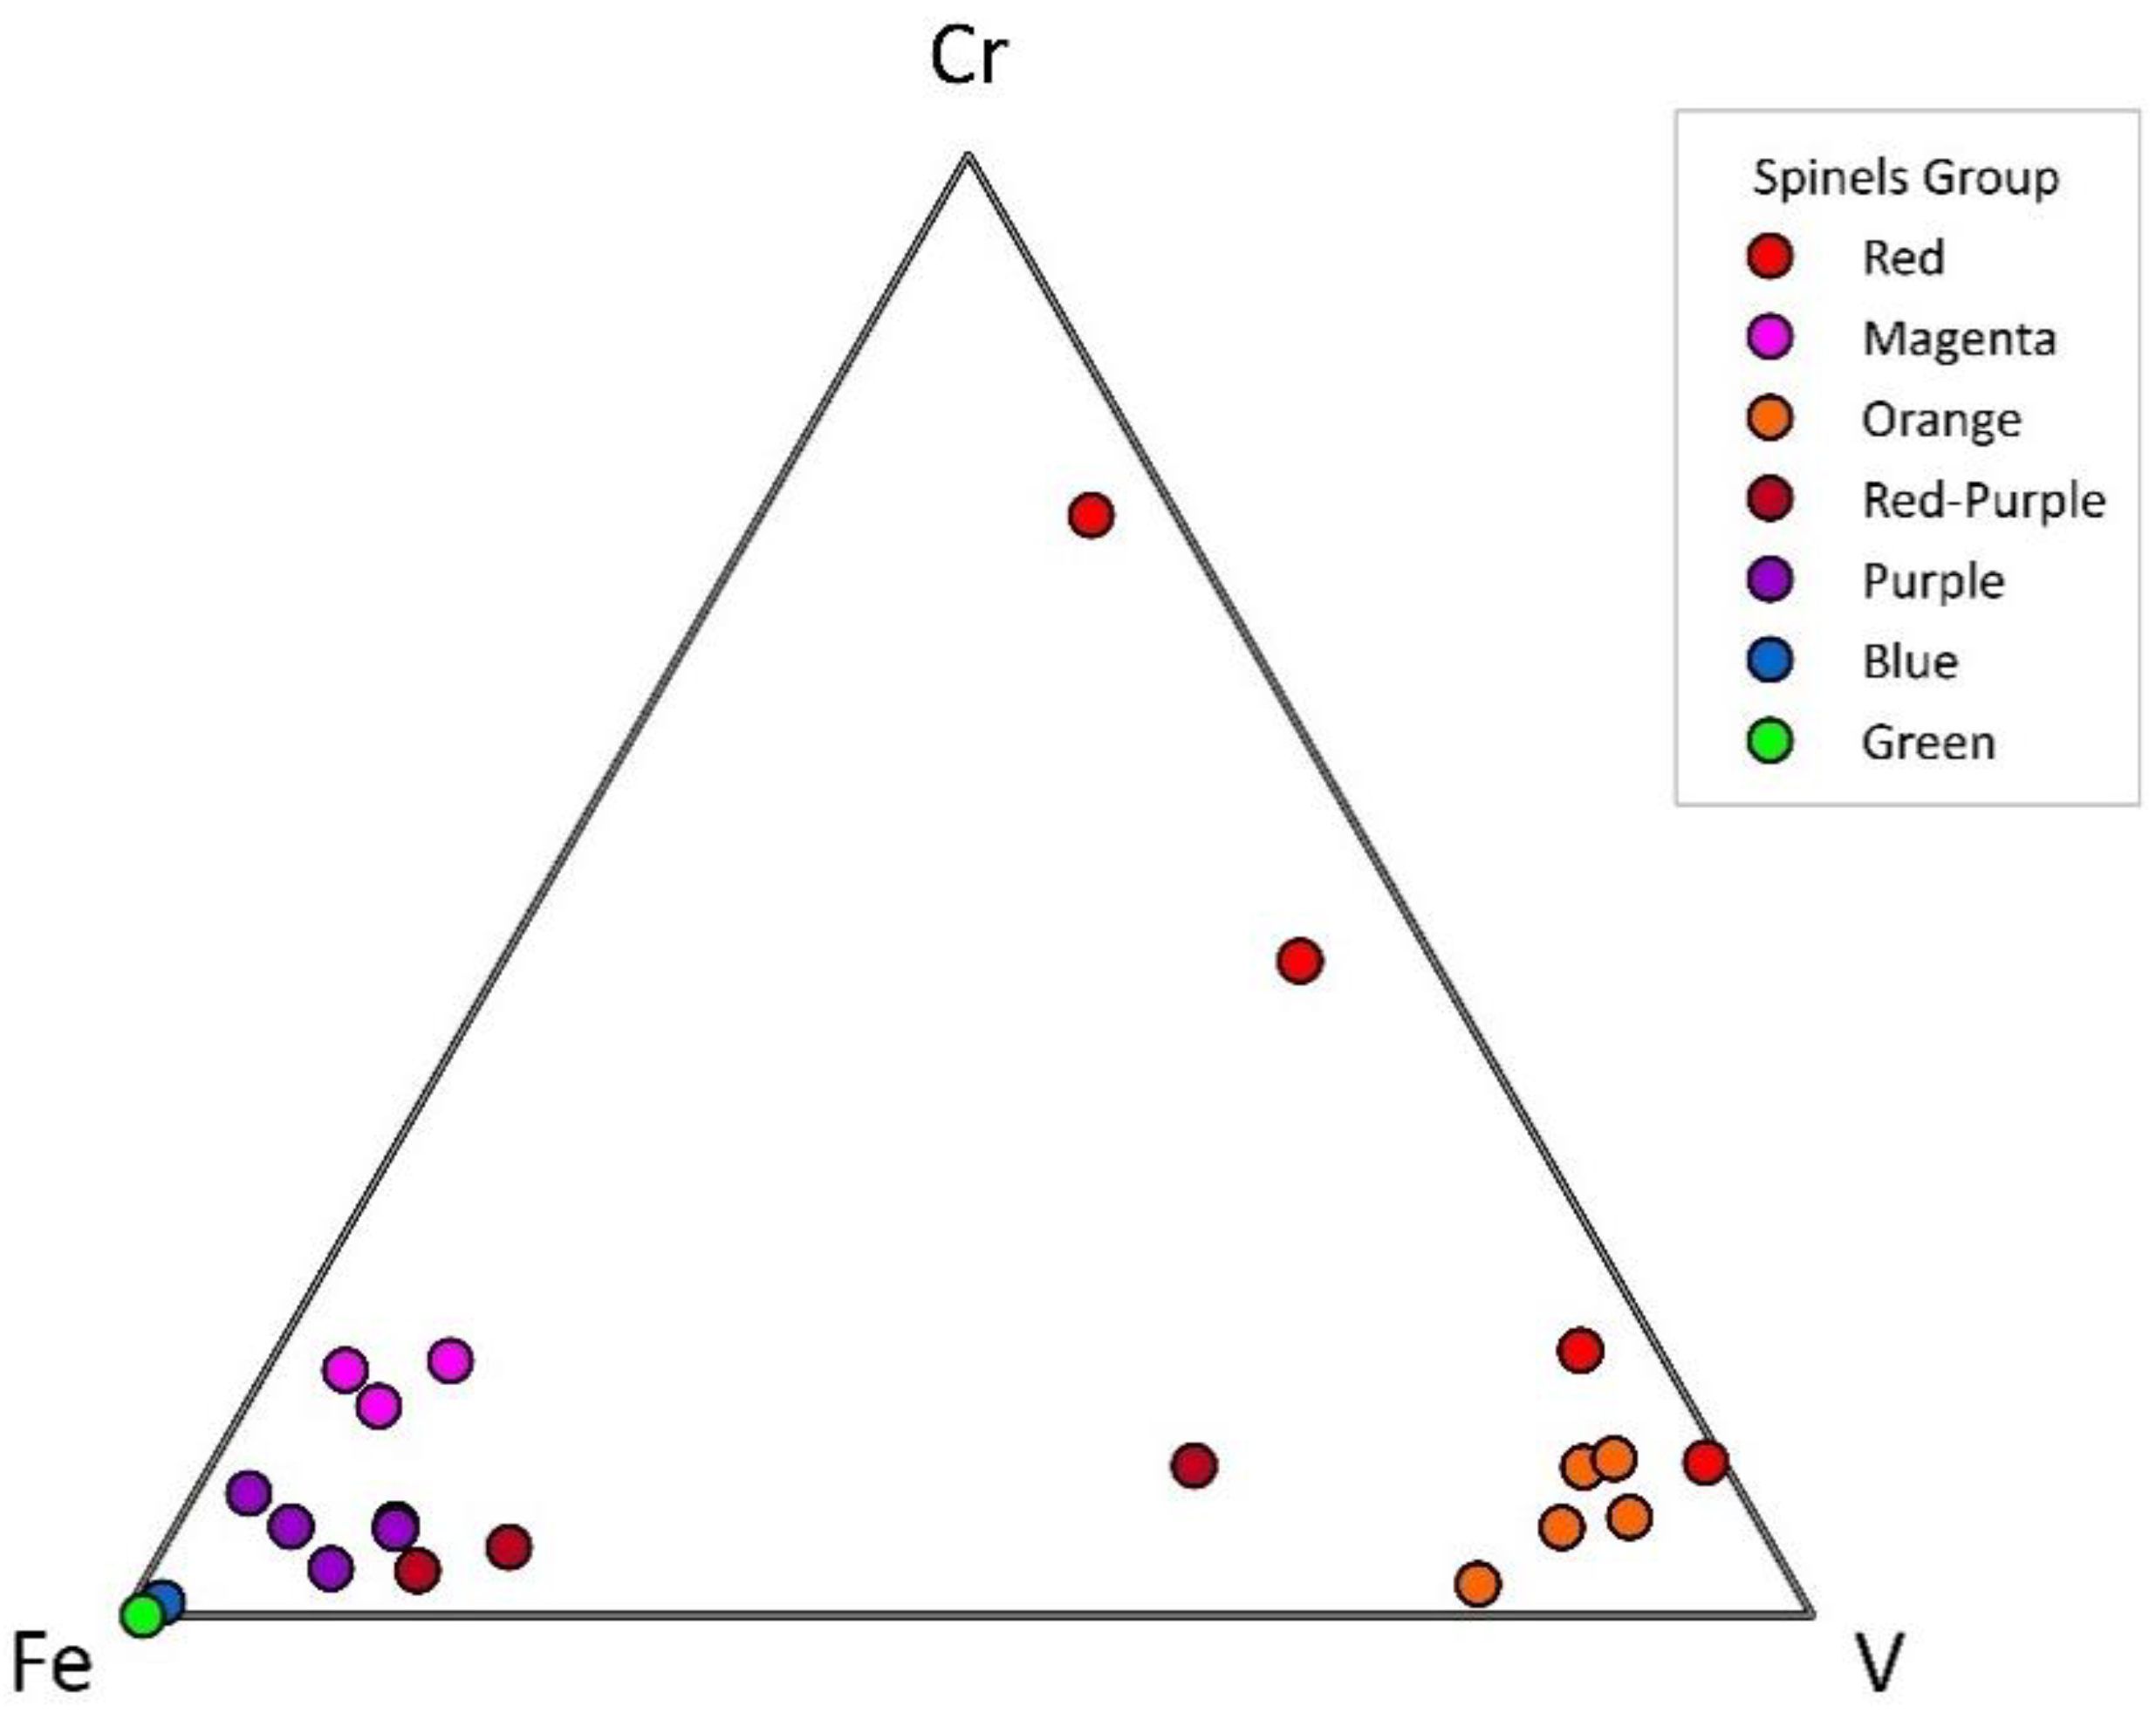
3.2. Mineral Chemistry

Major and some minor oxide compositions determined by EPMA are summarized in Table 3, along with their atomic proportions recalculated on the basis of 32 oxygen atoms which an ideal of 24 total cations is theoretically expected to allow 8 cations in A sites (four-fold coordination) and 16 cations in B sites (6-fold coordination), accordingly [18]. Based on EPMA analyses of spinel samples, MgO and Al2O3 contents range between 25.92–28.74 wt% (equivalent to 7.490–8.143 atoms per formula unit, apfu) and 68.90–70.97 wt% (15.642–16.058 apfu), respectively. Consequently, all spinels under this study generally present a summation of both main cations (Mg and Al) with an average of 23.980 apfu close to the ideal formula. Moreover, both cations could be allocated for A and B sites with aver-ages of 7.989 and 15.990 apfu, therefore, some minor and trace elements should be allowed to occupy the little vacancies in both sites, appropriately. These minor and trace components reveal various ranges in spinel collection as reported below. The highest average Fe content is recognized in blue spinel at 2.66 wt% oxides (0.432 apfu), followed by green, magenta, red-purple, purple, and red spinel group at about 1.14, 1.04, 0.92, 0.85, and 0.11 wt% oxide, equivalent to 0.183, 0.167, 0.147, 0.136, and 0.017 apfu, respectively. The lowest Fe content is observed in the orange spinel group on avg. 0.09 wt% oxide (0.014 ap-fu). The average Cr content of red spinel is 0.82 wt% oxide (0.125 apfu), followed by magenta spinels at avg. 0.23 wt% oxide (0.035 apfu), whereas much lower averages are recorded at 0.08 wt% (0.012 apfu) in red-purple spinels, at 0.07 wt% (0.010 apfu) in purple, at 0.06 wt% (0.009 apfu) in orange spinels, and 0.02 wt% (0.004 apfu) in blue spinel, respectively. On the other hand, Cr is undetectable in green spinel. V reveals the highest average oxide content of 1.05 wt% (0.162 apfu) in red spinels, followed by orange spinels at avg. 0.70 wt% (0.106 apfu), red-purple spinels at avg. 0.31 wt% (0.048 apfu), magenta spinels at avg. 0.11 wt% (0.017 apfu), purple and blue spinels at 0.08 wt% (0.012 apfu) and 0.05 wt% (0.008 apfu), respectively. On the other hand, green spinel yields the lowest V content of 0.01 wt% oxides (0.002 apfu) (Table 3).
Despite the high Cr concentration (avg. 0.82 wt% oxide, 0.125 apfu), V content (avg. 1.05 wt% oxide, 0.162 apfu) is equally high in red spinels. Therefore, both elements are ob-viously much higher than Fe (avg. 0.11 wt% oxide, 0.017 apfu). Orange spinels have the greatest V dominance (avg. 0.70 wt% oxide, 0.106 apfu) compared to Fe (avg. 0.09 wt% ox-ide, 0.014 apfu) and Cr (avg. 0.06 wt% oxide, 0.009 apfu). Magenta spinels reveal the great-est concentration of Fe (avg. 1.04 wt% oxide, 0.167 apfu) > Cr (avg. 0.23 wt% oxide, 0.035 apfu) > V (avg. 0.11 wt% oxide, 0.017 apfu). Red-purple spinels yield average oxides of 0.92 wt% Fe (0.147 apfu) > 0.31 wt% V (0.048 apfu) > 0.08 wt% Cr (0.012 apfu). Purple spinels present average oxides of 0.85 wt% Fe (0.136 apfu) > 0.08 wt% V (0.012 apfu) > 0.07 wt% Cr (0.010 apfu). Blue spinels contain average oxides of 2.66 wt% Fe (0.432 apfu) > 0.05 wt% V (0.008 apfu) > 0.02 wt% Cr (0.004 apfu), green spinel gives average oxides of 1.16 wt% Fe (0.183 apfu) > 0.02 wt% V (0.002 apfu) without Cr. It should be notified that blue spinels under this research seem likely Fe-related blue spinels instead of Co-related blue spinels. Thus, these spinel varieties can be categorized into two groups, Cr-V-related color spinels (i.e., red and orange spinels) and Fe-related color spinels (i.e., magenta, red-purple, purple, blue and green spinels).
Although, Ga and Zn yield the highest concentrations of 2.57 wt% oxide (0.314 apfu) and 1.02 wt% oxide (0.145 apfu) in a few samples, there are inconsistency in most spinel varieties (Table 3). Therefore, they might insignificantly relate to coloration in these spinels. In addition, other minor and trace elements with analyses lower than 0.2 wt% ox-ides, such as Mn, Co, and Ca, are negligible. In particular, Co content in the blue spinel of this study was below the detection limit of the analytical methods used.

3.3. Heat Treatment

At atmospheric condition with a maximum temperature of 1200 °C, orange spinels are visibly impacted by the heating. After heat treatment, the yellow saturation of the or-ange spinels is dramatically reduced. In general, red spinels appear to be darker (lesser in saturation and lightness), magenta and red-purple spinels exhibit minor shift toward red and/or purple. Purple spinels have lower purple saturation with higher yellow affinity. Blue spinels exhibit clearly shift toward grey (decreased brightness) whereas green spinel displays indiscernible change. Representative spinel samples and their color alterations are presented in Figure 1.

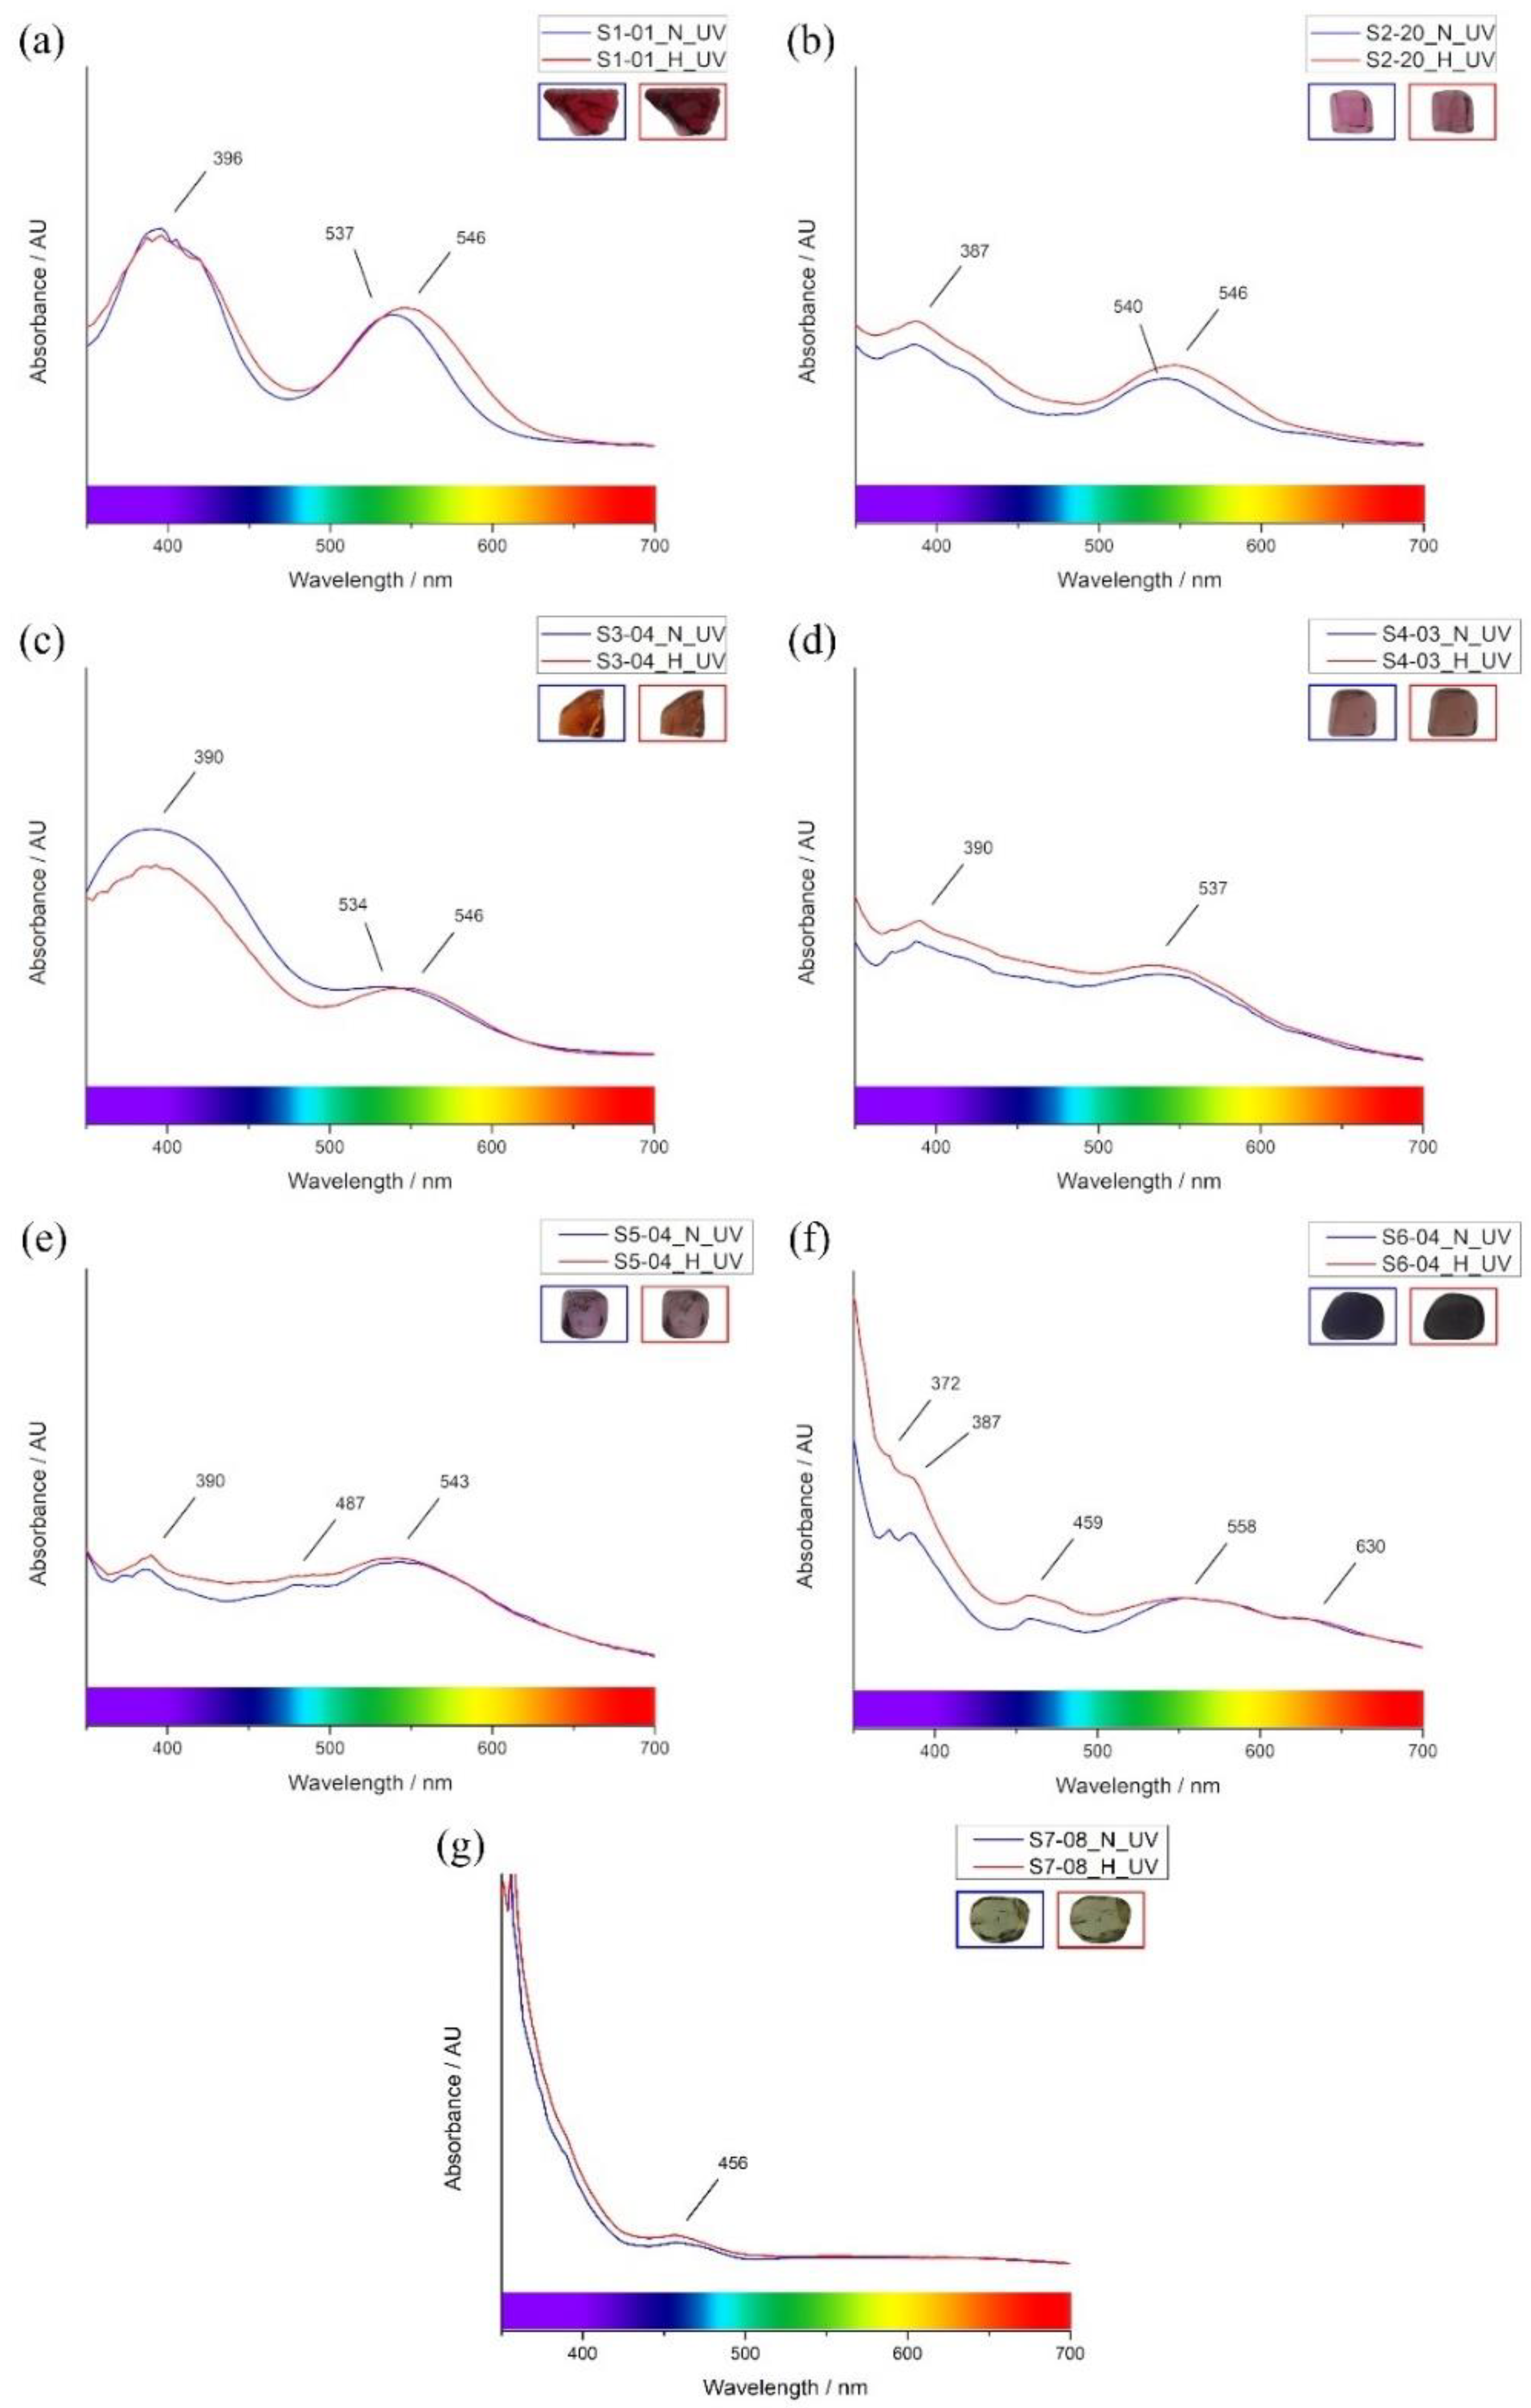
3.4. UV-VIS-NIR-Spectroscopy

Absorption UV-VIS-NIR spectra of natural and heated spinels are representatively shown in Figure 2. Natural red, magenta, and orange spinels (Figure 2a–c, respectively) reveal similarly two distinct absorption bands. Natural red spinels show absorption peaked at 396 nm and 537 nm which the later peak is significantly shifted to 546 nm after heating. Natural magenta spinels show absorption bands peaked at 387 nm and 540 nm; after heating, they turn to have higher intensity with significant shift of 540 nm absorption to 546 nm. Natural orange spinels show absorption peaks at 390 nm and 534 nm which obviously present the significant intensity decrease at 390 nm with very slightly shift and 534 nm absorption peaked to 546 nm without significant change in intensity. Natural red-purple spinel (Figure 2d) presents mostly comparable characteristics of two main absorp-tions of natural magenta spinels at 390 nm and 537 nm which clearly show intensity in-crease after heating. Natural purple spinel (Figure 2e) mainly yields absorptions at 390 and 543 nm with minor absorption at 487 nm whereas heated purple spinel turns slightly to greater absorption intensity covering the range of 390–543 nm. Blue spinels (Figure 2f) exhibit strong absorptions at 372 and 387 nm with a minor absorption around 459 nm as well as absorption bands centered around 558 and 630 nm; after heating, significantly higher absorption intensities of 372 and 387 nm, as well as 459 nm, are observed. Green spinel yields only little absorption around 456 nm which is likely unchanged after the heating experiment (Figure 2g).

3.5. Raman Spectroscopy

Raman spectra (Figure 3) of all spinel samples reveal similar patterns of four peak positions at around 306–311 cm−1, 406 cm−1, 665–672 cm−1, and 762–768 cm−1. Moreover, the natural green spinel presents a small additional peak position at around 719 cm−1.
After heating, all spinel varieties still show the same peak positions, however, their intensities seem slightly decreased and broadened, especially the main 406 cm−1 peak. This peak expanded its width in most cases (Figure 3a) except for green spinel (Figure 3b). Consequently, the full width at half maximum (FWHM) of the 406 cm−1 peaks is widened with averages of 11.10 cm−1 in purple spinels up to 17.01 cm−1 in red spinels after heating. Magenta, orange, red-purple, and blue spinels also reveal extension of FWHM with averages of 13.72 cm−1, 14.62 cm−1, 11.49 cm−1, and 12.51 cm−1, respectively, after the heating experiment. On the other hand, the green spinel (Figure 3b) shows FWHM of the 406 cm−1 peak shrunken around 1.69 cm−1 after heating. In addition, a tiny peak appears between 712–726 cm−1, such as 715 cm−1 in red spinel (Figure 3a), which may be evidence of heating in most spinel varieties except for green spinel which such peak (719 cm−1 in Figure 3b) appears before and after (716 cm−1) heating.

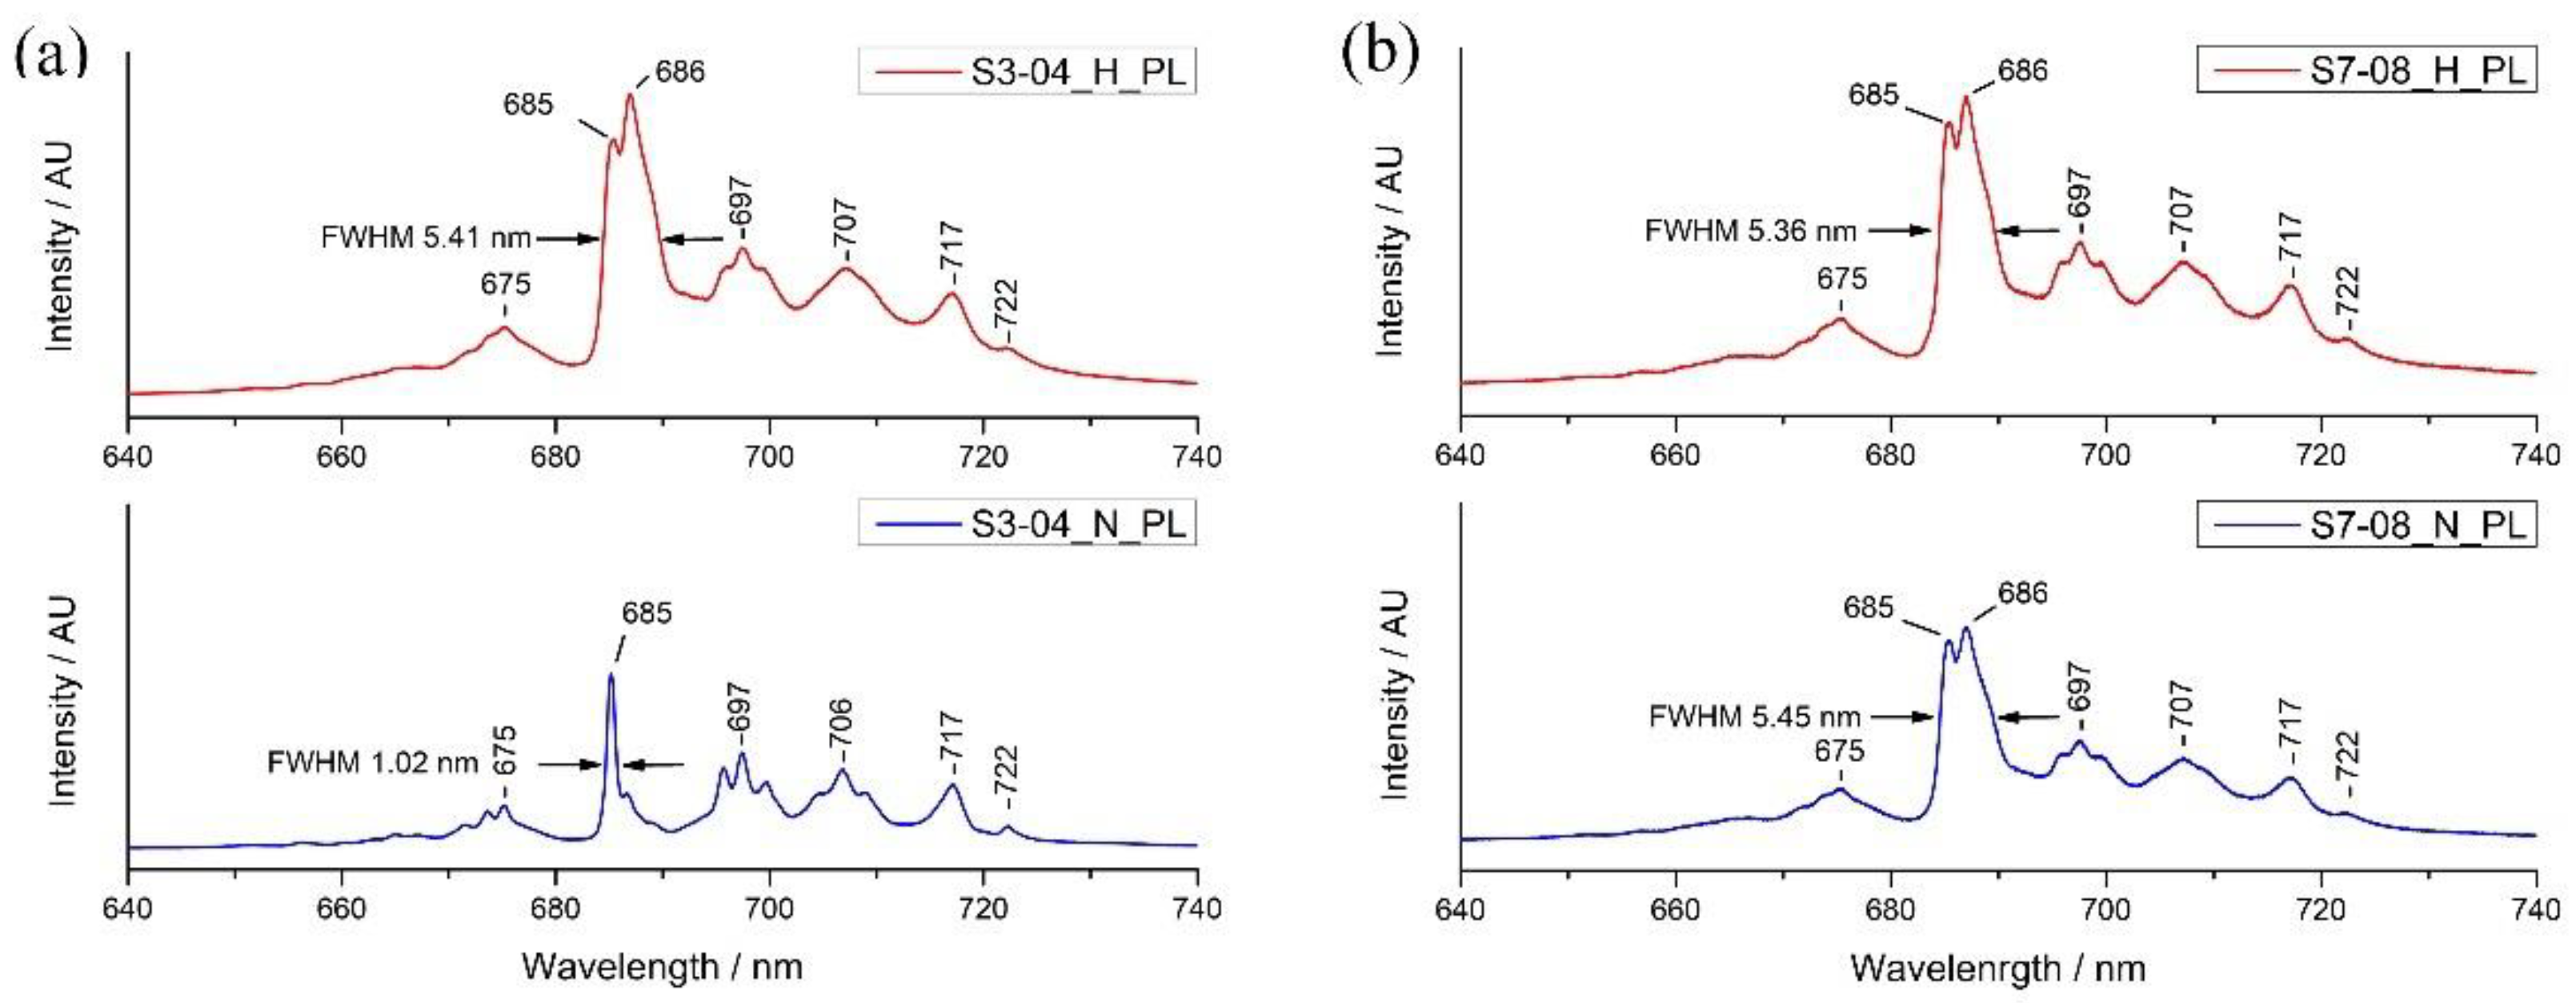
3.6. Photoluminescence Spectroscopy

The photoluminescence (PL) spectra capture the narrow peaks of trace Cr3+ around 685 nm in most natural spinel samples (red, magenta, orange, red-purple, purple, and blue), however, green spinel rather shows a broader peak at 686 nm (Figure 4b, blue line). Other peaks centered about 675, 697, 706, 717, and 722 nm present in all spinel varieties.
Heating effects a broader FWHM and a little shift from 685 to 686 nm of the main peaks in most spinels, as an example of orange spinel sample (S3-04) shown in Figure 4a. Other small peaks located at about 675, 697, 706, 717, and 722 nm are less structured and unsharp after heating (Figure 4a, red line). The exceptional case is recognized in green spinel which both patterns of natural and heated stone exhibit comparable characteristics of broader FWHM of the 686 nm dominant peak and unsharp structure of the other additional peaks (Figure 4b).

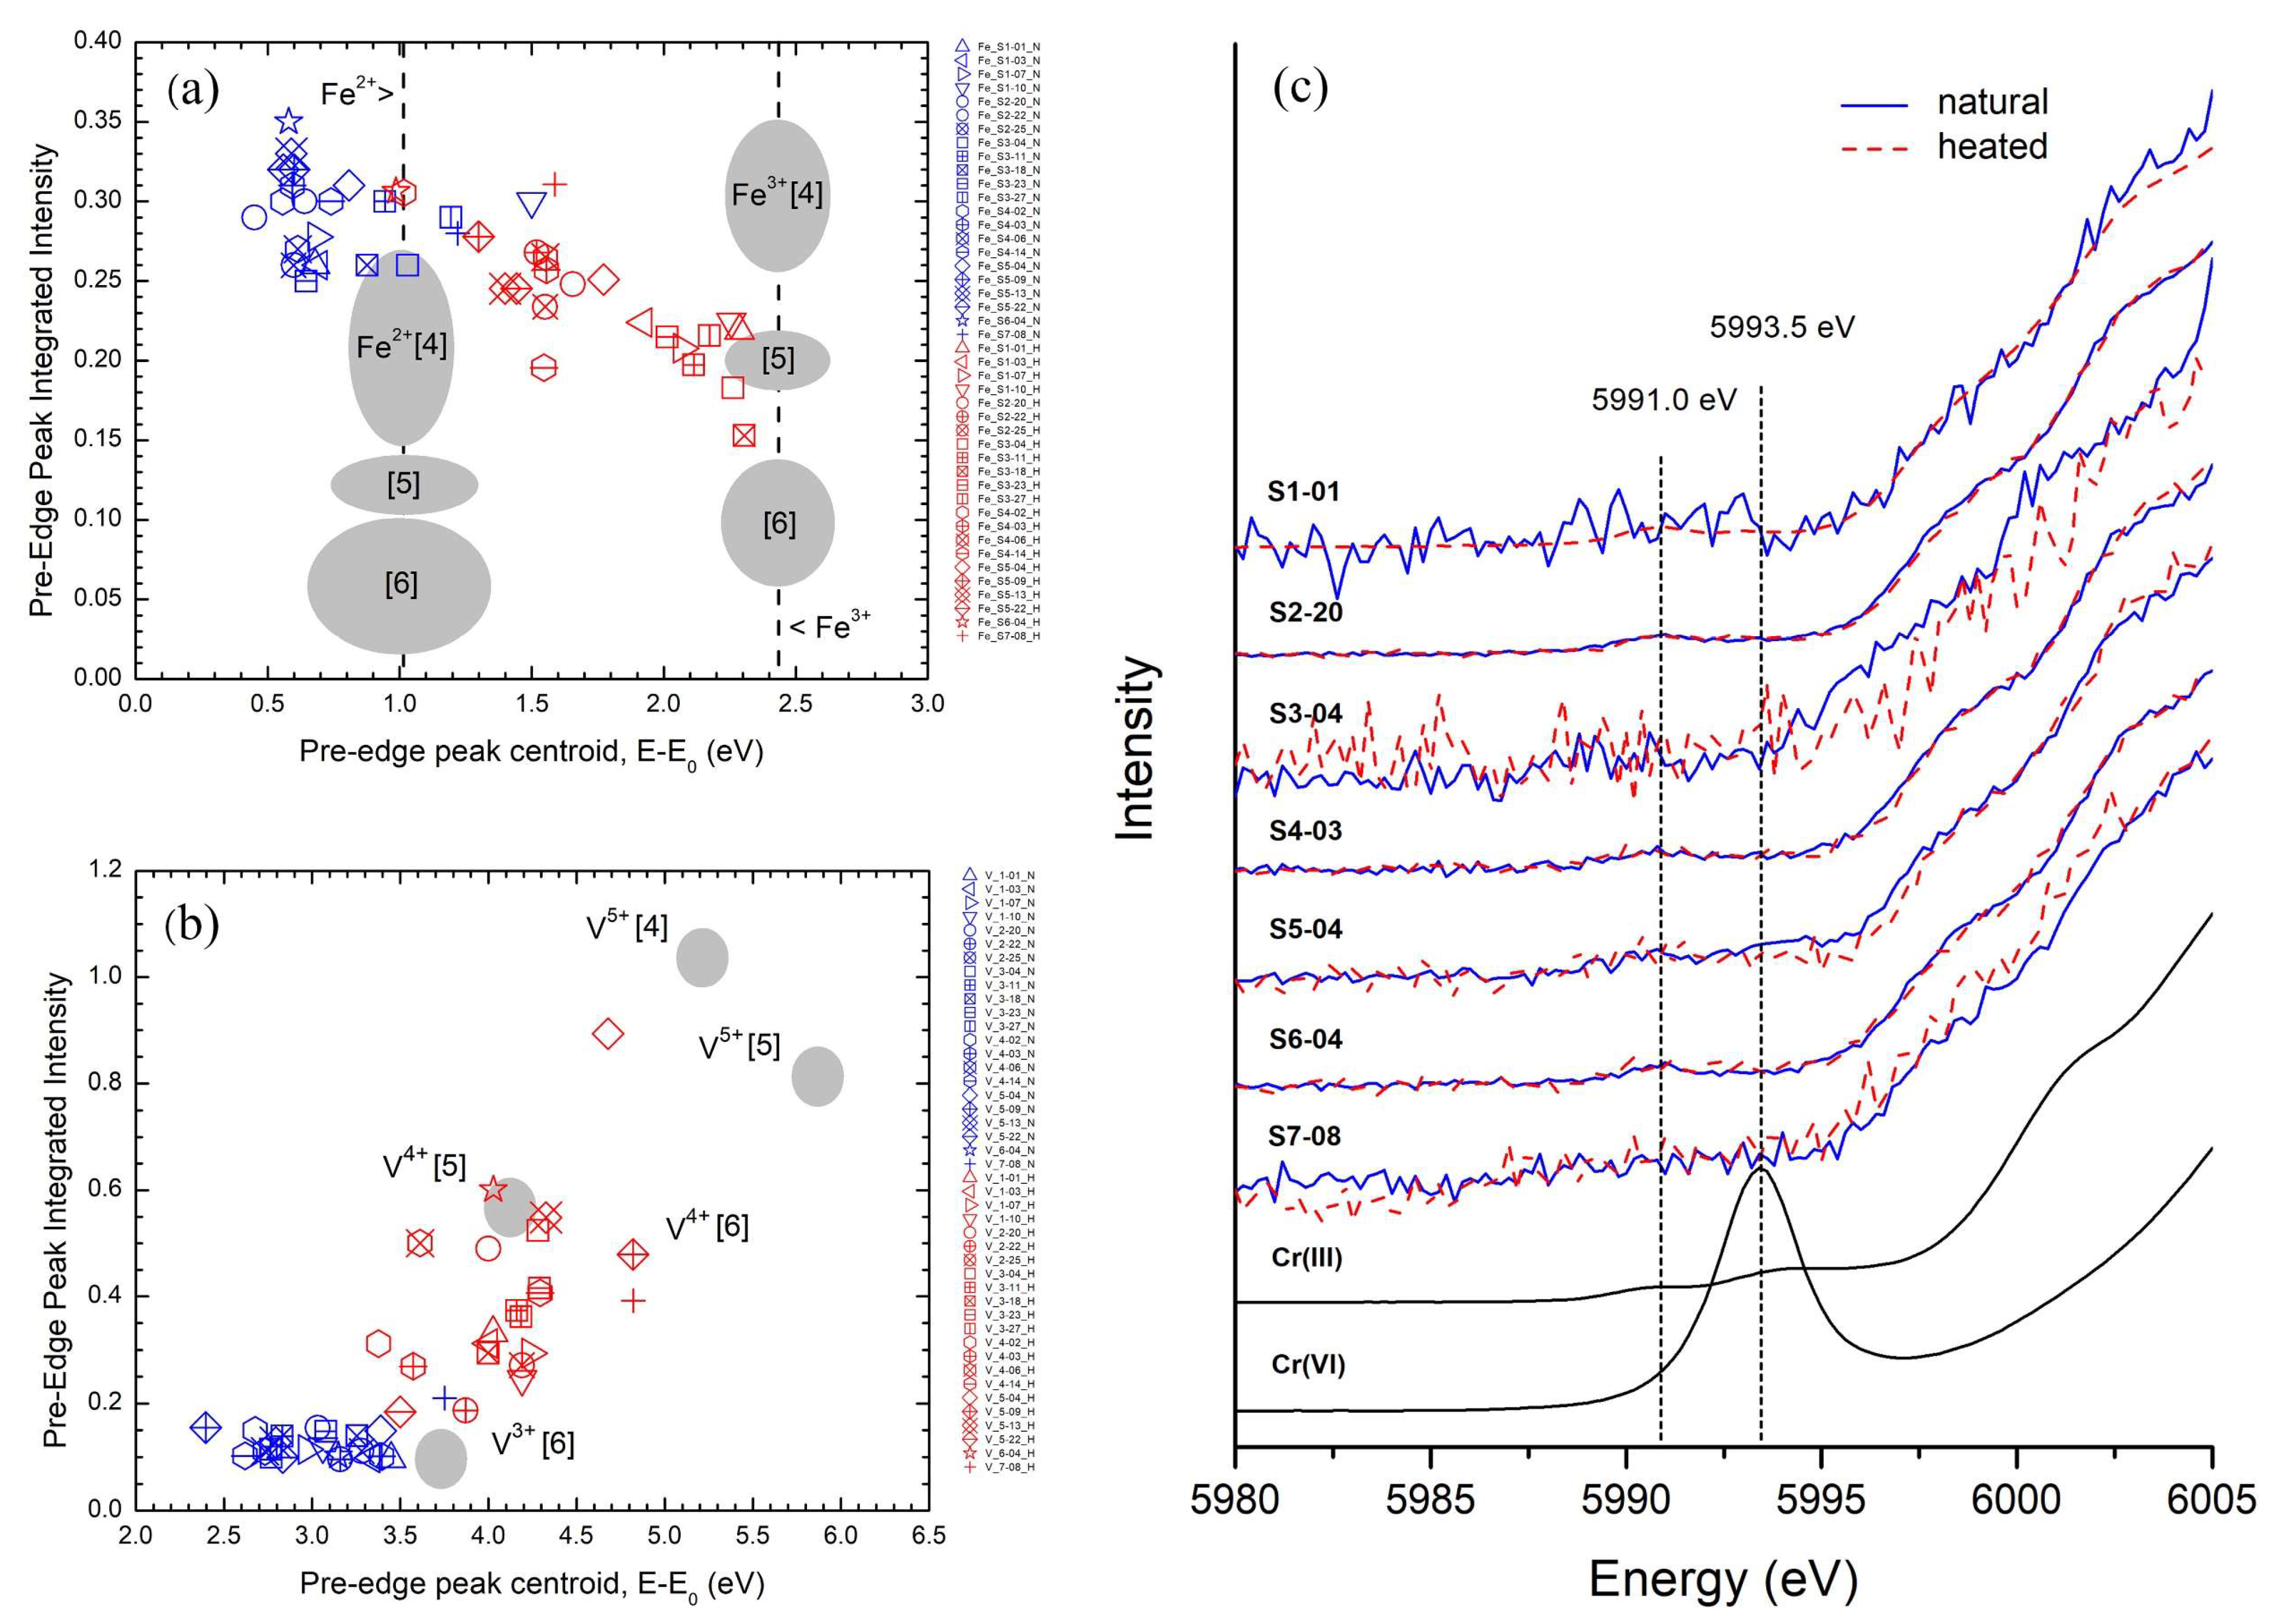
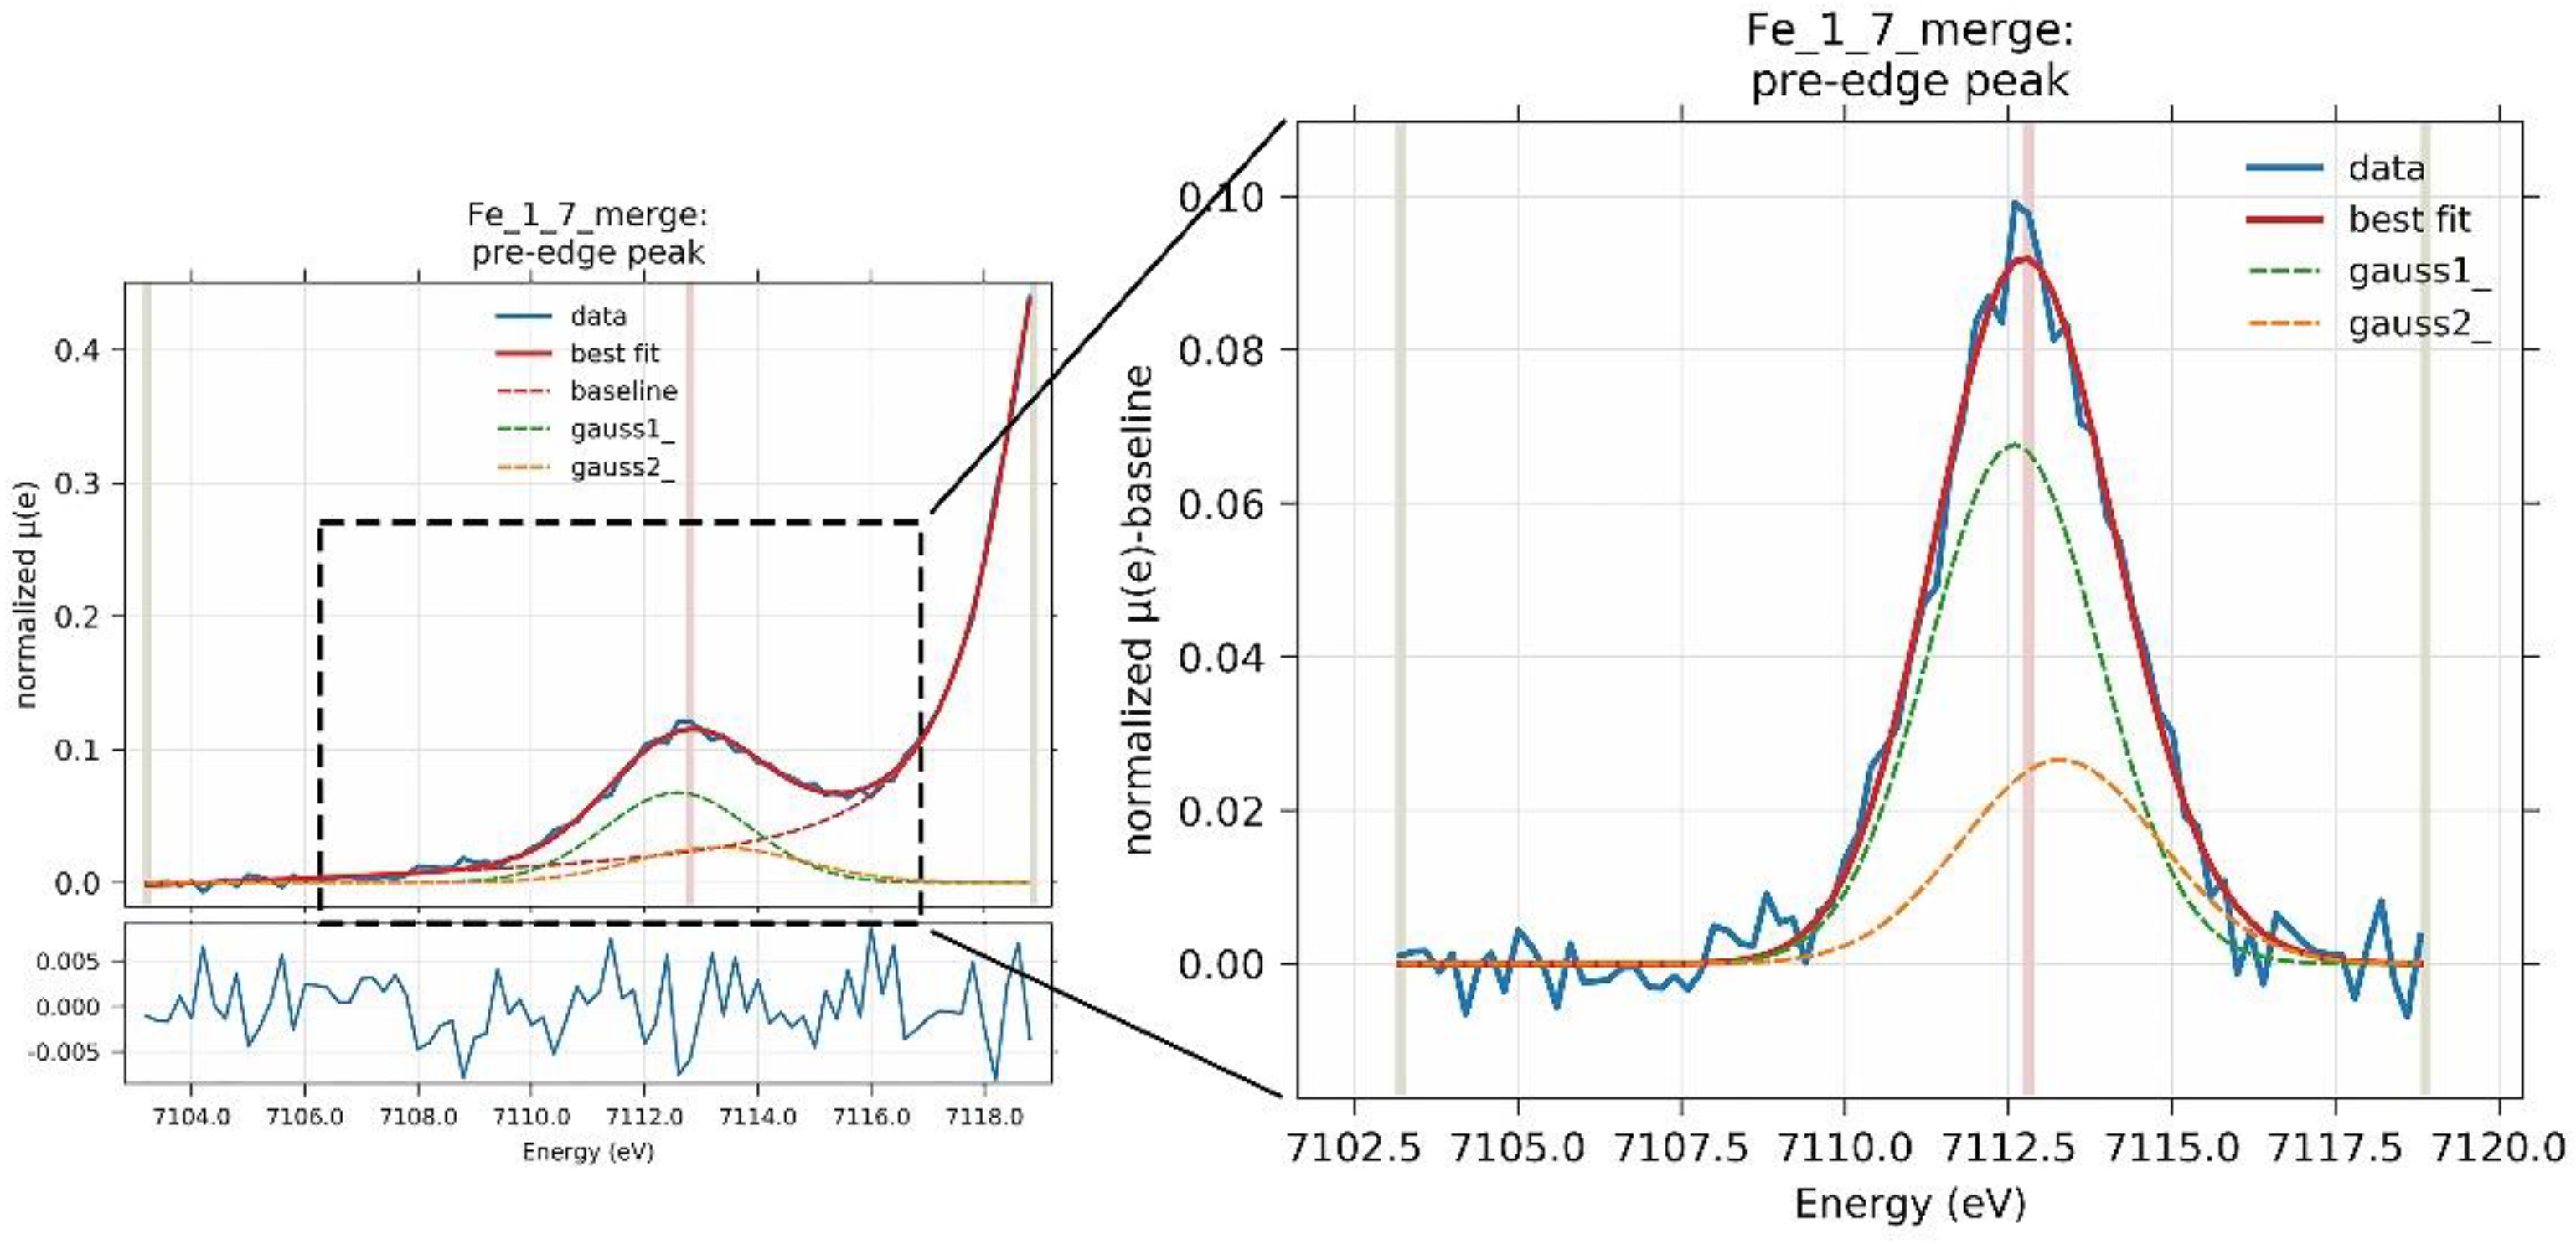
3.7. X-ray Absorption Spectroscopy (XAS)

XANES spectra are obtained from all 22 spinels of 7 varieties, as well as standard materials such as Fe-foil, Cr-foil, V-foil, Fe(II), Fe(III), Cr(III), Cr(VI), V(III), and V(IV) model compounds. The properties of pre-edge absorption are important to assess the oxidation state and coordination number. Using the XAS Viewer application [41], the centroid position and integrated intensity of pre-edge XANES spectra are determined to stimulate different valency model compounds and their pre-edge peak compositions. Figure 5 depicts the result of Fe pre-edge composition by the XAS Viewer program. In addition, the fluctuation in oxidation state and its symmetry for Fe and V are displayed as shown in Figure 6a,b, respectively.
K-edge XANES spectra of Fe, Cr, and V of spinels are analyzed in order to correlate the characteristics of the pre-edge feature with the oxidation state and coordination number of the investigated atoms by comparing them to various model compounds [38,40]. The pre-edge feature is related to the metal electronic transitions 1s → 3d (quadrupolar) and/or 1s → 4p (dipolar) [44], and its position shifts toward higher oxidation state [30,38,39,45].
Numerous previous researchers examined the V XANES spectra of oxides and other crystalline compounds and showed the presence of a pre-edge peak whose intensity and energy related to the valency [31,34,43,44,46,47,48,49,50,51]. Because the pre-edge intensity is primarily determined by the dipole selection rule, increasing intensity is a result of increased transition dipole moments [48]. This may be explained based on the greater mixing of V p-orbital character into the 3d acceptor orbitals, and these data provide two critical mechanisms for regulating the p–d mixing. Since the V ions occupy octahedral vacancies in the lattice, the V–O bonds compress as a result of an enhanced Coulombic attraction when the V ions are oxidized. Because of the shorter bonds, p–d mixing is more effective resulting in a greater pre-edge intensity and a higher oxidation state as suggested by previous researchers [47,48,51]. For this reason, it is hypothesized that V3+ is localized in highly symmetrical octahedral sites in spinel, based on the low intensity of the pre-edge characteristic [44].
The most basic approach for determining V valency is plotting pre-edge absolute energy (eV). Several valences superimpose the absorption edge, allowing oxidation state determination problematic [31]. In fact, prior researchers developed more advanced methods for determining the oxidation state and symmetry of V. Farges et al. [42] established the pre-edge modeling fitting by Lorentzian function, which has also been utilized to estimate titanium symmetry and valency. Giuli et al. [34] then established the contribution of various V states on pre-edge integrated intensity and centroid position. Subsequently, Chaurand et al. [31] devised a pre-edge modeling fitting using pseudo-Voigt to determine mixed oxides and site symmetry which was applied to this research.
Peterson et al. [36,37] measured the Cr3+:Cr6+ ratio in complex oxide samples using several methods and suggested that either peak height or peak area may be used to compute the Cr6+/total Cr content. Huggins et al. [35] reached similar model-fitting findings on Cr pre-edge information, valency, and symmetry (Pseudo-Voigt fitting). Although several methodologies have been introduced by many researchers that pre-edge features relate to dipolar and quadrupolar transitions from the metal 1s core state to metal 3d with some contribution from 4p depending on the local symmetry, their intensity and energy are likely dependent on the metal cation valency and site symmetry [13,32,33,35,52,53,54,55,56,57]. Cr oxidation and site symmetry could simply be determined by Peterson’s initial method since the characteristics of Cr3+ and Cr6+ are distinct. Examining the pre-edge height (1s → 3d electronic transition) and position (eV) in Cr pre-edge XANES spectra is likely the simplest method [36,37,52].
Cr pre-edge XANES speatra of spinel samples in this research reveal a small absorption peak at approximately 5991.0 eV and likely without a second peak, which is consistent with Eeckhout et al. [52]. The only significant feature appears around 5990.6 eV for a chromite (Cr3+) sample. Cr3+ has octahedral symmetry, centrosymmetric geometry, no p–d mixing allowed, and a d3 electronic configuration, whereas Cr6+ has tetrahedral symmetry, non-centrosymmetric geometry, p–d mixing allowed, and a d0 electronic configuration, which correspond with the pre-edge XANES position around 5993.5 eV. It is assigned to a bound state 1s → 3d transition [36,37,52]. The remarkable intensity of this Cr6+ pre-edge peak is attributed to oxygen 4p mixing into metal 3d orbitals, providing the transition 1s →4p character. Moreover, since this electric dipolar coupled mechanism is significantly stronger than the electric quadrupolar coupled mechanism, even a tiny quantity of 4p mixing into the 3d orbitals may have a large impact on the pre-edge peak intensity [45]. It should be noted that the Cr pre-edge XANES intensity and absolute position of Cr3+ and Cr6+ XANES spectra are considerably different (~3 eV) and are not overlaid with one another; additionally, several prior studies have also reported Cr3 [6] in spinels [13,32,33,54].
Thus, according to our XAS results, natural (unheated) spinels indicate that the Fe2+ occupied the tetrahedral site (TFe2+) of Mg in all colored spinels and increased in valency while occupying the octahedral site (MFe3+) upon heating in the majority of spinels (see Figure 6a). Vanadium is present as V3+ in Al-octahedral site (MV3+) in all spinels and increased its oxidation state to MV4+ in accordance with [31,46,47,48,51] (Figure 6b). Chromium is presented as Cr3+ in Al-octahedral (MCr3+) site in all spinels and no substantial change in the pre-edge is seen upon heating, indicating that no valency change (Figure 6c). Cr pre-edge XANES spectra of all colored spinel groups locate at around 5991.0 eV where standard Cr6+ compound demonstrates exceptionally high intensity at around 5993.5 eV which approximately ~2–3 eV apart from each other. In summary, the Fe oxidation state of natural spinel is shown as Fe2+ and mostly increased their valency upon heating (Figure 6a), except for green spinel which likely present little to no change. The V oxidation state of natural spinel is V3+ in all spinel groups, but they dramatically increase to a greater valency after heating in majority of samples (Figure 6b). On the other hand, the Cr XANES spectra of all samples are simply normalized to determine the Cr-valency and symmetry. However, Cr appears to be unchanged in most spinel groups after heating which it identically presents as Cr3+, as revealed in Figure 6c.

4. Discussion

4.1. Color-Causing Elements

As reported in the mineral chemistry, Fe, Cr, and V appear to be the major chromophores of spinel varieties. Their elemental ratios are displayed in a ternary diagram (Figure 7), which graphically demonstrates that red and orange spinels are more closely associated with Cr and V contents, respectively, while the others (magenta, red-purple, purple, blue, and green) are more generally associated with a greater Fe component. As a result, Fe is more dominant and is more likely to be associated with the purple, blue, and green colors. V is likely responsible for orange-colored spinels due to its highest ratio compared to Fe and Cr. However, V and Cr are almost certainly involved in the red color, with equally high contents of both elements tending to cause red. On the other hand, lower Cr may appear orange-red. Our finding agrees well with the observation of Andreozzi et al. [7] which suggested that high V content induces orange but high Cr content influences red in spinels. Therefore, two groups of spinels, including Cr-V-related color spinels (red) and orange) and Fe-related color spinels (magenta), red-purple, purple, blue, and green) will be discussed further.
Noteworthy correlations between certain absorption peaks in UV-visible spectra and the color of spinels are summarized in Table 4. There are several absorption positions, commonly including 372, 390, 459, 487, 537, 558, and 630 nm, but not all features present in the sample group. For example, absorption centered around 372 nm is observed particularly in red-purple, purple, blue, and green, whereas 390 nm absorption obtains from all colored spinel groups. Absorption band centered around 537 nm can be observed in red, magenta, orange, red-purple, and purple. On the other hand, absorption bands ranging from 558 to 630 nm seem specifically in blue spinel.
Red and orange (Cr-V-related) spinels exhibit two distinct sorts of strong absorption. The primary absorption bands at 387–396 and 534–546 nm (corresponding to violet-blue and green-yellow, respectively, in visible spectrum) originate from superimposition of the absorption spectra of V3+ and Cr3+ in an octahedral site [7]. The absorption bands centered around 387–396 nm and 534–546 nm are attributed to spin-allowed electronic d-d transitions 4A2g4T1g(F) and 4A2g4T2g(F) in MCr3+ for red spinel but induced by spin-allowed d-d transitions 3T1(F) → 3T1(P) and 3T1(F) → 3T2(F) in MV3+ for orange spinels, respectively [7].
Additionally, magenta (Fe-related) spinels exhibit two distinct absorption bands at 387 nm (violet-blue range) and 540 nm (green-yellow regions). These characteristics are comparable to those of red spinel. There are relatively few discrepancies in the absorption spectra of orange, red, and magenta. Orange and red samples have nearly identical absorption bands, but the orange samples are V3+ dominant [7], and the absorption bands are slightly different in position and width. This results in a blue shift of the absorption, or a greater absorption of the violet-blue and green regions, leading to more efficient light transmission in the yellow-orange-red region. In contrast, red/magenta Cr-dominant spinels have a substantially greater band intensity, which means that light in the violet-blue and yellow-green visible areas is severely absorbed, whereas light in the red part of the spectrum is more effectively transmitted. Magenta (might be sometimes referred to as pink) samples have a remarkably similar absorption spectrum to red samples, with both being absorbed by bands associated with Cr3+ and minor Fe cations. The variations in the absorption spectra of magenta and red samples are entirely attributable to the chromophore cation concentrations, with red samples containing more Cr3+ and having more prominent absorption bands, which results in a greater saturation of the red hue. In comparison to red samples, magenta spinels are deficient in Cr3+ and comparatively rich in Fe, resulting in less intense absorption bands and a relatively intense low-energy tail of the UV absorption band owing to ligand-to-metal charge transfer (LMCT) O2− → Fe2+ [7]. Light absorption is weaker in the visible spectrum than it is in the red samples, hence two transmission windows exist for the blue and red visible region.
Despite their disparate appearances, the remaining Fe-related spinels, including red-purple, purple, blue, and green, have comparable absorption spectra. UV-edge to violet absorption with a particularly high intensity is induced by O2− → Fe2+ and O2− → Fe3+ charge transfer transitions which result in considerable absorption in violet-blue region. The absorption mostly around UV (including 372 and 387 nm) is attributed TFe2+ [58] spin-forbidden transitions 5E(D) → 3E(D), and 5E(D) → 3T2(G), respectively, and might be amplified by T Fe2+-M Fe3+ ECP transitions [19]. Another absorption band around 456 and 487 nm that presented in purple, blue, and green spinels are assigned to spin-forbidden transitions 5E(D) → 3E(G), 3T2(F), 3T1(F) of TFe2+ [27,58,59,60,61] whereas the other researchers ascribed to spin-forbidden 6A1g4A1g, 4Eg transitions of isolated MFe3+ ions [61], and to ECP interactions 6A1g4A1g, 4Eg in TFe3+-M Fe3+ clusters [59].
Blue spinels exhibit a variety of absorption bands around 372 nm and 387 nm (violet region), 459 nm (blue region), and 558–630 nm (green-yellow-orange region). Absorption band at approximately around 459–460 nm was also suggested by Andreozzi et al. [7], and in agreement with Andreozzi et al. [59] and Taran et al. [61], that it probably relates with MFe3+ which contradicts earlier suggestions [27,58,59,60,61]. However, Taran et al. [61] proposed both Fe2+ and Fe3+. Although the band between 487 and 580 nm is inconsistent, it has been attributed to spin-forbidden transitions of TFe2+ [7,11,27,62]. Absorption at 558 nm is attributed to spin forbidden transition 5E(D) → 3T2(H) of TFe2+ [27,58,60,61]. Additionally, absorption around 588 nm may be owing to spin-forbidden transitions 5E(D) → 3E(H) of isolated TFe2+ ions [60,61]. Lastly, Fe2+-Fe3+ IVCT and/or Fe2+-Fe3+ ECP interactions should be responsible for absorption around 666 nm [60,63]. 545–625 nm broad band absorption is seen solely in blue-colored spinels, which was suggested as cobalt-related absorption [2,19,27,28,64], despite the fact that our blue spinel sample demonstrated no evidence of cobalt. Green spinel exhibits strong UV-edge absorption in the violet and blue regions of the visible spectrum, which may play a role of O2− → Fe2+ and O2− → Fe3+ charge transfer transitions [7,27,61] as well as MFe3+ absorption at 456 nm, which increased very slightly upon heating [7,27,58,59,60,61].
After heating, significant to minor color alteration can be observed in the red, magenta, orange, red-purple, purple, and blue, on the other hand, green appears to be unchanged. The Fe-related color spinels, including magenta, red-purple, purple, and blue mostly show higher absorption around the violet-blue region (372, 387–390, 457–459, 487 nm) with a relatively minor change in the green-yellow region (band centered around 534–558 nm). In contrast, orange spinel shows a significant decrease in the violet-blue region (390 nm) with little to no change in the green region, whereas red spinel shows a significant change of wider absorption covering the green toward the yellow region (534–546 nm). For Fe-related color spinels, it is worth noting that the greater oxidation state reported in XAS investigation correlates with the higher Fe-related absorptions of the violet-blue region (372, 387–390, 457–459, 487 nm) [27,58,59,60,61]. This might be a remark of the higher oxidation state of Fe2+ → Fe3+ in heated spinels [7,11,27,61]. For V-dominant orange spinels, the V3+-related absorption band centered around 390 nm [7] is obviously decreased after heating, which corresponds to a higher oxidation state of V3+ → V4+ as determined by XAS. For red spinels, the Cr3+-related absorption band centered about 387–396 nm overlain by V3+ [7] shows mostly identical after heating. This is consistent with a stable oxidation state of Cr3+ in heated red spinels. However, the origin of the band system around 487–580 nm is not entirely obvious, but as mentioned above, some of them are probably triggered by spin-forbidden transition of TFe2+ [7,11,27,61]. Therefore, the increasing of most visible absorptions is likely attributable to an increasing of Fe oxidation state from Fe2+ → Fe3+ of heated spinels. Cr3+-related absorption band around 393 nm in red spinel remains stable owing to identical Cr valency while a decreasing of V3+-related absorption band centered around 390 nm is likely due to the higher oxidation state of V3+ → V4+ after heating in orange spinels. These agree with XAS interpretation as reported earlier (Figure 6).

4.2. Indication of Heated Spinel

Raman and Photoluminescence spectra of heated spinels demonstrate remarkable changes in their characteristic features. Four Raman peaks are recognized in a red spinel sample at around 306–311 cm−1, 406 cm−1, 662–672 cm−1, and 761–768 cm−1 comparable to previous studies [62,65,66], they assigned these peaks to T2g(1), Eg, T2g(2), and A1g mode, respectively (Figure 3a). The full width at half maximum (FWHM) dominating at around 406 cm−1 peak was suggested to be appropriate for determining natural and heated spinels since disordering of the spinel structure lattice is the expected consequence after heating above 750 °C [2,20,29,67,68]. After heating, the dominating Raman spectra at around 406 cm−1 of representative red spinel exhibit an enlargement of full width at half maximum (FWHM) with decreasing in intensity. These evidences indicate that the crystal lattice has become disordered (also referred as partly inverse spinel) as a result of heating process [67]. Moreover, an additional small peak at around 715 cm−1 between 712–726 cm−1 (Figure 3a) is observed in most color spinel groups after heating. Except green spinel, it exhibits similar features of 5 peaks in both spectra before and after heating (Figure 3b).
The broadening of the main peak around 406 cm−1 has been attributed to the asymmetry of the Eg mode, which is related to cation disordering (bending of Al in tetrahedral coordination) [65,66]. The lower shift of the peak 311 cm−1 or T2g(1) to 306 cm−1 (Figure 3a) may be attributed to the entry of larger Al atoms into the T site. This indicates that the vibrations of the MgO4 and AlO4 tetrahedra may still couple strongly. This also can be seen in green spinel as presented in Figure 3b. The higher shift of the 662 cm−1 peak in Figure 3a or T2g(2) mode to 667 cm−1 is consistent with the entry of lighter magnesium atoms into the octahedral positions [66]. Even though it is difficult to define the additional peak at 715 cm−1 in heated red spinel or 719 cm−1 in unheated green spinel (between 712–726 cm−1, Figure 3a,b). They occur after heating. Therefore, they may be related to the symmetric stretching of the AlO4 tetrahedra due to cation disorder whereas peak at 761–770 cm−1 (A1g) might relate with Mg-O stretching vibration [65,66]. These features of disorder cations presented in Raman spectra can also be seen in synthetic spinels since the synthesizing process of growth crystal undergo by high temperature above 750 °C [2,20,29,66,67,68,69].
The photoluminescence spectrum is utilized to observe the narrow peaks of the Cr3+ trace element in the spinel structure. The heating of spinel was hypothesized to cause disorder and defects in the crystal lattice [2,19,29,64,67,70]. In normal spinels, a strong dominant chromium line with absorption at 685 nm (R-line) is recognized as well as additional characteristics at 675, 697, 706, 717, and 722 nm (N-lines) [71,72]. However, the most significant change occurs in the intensity of the dominant peak at about 686–687 nm (N1 line) [62,71,72], whereas the other features showed unsharp and unstructured after heating (Figure 4a). Unlike the others, the green sample exhibits no discernible change in the PL spectrum and most likely exhibited comparable characteristics to heated samples in all aspects including a broader 686 nm peak as well as unsharp of the other peaks (Figure 4b). The dominant sharp R-line, which is located around 685 nm originating from the states of the Cr3+ cation, has an ideal short-range order, due to the spin-forbidden transition 2Eg4A2g. Furthermore, the peak at 686–687 nm (Figure 4) is referred to as the N1-line due to a coupling between the Cr3+ state and the lattice defect. Broadening and poorly defined structure after heating is due to the interactive processes between Cr3+ ions and site occupation of the environment as well as an increase of lattice defects (disorder in inverse spinels, as mentioned above) [62,71,72]. Thus, with increasing temperature, the higher the inversion to inverse spinels (disorder) occurs.
These Raman and PL characteristics provided a strong indication of whether the spinels are normal or inverse by considering the disorder characteristic features presented as a broadening of the dominant peak around 406 cm−1 and additional 715–719 cm−1 in Raman spectra (between 712–726 cm−1), as well as a broadening and poorly defined structure of R-line (around 685 nm) and N-lines (others additional peak), especially the N1-line (686–687 nm) which they are significantly dominant after heating. Moreover, these also indirectly indicate the coloration in spinels both before and after heating.
In addition, pre-edge model fitting of Fe K-edge (Figure 5 and Figure 6a) XANES spectra indicate a significant increase in the average oxidation state from TFe2+ toward MFe3+, while pre-edge model fitting of V K-edge XANES spectra represents a significant increase of an average V oxidation state from MV3+ toward MV4+ in the majority of samples. Some samples plotted between the tetrahedral site and octahedral site (pentahedral site) indicate the alternating of cations between both sites (inverse spinels) since the occupation of a pentahedral site is improbable owing to the absence of such site in spinels. The plotting also indicates a disorder of normal spinels towards inverse spinels after the heating experiment in which their averaged plots fall around the pentahedral site. Since some cations located in the octahedral site may move to the tetrahedral site as normal spinels altered to inverse spinels following this formula A(BB)O4 → B(AB)O4. All spinel samples represent the oxidizing of V3+ and Fe2+ to V4+ and Fe3+ which occupy both tetrahedral and octahedral sites (from normal spinel to inverse spinel). The results gathered by Raman and PL indeed support the results of XAS that present the change in oxidation as well as site occupancy which are the results of the disorder of inverse spinel after heating.

5. Conclusions

Based on literature studies and the finding of this research, color in MgAl2O4 spinels is clearly tied to one or more minor and trace elements, depending on which chromophore is prominent. Spinels can be classified according to their colors into two groups: the Cr-V-related group and the Fe-related group. Spinels with a high MV3+ ratio yield orange-red, but those with trace of multi-color MCr3+ (or equal high ratio) should induce deeper red. Blue interference is induced by the increased TFe2+ concentration, whereas Fe2+ and Fe3+ charge transfer induces green color. Magenta, red-purple, and purple spinels are caused by a ratio of Fe and V as well as Cr concentration, accordingly. Further investigation of green spinels is encouraged since the green spinel presented in this study might be inverse spinel before the heating experiment. The color variation in MgAl2O4 spinels after heating is mostly due to changes in the oxidation state of iron and vanadium, whilst chromium stays consistent. Raman and photoluminescence spectra are likely the most helpful technique for identifying normal and inverse (that is, heat-treated) spinels. A small Raman peak at 715 cm−1 in heated red spinel or 719 cm−1 in green spinel (between 712–726 cm−1), may be essential for distinguishing between natural and heat-treated spinels because it is missing in the majority of natural untreated spinels. Advanced methods such as UV-Visible-NIR and X-ray Absorption Spectroscopy are effective for determining the color alteration, as well as valency and site occupancy of the three main chromophores, respectively.

Author Contributions

Conceptualization, C.S. (Chakkaphan Sutthirat) and T.P.; methodology, T.P.; software, C.S. (Chatree Saiyasombat); validation, C.S. (Chakkaphan Sutthirat), B.W. and C.S. (Chatree Saiyasombat); formal analysis, T.P.; investigation, T.P.; resources, B.W. and T.P.; data curation, T.P.; writing—original draft preparation, T.P.; writing—review and editing, C.S. (Chakkaphan Sutthirat) and B.W.; visualization, T.P.; supervision, C.S. (Chakkaphan Sutthirat); project administration, T.P. All authors have read and agreed to the published version of the manuscript.

Funding

This research is supported by the 90th Anniversary of Chulalongkorn University Fund (Ratchadaphiseksomphot Endowment Fund, ref. GCUGR1125641018D no. 018) and the 100th Anniversary Chulalongkorn University for Doctoral Scholarship (ref. 1/2562 no. 43) of the first author.

Data Availability Statement

Not applicable.

Acknowledgments

We acknowledge the Synchrotron Light Research Institute (Public Organization) or SLRI, particularly all staffs of the beamline 1.1 W (MXT) for technical support. Special thank is sent to Sopit Poompeang for assistance in EPMA analysis as well as Thanapong Lhuaamporn and Waratchanok Suwanmanee for facilitation at The Gem and Jewelry Institute of Thailand (Public Organization), GIT.

Conflicts of Interest

The authors declare no conflict of interest.

References

  1. Sickafus, K.E.; Wills, J.M.; Grimes, N.W. Structure of Spinel. J. Am. Ceram. Soc. 2004, 82, 3279–3292. [Google Scholar] [CrossRef]
  2. Peretti, A.; Günther, D.; Haris, M.T.M. New Type of treatment of spinel involving heat-treatment and cobalt diffusion (Updated 22 May 2015). In World of Magnificent Spinels. Provenance and Identification: Contributions to Gemology; Gemresearch Swisslab: Lucerne, Switzerland, 2015; pp. 279–282. [Google Scholar]
  3. Biagioni, C.; Pasero, M. The systematics of the spinel-type minerals: An overview. Am. Mineral. 2014, 99, 1254–1264. [Google Scholar] [CrossRef]
  4. Bosi, F.; Biagioni, C.; Pasero, M. Nomenclature and classification of the spinel supergroup. Eur. J. Mineral. 2019, 31, 183–192. [Google Scholar] [CrossRef] [Green Version]
  5. O’Neill, H.; James, M.; Dollase, W.A.; Redfern, S. Temperature dependence of the cation distribution in CuAl2O4 spinel. Eur. J. Mineral. 2005, 17, 581–586. [Google Scholar] [CrossRef]
  6. Skvortsova, V.; Mironova-Ulmane, N.; Riekstiņa, D. Structure and Phase Changes in Natural and Synthetic Magnesium Aluminum Spinel. In Environment, Technologies, Resources, Proceedings of the 8th International Scientific and Practical Conference, Rezekne, Latvia, 20–22 June 2011; RA Izdevniecība: Rezekne, Latvia, 2015; Volume 2, p. 2. [Google Scholar] [CrossRef]
  7. Andreozzi, G.B.; D’Ippolito, V.; Skogby, H.; Hålenius, U.; Bosi, F. Color mechanisms in spinel: A multi-analytical investigation of natural crystals with a wide range of coloration. Phys. Chem. Miner. 2018, 46, 343–360. [Google Scholar] [CrossRef]
  8. Bragg, W.H. XXX. The structure of the spinel group of crystals. Lond. Edinb. Dublin Philos. Mag. J. Sci. 1915, 30, 305–315. [Google Scholar] [CrossRef] [Green Version]
  9. Carbonin, S.; Russo, U.; Della Giusta, A. Cation distribution in some natural spinels from X-ray diffraction and Mössbauer spectroscopy. Miner. Mag. 1996, 60, 355–368. [Google Scholar] [CrossRef]
  10. D’Ippolito, V.; Andreozzi, G.B.; Hålenius, U.; Skogby, H.; Hametner, K.; Günther, D. Color mechanisms in spinel: Cobalt and iron interplay for the blue color. Phys. Chem. Miner. 2015, 42, 431–439. [Google Scholar] [CrossRef]
  11. Gaffney, E.S. Spectra of Tetrahedral Fe2+ in MgAl2O4. Phys. Rev. B 1973, 8, 3484–3486. [Google Scholar] [CrossRef]
  12. Gorghinian, A.; Mottana, A.; Rossi, A.; Oltean, F.M.; Esposito, A.; Marcelli, A. Investigating the colour of spinel: 1. Red gem-quality spinels (“balas”) from Ratnapura (Sri Lanka). Rend. Lincei 2013, 24, 127–140. [Google Scholar] [CrossRef]
  13. Juhin, A.; Brouder, C.; Arrio, M.-A.; Cabaret, D.; Sainctavit, P.; Balan, E.; Bordage, A.; Seitsonen, A.P.; Calas, G.; Eeckhout, S.G.; et al. X-ray linear dichroism in cubic compounds: The case of Cr3+ in MgAl2O4. Phys. Rev. B 2008, 78, 195103. [Google Scholar] [CrossRef] [Green Version]
  14. Nishikawa, S. Structure of Some Crystals of Spinel Group. Proc. Tokyo Math. Phys. Soc. 1915, 8, 199–209. [Google Scholar] [CrossRef]
  15. Wood, D.L.; Imbusch, G.F.; Macfarlane, R.M.; Kisliuk, P.; Larkin, D.M. Optical Spectrum of Cr3+ Ions in Spinels. J. Chem. Phys. 1968, 48, 5255–5263. [Google Scholar] [CrossRef]
  16. Anderson, B.W. Magnesium-zinc-spinels from Ceylon. Miner. Mag. 1937, 24, 547–554. [Google Scholar] [CrossRef]
  17. D’Ippolito, V.; Andreozzi, G.B.; Bosi, F.; Hålenius, U. Blue spinel crystals in the MgAl2O4-CoAl2O4 series: Part I. Flux growth and chemical characterization. Am. Mineral. 2012, 97, 1828–1833. [Google Scholar] [CrossRef]
  18. Deer, W.A.; Howie, R.A.; Zussman, J. An Introduction to the Rock-Forming Minerals, 3rd ed.; Berforts Information Press: Hastings, UK, 2013. [Google Scholar]
  19. Atsawatanapirom, N.; Bupparenoo, P.; Nilhud, N.; Saeneekatima, K.; Leelawatanasuk, T. Identification and Stability of Cobalt Diffusion-Treated Spinel. In Proceedings of the 5th GIT International Gem and Jewelry Conference: Treatment and Synthetics Update and Disclosure, Pattaya, Thailand, 14–15 November 2016; pp. 244–253. [Google Scholar]
  20. Chauvire, B.; Rondeau, B.; Fritsch, E.; Ressigeac, P.; Devidal, J.-L. Blue Spinel from the Luc Yen District of Vietnam. Gems Gemol. 2015, 51, 2–17. [Google Scholar] [CrossRef]
  21. Huong, L.T.T.; Haeger, T.; Phan, L. Study of impurity in blue spinel from the Luc Yen mining area, Yen Bai province, Vietnam. Vietnam J. Earth Sci. 2018, 40, 47–55. [Google Scholar] [CrossRef] [Green Version]
  22. Krzemnicki, M.; Wang, H.; Stephan, T.; Henn, U. Cobalt diffusion treated spinel. In Proceedings of the 35th IGC 2017, Windhoek, Namibia, 11–15 October 2017. [Google Scholar]
  23. Krzemnicki, M.S. Spinel, a Gemstone on the Rise; Swiss Gemmological Institute: Basel, Switzerland, 2011; Volume 18, pp. 3–4. [Google Scholar]
  24. Peretti, A.; Günther, D. Spinel from Namya. In Contributions to Gemology; Gemresearch Swisslab: Lucerne, Switzerland, 2003; pp. 15–18. [Google Scholar]
  25. Shigley, J.E.; Stockton, C.M. Cobalt-blue gem spinels. Gems Gemol. 1984, 20, 34–41. [Google Scholar] [CrossRef]
  26. Wherry, E.T. Mineral determination by absorption spectra II. Am. Mineral. 1929, 14, 323–328. [Google Scholar]
  27. Fregola, R.A.; Skogby, H.; Bosi, F.; D’Ippolito, V.; Andreozzi, G.B.; Hålenius, U. Optical absorption spectroscopy study of the causes for color variations in natural Fe-bearing gahnite: Insights from iron valency and site distribution data. Am. Mineral. 2014, 99, 2187–2195. [Google Scholar] [CrossRef]
  28. Palke, A.C.; Sun, Z. What is cobalt spinel? Unraveling the causes of color in blue spinels. Gems Gemol. 2018, 54, 262–263. [Google Scholar]
  29. Saeseaw, S.; Wang, W.; Scarratt, K.; Emmett, J.; Douthit, T. Distinguishing Heated Spinels from Unheated Natural Spinels and from Synthetic Spinels—A short review of on-going research. GIA Res. News 2009. 13p. Available online: https://www.gia.edu/doc/distinguishing-heated-spinels-from-unheated-natural-spinels.pdf (accessed on 7 March 2022).
  30. Newville, M. Fundamentals of XAFS. Rev. Miner. Geochem. 2014, 78, 33–74. [Google Scholar] [CrossRef]
  31. Chaurand, P.; Rose, J.; Briois, V.; Salome, M.; Proux, O.; Nassif, V.; Olivi, L.; Susini, J.; Hazemann, J.-L.; Bottero, J.-Y. New Methodological Approach for the Vanadium K-Edge X-ray Absorption Near-Edge Structure Interpretation: Application to the Speciation of Vanadium in Oxide Phases from Steel Slag. J. Phys. Chem. B 2007, 111, 5101–5110. [Google Scholar] [CrossRef]
  32. Dubrail, J.; Farges, F. Not all chromates show the same pre-edge feature. Implications for the modelling of the speciation of Cr in environmental systems. J. Phys. Conf. Ser. 2009, 190, 012176. [Google Scholar] [CrossRef]
  33. Farges, F. Chromium speciation in oxide-type compounds: Application to minerals, gems, aqueous solutions and silicate glasses. Phys. Chem. Miner. 2009, 36, 463–481. [Google Scholar] [CrossRef]
  34. Giuli, G.; Paris, E.; Mungall, J.; Romano, C.; Dingwell, D. V oxidation state and coordination number in silicate glasses by XAS. Am. Mineral. 2004, 89, 1640–1646. [Google Scholar] [CrossRef]
  35. Huggins, F.E.; Najih, M.; Huffman, G.P. Direct speciation of chromium in coal combustion by-products by X-ray absorption fine-structure spectroscopy. Fuel 1999, 78, 233–242. [Google Scholar] [CrossRef]
  36. Peterson, M.L.; Brown, G.E.; Parks, G.A. Quantitative Determination of Chromium Valence in Environmental Samples Using Xafs Spectroscopy. MRS Proc. 1996, 432, 75. [Google Scholar] [CrossRef]
  37. Peterson, M.L.; Brown, G.E.; Parks, G.A.; Stein, C.L. Differential redox and sorption of Cr (III/VI) on natural silicate and oxide minerals: EXAFS and XANES results. Geochim. Cosmochim. Acta 1997, 61, 3399–3412. [Google Scholar] [CrossRef]
  38. Wilke, M.; Farges, F.; Petit, P.-E.; Brown, G.E., Jr.; Martin, F. Oxidation state and coordination of Fe in minerals: An Fe K-XANES spectroscopic study. Am. Mineral. 2001, 86, 714–730. [Google Scholar] [CrossRef]
  39. Wilke, M.; Partzsch, G.M.; Bernhardt, R.; Lattard, D. Determination of the iron oxidation state in basaltic glasses using XANES at the K-edge. Chem. Geol. 2005, 220, 143–161. [Google Scholar] [CrossRef]
  40. Bunnag, N.; Kasri, B.; Setwong, W.; Sirisurawong, E.; Chotsawat, M.; Chirawatkul, P.; Saiyasombat, C. Study of Fe ions in aquamarine and the effect of dichroism as seen using UV–Vis, NIR and x-ray. Radiat. Phys. Chem. 2020, 177, 109107. [Google Scholar] [CrossRef]
  41. Newville, M. Larch: An Analysis Package for XAFS and Related Spectroscopies. J. Physics Conf. Ser. 2013, 430, 012007. [Google Scholar] [CrossRef]
  42. Farges, F.; Brown, G.E.; Rehr, J.J. Coordination chemistry of Ti(IV) in silicate glasses and melts: I. XAFS study of titanium coordination in oxide model compounds. Geochim. Cosmochim. Acta 1996, 60, 3023–3038. [Google Scholar] [CrossRef]
  43. Liu, R.; Cheng, Y.; Gundakaram, R.; Jang, L. Crystal and electronic structures of inverse spinel-type LiNiVO4. Mater. Res. Bull. 2001, 36, 1479–1486. [Google Scholar] [CrossRef]
  44. Burger, P.V.; Papike, J.J.; Bell, A.S.; Shearer, C.K. Vanadium Valence in Spinel from a Y98 Composition Melt as Determined by X-Ray Absorption Near Edge Structure (XANES). In Proceedings of the 46th Lunar and Planetary Science Conference, The Woodlands, TX, USA, 16–20 March 2015. [Google Scholar]
  45. Westre, T.E.; Kennepohl, P.; DeWitt, J.G.; Hedman, B.; Hodgson, K.O.; Solomon, E.I. A Multiplet Analysis of Fe K-Edge 1s → 3d Pre-Edge Features of Iron Complexes. J. Am. Chem. Soc. 1997, 119, 6297–6314. [Google Scholar] [CrossRef]
  46. Balan, E.; De Villiers, J.P.; Eeckhout, S.G.; Glatzel, P.; Toplis, M.J.; Fritsch, E.; Allard, T.; Galoisy, L.; Calas, G. The oxidation state of vanadium in titanomagnetite from layered basic intrusions. Am. Mineral. 2006, 91, 953–956. [Google Scholar] [CrossRef]
  47. Bordage, A.; Balan, E.; de Villiers, J.P.R.; Cromarty, R.; Juhin, A.; Carvallo, C.; Calas, G.; Raju, P.V.S.; Glatzel, P. V oxidation state in Fe–Ti oxides by high-energy resolution fluorescence-detected X-ray absorption spectroscopy. Phys. Chem. Miner. 2011, 38, 449–458. [Google Scholar] [CrossRef]
  48. Rees, J.A.; Wandzilak, A.; Maganas, D.; Wurster, N.I.C.; Hugenbruch, S.; Kowalska, J.K.; Pollock, C.J.; Lima, F.A.; Finkelstein, K.D.; Debeer, S. Experimental and theoretical correlations between vanadium K-edge X-ray absorption and Kβ emission spectra. JBIC J. Biol. Inorg. Chem. 2016, 21, 793–805. [Google Scholar] [CrossRef] [Green Version]
  49. Sutton, S.; Karner, J.; Papike, J.; Delaney, J.; Shearer, C.; Newville, M.; Eng, P.; Rivers, M.; Dyar, M. Vanadium K edge XANES of synthetic and natural basaltic glasses and application to microscale oxygen barometry. Geochim. Cosmochim. Acta 2005, 69, 2333–2348. [Google Scholar] [CrossRef]
  50. Waychunas, G.A.; Apted, M.J.; Brown, G.E. X-ray K-edge absorption spectra of Fe minerals and model compounds: Near-edge structure. Phys. Chem. Miner. 1983, 10, 1–9. [Google Scholar] [CrossRef]
  51. Wong, J.; Lytle, F.W.; Messmer, R.P.; Maylotte, D.H. K-edge absorption spectra of selected vanadium compounds. Phys. Rev. B 1984, 30, 5596–5610. [Google Scholar] [CrossRef]
  52. Eeckhout, S.G.; Bolfan-Casanova, N.; McCammon, C.; Klemme, S.; Amiguet, E. XANES study of the oxidation state of Cr in lower mantle phases: Periclase and magnesium silicate perovskite. Am. Mineral. 2007, 92, 966–972. [Google Scholar] [CrossRef]
  53. Fandeur, D.; Juillot, F.; Morin, G.; Olivi, L.; Cognigni, A.; Webb, S.M.; Ambrosi, J.-P.; Fritsch, E.; Guyot, F.; Brown, G.E., Jr. XANES Evidence for Oxidation of Cr(III) to Cr(VI) by Mn-Oxides in a Lateritic Regolith Developed on Serpentinized Ultramafic Rocks of New Caledonia. Environ. Sci. Technol. 2009, 43, 7384–7390. [Google Scholar] [CrossRef]
  54. Juhin, A.; Calas, G.; Cabaret, D.; Galoisy, L.; Hazemann, J.-L. Structural relaxation around substitutional Cr3+ in MgAl2O4. Phys. Rev. B 2007, 76, 054105. [Google Scholar] [CrossRef] [Green Version]
  55. Odake, S.; Fukura, S.; Arakawa, M.; Ohta, A.; Harte, B.; Kagi, H. Divalent chromium in ferropericlase inclusions in lower-mantle diamonds revealed by micro-XANES measurements. J. Miner. Pet. Sci. 2008, 103, 350–353. [Google Scholar] [CrossRef] [Green Version]
  56. Villain, O.; Calas, G.; Gaioisy, L.; Cormier, L.; Hazemann, J.-L. XANES Determination of Chromium Oxidation States in Glasses: Comparison with Optical Absorption Spectroscopy. J. Am. Ceram. Soc. 2007, 90, 3578–3581. [Google Scholar] [CrossRef]
  57. Wongkokua, W.; Pongkrapan, S.; Dararutana, P.; T-Thienprasert, J.; Wathanakul, P. X-ray absorption near-edge structure of chromium ions in α-Al2O3. J. Phys. Conf. Ser. 2009, 185, 012054. [Google Scholar] [CrossRef]
  58. Muhlmeister, S.; Koivula, J.I.; Kammerling, R.C.; Smith, C.P.; Fritsch, E.; Shigley, J.E. Flux-Grown Synthetic Red and Blue Spinels from Russia. Gems Gemol. 1993, 29, 81–98. [Google Scholar] [CrossRef]
  59. Andreozzi, G.B.; Hålenius, U.; Skogby, H. Spectroscopic active IVFe3+-VIFe3+ clusters in spinel-magnesioferrite solid solution crystals: A potential monitor for ordering in oxide spinels. Phys. Chem. Miner. 2001, 28, 435–444. [Google Scholar] [CrossRef]
  60. Schmetzer, K.; Haxel, C.; Amthauer, G. Colour of natural spinels, gahnospinels and gahnites. J. Mineral. Geochem. 1989, 159–180. [Google Scholar]
  61. Taran, M.N.; Koch-Müller, M.; Langer, K. Electronic absorption spectroscopy of natural (Fe2+, Fe3+)-bearing spinels of spinel s.s.-hercynite and gahnite-hercynite solid solutions at different temperatures and high-pressures. Phys. Chem. Miner. 2005, 32, 175–188. [Google Scholar] [CrossRef]
  62. Bootkul, D.; Tengchaisri, T.; Tippawan, U.; Intarasiri, S. Analysis and modification of natural red spinel by ion beam techniques for jewelry applications. Surf. Coat. Technol. 2016, 306, 211–217. [Google Scholar] [CrossRef]
  63. Hålenius, U.; Skogby, H.; Andreozzi, G.B. Influence of cation distribution on the optical absorption spectra of Fe3+ -bearing spinel s.s.–hercynite crystals: Evidence for electron transitions in VIFe2+-VIFe3+ clusters. Phys. Chem. Miner. 2002, 29, 319–330. [Google Scholar] [CrossRef]
  64. Saeseaw, S. Cobalt diffusion of natural spinel: A report describing a new treatment on the gem market. GIA Res. News 2015. 22p. Available online: https://www.gia.edu/doc/Cobalt-Diffusion-in-Spinel-v2.pdf (accessed on 7 March 2022).
  65. Cynn, H.; Sharma, S.K.; Cooney, T.F.; Nicol, M. High-temperature Raman investigation of order-disorder behavior in the MgAl2O4 spinel. Phys. Rev. B 1992, 45, 500–502. [Google Scholar] [CrossRef]
  66. Slotznick, S.P.; Shim, S.-H. In situ Raman spectroscopy measurements of MgAl2O4 spinel up to 1400 °C. Am. Mineral. 2008, 93, 470–476. [Google Scholar] [CrossRef]
  67. Widmer, R.; Malsy, A.-K.; Armbruster, T. Effects of heat treatment on red gemstone spinel: Single-crystal X-ray, Raman, and photoluminescence study. Phys. Chem. Miner. 2015, 42, 251–260. [Google Scholar] [CrossRef]
  68. Phyo, M.M.; Bieler, E.; Franz, L.; Balmer, W.; Krzemnicki, M.S. Spinel from Mogok, Myanmar—A Detailed Inclusion Study by Raman Microspectroscopy and Scanning Electron Microscopy. J. Gemmol. 2019, 36, 418–435. [Google Scholar] [CrossRef]
  69. Fraas, L.M.; Moore, J.E.; Salzberg, J.B. Raman characterization studies of synthetic and natural MgAl2O4 crystals. J. Chem. Phys. 1973, 58, 3585–3592. [Google Scholar] [CrossRef] [Green Version]
  70. Shen, A.H.; Breeding, C.M.; DeGhionno, D. Lab Notes: Natural spinel identified with Photoluminescence. Gems Gemol. 2004, 40, 168–169. [Google Scholar]
  71. Mikenda, W. N-lines in the luminescence spectra of Cr3+-doped spinels (III) partial spectra. J. Lumin. 1981, 26, 85–98. [Google Scholar] [CrossRef]
  72. Phan, T.-L.; Yu, S.-C.; Phan, M.-H.; Han, T. Photoluminescence properties of Cr3+-doped MgAl2O4 natural spinel. J. Korean Phys. Soc. 2004, 45, 63–66. [Google Scholar]
Figure 1. Representative spinel samples of each color group presenting appearances before and after heating as reported in the main text.
Minerals 12 00928 g001
Figure 2. Representatives of UV-visible absorption spectra of (a) red spinel, (b) magenta spinel, (c) orange spinel, (d) red-purple spinel, (e) purple spinel, (f) blue spinel, and (g) green spinel and their pattern change after heating experiment under this study.
Minerals 12 00928 g002
Figure 3. Representative Raman spectra of (a) red spinel as a common pattern of most sample groups and (b) green spinel presenting dissimilarly pattern to the other groups both before (blue lines, lower spectra) and after (red lines, upper spectra) heating experiment.
Minerals 12 00928 g003
Figure 4. Representative PL spectra of (a) orange spinel as a representative pattern of most samples, and (b) green spinel with dissimilar pattern to the other spinels both before (blue lines, lower spectra) and after heating experiment (red lines, upper spectra).
Minerals 12 00928 g004
Figure 5. Representative of Fe pre−edge XANES spectra composition.
Minerals 12 00928 g005
Figure 6. Diagrams present integrated pre-edge intensity and pre-edge peak centroid (E-E0) parameter of all spinel samples in various (a) Fe- and (b) V-oxidation state and their coordination, whereas (c) represented normalized Cr pre-edge XANES spectra of natural (blue lines) and heated (red lines) spinels compared with Cr(III) and Cr(VI) standards. Number [4], [5] and [6] represent a 4-fold, 5-fold, and 6-fold coordinated atoms, respectively.
Minerals 12 00928 g006
Figure 7. Ternary plots of Fe-Cr-V of spinel samples showing atomic ratios involving color.
Minerals 12 00928 g007
Table 1. XAS parameters for analysis of iron, chromium, and vanadium.
ParametersIronChromiumVanadium
Edge energy (E0)7112 eV5989 eV5465 eV
Number of scans3–53–53–5
Energy (eV)−80, −15, 30, 60, 90, 200−80, −15, 30, 60, 90, 200−80, −15, 30, 60, 90, 200
Energy step (eV)5, 0.2, 0.4, 2,45, 0.2, 0.4, 2, 45, 0.2, 0.4, 2, 4
Time step (s)1–41–41–4
Beam size2 × 3/4 × 3/4 × 4 mm2 × 3/4 × 3/4 × 4 mm2 × 3/4 × 3/4 × 4 mm
Table 2. Physical properties of spinel samples.
Sample/
Properties
Color GroupRefractive IndexSpecific GravityUV FluorescenceColor Code
Short WaveLong WaveNaturalHeated
S1-01S1 Red1.7223.52inertinert5R 4/145R 3/10
S1-031.7203.55inertred10R 3//1010R 3/8
S1-071.7213.62inertred10R 2/810R 1/8
S1-101.7153.47inertinert10R 2/1210R 3/8
S2-20S2 Magenta1.7183.42inertred7.5RP 5/87.5RP 5/6
S2-221.7183.66inertinert10RP 5/82.5R 5/6
S2-251.7183.55inertred5R 5/87.5R 4/6
S3-04S3 Orange1.7183.68inertinert10R 5/1610R 5/12
S3-111.7183.50inertinert2.5YR 5/122.5YR 6/6
S3-181.7163.59inertred2.5YR 4/102.5YR 5/6
S3-231.7183.56inertinert2.5YR 4/82.5YR 3/6
S3-271.7183.56inertred2.5YR 4/122.5YR 3/6
S4-02S4 Red-purple1.7153.62inertinert2.5R 4/67.5R 3/6
S4-031.7183.21inertinert2.5R 6/47.5R 5/6
S4-061.7193.61inertinert2.5YR 3/82.5YR 3/6
S4-141.7183.60inertred10R 3/85R 3/8
S5-04S5 Purple1.7163.52inertinert10P 5/62.5RP 5/4
S5-091.7183.62inertinert10RP 2/810RP 3/4
S5-131.7203.50inertinert2.5RP 5/62.5RP 6/4
S5-221.7163.57inertred7.5RP 7/410RP 7/4
S6-04S6 Blue1.7203.68inertinert10PB 3/210PB 2/2
S7-08S7 Green1.7203.63inertinert2.5GY 6/42.5GY 6/4
Table 3. Representative EPMA analyses of spinel samples.
Oxide (wt%)/
Samples
S1 RedS2 MagentaS3 OrangeS4 Red-PurpleS5 PurpleS6
Blue
S7
Green
S1-01S1-03S1-07S1-10S2-20S2-22S2-25S3-04S3-11S3-18S3-23S3-27S4-02S4-03S4-06S4-14S5-04S5-09S5-13S5-22S6-04S7-08
SiO20.000.000.000.010.010.000.020.020.000.000.000.000.000.000.000.000.000.040.010.000.000.00
TiO20.020.040.100.060.030.000.020.020.000.060.000.010.000.000.000.000.110.070.000.010.010.00
Al2O369.5169.5268.9069.7369.8270.9270.9770.0370.4370.9070.6170.4170.1870.9370.3670.5269.6070.5870.7170.5769.9370.74
V2O30.471.071.061.600.060.120.150.750.630.610.720.770.200.190.370.480.070.080.040.120.050.01
Cr2O31.840.251.020.190.230.220.250.060.080.080.020.060.040.100.090.090.020.070.120.060.020.00
Ga2O31.530.000.000.000.000.000.000.000.000.630.952.280.510.000.000.381.470.790.002.570.050.00
FeO0.180.070.170.021.001.140.980.060.070.050.160.111.001.131.300.250.501.001.150.742.661.14
MnO0.000.000.000.020.030.010.020.000.000.000.000.000.000.000.020.000.020.000.000.010.020.19
MgO26.3827.2027.3928.1727.4926.7126.7428.5428.7428.3926.7527.2227.9027.4027.1027.0227.3526.3427.3326.5025.9226.96
CoO0.000.010.000.000.010.000.000.000.000.020.000.000.000.000.000.000.000.000.000.000.000.00
ZnO0.091.020.960.030.080.000.060.120.190.070.130.070.010.050.050.190.720.310.050.130.590.13
CaO0.010.010.010.000.010.010.020.010.000.000.000.010.010.000.000.010.010.000.020.000.010.00
Total100.0399.2299.6099.8298.7599.1299.2499.61100.14100.7999.36100.9499.8499.7999.3098.9499.8699.2999.42100.7099.2799.17
Based on 32 oxygens
Si0.0000.0000.0000.0020.0030.0000.0030.0030.0000.0000.0000.0000.0000.0000.0000.0000.0000.0070.0020.0000.0000.000
Ti0.0030.0070.0150.0080.0040.0000.0030.0020.0000.0080.0000.0020.0000.0000.0000.0000.0150.0110.0000.0020.0020.000
Al15.72815.79915.64215.69215.88616.05816.04815.76415.77215.79515.97015.76715.82215.96415.93915.98715.76716.01215.97115.87215.97216.025
V0.0720.1660.1630.2450.0100.0180.0230.1150.0960.0920.1100.1170.0310.0290.0570.0740.0100.0130.0070.0190.0080.002
Cr0.2790.0390.1550.0290.0340.0340.0380.0090.0120.0120.0030.0090.0060.0140.0130.0130.0030.0110.0170.0090.0040.000
Ga0.1880.0000.0000.0000.0000.0000.0000.0000.0000.0760.1170.2780.0630.0000.0000.0470.1810.0970.0000.3140.0060.000
Fe0.0280.0100.0270.0030.1610.1820.1570.0100.0100.0070.0260.0170.1590.1810.2090.0400.0810.1610.1840.1170.4320.183
Mn0.0000.0000.0000.0020.0040.0020.0040.0000.0000.0000.0000.0000.0000.0000.0040.0000.0040.0000.0000.0020.0030.030
Mg7.5517.8207.8658.0217.9137.6507.6498.1288.1438.0007.6547.7127.9567.8017.7677.7497.8397.5587.8097.5407.4907.727
Co0.0000.0020.0000.0000.0010.0000.0000.0000.0000.0030.0000.0000.0000.0000.0000.0000.0000.0000.0000.0000.0000.000
Zn0.0130.1450.1370.0040.0110.0000.0090.0160.0260.0090.0190.0100.0010.0060.0080.0270.1020.0440.0070.0180.0850.019
Ca0.0020.0040.0020.0000.0030.0020.0050.0020.0000.0000.0000.0020.0010.0000.0000.0020.0010.0000.0030.0000.0030.000
Total23.86423.99124.00524.00724.02923.94523.93924.05124.06024.00423.90023.91324.03923.99623.99623.94024.00423.91524.00123.89124.00423.986
Table 4. Summary of UV-visible absorption approximate in each colored spinel groups.
Absorption (nm)/ColorCauseRed (S1)Magenta (S2)Orange (S3)Red-Purple (S4)Purple (S5)Blue (S6)Green (S7)
372Fe2+ and Fe3+ *xxx
387–396Fe2+, Cr3+, V3+ *
456–459Fe2+ and/or Fe3+xxxxx
487Fe2+xxxxxx
534–546Fe2+, Cr3+, V3+ *xx
558Fe2+xxxxxx
630Co2+xxxxxx
* Comprehensive absorption band.
Publisher’s Note: MDPI stays neutral with regard to jurisdictional claims in published maps and institutional affiliations.

