Article

Study on the Color-Influencing Factors of Blue Iolite

School of Gemmology, China University of Geosciences, Beijing 100083, China
*
Author to whom correspondence should be addressed.
Minerals 2022, 12(11), 1356; https://doi.org/10.3390/min12111356
Submission received: 7 September 2022 / Revised: 7 October 2022 / Accepted: 20 October 2022 / Published: 26 October 2022
(This article belongs to the Special Issue Colours in Minerals and Rocks, Volume II)

Abstract

:
This article explores the factors that influence the color of blue iolite, which is the gem-quality variety of the cordierite mineral. The X-Rite SP62 portable spectrophotometer was used to measure color in the CIELAB color space. ED-XRF and UV–vis were used for analysis. The results show that blue iolite contains the chromophore elements Fe and Mn, but the effect on the color of iolite is not significant due to the low Mn content. The lightness L* and the hue angle are mostly determined by its Fe content. UV–vis spectra show that iolite has a broad absorption band near 570 nm caused by the charge transfer between Fe2+ on the octahedron and Fe3+ on the T11 tetrahedron and results in the color of blue iolite. Each different standard light source has different degrees of influence on the color parameters of iolite, and the hue angle is the most influenced.

1. Introduction

Cordierite is a mineral with a long history. More than a thousand years ago, the Norse used the strong polarization effect of cordierite to determine the position of the sun during cloudy days. Cordierite is a typical metamorphic mineral, formed after moderate to high thermal metamorphism, mainly in gneiss, schist with a high aluminum content, and altered igneous rocks. It can also be found in some granites. In regional metamorphic rocks, granulite and gneisses, cordierite coexists with other Mg-Fe minerals, such as garnet, biotite, orthopyroxene, spinel or staurolite. It can also coexist with aluminum-rich minerals, such as sillimanite, sapphire and corundum [1].
Cordierite is used as a gemstone, which is known as “iolite” in the gem and jewelry industry. It is also known as “water sapphire” because of its sapphire-like color and is widely used in industry for its excellent properties, but gem-quality cordierite is also considered to be a rare gemstone variety. Worldwide, gem-quality cordierite is mostly found in India, Sri Lanka, Madagascar, the United States (California, Idaho, and Wyoming), Canada, and Greenland [2]. Among them, India is an important market for iolite gem trading. Iolite occurrences have been reported from high-grade metamorphic rocks of the Eastern Ghat Mobile Belt of the states of Odisha and Andhra Pradesh and in metamorphic rocks of Karnataka and Tamil Nadu [3].
Iolite is highly transparent, usually a blue to blue–violet color, with strong pleochroism visible to the naked eye: blue–violet iolite shows light purple, dark purple and yellow–brown pleochroism; blue iolite shows colorless to yellow, blue–gray and dark purple pleochroism. According to previous studies on the spectrum and color properties, the cause of the color can be attributed to the charge transfer between Fe2+ on the octahedron and Fe3+ in the edge-shared T11 tetrahedra in the iolite [4,5,6].
In addition, some external factors such as light source and background will also affect the appearance of the gemstone color. For example, color-changing garnets can change from red to green under different color temperature light source conditions. According to the national standard (GB/T 20146-2006) and the requirements of jewelry quality evaluation as well as the uniformity of lighting sources, D65 (6500 k), A (2856 k) and F2 (4150 k) were selected to explore the influence of different standard light sources on the color appearance of blue iolite in this paper.
The CIE 1976 L*a*b* uniform color system is the most popular system for color measurement and analysis, currently recommended by the International Commission on Illumination (CIE) [7,8,9,10]. The color space has good color uniformity, so that the visual distance between colors is proportional to the Euclidean distance between color coordinates, and is fully consistent with the subjective law that the visual color difference in the red and green directions is less than the visual color difference in the yellow and blue directions [11]. The system consists of color coordinates a* and b* and the lightness L*; the chroma C* and the hue angle can be calculated from a* and b*:
C* = [(a*)2 + (b*)2]1/2
= arctan(b*/a*)
In recent years, colorimetry has played an important role in gemology, mainly involving materials such as jadeite [12,13,14], diamond [15], sapphire [16], peridot [17,18], amethyst [19], tourmaline [20,21], chrysoberyl [22], color-changing garnet [23,24,25,26], amber [27] and cubic zirconia. However, evaluation and analysis of factors influencing iolite color have been scarce so far. In this paper, the color of iolite is quantitatively characterized using the CIE 1976 L*a*b* uniform color space, and the effects of transition elements, by means of UV–vis spectroscopy, and light source changes on the color are discussed.

2. Materials and Methods

2.1. Materials

Twenty gem-quality natural iolite oval faceted, with a uniform color transition from light blue to blue–violet were selected for this work. No inclusion in the inner part of the sample as seen by the naked eye. The gemological properties of iolite are summarized in Table 1 and some of the samples are shown in Figure 1.

2.2. Methods

2.2.1. Colorimetric Analysis

The color parameters of iolite were determined by an X-Rite SP62 portable spectrophotometer (X-Rite, Grand Rapids, MI, USA). Based on the CIE 1976 L*a*b* uniform color space, an integrating sphere is used to collect the reflected signal from the sample surface. The test conditions are as follows: reflection, excluding specular reflection; D65 (6504 K) standard light source illumination; 10° observer field of view; measurement range, 400–700 nm. The final color data were averaged over three tests; the test area for a single sample is a circle with a diameter of 6 mm.

2.2.2. ED-XRF

Semi-quantitative elemental testing was carried out using an EDX-7000 energy dispersive X-ray fluorescence spectrometer (SHIMADZU, Kyoto, Japan). The test conditions are as follows: atmosphere, vacuum; electron beam energy 2.2 keV; X-ray energy range 3.5–35 keV; detector, Si (Li); collimator, 1 mm.

2.2.3. UV–Vis Spectroscopy

Absorption spectra in the UV–vis range were recorded using a PE-Lambda 950 UV–vis spectrophotometer (PERKINELMER, Waltham, Massachusetts, USA). The test conditions are as follows: transmission method; measurement range 300–800 nm; data interval 1 nm; scan speed 266.75 nm/min; cycles 1 s; detector settings 0.2 s.

3. Results

3.1. Color Quantification

The color of 20 iolites was quantitatively characterized using a X-Rite SP62 portable spectrophotometer based on the CIE 1976 L*a*b* uniform color space with a Munsell N9 color card as the background under a standard D65 light source. As shown in Figure 2, the color of all samples was measured with the tabletop up vertically in this paper, and the overall color parameters of iolite are obtained after taking the average value three times. Results show the color range of iolite: the lightness L*∈(29.47, 67.84), color coordinate a*∈(3.00, 7.97), color coordinate b*∈(−20.25, −6.87), the chroma C*∈(7.60, 21.72) and the hue angle ∈(287.17, 295.25).
Through the correlation analysis of the color parameters of 20 iolites, it is found that there is no obvious good correlation between the color coordinates a* and b* and the hue angle , indicating that the color coordinates a* and b* are not the main factors affecting the change of the hue of iolite. This paper focuses on the correlation between color coordinates a* and b* and the chroma C*. After linear fitting, the relationship is as follows (Figure 3):
C* = 2.415a* + 1.906 (R2 = 0.957)
C* = −1.090b* − 0.175 (R2 = 0.999)
The goodness of fit R2 is 0.957 and 0.999, respectively, which means that there is a highly significant linear positive and linear negative correlation between the color coordinates a* and b* and the chroma C*, that is, the chroma C* of most iolites increased with the increase in the color coordinate a* and decreased with the increase in the color coordinate b*, and the color of iolite became darker, transitioning from light blue to blue–violet.

3.2. Chemical Composition

Cordierite, which gemmologically takes the name of iolite, is a silicate mineral with a tetrahedral framework, as shown in Figure 4. The crystal structure of iolite consists of different types of tetrahedra and octahedra. The octahedral M-site is usually occupied by medium-sized cations such as Mg2+, Fe2+, Mn2+ or Li+, T1 and T2 tetrahedra are usually occupied by small-radius cations Al3+ as well as Si4+. Al3+ located at T11 and T26 sites, while Si4+ at T16, T21 and T23 sites. Furthermore, sometimes Be and a small amount of Mg2+, Fe2+, and Fe3+ can enter the distorted T11 site. The octahedron is edge connected to the T1 tetrahedron, and both are connected to the T2 tetrahedron through the shared anion O2−. The T2 tetrahedra are co-angled and form a six-membered ring structure, infinitely along the c-axis to form broad channels in which large-radius cations Na+, K+, as well as H2O and CO2 can be located. The upper and lower hexahedral rings are staggered by about 30° and connected by T2 tetrahedra [28,29,30,31,32]. Therefore, the chemical equation for iolite can be written as: (M)2(T11)2(T26)2(T23)2(T21)2(T16) O18, (H2O, CO2).
ED-XRF can be used for a rapid and non-destructive detection of the major elements in iolite, and the data show that the main components of the samples are: Si (47.98–50.372 wt%), Al (34.065–35.667 wt%) and Mg (9.194–14.031 wt%), and also contain the minor elements Fe (1.848–5.18 wt%) and Mn (0.019–0.28 wt%), where w(Fe2O3) represents the total iron content (Table 2). The analyses show that the content of Mg gradually decreased with the increase in Fe, while the content of Mn and Al changed relatively flatly. Based on a linear fit to the Fe-Mg content in iolite (Figure 5):
w(FeOtot) = 15.936 − 1.35w(MgO) (r = −0.919 R2 = 0.844)
Among them, r is the Pearson correlation coefficient, which is used to describe the degree of linear correlation between two variables; R2 represents the goodness of fit and is used to describe the degree of fit of the regression line to the observations, i.e., the percentage of variability in the dependent variable explained by the regression equation. A high negative correlation exists between w(FeOtot) and w(MgO), the decrease in the Mg content can explain 84% of the increase in the Fe content. It indicates that Fe2+ is the main form of Fe element present in iolite, which is consistent with the results of Charles A. Geiger [34]. The remaining iron is present in T11 tetrahedra as Fe3+ to account for its blue color and strong pleochroism and a small amount of Fe3+ can also displace Al3+ in the composition [35]. The Mg2+ in the secondary composition can also be replaced by a small amount of Mn2+, which also explains the discrete gray spots in Figure 5.

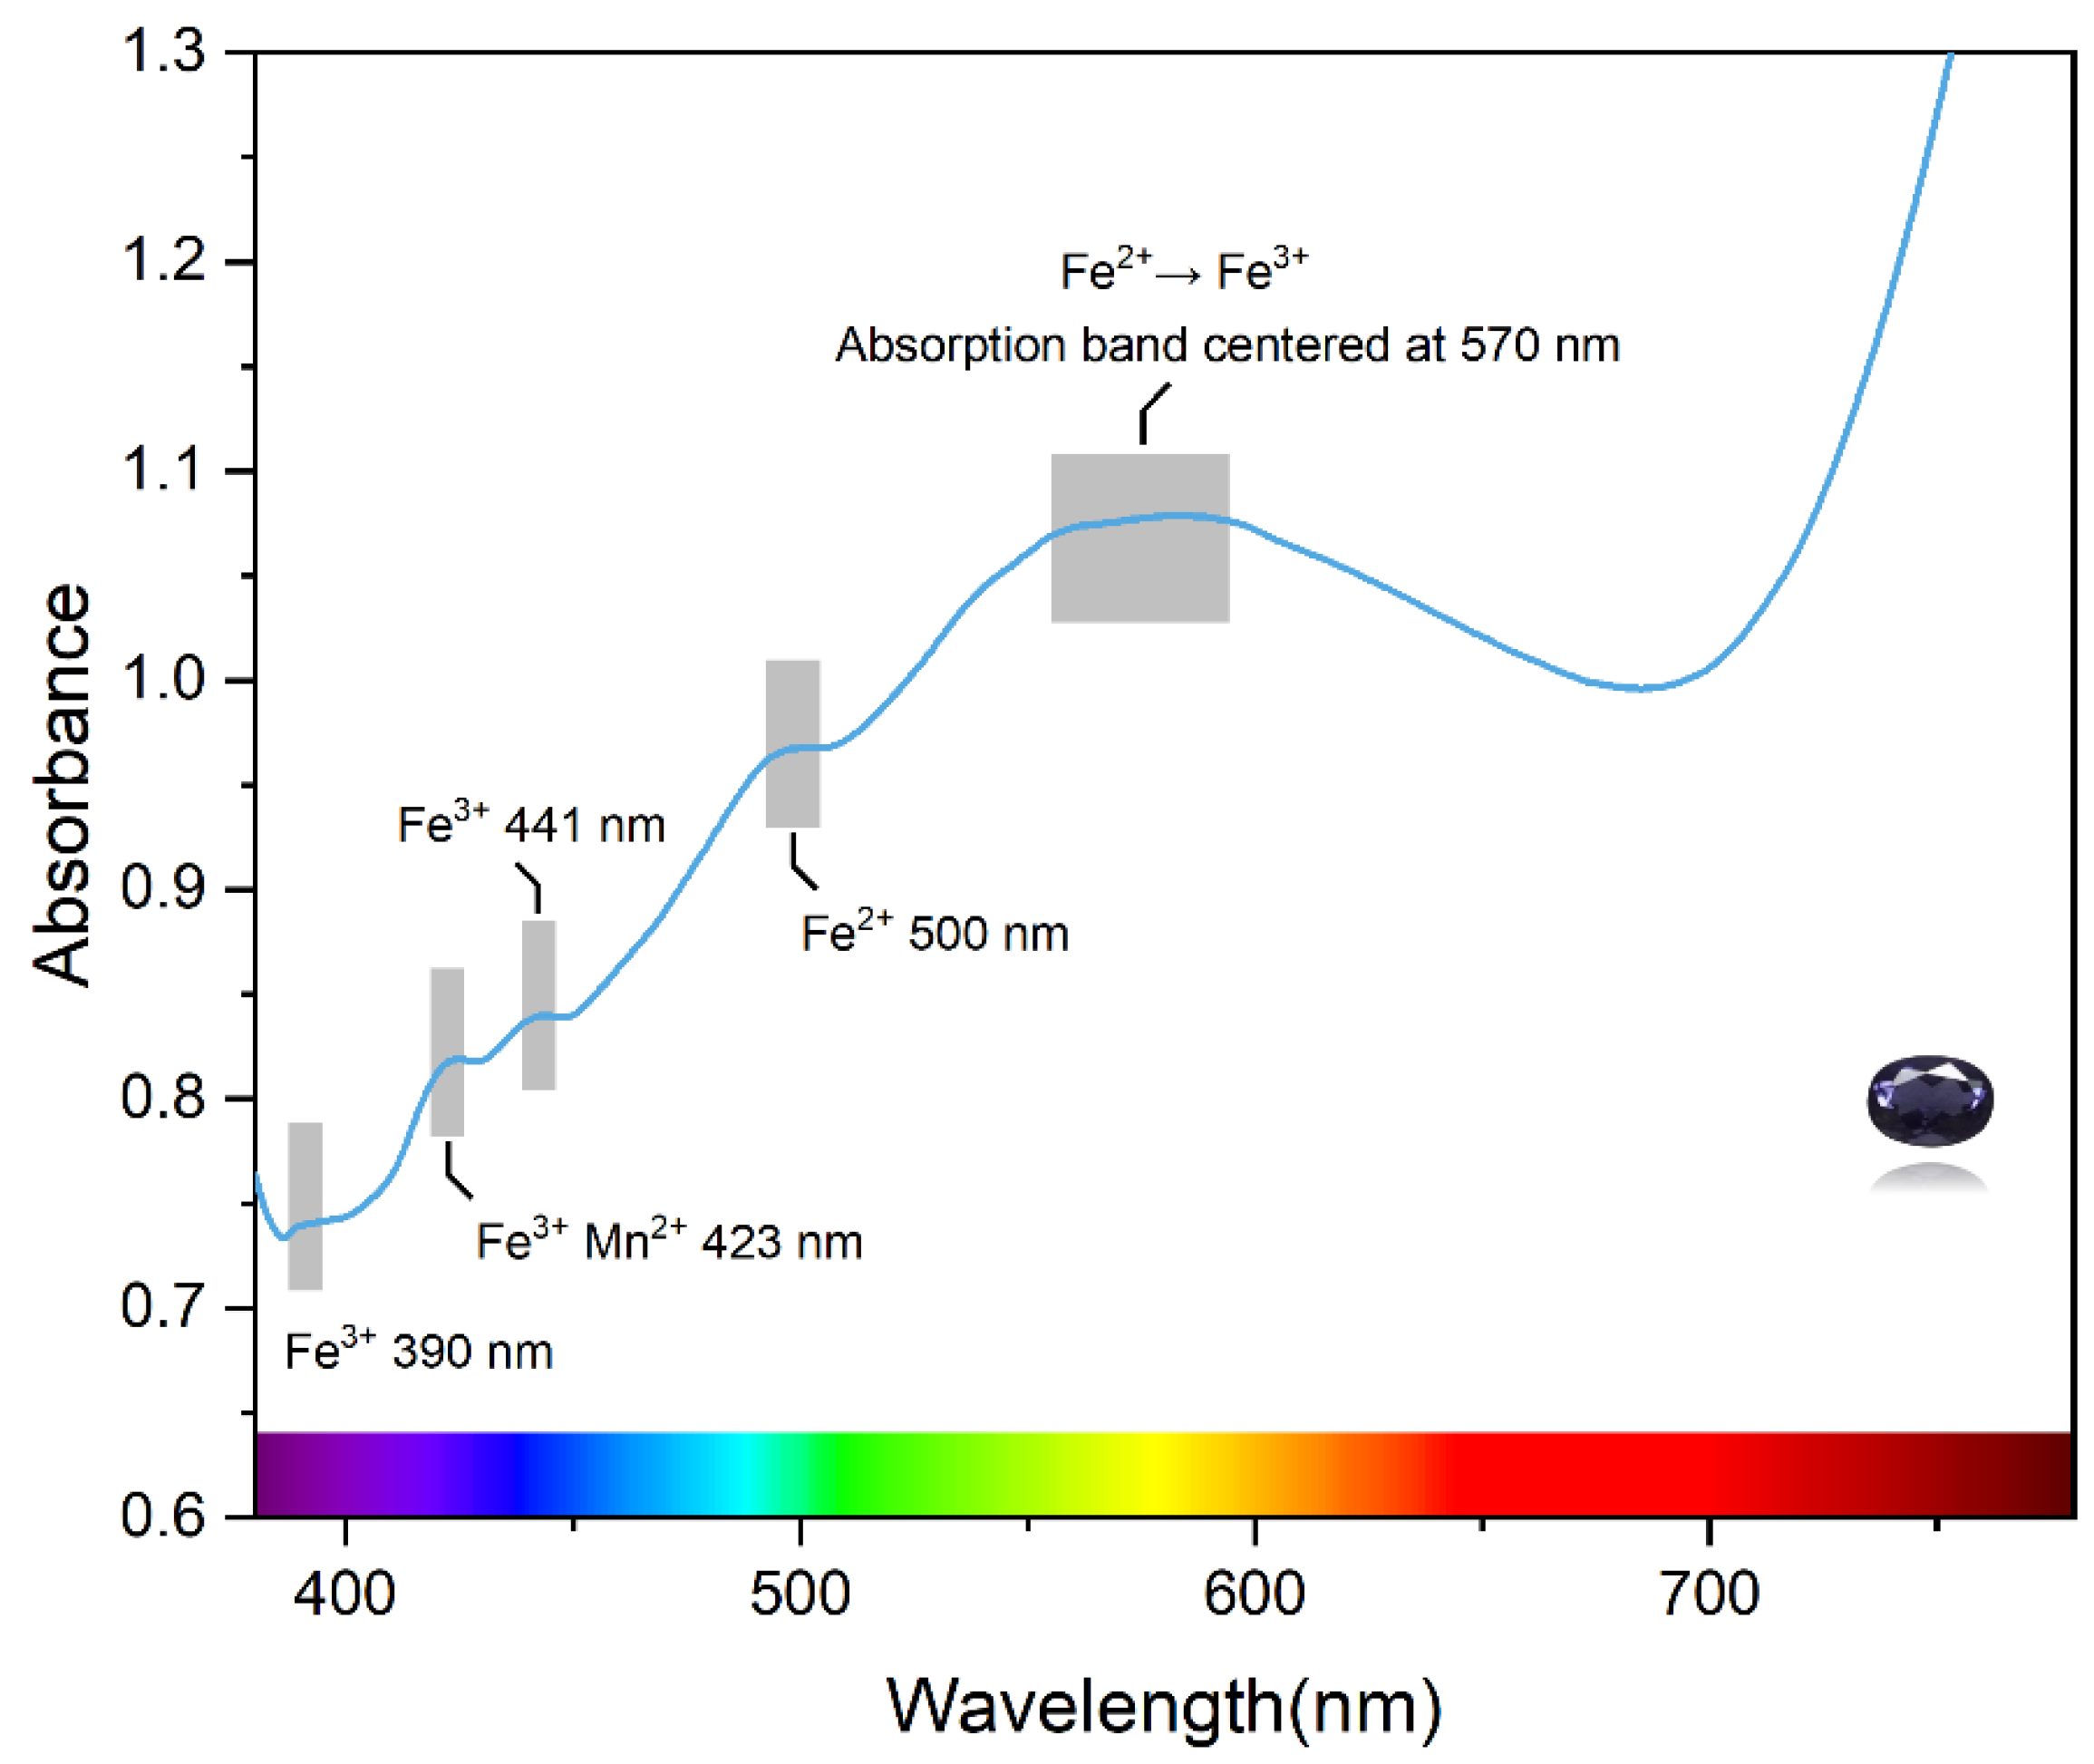
3.3. UV–Vis Spectroscopy Characteristics of Iolite

The UV–vis absorption spectrum of iolite is shown in Figure 6. All samples show a broad absorption band centered at 570 nm in the visible region; as the color deepens, this absorption becomes progressively stronger. It is assumed that this absorption band is attributed to the charge transfer between Fe2+ on octahedra and Fe3+ in the co-sided T11 tetrahedra [4], and leads to the blue appearance of iolite. Three weak absorption peaks are found in the violet-blue region, the absorption at 390 nm corresponds to the d-d orbital spin-forbidden transition of Fe3+ (6A1g4T2g) [36,37], and the absorption at 441 nm is generated by the d-electron transition of Fe3+ from the ground state 6A1 energy level to the excited state 4A1g and 4Eg energy levels. Yan Q [38] et al. attributed the peak of pyrope-spessartine garnets near 424 nm to Mn2+ and six-fold spin-forbidden transitions of Fe3+ (6A1g4A1g + 4Eg). Therefore, it is assumed that the peak at 423 nm in iolite is also caused by a combination of Mn2+ and Fe3+. In addition, the absorption of the sample near 500 nm in the blue–green region is associated with the spin-forbidden transition of Fe2+.

4. Discussion

4.1. Relationship between Fe, Mn and Color

Both Fe and Mn are transition metal elements that are often associated with gemstone color. We explored the correlation between the content of transition metal elements and each color parameter of 20 iolite samples by bivariate correlation analysis. The test is two tailed and the linearity between the two datasets can be determined by the Pearson correlation coefficient r: the correlation is weak or absent when |r| < 0.3; the correlation is low when 0.3 ≤ |r| < 0.5; the correlation is medium when 0.5 ≤ |r| < 0.8; the correlation is high when |r| ≥ 0.8 (Table 3).
The results showed a high correlation between w(FeOtot) and the lightness L* (r = −0.831**) and the hue angle (r = 0.877**) in blue iolite. It shows that the concentration of iron has a significant effect on the lightness L* and the hue angle . With the increase in the Fe content, the lightness L* of the sample decreased almost linearly, the hue angle showed an overall increasing trend (Figure 7), the color of iolite appeared from light to dark blue. Thus, iolite with a high iron content exhibits a highly saturated blue color, accompanied by a lower lightness. The correlations between w(MnO) and color parameters were all relatively weak. In order to explore whether Mn has a contribution to the color of iolite, a bivariate correlation analysis was performed between the Fe + Mn contents and the color parameters, r instead resulting in a decrease in the values of r. It indicates that Mn has less effect on the color of iolite, which may be related to the low content of Mn in the samples, so Fe is the main color element in iolite.

4.2. Color Causes of Blue Iolite

Mn2+ and Fe3+ have the same electronic structure, both are chromophores, and will only produce obvious color at higher concentrations [39]. Mn2+ is less abundant in iolite, compared to Fe2+, only a small amount of Mn2+ can replace Mg2+ on the octahedral M-site. So Mn2+ does not contribute significantly to the color of iolite. Additionally, whether it is Mg-rich iolite or Fe-rich iolite, the Fe3+ content is low: the amount of Fe3+ in tetrahedra is usually less than 0.004 a.p.f.u. [35]. Fe3+ absorbs to a weaker extent, and the charge transfer in the visible light region is more intense than the color caused by dispersed metal ions [40]. Thus, Fe3+ also has a weak effect on the color of iolite. In iolite, the role of Fe3+ contributes more to the charge transfer, which shifts the color of the iolite from blue to violet, so that the color of iolite is more due to the intervalence charge transfer between Fe2+ and Fe3+.

4.3. Influence of Standard Light Source on Color Appearance

Using the X-Rite SP62 portable spectrophotometer, based on the CIE 1976 L*a*b* uniform color space, with the Munsell N9 color card as the background, the color parameters of 20 iolites were tested under D65, F2 and A light sources. One-way ANOVA was used to explore the impact of different standard light sources on the color appearance of iolite, the results are shown in Table 4. When the significance coefficient p is <0.05, it is considered to have a significant impact.
It is suggested that different standard light sources have no significant effect on the lightness L* (p = 0.980), a little effect on the color coordinate b* (p = 0.406) and the chroma C* (p = 0.381), but the greatest effect on the color coordinates a* (p = 0.000) and the hue angle (p = 0.000). F represents the between-group variance, and the F of the hue angle h° is the largest (379.442), indicating that the light source change has the greatest impact on the hue angle h°.
Different light sources have different spectral energy distributions, which determine the color-rendering properties by influencing its rendering indices, and ultimately produce different colors when irradiated to the gemstone. As shown in Figure 8a,b, when the light source is switched from D65 to F2 and A, the hue angle of iolite shows a downward trend. The energy of the daylight source D65 is concentrated in the blue zone, which helps iolite to produce a blue hue, so that iolite has the largest hue angle under D65. The spectral energy of the fluorescent light sources F2 and A are concentrated in the yellow and red regions, respectively, the blue hue of the iolite is disturbed, hence the hue angle becomes smaller.
Under the three standard light sources, the color coordinates of iolite are positive for a* and negative for b*. When the light source is switched from D65 to F2 or A, the a* decreases and the red density decreases. The b* is the smallest under F2 with the highest blue concentration, and the largest under A with the lowest blue concentration, both make iolite present the highest chroma C* under F2. At the same time, F2 has higher energy in the purple wavelength region, and its color light has a purple light part. When the purple light is superimposed on the blue–violet iolite samples, the samples show a fuller blue–violet color, so under the F2 light source, the chroma C* is the largest. A light source is a color light with higher energy in a longer wavelength range, its color light tends to be orange–red. When the orange–red light is superimposed on the blue iolite samples, the chroma C* is reduced. Therefore, the D65 light source is suitable for the evaluation of iolite, while the F2 light source is suitable for the sale and display of iolite because it can show the blue color of iolite more effectively.

5. Conclusions

(1)
The color coordinates a* and b* were the main factors affecting the variation of the chroma C*.
(2)
Fe is mainly present as Fe2+ and controls the lightness L* and the hue angle , while Mn does not have a significant effect on the color of iolite.
(3)
The intervalence charge transfer between Fe2+ and Fe3+ is responsible for the blue color of iolite.
(4)
The color parameters of iolite are affected by the change of light sources, and the hue angle h° is the most affected.

Author Contributions

Conceptualization, X.L.; methodology, X.L. and Y.G.; validation, Y.G.; formal analysis, X.L.; investigation, X.L.; resources, X.L. and Y.G.; data curation, X.L.; writing—original draft preparation and editing, X.L.; supervision, Y.G.; project administration, Y.G. All authors have read and agreed to the published version of the manuscript.

Funding

This research received no external funding.

Data Availability Statement

Not applicable.

Acknowledgments

UV–vis spectroscopy was tested in the National Gemstone Testing Center (NGTC), Beijing, China. The rest of the experiments in this research were conducted in the laboratories of the Gemological Institute, China University of Geosciences, Beijing.

Conflicts of Interest

The authors declare no conflict of interest.

References

  1. Das, S.K.; Mohanty, J.K. Characteristics of Cordierite (Iolite) of Bandarguha-Orabahala Area, Kalahandi District, Odisha, India. J. Geol. Geophys. 2017, 6, 1–8. [Google Scholar]
  2. Yu, X. Colored Gemmology, 2nd ed.; Geological Publishing House: Beijing, China, 2016. [Google Scholar]
  3. Government of India. Indian Minerals Yearbook; Indian Bureau of Mines: Nagpur, India, 2013.
  4. Faye, G.H.; Manning, P.G. The polarized optical absorption spectra of tourmaline, cordierite, chloritoid and vivianite: Ferrous-ferric electronic interaction as a source of pleochroism. Am. Miner. 1968, 53, 1174–1201. [Google Scholar]
  5. Pollak, H. Charge transfer in cordierite. Phys. Status Solidi 1976, 74, K31–K34. [Google Scholar] [CrossRef]
  6. Parkin, K.M.; Loeffler, B.M.; Burns, R.G. Mfssbauer spectra of Kyanite, Aquamarine and Cordierite showing intervalence charge transfer. Phys. Chem. Miner. 1977, 1, 301–311. [Google Scholar] [CrossRef]
  7. Pointer, M.R. A comparison of the CIE 1976 colour spaces. Color Res. Appl. 2009, 6, 108–118. [Google Scholar] [CrossRef]
  8. Kirillova, N.P.; Vodyanitskii, V.N.; Sileva, T.M. Conversion of soil color parameters from the Munsell system to the CIE-L*a*b* system. Eurasian Soil Sci. 2015, 48, 468–475. [Google Scholar] [CrossRef]
  9. Vodyanitskii, Y.N. Application of the CIE L*a*b* system to characterize soil color. Eurasian Soil Sci. 2016, 49, 1259–1268. [Google Scholar] [CrossRef]
  10. Mahajan, M.P.; Bandyopadhyay, S. Characterization and optimization of color attributes chroma (C*) and lightness (L*) in offset lithography halftone print on packaging boards. Color Res. Appl. 2020, 45, 325–335. [Google Scholar] [CrossRef]
  11. Mclaren, K. The development of the CIE 1976 (L*a*b*) uniform colour space and colour-difference formula. J. Soc. Dye. Colour 2008, 92, 338–341. [Google Scholar] [CrossRef]
  12. Ying, G.; Huan, W.; Xiang, L. Metamerism Appreciation of Jadeite-Jade Green under the Standard Light Sources D 65, A and CWF. Acta Geol. Sin. 2016, 90, 2097–2103. [Google Scholar]
  13. Ying, G.; Xiang, Z.; Ming, Q. Feasibility study on quality evaluation of Jadeite-jade color green based on GemDialogue color chip. Multimed. Tools. Appl. 2019, 78, 841–856. [Google Scholar]
  14. Xin, P.; Ying, G.; Liu, Z. Impact of different standard lighting sources on red jadeite and color quality grading. Earth Sci. Res. 2019, 23, 371–378. [Google Scholar]
  15. Liu, F.; Ying, G.; Lv, S.J.; Chen, G.G. Application of the entropy method and color difference formula to the evaluation of round brilliant cut diamond scintillation. Mathematics 2020, 8, 1489. [Google Scholar] [CrossRef]
  16. Han, J.; Ying, G.; Liu, S. Environmental issues on color quality evaluation of blue sapphire based on gemdialoguetm color comparison charts. Ekoloji 2018, 106, 1365–1376. [Google Scholar]
  17. Jun, T.; Ying, G.; Chang, X. Color effect of light sources on peridot based on CIE1976 L*a*b* color system and round RGB diagram system. Color Res. Appl. 2019, 44, 932–940. [Google Scholar]
  18. Jun, T.; Ying, G.; Chang, X. Metameric effects on peridot by changing background color. Josa A 2019, 36, 2030–2039. [Google Scholar]
  19. Cheng, R.; Ying, G. Study on the effect of heat treatment on amethyst color and the cause of coloration. Sci. Rep. 2020, 10, 14927. [Google Scholar] [CrossRef]
  20. Yan, L.; Shigley, J.; Halvorsen, A. Colour hue change of a gem tourmaline from the Umba Valley, Tanzania. J. Mater. Sci. 1999, 26, 386–396. [Google Scholar]
  21. Ying, G. Quality evaluation of tourmaline red based on uniform color space. Clust. Comput. 2017, 20, 3393–3408. [Google Scholar]
  22. Yan, L.; James, S.; Emmanuel, F.; Scott, H. The “alexandrite effect” in gemstones. Color Res. Appl. 1994, 19, 186–191. [Google Scholar]
  23. Krzemnicki, M.S. Colour change garnets from Madagascar: Comparison of colorimetric with chemical data. J. Gemmol. 2001, 27, 395–408. [Google Scholar] [CrossRef]
  24. Schmetzer, K. Colour-change garnets from Madagascar: Variation of chemical, spectroscopic and colorimetric properties. J. Gemmol. 2009, 31, 235–282. [Google Scholar] [CrossRef]
  25. Sun, Z.; Palke, A.; Renfro, N. Vanadium-and chromium-bearing pink pyrope garnet: Characterization and quantitative colorimetric analysis. Gems. Gemmol. 2016, 51, 348–369. [Google Scholar] [CrossRef] [Green Version]
  26. Sun, Z.; Palke, A.; Renfro, N.; Breitzmann, H.; Hand, D.; Muyal, J. Discovery of Color-Change Chrome Grossular Garnets from Ethiopia. Gems. Gemmol. 2018, 54, 233–236. [Google Scholar]
  27. Yan, L.; Shi, G.; Shen, W. Color phenomena of blue amber. Gems Gemmol. 2014, 50, 134–140. [Google Scholar]
  28. Wallace, J.H.; Wenk, H.R. Structure variations in low cordierites. Am. Miner. 1980, 65, 96–111. [Google Scholar]
  29. Meagher, E.P.; Gibbs, G.V. The polymorphism of cordierite: II, The crystal structure of Indialite. Can. Miner. 1977, 15, 43–49. [Google Scholar]
  30. Cohen, J.P.; Ross, F.K.; Gibbs, G.V. An X-ray and neutron diffraction study of hydrous low cordierite. Am. Miner. 1977, 62, 67–78. [Google Scholar]
  31. Armbruster, T. Fe-rich cordierites from acid volcanic rocks: An optical and X-ray single-crystal structure study. Contrib. Miner. Petrol. 1985, 91, 180–187. [Google Scholar] [CrossRef]
  32. Gibbs, G.V. The polymorphism of cordierite: I. The crystal structure of low cordierite. Am. Miner. 1966, 51, 1068–1087. [Google Scholar]
  33. Bertoldiab, C.; Proyerc, A.; Schonberga, D.G.; Behrensd, H.; Dachsb, E. Comprehensive chemical analyses of natural cordierites:implications for exchange mechanisms. Lithos 2004, 78, 389–409. [Google Scholar] [CrossRef]
  34. Charles, A.; Thomas, A.; Vladimir, K.; Simona, Q. Cordierite I: The coordination of Fe2+. Am. Miner. 2000, 85, 1255–1264. [Google Scholar]
  35. Charles, A.; Helmut, R.; Michael, C. Cordierite III: The site occupation and concentration of Fe3+. Contrib. Miner. Petrol. 2000, 140, 344–352. [Google Scholar]
  36. Guo, K.; Zhou, Z.; Qian, Z. A comparative study of element content and UV-Vis spectroscopy characteristics of rubies from Burma and Mozambique. Acta Petrol. Sin. 2018, 37, 1002–1010. [Google Scholar]
  37. Yuan, L.; Zhao, B.; Zhou, Z.; Xiang, C. Water irradiation dissociation and F-NIR spectral analysis of yellow beryl structure in Xinjiang. Acta Metall. Sin. 2012, 32, 103–105. [Google Scholar]
  38. Yan, Q.; Ying, G. Explaining Colour Change in Pyrope-Spessartine Garnets. Minerals 2021, 11, 865. [Google Scholar]
  39. Rehman, H.U.; Martens, G.; Tsai, Y.L. An X-ray Absorption Near-Edge Structure (XANES) Study on the Oxidation State of Chromophores in Natural Kunzite Samples from Nuristan. Minerals 2020, 10, 463. [Google Scholar] [CrossRef]
  40. Fritsch, E.; Rossman, G.R. An update on color in gems. Part 2: Colors involving multiple atoms and color centers. Gems. Gemmol. 2018, 24, 3–15. [Google Scholar] [CrossRef]
Figure 1. Some of the samples used in this study under standard D65 light. All samples are taken from the tabletop.
Minerals 12 01356 g001
Figure 2. The color measurement device for this experiment.
Minerals 12 01356 g002
Figure 3. (a) Relationship between color coordinates a* and b* and the chroma C*. (b) A total of 20 iolite blue plots in the CIE 1976 L*a*b* uniform color space.
Minerals 12 01356 g003
Figure 4. The crystal structure of iolite (from Christian Bertoldi [33]).
Minerals 12 01356 g004
Figure 5. w(FeOtot) is significantly negatively correlated with w(MgO), and the discrete gray points are due to a small amount of Mg2+ substitution by Mn2+.
Minerals 12 01356 g005
Figure 6. UV–vis spectroscopy of the iolite.
Minerals 12 01356 g006
Figure 7. Relationship between w(FeOtot) and color parameters.
Minerals 12 01356 g007
Figure 8. Comparison of color parameters under three kinds of standard light sources. (a) Comparison of the lightness L*, the chroma C*, and the hue angle ; (b) comparison of color coordinates a* and b*.
Minerals 12 01356 g008
Table 1. Gemological properties of iolite samples.
PropertiesResults
ColorLight blue to blue–violet
Weight0.553–0.811 ct
Refractive indices1.532–1.551
Specific gravity2.409–2.596
PleochroismDichroism visible to the naked eye
Strong to medium blue or blue–violet; colorless to yellow
Microscopic inclusionsNeedle-like or columnar gas–liquid inclusions
Fingerprint-like inclusions
Table 2. The ED-XRF data of iolites.
SampleIol-1Iol-4Iol-7Iol-5Iol-11Iol-12Iol-14Iol-18Iol-20
Simulated colorMinerals 12 01356 i001Minerals 12 01356 i002Minerals 12 01356 i003Minerals 12 01356 i004Minerals 12 01356 i005Minerals 12 01356 i006Minerals 12 01356 i007Minerals 12 01356 i008Minerals 12 01356 i009
L*67.0764.8560.4458.9255.7249.0646.8535.8929.47
C*10.469.9610.8211.2212.6421.2221.7218.487.60
288.50288.93290.51290.29290.33290.81291.21293.21295.25
Oxides (wt%)
SiO248.75848.37249.19348.90750.04549.20148.85649.20449.089
Al2O334.72734.58534.06534.83534.46234.51035.11734.78735.012
MgO13.18614.03113.34212.98211.62312.54412.61511.4339.249
Fe2O32.0261.8482.4322.3932.6432.2592.4933.5565.180
SO31.1500.9360.8340.6890.9471.2850.8440.8851.026
MnO0.0710.0200.0330.0970.0740.0600.0340.0420.280
Others0.0820.2080.1010.0970.2060.1410.0410.0930.164
Total100.00100.00100.00100.00100.00100.00100.00100.00100.00
Table 3. Results of bivariate correlation analysis.
Oxides (wt.%) L*C*
FeOtotr−0.831 **0.0050.877 **
sig0.0000.9840.000
MnOr−0.387−0.2190.439
sig0.0920.3540.053
FeOtot + MnOr−0.822 **−0.0100.869 **
sig0.0000.9670.000
Table 4. ANOVA results for the color parameters.
Color ParametersdfMean SquareFp
L*21.5570.0200.980
a*260.62928.9950.000
b*219.5420.9240.406
C*222.8840.9900.381
h*2771.901379.4420.000
Publisher’s Note: MDPI stays neutral with regard to jurisdictional claims in published maps and institutional affiliations.

