Article

Corrosion of Carbon Steel in Extreme Environments by Acid Mine Water: Experimental Study of the Process Using a Factorial Analysis Tool

by
Juan Carlos Fortes
*,
Javier Castilla-Gutierrrez
,
Aguasanta Sarmiento
and
José Antonio Grande
Sustainable Mining Engineering Research Group, Department of Mining, Mechanic, Energetic and Construction Engineering, Higher Technical School of Engineering, University of Huelva, 21007 Huelva, Spain
*
Author to whom correspondence should be addressed.
Minerals 2022, 12(8), 1030; https://doi.org/10.3390/min12081030
Submission received: 6 July 2022 / Revised: 12 August 2022 / Accepted: 13 August 2022 / Published: 16 August 2022

Abstract

:
Acid mine drainage (AMD) is a process resulting from mining activity, which has a potential degrading effect on metallic materials used in machinery and structural installations, mainly carbon steel composites. This work shows how steel is affected and degraded by AMD, as well as the physicochemical changes that occur in the solvent as a consequence of the metal corrosion process. For this purpose, thirty specimens were immersed in AMD for thirty weeks and were removed once per week, observing the changes that had occurred both in the metal and in the solvent to which it was exposed. The results show a material degradation with a loss of weight and alterations in the acid drainage with an increase in pH, total dissolved solids (TDS) and modifications in the rest of the solvent characteristics. The data from the measurements of the plates under study, together with the physicochemical data of the resulting reagent solution, were integrated into matrices for subsequent graphical–statistical processing using Statgraphics Centurion software, a powerful tool for exploratory data analysis, statistical summary, analysis of variance, statistical control, multivariate analysis, time series, etc., and which allows the different variables studied to be classified into categories or proximity ratios.

1. Introduction

Acid mine drainage (AMD) is a global problem that affects all five continents and occurs mainly in the mining of metallic sulphides and coal, as a consequence of the oxidation of these sulphides, releasing hydrogen ions and immediately lowering the pH. As a result, leachate is obtained that presents, in addition to an extraordinary acidity, high concentrations of metals, metalloids, REE (rare Earth elements) and sulphates in solution [1,2]. The result of the process is the degradation of the water environment, which becomes unusable for any use other than mining, as it takes on high acidity values and concentrations of metals and sulphates [3,4,5,6], reaching negative pH values [7]. It is also the most serious and long-term environmental problem caused by the mining of sulphide minerals, both metallic and non-metallic, as in the case of arsenic described by Grande et al. [8]. Thus far, no global solution has been found for all scenarios affected by the process; thus, mining facilities and receiving rivers are highly affected by this phenomenon.
The main sulphide oxidation reactions are extensively described in Younger et al. [9]. The oxidation of sulphides due to exposure to oxygen, water and microorganisms [10,11,12,13,14,15] follows the basic equations shown in Equations (1) and (2) [16]:
F e S 2 + 7 / 2 O 2 + H 2 O F e 2 + + 2 S O 4 2 + 2 H +
F e 2 + + 1 / 4 O 2 + H + F e 3 + + 1 / 2 H 2 O
In addition to the countless environmental problems caused by AMD, of which water is undoubtedly the greatest exponent, as it suffers physicochemical alterations that lead to extremely low pH values, even reaching negative pH values [7], there are other economic and social problems associated with the safety of machinery and installations, which are currently of particular interest due to the high cost of maintenance and repair of machines, tools, structures and installations subjected to these extraordinarily aggressive environments for metal alloys and conditioning, including their durability and the safety of users.
There are numerous studies in the scientific literature on the effects of saline water on metal alloys [17,18,19]. However, in mining environments, the impact of acid mine water on machine elements is a young and emerging line of work due to what is described in the previous paragraph. In this work, the corrosion of steel in AMD is studied, which is already new because there are few works on this subject, but in addition, the data are analysed using a tool called factorial analysis, something that is also new.
Mining installations and machinery have a high metal component, both in the interior material (pumps, drills, augers, electrical and electronic equipment, interior support structures, rails, wagons) and in the exterior (trucks, machinery used in mineralurgy for the classification and size reduction of the ore, almost always wet, flotation cells, etc.). These materials are subject to a high degree of deterioration due to corrosion, with the consequent economic and safety costs that these entail [20,21,22,23,24].
Metallic materials suffer deterioration due to corrosion processes by chemical and electrochemical reactions, which can be accelerated depending on the environment to which they have been exposed [25,26], being noticeable when they are in aggressive environments such as AMD [27,28]. These corrosion processes cause material loss and strength in metallic materials, decreasing their performance. This leads to safety, stability and economic concerns; thus, their analysis has become a relevant process and hence the importance of knowing the conditioning factors that cause and favour it, such as the elements present in the AMD, low pH, the presence of microorganisms, dissolved metals and minerals, temperature, dissolved oxygen, and the hydrogeochemistry of the water itself.
The selection of material is made according to a series of physical, chemical, mechanical and technological properties that respond to the foreseen criteria of viability, duration, safety and cost. The failure of a material, for example, in a structure or machine, can cause the rest of the system to malfunction or even collapse, implying not only a lack of quality but also the consequences that can result from a safety point of view. It is in this context that corrosion failure of the materials used becomes a major factor to consider.
An effective diagnosis of the processes, reactions and results that take place when an alloy is in contact with these waters is a prerequisite for the proposal of measures to improve the durability of these materials by opening lines of work aimed at this.
For the accomplishment of this paper, a bibliographic search was carried out that showed the little scientific literature related to corrosion of steel by AMD. The reactive solution was taken in a stream affected by acid mine drainage. The water was transported to the laboratory in polypropylene bottles previously washed with diluted nitric acid in closed containers and protected from direct light. Then, the water was placed in open containers and with a stirrer so that it was in continuous movement. Submerged plates were removed weekly and weighed, measured, and solvent water analysed. All data obtained were studied with Statgraphics Centurion.
The main objective of this work is to analyse in the laboratory how corrosion evolves in carbon steel subjected to the action of AMD water and to establish the cause–effect relationships between the alterations measured during 30 consecutive weeks, as well as the physicochemical composition of the reactive solution itself. To achieve the predetermined objectives, the data were statistically processed using the statistical package Statgraphics Centurion VII.

2. Materials and Methods

For this experiment, thirty “0.05 m × 0.06 m × 0.006 m” carbon steel metal plates (%C < 0.25) were used whose chemical composition is in % (Properties of the material extracted from the certification test): C = 0.20; Mn = 0.49; Si = 0.21; S = 0.017; P = 0.011; Cu = 0.22; Cr = 0.08; Ni = 0.11; Ceq = 0.32. These plates were immersed in a reagent solution using individual plastic containers of 0.8 L capacity. The plates rested on a circular plastic ring to ensure that the maximum surface area was in contact with the reagent solution.
The reactive solution was taken in a stream affected by acid mine drainage, located in the Iberian Pyritic Belt. This stream is the recipient of effluents contaminated by the Tharsis Mines as an emblematic watercourse of one of the world’s largest sulphide metallogenic provinces, with over 5000 years of mining without preventive or corrective measures [29]. The initial physicochemical characteristics of the reactive solution are pH 2.9, redox potential (Eh) 220 mV, total dissolved solids (TDS) 2.41 mg/l and electrical conductivity (EC) 4.9 mS/cm. A reserve of 50 L of the same water was kept open and stirred to replenish the reagent solution as it evaporated. The water was transported to the laboratory in polypropylene bottles previously washed with diluted nitric acid in closed containers protected from direct light. In the laboratory, it was deposited in open containers and with a stirrer so that it was in continuous movement.
The 30 plates were introduced into the reagent solution on the same day (30 January 2021) and removed weekly; thus, the first plate was in contact with the reagent solution for one week and the last plate for 30 weeks (6 September 2021). The experiment was carried out at rest and without agitation.
Each extracted metal plate was cleaned and dried before being weighed and measured (width, height and thickness). The physicochemical parameters (pH, EC, TDS, Eh and T (temperature) of the resulting reagent solution were also measured using a HORIBA LAQUA PC-110-K multi-parameter meter (Horiba ABX, Madrid, Spain).
The data from the measurements of the plates under study, together with the physicochemical data of the resulting reagent solution, were integrated into matrices for subsequent graphical–statistical processing using Statgraphics Centurion software (Royal Technologies S.A., Hudsonville, MI, USA), a technique widely used in environments affected by mining activity by [30,31,32,33], and a powerful tool for exploratory data analysis, statistical summary, analysis of variance, statistical control, multivariate analysis, time series, etc., and which allows the different variables studied to be classified into categories or proximity ratios [34].
Factor analysis is a technique that summarises the information contained in a matrix of data with “n” number of variables. For this, a reduced number of “f” factors are identified so that f is smaller than n. This reduced number of factors represents the original variables with a minimal loss of information.
The mathematical basis of factor analysis is attributed principally to Spearman [35], Hotelling [36], Thurstone [37], Kaiser [38] and Harman [39]. A thorough revision of these fundaments can be found in Cuadras [40]. Some examples of the applications of factor analysis to geology and hydrogeology are described in Davis [41]) and in McCuen and Snyder [42].
The calculations have been performed by multivariable methods of Statgraphics [43]. The summary of the application is:
(a)
Calculation of the correlation matrix of the variables, starting from the matrix of original data. Examination of this matrix.
(b)
Calculation of the factor matrix, starting from the Pearson’s “r” of the previous matrix.
(c)
Extraction of the two main factors in order to represent the data.
(d)
Rotation of the factors, in order to make their interpretation easy.
The values of the factor matrix can be improved by rotating the axes using the “varimax” rotation [38], which maximises the factors’ variance. Varimax rotation attempts to simplify the columns of the factor matrix by making all values close to either 0 or 1. This method tends to minimise the number of variables that present high saturations in a factor, resulting in a more straightforward interpretation.
The factor rotation endeavours to select the simplest and interpretable solution. In synthesis, it consists of the rotation of the axes of coordinates that represent the factors in order to approximate the maximum to the variables in which the axes of coordinates are saturated.
The rotated factor matrix is a linear combination of the first matrix and explains the same quantity of initial variance [34]. As a result, we obtained the grouping of variables around (determined) factors that we must define. Finally, the variables are represented in graphs of the relationship between the determined factors. In the graph, the coordinates of the variables represent the “weight” that each exercise on the factors considered.

3. Results and Discussion

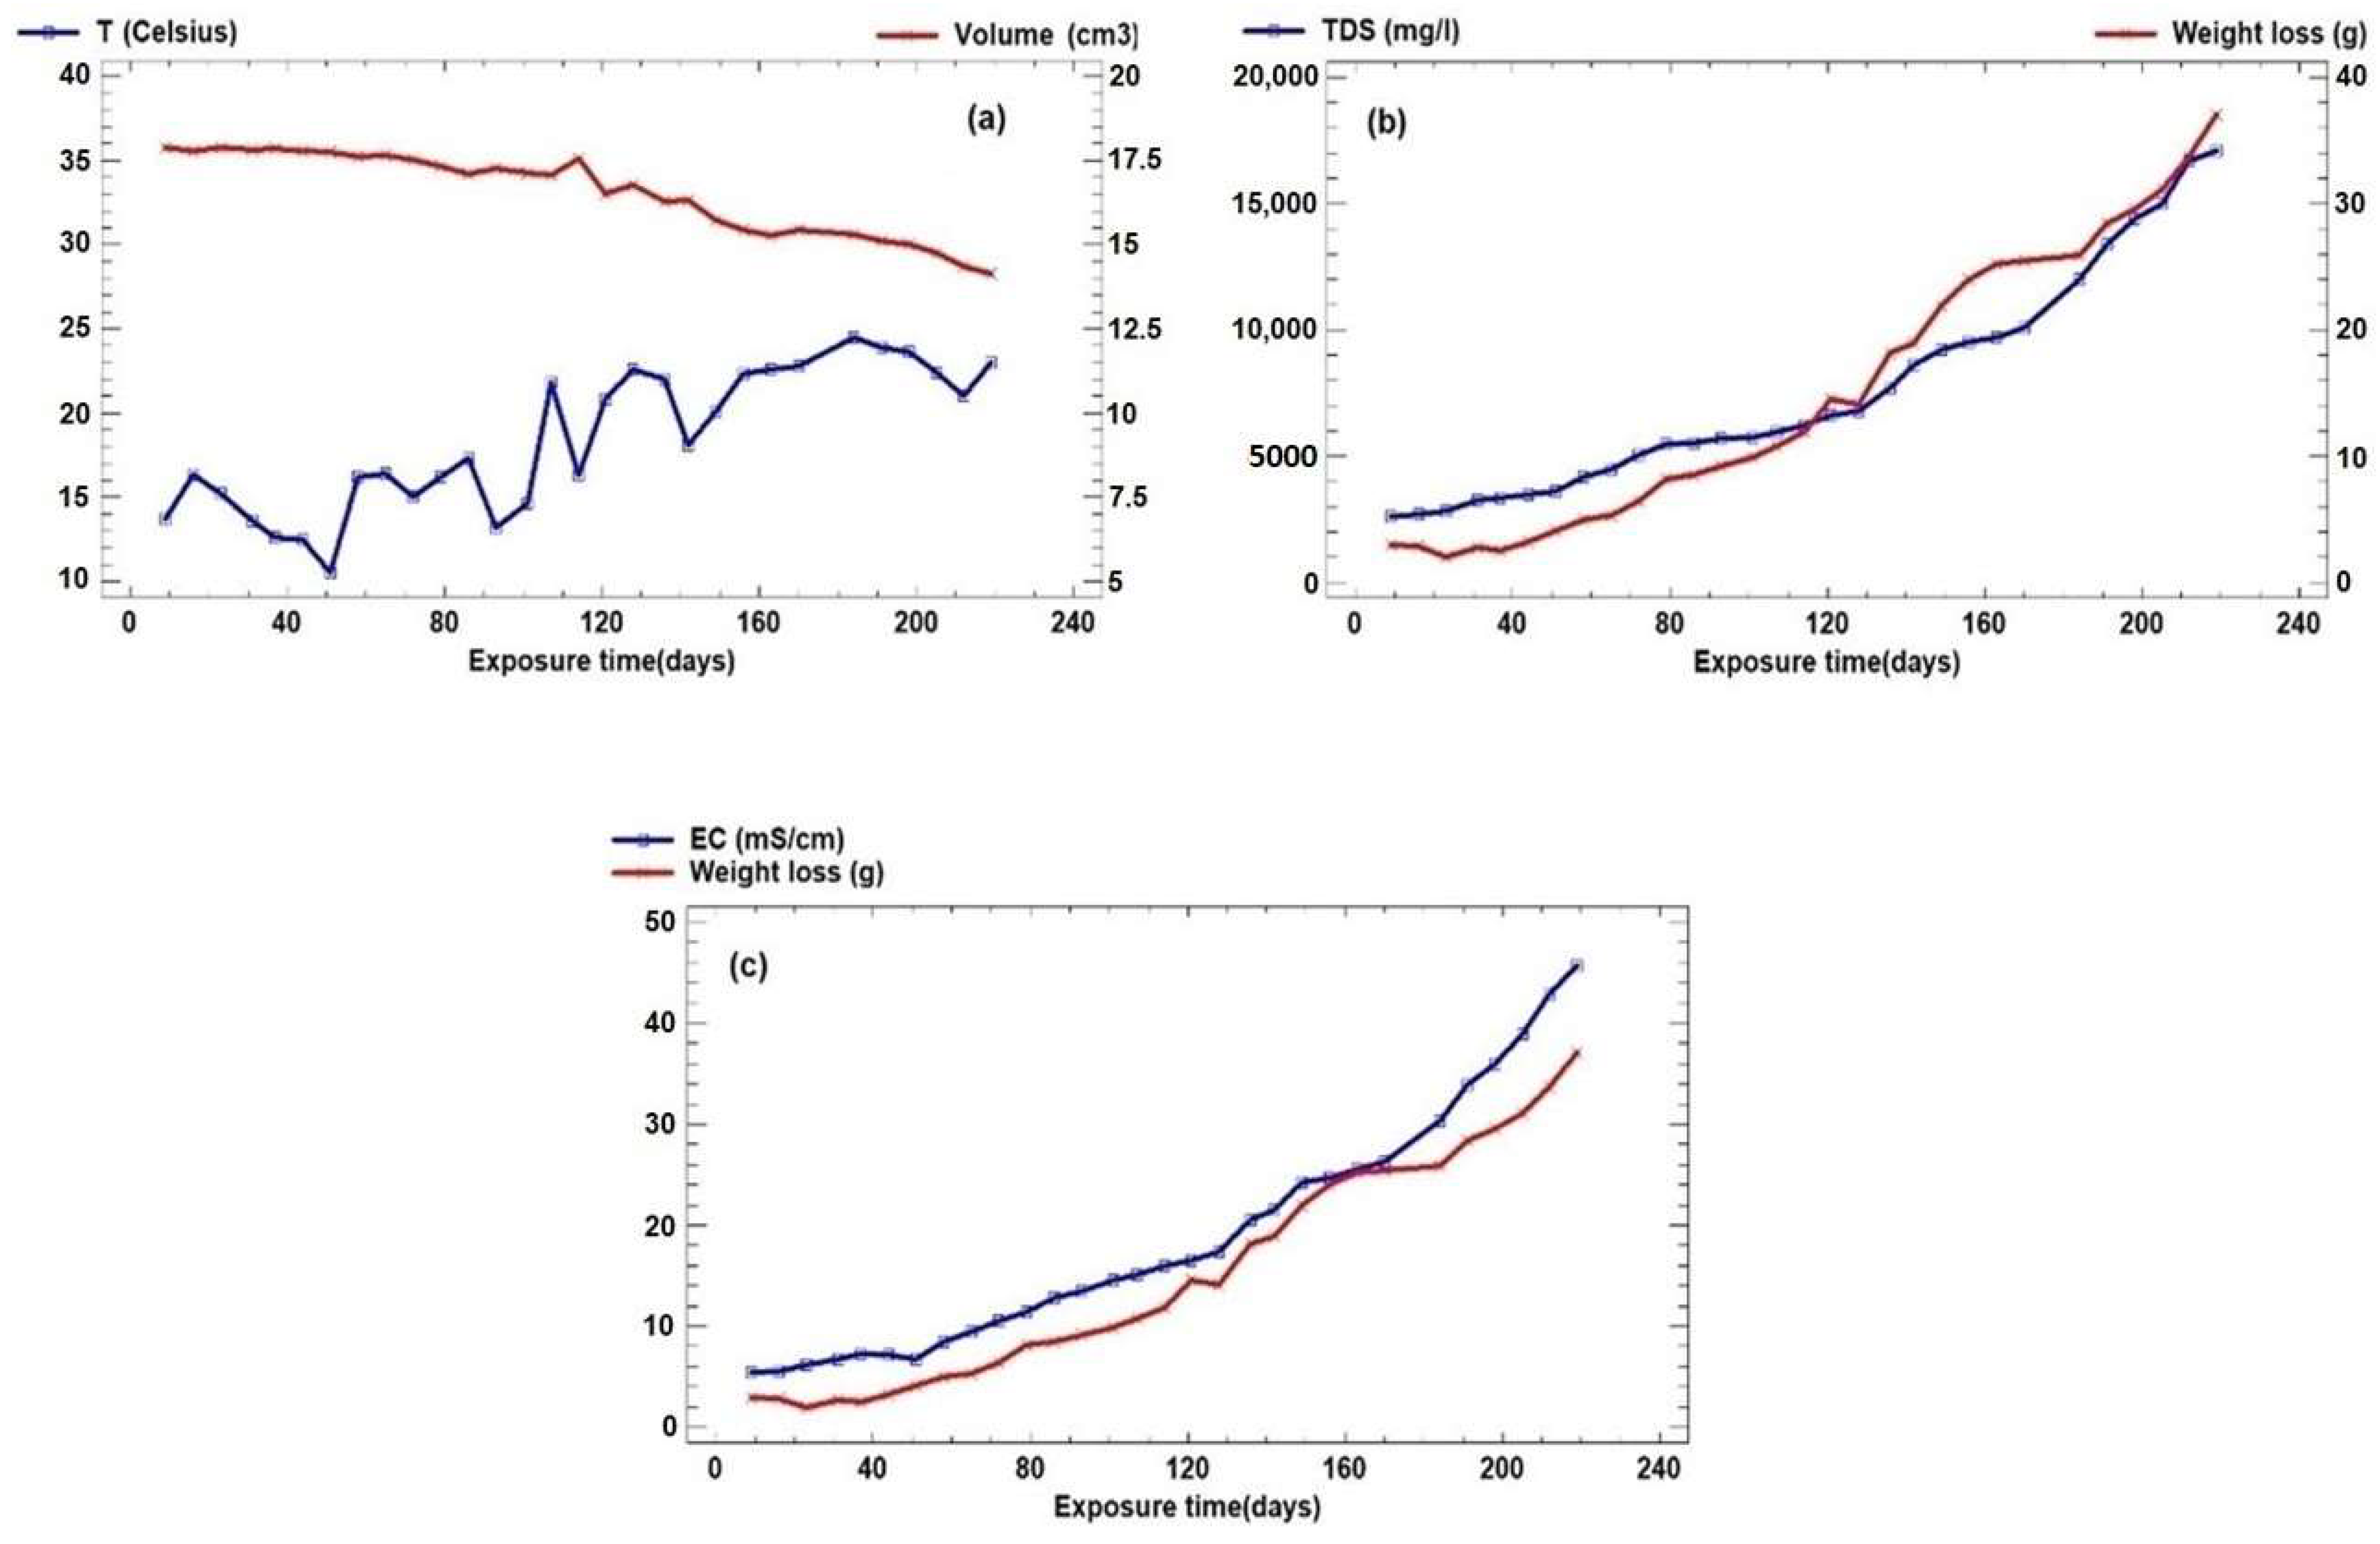
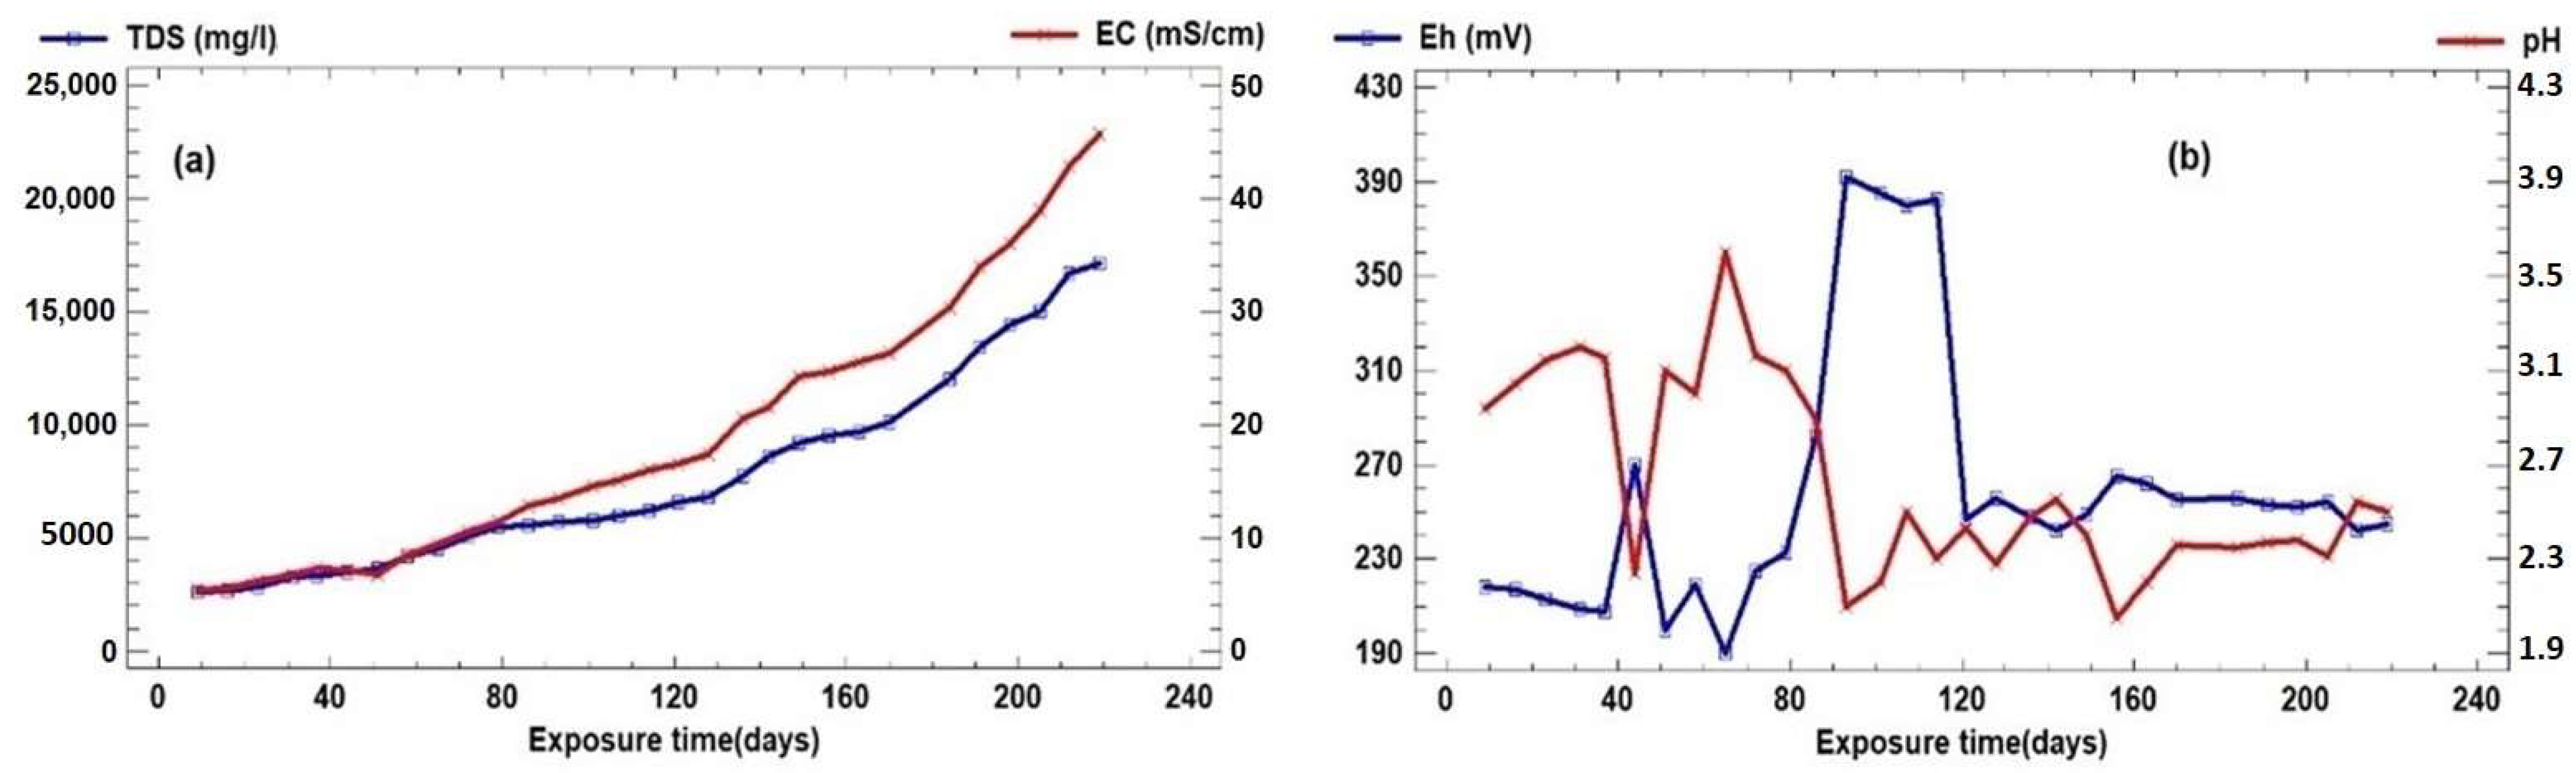
3.1. Graphical Analysis

For a first approximation to the knowledge of the processes and results of the experience, we began the modelling of the system through a graphic treatment of the evolution of the variables studied during the experience. The statistical summary of these variables is shown in Table 1.
In the thirty-week weekly count, the electrical conductivity (EC) increases from 5.4 mS/cm to a maximum of 45.6 mS/cm. This is due to the increase in Fe2+ in the reagent solution from the steel plate (Figure 1a, comparison of the evolution of EC and TDS). It can be observed that after 80 days of exposure, the total dissolved solids do not show the same relationship with the electrical conductivity, possibly due to the considerable increase in the Fe2+ ion.
Figure 1b shows the evolution of pH and Eh, where it can be seen how pH varies from a value of 2.05 to 3.6. This value can be considered practically constant, with minor variations that may be due to the processes taking place. The oxidation of the Fe coming from the steel plate consuming protons and the hydrolysis of the Fe3+ coming from the reactive solution itself generate protons.
Regarding the Eh value, it presents a range of 202 millivolts, which is high, as it reaches values close to 400 mv as a response to the degree of alteration of the ferrous matrix and the implications on the oxidation–reduction potential of the aqueous medium. The Eh shows specular peaks with the pH values up to day 120, after which both parameters remain practically constant (Figure 1b, Eh–pH evolution).
The temperature shows an upward trend, with a range of 14° Celsius, and although it shows oscillations due to the outside temperature, the exothermic corrosion reaction that is taking place in the plates immersed in the solvent liquid can be observed (Figure 2a, temporal evolution of temperature and volume). The temperature has a clear, albeit discrete, relationship with the volume of the plate, showing the exothermic reaction that causes, over time, the heating of the immersion water at the expense of the metallic corrosion processes.
The weight loss presents a high range that reaches 37 g accumulated since we start from a test tube with a mass of approximately 140 g, and this weight loss has been increasing as the EC and TDS also increases (Figure 2b, temporal evolution of weight loss and TDS and 2c, temporal evolution of weight loss and EC), which is logical if we understand that the material lost from the plates has been passing into the solvent, which has produced an increase in the last two parameters. This weight loss has led to a noticeable reduction in the volume of the plates, as was to be expected.
It is evident how the accumulated weight loss increases with time until the plates practically disappear, as we have been able to verify in a parallel experiment carried out in the same riverbed with the same type of material (plates and reactive solution), in this case accelerated by the mechanical abrasion processes induced by the kinetic energy of the river water, which systematically removes the layers of oxides and sulphates, detaching them from the plate to continue with the oxidation of the Fe of the steel (Figure 3, evolution of volume loss in specimens submerged in the same AMD river).
Figure 2c validates the operating model by comparing the evolution of the electrical conductivity with the weight loss. This weight loss is due to the dissolution of Fe from the steel plate, which passes into the reactive solution as Fe2+, thus increasing the conductivity.

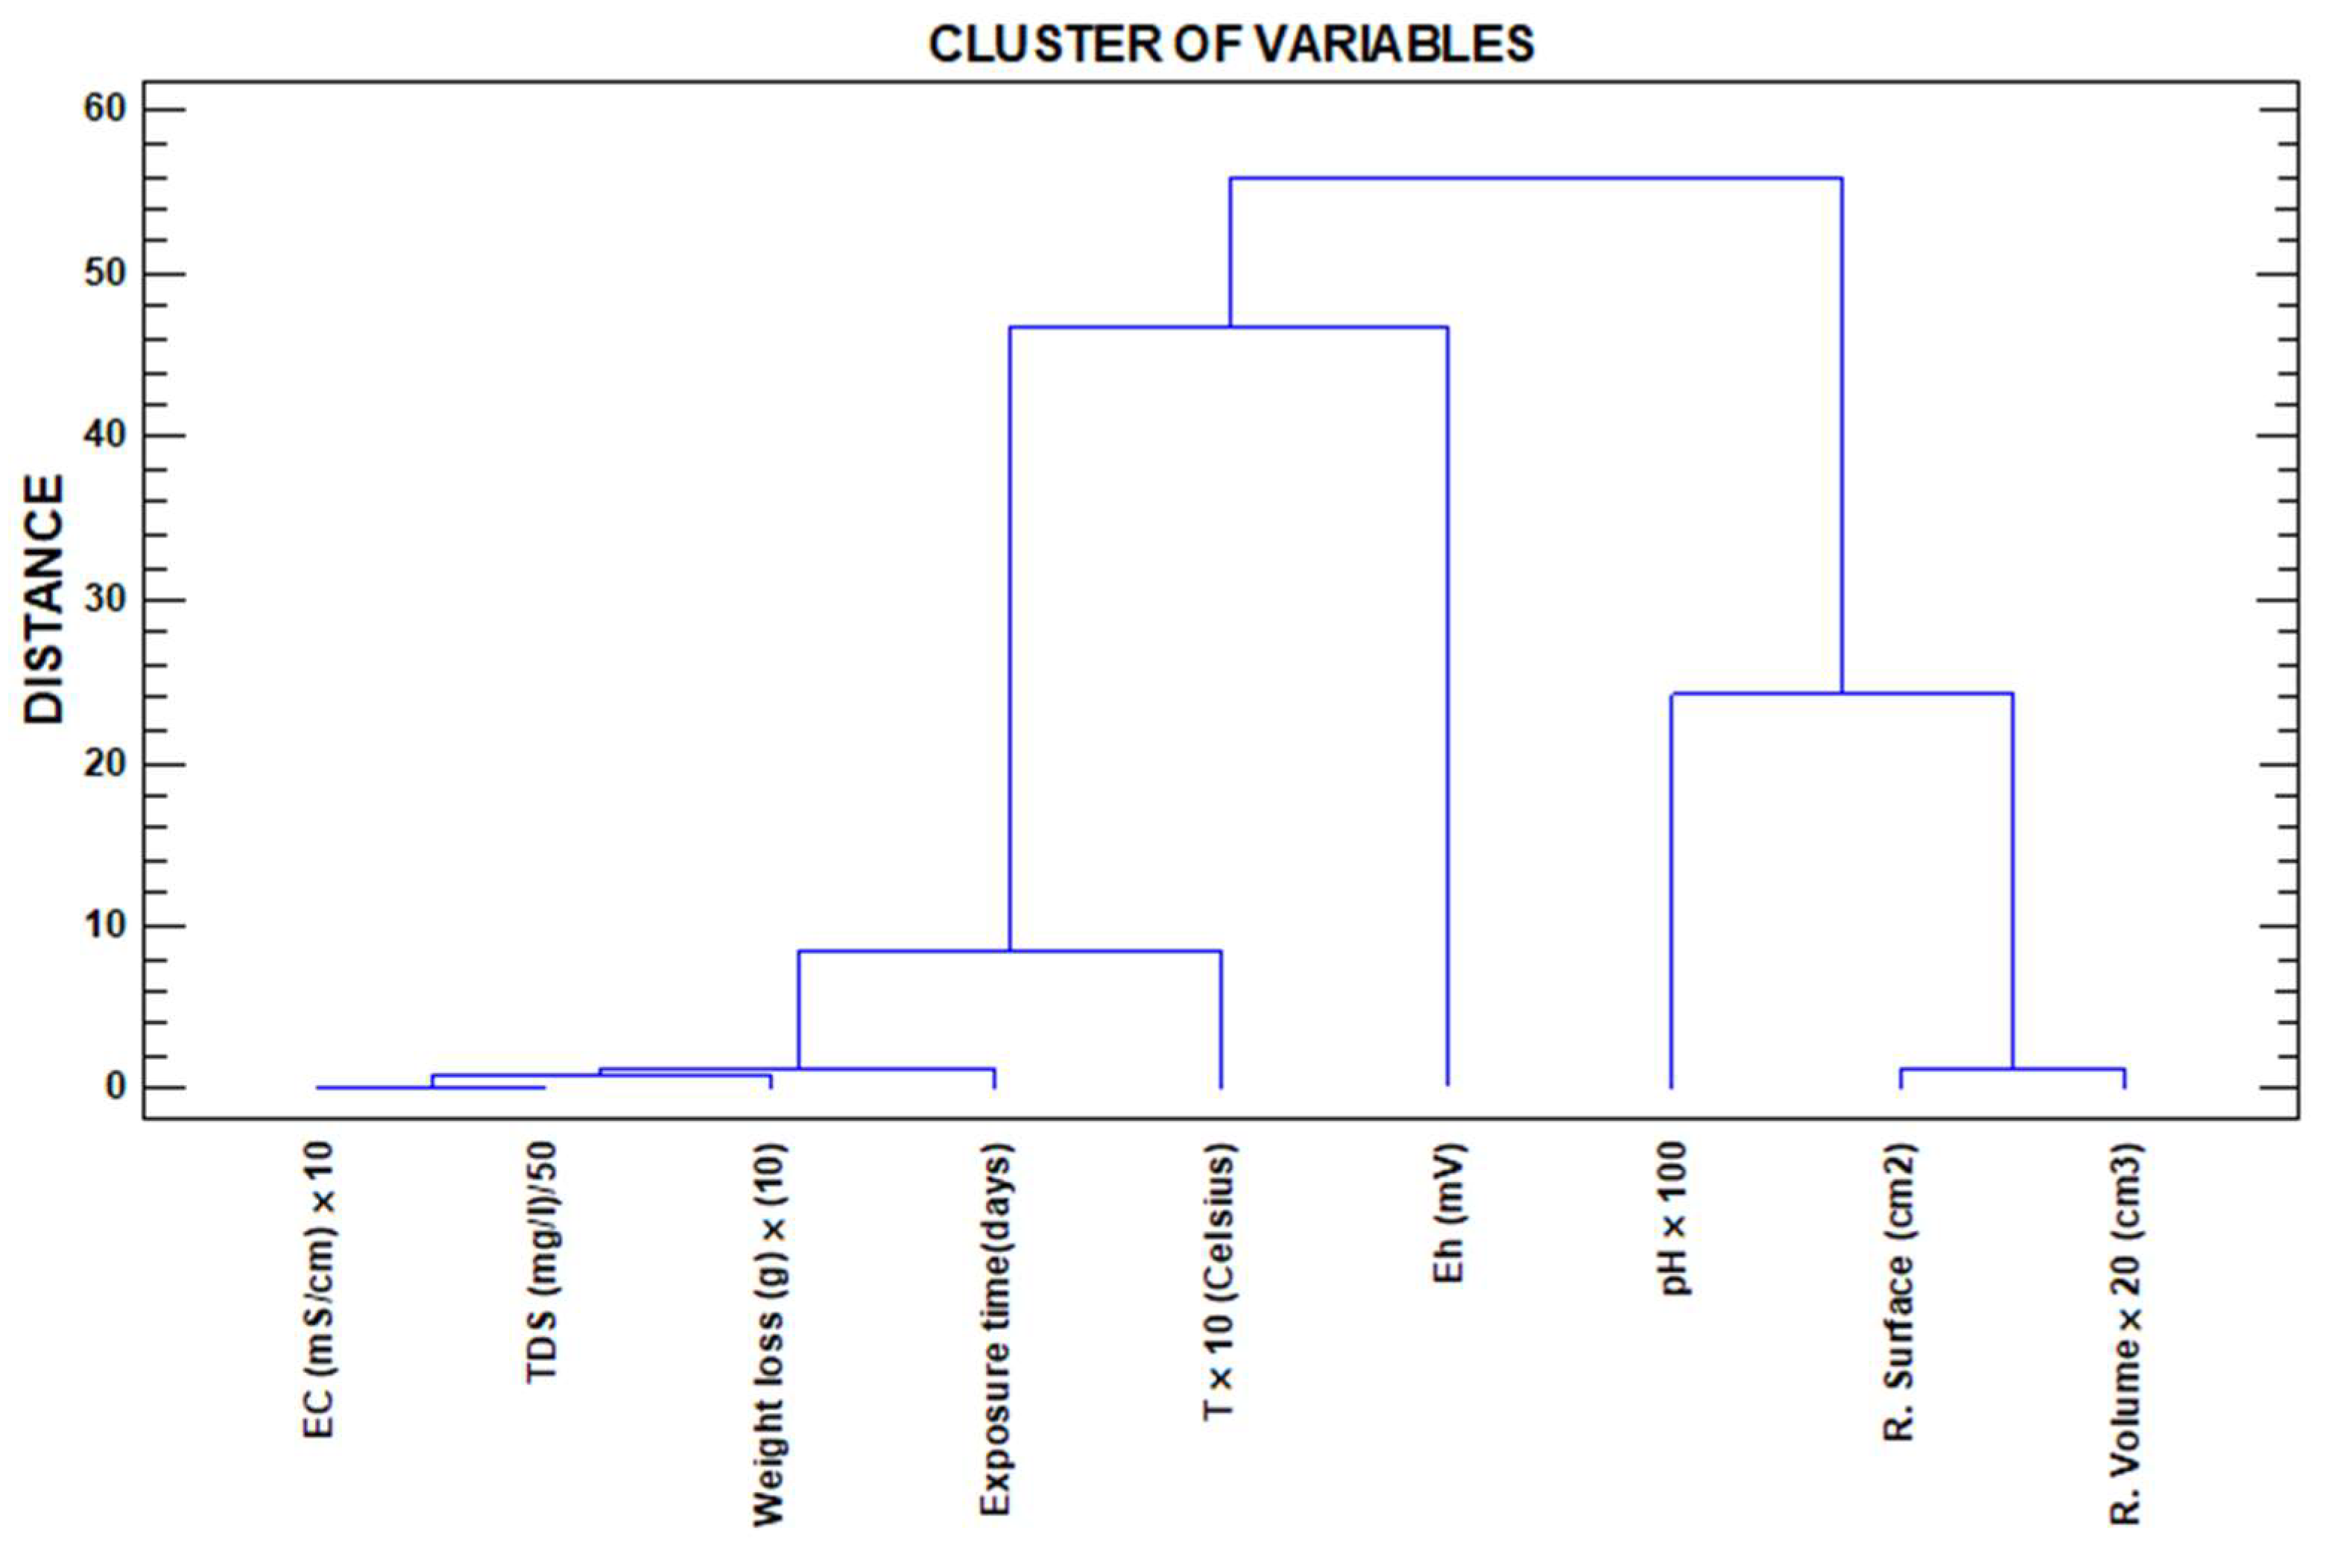
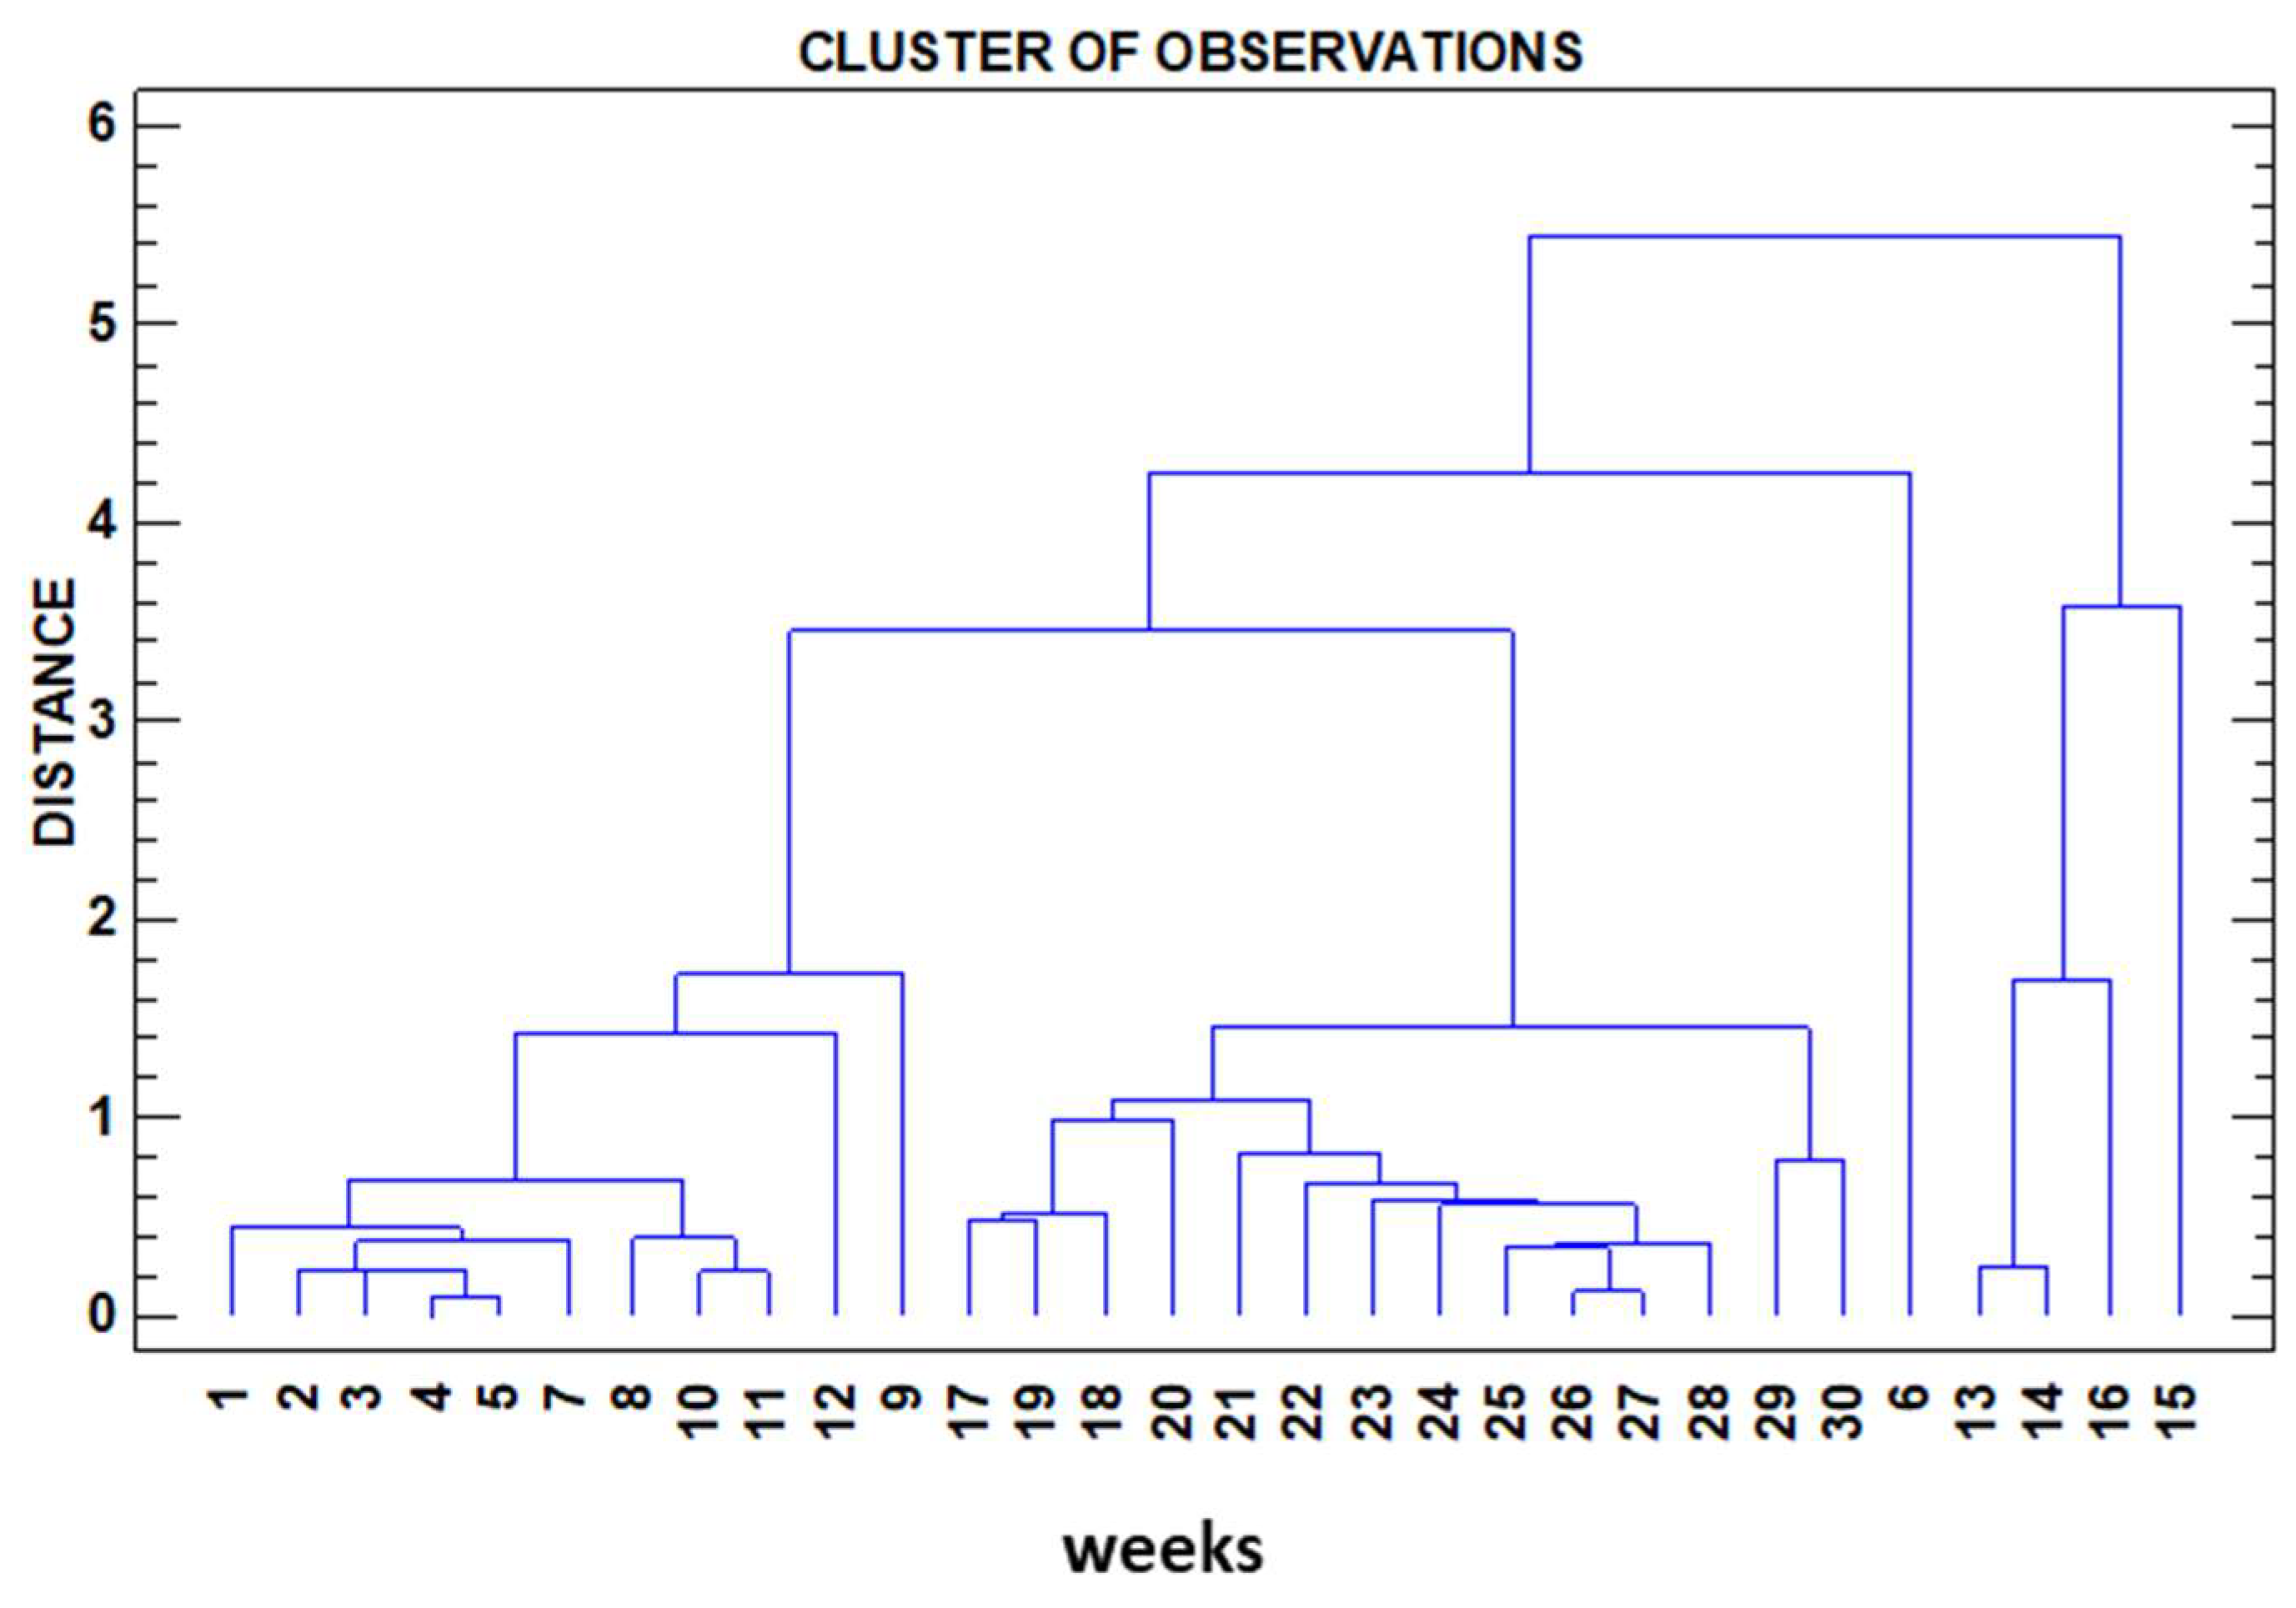
3.2. Cluster Analysis

Cluster analysis allows us to rank the distance between variables by Pearson proximity ratios, understood as ratios of non-linear dependence between them. In this work, cluster analysis is approached from two different perspectives, Figure 4 (variable dendrogram) and Figure 5 (dendrogram of observations).
While in Figure 4, we consider as variables the physicochemical parameters determined in the test (inputs to the software), in this case, we use these same variables as the output of the cluster. In Figure 5, using the same input and identical variables, we request as output to the software the sampling weeks, which naturally carry the information of the variables determined in each of these weeks, thus grouping the sampling weeks according to the information carried by the variables determined in each of the weeks.
Focusing on Figure 4, cluster of variables, two main subclusters can be observed. To the right of the image and with a high Pearson proximity, the variables’ residual surface and residual volume are found. In this same first subcluster, the variable pH is linked with a somewhat more discrete proximity ratio. A first observation that can be made is that the residual surface and residual volume are intimately dependent on the pH.
The second subcluster on the left-hand side of the figure shows the rest of the variables grouped together with extraordinarily high proximity ratios between EC and TDS; this is because dissolved solids, mainly sulphates, are almost exclusively responsible for EC variations [44]. The EC and TDS variables are linked with a high ratio of proximity to the weight loss variable since the dissolved solids in the solvent come from the loss of material from the plates, and these three are closely linked to exposure time. The longer the exposure time is, the greater the capacity for dissolution reactions of the plate, the higher the values of dissolved solids in water and, thus, the higher the EC values will be, which corroborates other experiences developed in the field [45,46].
Linked to the second subcluster, but more distally, we find the Eh variable. To justify the non-existence of a higher Pearson’s R, we have to invoke the existence of oxidation–reduction and precipitation–dissolution processes, all in a closed system such as the immersion test tubes and the volume of reactive water itself, with which we understand that the hydrolysis processes, fundamentally of iron, play a fundamental role but different to what happens in open systems (rivers affected by AMD), where pH and Eh present a quasi-linear but inverse relationship due to the logarithmic character of this second variable.
As for the cluster in Figure 5, we observe, as in the first one, a marked proximity ratio between variables and an acceptable grouping according to the sampling time. This fact points to several issues.
(1)
The analyses and in situ measurements have been correctly carried out as evidenced by the high correlation coefficients.
(2)
Another remarkable evidence is that something happens in some weeks (13 and 17), which is precisely where the main clusters split into subclusters. We are probably approaching in those weeks the saturation limits of dissolved elements in the immersion water coming from the plates, which are losing weight in favour of a greater amount of total TDS and other additional changes related to the already mentioned oxidation-reduction and precipitation-dissolution processes, always linked to the already mentioned phenomenon of iron hydrolysis as explained above.
Note in this cluster in Figure 5 how the week numbers appear in a correlative order. This fact is not random; according to the numerical order of the variables under study, the software itself has clustered them according to the variables under study. There are two “jumps” with weeks 6 and 9 that appear “out of place” in the numerical sequence, which we understand is justified by the reasons given above.

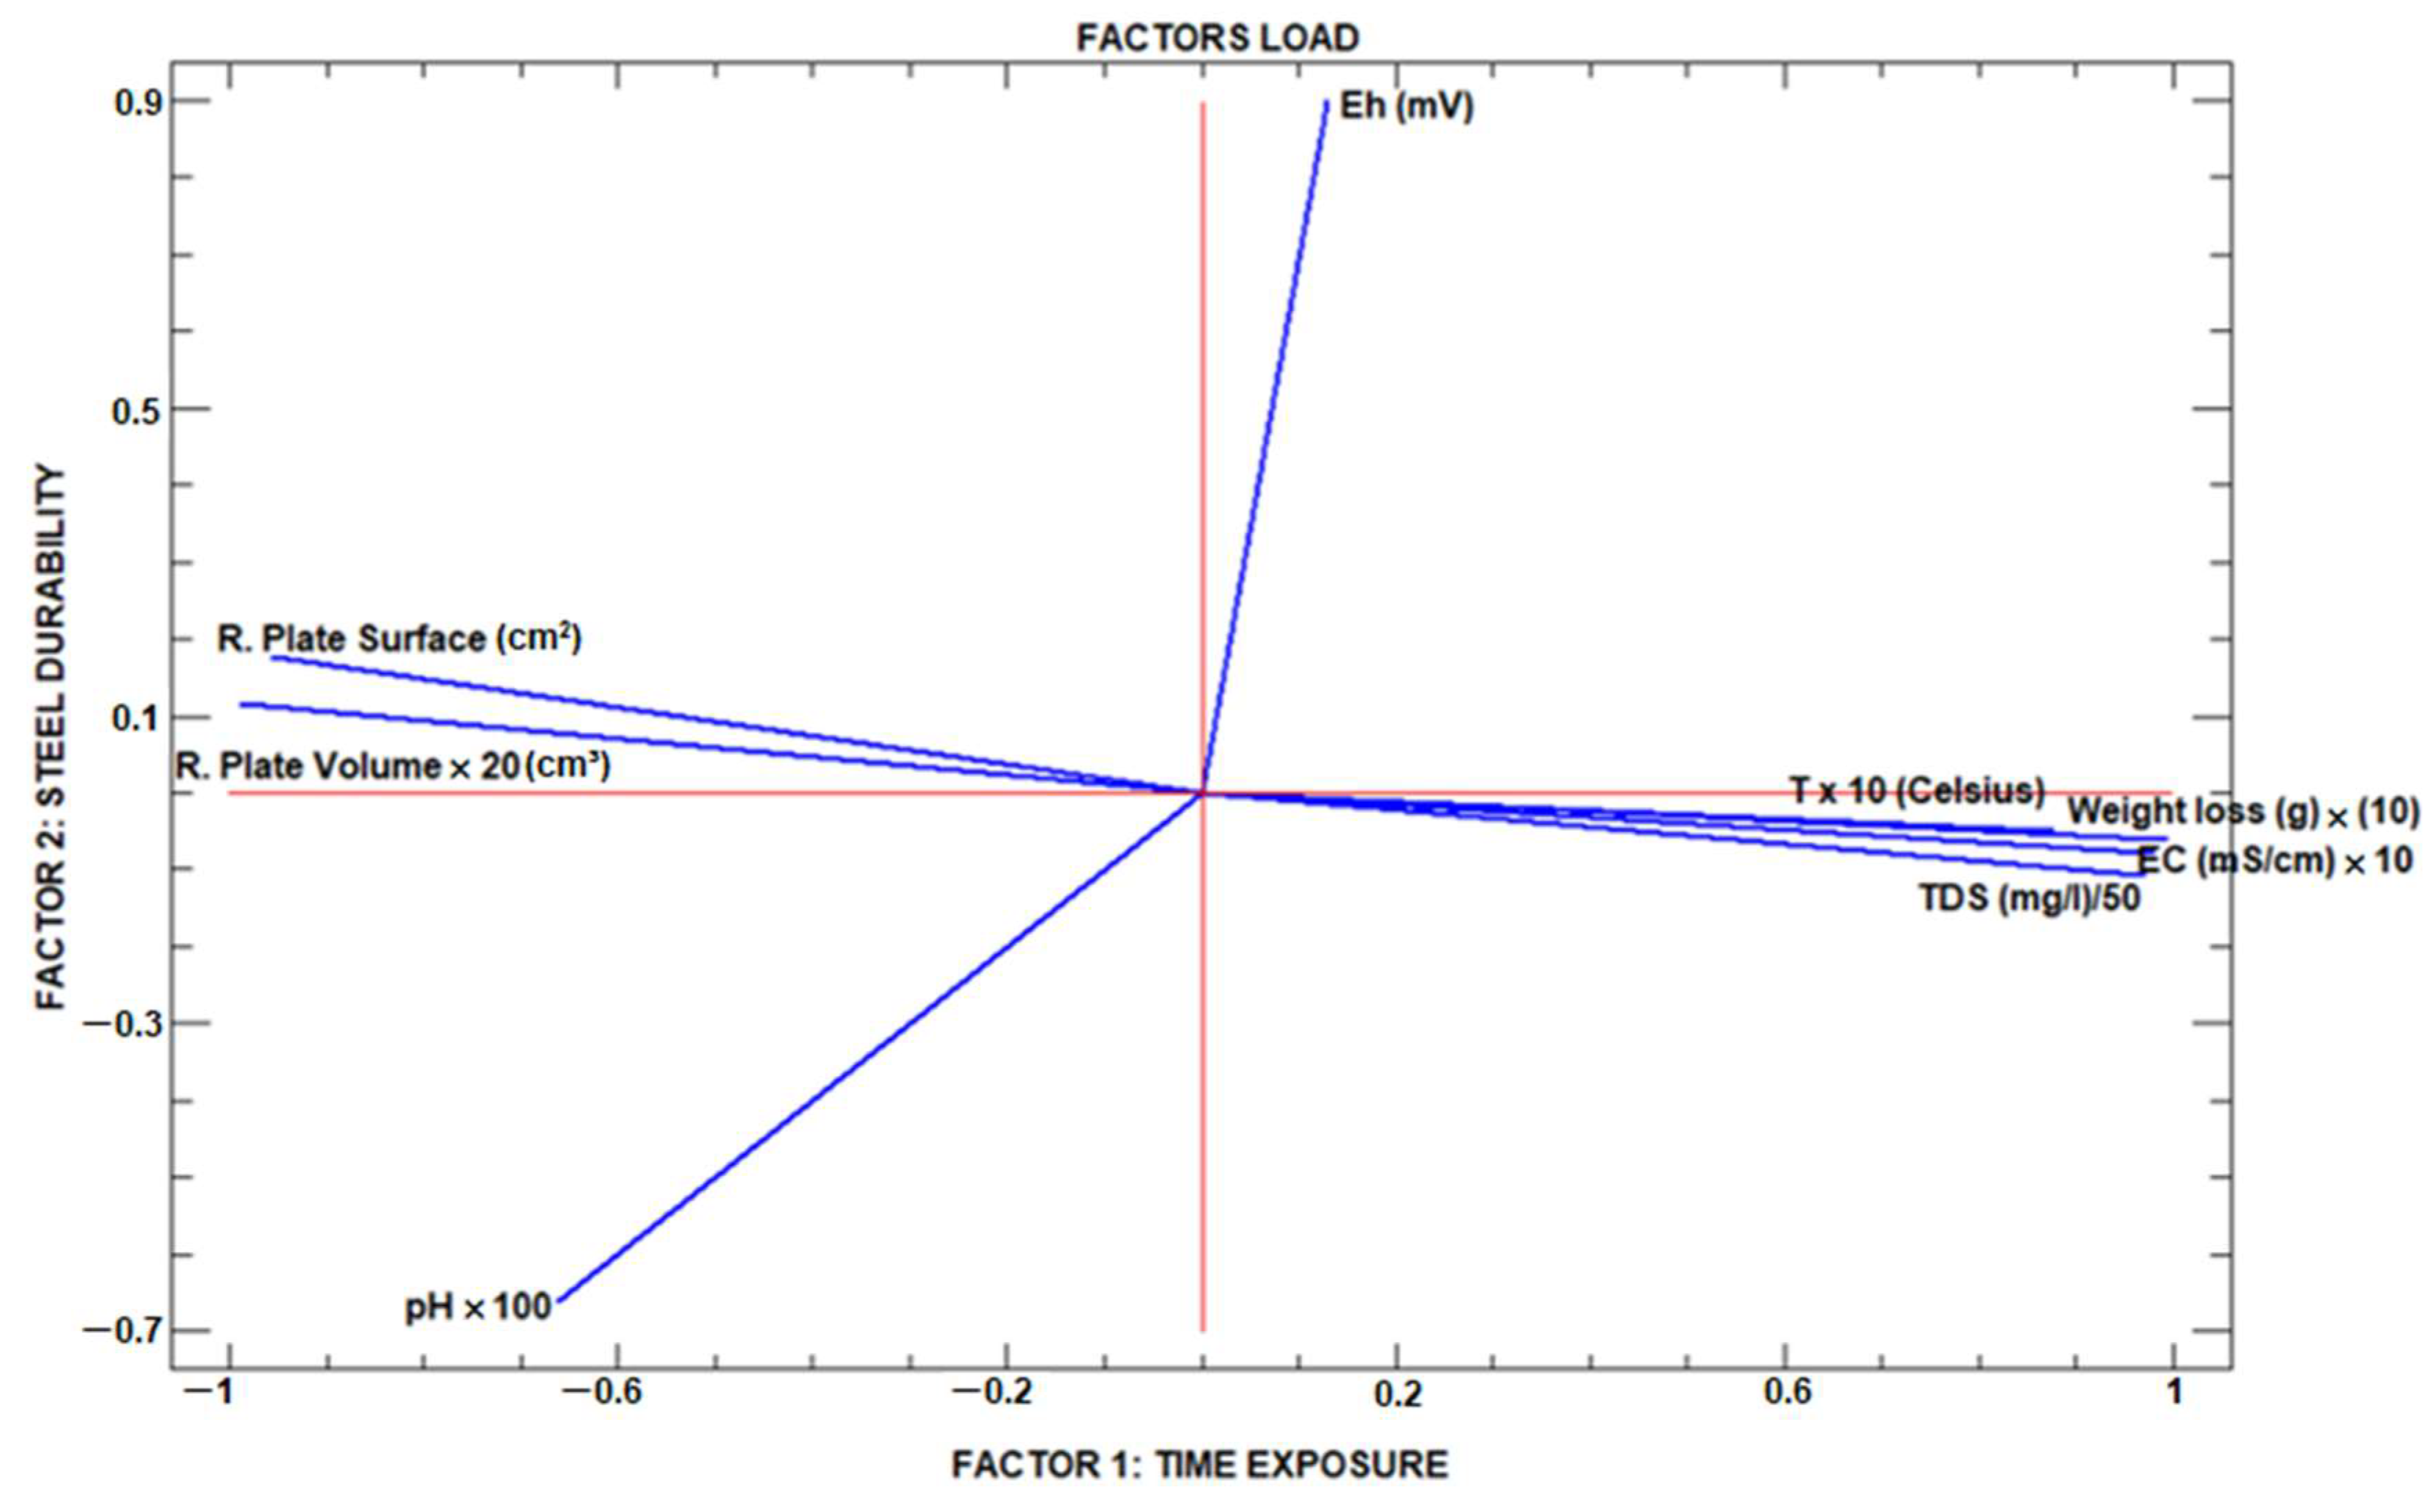
3.3. Factor Analysis

The graph in Figure 6, factor analysis graph, shows the result of the application of factor analysis in which a varimax rotation has been implemented, maximising the factors’ variance. This method tends to minimise the number of variables with high saturations in a factor, making interpretation easier. In short, it consists of rotating the coordinate axes representing the two factors to be defined until they are as close as possible to the variables in which they are saturated.
In Figure 6, the eight variables under study are grouped into four fields, remembering that these two factors are two new variables not considered until now during the sampling and measurement work but which by themselves govern the functioning of the water–plate system, with a minimum loss of information since only with these two factors is the variance justified up to 98%.
If afctor 1 is defined as time exposure and factor 2 as steel durability, factor 1 has a clear positive and high influence on the variables T, weight loss, EC and TDS (measured on the X-axis). At the same time, the variables residual plate surface and residual plate volume are negatively influenced with high values by this same factor.
It is evident that the water-test plate immersion system will suffer over time a progressive increase in the TDS and consequently of the EC at the expense of the weight loss that represents that part of the initial plate that is now mostly dissolved in water. In this same group of variables, the Tª is found since the process of plate alteration is clearly exothermic [47].
Concerning this same factor, the variables residual plate surface and residual plate volume are observed at the opposite end of the spectrum to the previous group, as could not be otherwise; these two variables decrease as the exposure time increases.
With regard to the pH variable, the exposure time exerts a notable influence with a negative value, remembering that this variable is a logarithmic expression that indicates the degree of acidity–aggressiveness of the water so that lower pH values indicate more acidic water, which is why it is represented with negative values on the X-axis (Factor 1).
At the same time, the Eh has a moderate and positive influence due to the solubility of the metal in the solvent water, which decreases as the solvent loses its capacity for oxidative alteration of the submerged plates.
Different authors [48,49,50] have implemented this same statistical tool for mine water, verifying that the Eh value is almost linearly opposed to the pH value when the experiment is carried out in a natural environment, i.e., with constant renewal of the immersion water, generally in mine beds. In this case, as the water in which the hydrolysis process, and thus the available oxygen, is subject to a closed system, the pH–Eh contrast is not strictly linear, such that the influence of the exposure time on the Eh, although positive, takes a discrete value.
Concerning factor 2, steel durability, it can be seen how the residual variables surface and volume take a positive and not high value, while TDS, EC, LW and Tª are linearly opposed to the two previous ones, taking negative and discrete values. In order to explain this phenomenon, it must be taken into account that we are in a closed system and with a water volume of less than 1 litre, which slows down the whole process in comparison with what would happen in a natural environment, where new water, less saturated in TDS, would have a much greater capacity to alter the plate. Regarding this same factor, it is observed that it has a high, albeit negative, influence on the pH variable for the same reason mentioned above, related to the logarithmic nature of this variable, while it has a high effect on the durability of the plate. Plates that are more resistant to corrosion will hinder the oxidation processes and, with it, the oxidation–reduction potential.
As a limitation of this study, it must be said that it is a preliminary study; thus, the basic geochemical parameters were not evaluated, including the nature of the corrosion products formed.

4. Conclusions

The present work was carried out to study the affection of carbon steel, the most widely used material for manufacturing machine elements, engines, vehicles, parts, pipes and structural elements in mines. This study made it possible to see the cause–effect relationships between the physicochemical variations of the reactive solution and the affection suffered by the metallic material immersed in it. To this end, graphical and statistical treatments of the physical and chemical data derived from the study were carried out, concluding that AMD strongly attacks carbon steel, causing a notorious decrease in its volume and weight.
The main objective of this study has been to see how AMD waters influence the corrosion rate of carbon steel. There is little in the scientific literature on this subject, but in addition, the data are analysed using the factor analysis tool, something that is also new.
This work is the first time that factor analysis evaluates the corrosion processes of steel. It is shown to be an effective technique for the graphical–statistical validation of treatments (carried out with the same data matrix) and for the formulation of corrosion–AMD interaction models. It is shown that the material lost by the plates has passed into the immersion water, which has caused a change in the physico-chemistry of the solvent and has led to a notable increase in the TDS and consequently in the EC. It can be concluded that the pH undergoes few variations and that these are produced by the oxidation–reduction and precipitation–dissolution processes that occur in the system. The Eh has high values and is opposite to the pH for the first four months, but from then on, they have similar values due to the fact that the reactive solution was already highly saturated. Although fluctuating, the temperature increases throughout the experiment, which is expected, as the corrosion process is an exothermic reaction. It can be observed how the temperature increases at the same time the volume of the plate decreases, as the oxidation reaction causes the submerged metal element to lose material.
All these variables are closely related to the exposure time. Logically, the longer the immersion time of the plates, the greater the loss of weight and the resulting consequences described above. The dendrogram of observations shows an almost correct alignment of the plates, although some are misaligned due to the aforementioned oxidation–reduction and precipitation–dissolution processes which cause alterations.
The results obtained coincide with those reported by other authors in other scenarios studied. By means of cluster analysis, it has been possible to determine a significant relationship between the physico-chemical parameters of the water and the weight loss of the carbon steel plates.

Author Contributions

Conceptualization, J.C.F. and J.C.-G.; methodology, J.A.G. and A.S.; software J.A.G.; Validation A.S.; investigation J.C.F. and J.C.-G.; writing original draft preparation A.S. and J.A.G.; visualizations J.C.F.; supervision J.C.-G. All authors have read and agreed to the published version of the manuscript.

Funding

This work has been funded by an R&D&I project within the framework of the Andalusia FEDER Operational Programme 2014-2020.

Institutional Review Board Statement

Not applicable.

Informed Consent Statement

Not applicable.

Data Availability Statement

Not applicable.

Conflicts of Interest

The authors declare no conflict of interest.

References

  1. Valente, T.; Grande, J.A.; de la Torre, M.L.; Gomes, P.; Santisteban, M.; Borrego, J.; Sequeira Braga, M.A. Mineralogy and geochemistry of a clogged mining reservoir affected by historical acid mine drainage in an abandoned mining area. J. Geochem. Explor. 2015, 157, 66–76. [Google Scholar] [CrossRef]
  2. Sainz, A.; Grande, J.A.; De la Torre, M.L. Characterisation of heavy metal discharge into the Ria of Huelva. Environ. Int. 2004, 30, 557–566. [Google Scholar] [CrossRef] [PubMed]
  3. Fortes, J.C.; Sarmiento, A.M.; Luis, A.T.; Santisteban, M.; Dávila, J.M.; Córdoba, F.; Grande, J.A. Wasted Critical Raw Materials: A Polluted Environmental Scenario as potential source of economic interest elements in the Spanish part of the Iberian Pyrite Belt. Water Air Soil Pollut. 2021, 232, 232–241. [Google Scholar] [CrossRef]
  4. Tomiyama, S.; Igarashi, T.; Tabelin, C.B.; Tangviroon, P.; Ii, H. Acid mine drainage sources and hydrogeochemistry at the Yatani mine, Yamagata, Japan: A geochemical and isotopic study. J. Contam. Hydrol. 2019, 225, 103502. [Google Scholar] [CrossRef]
  5. Park, I.; Tabelin, C.B.; Jeon, S.; Li, X.; Seno, K.; Ito, M.; Hiroyoshi, N. A review of recent strategies for acid mine drainage prevention and mine tailings recycling. Chemosphere 2019, 219, 588–606. [Google Scholar] [CrossRef]
  6. Grande, J.A.; Luís, A.T.; Santisteban, M.; Davila, J.M.; Sarmiento, A.; Fortes, J.C.; Ferreira da Silva, E.; Córdoba, F. A common paragenesis and two A.M.D. pollution sources in the Iberian Pyrite Belt (SW Spain): Proposal of a natural attenuation model in the affected fluvial network. J. Iber. Geol. 2022, 48, 191–204. [Google Scholar] [CrossRef]
  7. Sarmiento, A.M.; Grande, J.A.; Luis, A.T.; Dávila, J.M.; Fortes, J.C.; Santisteban, M.; Curiel, J.; de la Torre, M.L.; Ferreira, E. Negative pH values in an open-air radical environment affected by acid mine drainage. Characterization and proposal of a hydrogeochemical model. Sci. Total Environ. 2018, 644, 1244–1253. [Google Scholar] [CrossRef]
  8. Grande, J.A.; Andújar, J.M.; Aroba, J.; de la Torre, M.L. Presence of As in the fluvial network due to AMD processes in the Riotinto mining area (SW Spain): A fuzzy logic qualitative model. J. Hazard. Mater. 2010, 167, 395–401. [Google Scholar] [CrossRef]
  9. Younger, P.L.; Banwart, S.A.; Hedin, R.S. Mine Water: Hydrology, Pollution, Remediation. Kluwer Academic Publishers: London, UK, 2002. [Google Scholar]
  10. Kefeni, K.; Msagati, A.M.; Mamba, B. Acid mine drainage: Prevention, treatment options, and resource recovery: A review. J. Clean. Prod. 2017, 151, 475–493. [Google Scholar] [CrossRef]
  11. Luis, A.T.; Grande, J.A.; Duraes, N.; Dávila, J.M.; Santisteban, M.; Salomé, F.P.; Sarmiento, A.M.; de la Torre, M.L.; Fortes, J.C.; Ferreira, E. Biogeochemical characterization of surface waters in the Aljustrel mining area (South Portugal). Environ. Geochem. Health 2019, 41, 1909–1921. [Google Scholar] [CrossRef]
  12. Córdoba, F.; Luís, A.T.; Leiva, M.; Sarmiento, A.M.; Santisteban, M.; Fortes, J.C.; Dávila, J.M.; Álvarez-Bajo, O.; Grande, J.A. Biogeochemical indicators (waters/diatoms) of acid mine drainage pollution in the Odiel river (Iberian Pyritic Belt, SW Spain). Environ. Sci. Pollut. Res. Int. 2022, 29, 31749–31760. [Google Scholar] [CrossRef] [PubMed]
  13. Aguilera, A. Eukaryotic organisms in extreme acidic environments. Life 2013, 3, 363–374. [Google Scholar] [CrossRef] [PubMed]
  14. Leiva, M.; Bryka, K.; Romero, S.; Santisteban, M.; Dávila, J.M.; Sarmiento, A.M.; Fortes, J.C.; Luis, A.T.; Grande, J.A.; Córdoba, F. Diatoms of the Odiel river basin: Distribution according to the degree of pollution by Acid Mine Drainage. Comunicações Geológicas 107, Especial II. Comun. Geól. 2020, 107, 161–166. [Google Scholar] [CrossRef]
  15. Sun, W.; Sun, X.; Li, B.; Xu, R.; Young, L.; Dong, Y.; Zhang, M.; Kong, T.; Xiao, E.; Wang, Q. Bacterial response to sharp geochemical gradients caused by acid mine drainage intrusion in a terrace: Relevance of C, N, and S cycling and metal resistance. Environ. Int. 2020, 138, 105601. [Google Scholar] [CrossRef]
  16. Nordstrom, D.K.; Alper, C.N. Negative pH, efflorescent mineralogy, and consequences for environmental restoration at the Iron Mountain Superfund site. Proc. Natl. Acad. Sci. USA 1999, 96, 3455–3462. [Google Scholar] [CrossRef]
  17. El-Etre, A.Y.; Abdallah, M. Natural honey as corrosion inhibitor for metals and alloys. II. C-steel in high saline water. Corros. Sci. 2000, 42, 731–738. [Google Scholar] [CrossRef]
  18. Li, J.; Liu, Y.; Chen, H.; Zhang, Z.; Zou, X. Design of a Multilayered Oxygen-Evolution Electrode with High Catalytic Activity and Corrosion Resistance for Saline Water Splitting. Adv. Funct. Mater. 2021, 31, 2101820. [Google Scholar] [CrossRef]
  19. Zhang, X.; Wu, W.; Fu, H.; Li, J. The effect of corrosion evolution on the stress corrosion cracking behavior of mooring chain steel. Corros. Sci. 2022, 203, 110316. [Google Scholar] [CrossRef]
  20. Biloshytskyi, M.; Tatarchenko, H.; Biloshytska, N.; Uvarov, P. Operational lifetime increase of the pumping equipment when pumping-out contaminated groundwater. Min. Miner. Depos. 2021, 15, 42–49. [Google Scholar] [CrossRef]
  21. Krupnik, L.; Yelemessov, K.; Beisenov, B.; Baskanbayeva, D. Substantiation and process design to manufacture polymer-concrete transfer cases for mining machines. Min. Miner. Depos. 2020, 14, 103–109. [Google Scholar] [CrossRef]
  22. Baskanbayeva, D.D.; Krupnik, L.A.; Yelemessov, K.K.; Bortebayev, S.A.; Igbayeva, A.E. Justification of rational parameters for manufacturing pump housings made of fibroconcrete. Nauk. Visnyk Natsionalnoho Hirnychoho Universytetu 2020, 68–74. [Google Scholar] [CrossRef]
  23. Yoganandh, J.; Natarajan, S.; Kumaresh Babu, S. Erosive wear behavior of high-alloy cast iron and duplex stainless steel under mining conditions. J. Mater. Perform. 2015, 24, 3588–3598. [Google Scholar] [CrossRef]
  24. Ash, S.H.; Dierks, H.A.; Felegy, E.W.; Huston, K.M.; Kennedy, D.O.; Miller, P.S.; Rosella, J.J. Corrosive and Erosive Effects of Acid Mine Waters on Metals and Alloys for Mine Pumping Equipment and Drainage Facilities. Bulletin 555; US Bureau of Mines, Dept of the Interior: Washington, DC, USA, 1955. [Google Scholar]
  25. Aziz, N.I.; Craig, P.; Nemcik, J.A.; Hai, F.I. Rock bolt corrosion—An experimental study. Min. Technol. 2014, 123, 69–77. [Google Scholar] [CrossRef]
  26. Javaherdashti, R.; Nikraz, H. On the role of deterioration of structures in their performance; with a focus on mining industry equipment and structures. Mater. Corros. 2010, 61, 885–890. [Google Scholar] [CrossRef]
  27. Kyaw, S.; Songmei, L.; Jianhua, L.; Mei, Y. Corrosion Behavior of 10CrNiCu Steel Influenced by Thiobacillus Ferrooxidans. Adv. Mater. Res. 2008, 233–235, 2633–2639. [Google Scholar] [CrossRef]
  28. Fortes, J.C.; Dávila, J.M.; Sarmiento, A.M.; Luis, A.T.; Santisteban, M.; Díaz-Curiel, J.; Córdoba, F.; Grande, J.A. Corrosion of Metallic and Structural Elements Exposed to Acid Mine Drainage (AMD). Mine Water Environ. 2020, 39, 195–203. [Google Scholar] [CrossRef]
  29. Grande, J.A. Drenaje Acido de Mina en la Faja Pirítica. Universidad de Huelva: Huelva, Spain, 2016. [Google Scholar]
  30. Grande, J.; Borrego, J.; Morales, J. A study of heavy metal pollution in the Tinto-Odiel estuary in southwestern Spain using factor analysis. Environ. Geol. 2000, 39, 1095–1101. [Google Scholar] [CrossRef]
  31. Gomes, P.; Valente, T.; Pamplona, J.; Sequeira Braga, M.A.; Pissarra, J.; Grande, J.A.; de la Torre, M.L. Metal Uptake by Native Plants and Revegetation Potential of Mining Sulfide-Rich Waste-Dumps. Int. J. Phytoremediat. 2014, 16, 1087–1103. [Google Scholar] [CrossRef]
  32. Valente, T.M.; Gomes, C.L. Fuzzy modelling of acid mine drainage environments using geochemical, ecological and mineralogical indicators. Environ. Geol. 2009, 57, 653. [Google Scholar] [CrossRef]
  33. De la Torre, M.L.; Grande, J.A.; Sainz, A. Aplicación de Zeolita en Rocas Detríticas para la Reducción del Tránsito de Nutrientes Hacia Zona Saturada. Grupo de Recursos y Calidad del Agua, Universidad de Huelva: Huelva, Spain, 2000. [Google Scholar]
  34. Bisquerra, R. Introducción Conceptual al análisis Multivariable. Promociones y Publicaciones Universitarias S.A.: Barcelona, Spain, 1989. [Google Scholar]
  35. Spearman, C. ‘General intelligence,’ objectively determined and measured. Am. J. Psychol. 1904, 15, 201–293. [Google Scholar] [CrossRef]
  36. Hotelling, H. Analysis of a complex of statistical variables into principal components. J. Educ. Psychol. 1933, 24, 417–441. [Google Scholar] [CrossRef]
  37. Thurstone, L.L. Multiple-Factor Analysis; a Development and Expansion of The Vectors of Mind. University of Chicago Pres: Chicago, IL, USA, 1947. [Google Scholar]
  38. Kaiser, H.F. The Varimax Criterion for Analytic Rotation in Factor Analysis. Psychometrika 1958, 23, 187–200. [Google Scholar] [CrossRef]
  39. Harman, H.H. Análisis Factorial Modern. Saltés: Madrid, Spain, 1980. [Google Scholar]
  40. Cuadras, C.M. Métodos de Análisis Multivarante. EUNIBAR: Barcelona, Spain, 1981. [Google Scholar]
  41. Davis, F.D. A Technology Acceptance Model for Empirically Testing New End-User Information Systems: Theory and Results. Sloan School of Management, Massachusetts Institute of Technology: Cambridge, MA, USA, 1986. [Google Scholar]
  42. McCuen, R.H.; Snyder, W.M. Hydrologic Modeling: Statistical Methods and Applications. Prentice Hall: Hoboken, NJ, USA, 1986; ISBN 10: 0134481194. [Google Scholar]
  43. Statgraphics; Version 5. Corporation, Statistical Graphics; Statgraphics: Statistical Graphics System; STSC: Rockville, MA, USA, 1991; ISBN 0-926683-06-3.
  44. Grande, J.A.; Jiménez, A.; Borrego, J.; de la Torre, M.; Gómez, T. Relationships Between Conductivity and pH in Channels Exposed to Acid Mine Drainage Processes: Study of a Large Mass of Data Using Classical Statistics. Water Resour. Manag. 2010, 24, 4579–4587. [Google Scholar] [CrossRef]
  45. Davila, J.M.; Fortes, J.C.; Drick, Y.; Gil, J.F.; Abreu, E. The effect of DAM on the structure of thermal power plant of Corrales. Geo-Temas 2016, 16, 95–98. [Google Scholar]
  46. Jimenez, A.; Aroba, J.; de la Torre, M.L.; Andújar, J.M.; Grande, J.A. Model of behaviour of conductivity versus pH in acid mine drainage water, based on fuzzy logic and data mining techniques. J. Hydroinform. 2009, 11, 147–153. [Google Scholar] [CrossRef]
  47. Ogunleye, O.O.; Arinkoola, A.O.; Eletta, O.A.; Agbede, O.O.; Osho, Y.A.; Morakinyo, A.F.; Hamed, J.O. Green corrosion inhibition and adsorption characteristics of Luffa cylindrica leaf extract on mild steel in hydrochloric acid environment. Heliyon 2020, 6, e03205. [Google Scholar] [CrossRef]
  48. Grande, J.A.; de la Torre, M.L.; Santisteban, M.; Fortes, J.C. Hydrochemical characterization and evaluation of the impact of AMD processes on river basin areas in the Iberian Pyrite Belt. Water Policy 2018, 20, 146–157. [Google Scholar] [CrossRef]
  49. Rivera, M.J.; Luis, A.T.; Grande, J.A.; Sarmiento, A.M.; Dávila, J.M.; Fortes, J.C.; Curiel, J.; Santisteban, M. Physico-chemical influence of surface water contaminated by acid mine drainage on the populations of Diatoms in Dams (Iberian Pyrite Belt, SW Spain). Int. J. Environ. Res. Public Health 2019, 16, 4516. [Google Scholar] [CrossRef]
  50. Luís, A.T.; Grande, J.A.; Davila, J.M.; Aroba, J.; Durães, N.; Almeida, S.F.P.; de la Torre, M.L.; Sarmiento, A.; Fortes, J.C.; Ferreira da Silva, E.; et al. Application of fuzzy logic tools for the biogeochemical characterisation of (un)contaminated waters from aljustrel Mining area (south portugal). Chemosphere 2018, 211, 736–744. [Google Scholar] [CrossRef]
Figure 1. (a) Comparison of the evolution of EC and TDS and (b) Eh–pH evolution.
Minerals 12 01030 g001
Figure 2. (a) Temporal evolution of temperature and volume. (b) Weight loss and TDS. (c) Weight loss and EC.
Minerals 12 01030 g002
Figure 3. Evolution of volume loss in test specimens submerged in the same AMD river.
Minerals 12 01030 g003
Figure 4. Variable dendrogram.
Minerals 12 01030 g004
Figure 5. Dendrogram of observations.
Minerals 12 01030 g005
Figure 6. Factor analysis graph.
Minerals 12 01030 g006
Table 1. Summary statistics.
EC
(mS/cm)
Eh (mV)Exposure Time (Days)pHSurface (cm2)Temperature (Celsius)Total Dissolved Solids (mg/L)Volume (cm3)Weight Loss (g)
Count303030303030303030
Average18.72581122.6371.118.4756416.314.79
Coefficient of variation63.1%21.2%56.8%15.6%2.62%22.7%56.9%7.30%73.7%
Minimum5.4019092.0566.910.5260014.11.98
Maximum45.6463922193.6074.024.517,10017.937.0
Range40.22022101.557.0614.02903.7535.0
Publisher’s Note: MDPI stays neutral with regard to jurisdictional claims in published maps and institutional affiliations.

