
Features of Arsenic Distribution in the Soils of Potash Mines


Abstract
:1. Introduction
2. Materials and Methods
3. Results and Discussion
4. Conclusions
Author Contributions
Funding
Data Availability Statement
Conflicts of Interest
References
- Kolobanov, K.A.; Filatova, M.Y.; Bubnova, M.B.; Romashkina, E.A. Improving valuation of ecosphere pollution from mining waste using mathematical tools. Min. Inf. Anal. Bull. 2021, 4, 85–99. (In Russian) [Google Scholar] [CrossRef]
- Lalmalsawmi, J.; Zirlianngura; Tiwari, D.; Lee, S. Low cost, highly sensitive and selective electrochemical detection of arsenic (III) using silane grafted based nanocomposite. Environ. Eng. Res. 2020, 25, 579–587. [Google Scholar] [CrossRef]
- Gupta, A.D.; Giri, B.S.; Rene, E.R.; Chaturvedi, P.; Goswami, M.; Singh, H. Batch and continuous reactor studies for the adsorption of As(III) from wastewater using a hybrid biochar loaded with transition metal oxides: Kinetics and mass transfer analysis. Environ. Eng. Res. 2021, 26, 200438. [Google Scholar] [CrossRef]
- Khosravi-Darani, K.; Rehman, Y.; Katsoyiannis, I.A.; Kokkinos, E.; Zouboulis, A.I. Arsenic Exposure via Contaminated Water and Food Sources. Water 2022, 14, 1884. [Google Scholar] [CrossRef]
- Tiwari, D.; Jamsheera, A.; Zirlianngura; Lee, S. Use of hybrid materials in the trace determination of As(V) from aqueous solutions: An electrochemical study. Environ. Eng. Res. 2017, 22, 186–192. [Google Scholar] [CrossRef]
- Jung, Y.; Kamimoto, Y. Arsenic removal properties by electrolyzed and calcined manganese dioxide. Environ. Eng. Res. 2020, 25, 735–741. [Google Scholar] [CrossRef]
- Peng, Y.; Li, Y.; Tang, S.; Zhang, L.; Zhang, J.; Zhao, Y.; Zhang, X.; Zhu, Y. Dynamic Adsorption of As(V) onto the Porous α-Fe2O3/Fe3O4/C Composite Prepared with Bamboo Bio-Template. Water 2022, 14, 1848. [Google Scholar] [CrossRef]
- Sun, Y.; Yu, F.; Han, C.; Houda, C.; Hao, M.; Wang, Q. Research Progress on Adsorption of Arsenic from Water by Modified Biochar and Its Mechanism: A Review. Water 2022, 14, 1691. [Google Scholar] [CrossRef]
- Voronchikhina, E.A.; Zhdakaev, V.I. Arsenic in natural and technogenic geosystems of the Perm Territory. In Proceedings of the Sergeev Readings. Materials of the Annual Session of the Scientific Council of the Russian Academy of Sciences on the Problems of Geoecology, Engineering Geology and Hydrogeology, Perm, Russia, 2–4 April 2019; pp. 278–283. (In Russian). [Google Scholar]
- Liu, G.; Shi, Y.; Guo, G.; Zhao, L.; Niu, J.; Zhang, C. Soil pollution characteristics and systemic environmental risk assessment of a large-scale arsenic slag contaminated site. J. Clean. Prod. 2020, 251, 119721. [Google Scholar] [CrossRef]
- Mayorova, L.P.; Cherentsova, A.A.; Krupskaya, L.T.; Golubev, D.A.; Kolobanov, K.A. Assessment of manmade air pollution due to dusting at mine tailings storage facilities. Min. Inf. Anal. Bull. 2021, 1, 5–20. (In Russian) [Google Scholar] [CrossRef]
- Krupskaya, L.T.; Zvereva, V.P.; Sklyarova, G.F.; Orlov, A.M. Aboveground mining waste storage as an ecosphere pollution source and waste exploitability in Russia’s Far East. Min. Inf. Anal. Bull. 2021, 2, 5–21. (In Russian) [Google Scholar] [CrossRef]
- Abramov, B.N. Toxicity assessment of mine tailings ponds in Transbaikalia. Min. Inf. Anal. Bull. 2021, 11, 136–145. (In Russian) [Google Scholar] [CrossRef]
- Rastanina, N.K.; Golubev, D.A.; Shavrin, E.I. Ecosphere and health conditions within the influence zone of a closed mine in Primorye. Min. Inf. Anal. Bull. 2021, 3, 114–127. (In Russian) [Google Scholar] [CrossRef]
- Ran, H.; Guo, Z.; Yi, L.; Xiao, X.; Zhang, L.; Hu, Z.; Li, C.; Zhang, Y. Pollution characteristics and source identification of soil metal(loid)s at an abandoned arsenic-containing mine, China. J. Hazard. Mater. 2021, 413, 125382. [Google Scholar] [CrossRef] [PubMed]
- Álvarez-Quintana, J.; Álvarez, R.; Ordóñez, A. Arsenic in Soils Affected by Mining: Microscopic Studies vs. Sequential Chemical Extraction. Int. J. Environ. Res. Public Health 2020, 17, 8426. [Google Scholar] [CrossRef]
- Kachor, O.L. Development of a model for the migration of arsenic along the soil profile from accumulated waste from the mining industry. Earth Sci. Subsoil Use 2019, 42, 144–150. (In Russian) [Google Scholar] [CrossRef]
- Bailey, A.S.; Jamieson, H.E. Characterization of arsenic-hosting solid phases in tailings dust from giant mine: Implications for air quality monitoring at legacy mine sites. Geol. Soc. Am. Abstr. Programs 2017, 49, 6. [Google Scholar] [CrossRef]
- Khayrulina, E.A.; Khomich, V.S.; Liskova, M.Y. Environmental issues of potash deposit development. Izvestiya TulGU. Earth Sci. 2018, 2, 112–126. (In Russian) [Google Scholar]
- Khayrulina, E.; Mitrakova, N.; Poroshina, N.; Menshikova, E.; Perminova, A. Formation of solonchak in the area of the discharged ancient brine wells (Perm krai, Russia). Front. Environ. Sci. 2022, 10, 858742. [Google Scholar] [CrossRef]
- Menshikova, E.A.; Voronchikhina, E.A.; Zhdakaev, V.I. Water migration technophilic elements in the extraction and processing of minerals salts: Problems and prospects of ecologizations. In Proceedings of the Modern Problems of Reservoirs and Their Watersheds: VII All-Russian Scientific and Practical Conference with International Participation, Perm, Russia, 2 June 2019; pp. 150–155. (In Russian). [Google Scholar]
- Baboshko, A.Y.; Bachurin, B.A. Heavy metals in potash industry waste. Min. Inf. Anal. Bull. 2009, 5, 369–376. (In Russian) [Google Scholar]
- Tchaikovsky, I.I.; Utkina, T.A.; Isaeva, G.A. Evolution of the mineral composition of the insoluble salt residue of the Verkhnekamskoye deposit. Gorn. Echo 2021, 4, 17–20. (In Russian) [Google Scholar] [CrossRef]
- Smetannikov, A.F.; Onosov, D.V.; Sinegribov, V.A.; Novikov, P.Y. Noble metal extraction from K-Mg ore processing waste. Min. Inf. Anal. Bull. 2013, S4, 216–231. (In Russian) [Google Scholar]
- Bayandina, E.O.; Kudryashov, A.I. Insoluble Salt Residue of the Verkhnekamsk Deposit; Tipograf: Perm, Russia, 2015; pp. 21–36. [Google Scholar]
- Khokhryakova, E.S. Ecogeochemical assessment of solid potash waste based on the content of trace elements. Gorn. Echo 2020, 3, 30–35. (In Russian) [Google Scholar] [CrossRef]
- Belkin, P.A.; Kataev, V.N. Regularities of the chemical composition of technogenic transformation which groundwater undergoes in the areas of the potash deposits development. News Ural. State Min. Univ. 2018, 2, 55–64. (In Russian) [Google Scholar] [CrossRef]
- Smetannikov, A.F.; Filippov, V.N. Some features of the mineral composition of salt rocks and products of their processing (on the example of the Verkhnekamsk salt deposit). In Problems of Mineralogy, Petrography and Metallogeny. Scientific Readings in Memory of P.N. Chirvinsky; PSU: Perm, Russia, 2010; Volume 13, pp. 99–113. (In Russian) [Google Scholar]
- Dziuba, E.A. Determination of local background content of some macro- and microelements in the soils of the Perm region. Geogr. Bull. 2021, 1, 95–108. (In Russian) [Google Scholar] [CrossRef]
- Opekunova, M.G.; Opekunov, A.Y.; Kukushkin, S.Y.; Ganul, A.G. Background contents of heavy metals in soils and bottom sediments in the north of Western Siberia. Eurasian Soil Sci. 2019, 52, 380–395. (In Russian) [Google Scholar] [CrossRef]
- Gost 26483-85; Soils. Preparation of Salt Extract and Determination of its PH by CINAO Method. The National Standard. USSR State Committee for Standards: Moscow, Russia, 1985; 6p. (In Russian)
- Lê, S.; Josse, J.; Husson, F. FactoMineR: An R package for multivariate analysis. J. Stat. Softw. 2008, 25, 1–18. [Google Scholar] [CrossRef]
- Wickham, H. ggplot2: Elegant Graphics for Data Analysis; Springer: New York, NY, USA, 2009; pp. 2197–5736. [Google Scholar]
- Ruiz-Roso, J.; García-Lorenzo, M.L.; Castiñeiras, P.; Muñoz-Martín, A.; Crespo-Feo, E. 3D Spatial Distribution of Arsenic in an Abandoned Mining Area: A Combined Geophysical and Geochemical Approach. Minerals 2020, 10, 1130. [Google Scholar] [CrossRef]
- Hakanson, L. An ecological risk index for aquatic pollution control, a sedimentological approach. Water Res. 1980, 14, 975–1001. [Google Scholar] [CrossRef]
- Pan, L.; Guan, X.; Liu, B.; Chen, Y.; Pei, Y.; Pan, J.; Zhang, Y.; Hao, Z. Pollution Characteristics, Distribution and Ecological Risk of Potentially Toxic Elements in Soils from an Abandoned Coal Mine Area in Southwestern China. Minerals 2021, 11, 330. [Google Scholar] [CrossRef]
- Yuan, D.; Liu, Y.; Guo, X.; Liu, J. Characteristic contaminants in snowpack and snowmelt surface runoff from different functional areas in Beijing, China. Environ. Sci. Pollut. Res. 2018, 25, 36256–36266. [Google Scholar] [CrossRef] [PubMed]
- Putilina, V.S.; Galitskaya, I.V.; Yuganova, T.I. The Behavior of Arsenic in Soils, Rocks and Groundwater. Transformation, Adsorption/Desorption, Migration; State Public Scientific and Technical Library of the Siberian Branch of the Russian Academy of Sciences: Novosibirsk, Russia, 2011; 249p. (In Russian) [Google Scholar]
- Gonçalves, D.A.M.; Pereira, W.V.d.S.; Johannesson, K.H.; Pérez, D.V.; Guilherme, L.R.G.; Fernandes, A.R. Geochemical Background for Potentially Toxic Elements in Forested Soils of the State of Pará, Brazilian Amazon. Minerals 2022, 12, 674. [Google Scholar] [CrossRef]
- Prakash, S.; Verma, J.P. Global Perspective of Potash for Fertilizer Production. In Potassium Solubilizing Microorganisms for Sustainable Agriculture; Meena, V., Maurya, B., Verma, J., Meena, R., Eds.; Springer: New Delhi, India, 2016. [Google Scholar] [CrossRef]
- Garrett, D.E. Potash: Deposits, Processing, Properties and Uses; Springer Science & Business Media: Berlin/Heidelberg, Germany, 2012. [Google Scholar]


| Sampling | Min. Value | Max. Value | Average Value | Median |
|---|---|---|---|---|
| Background area relative to potash mining area: | ||||
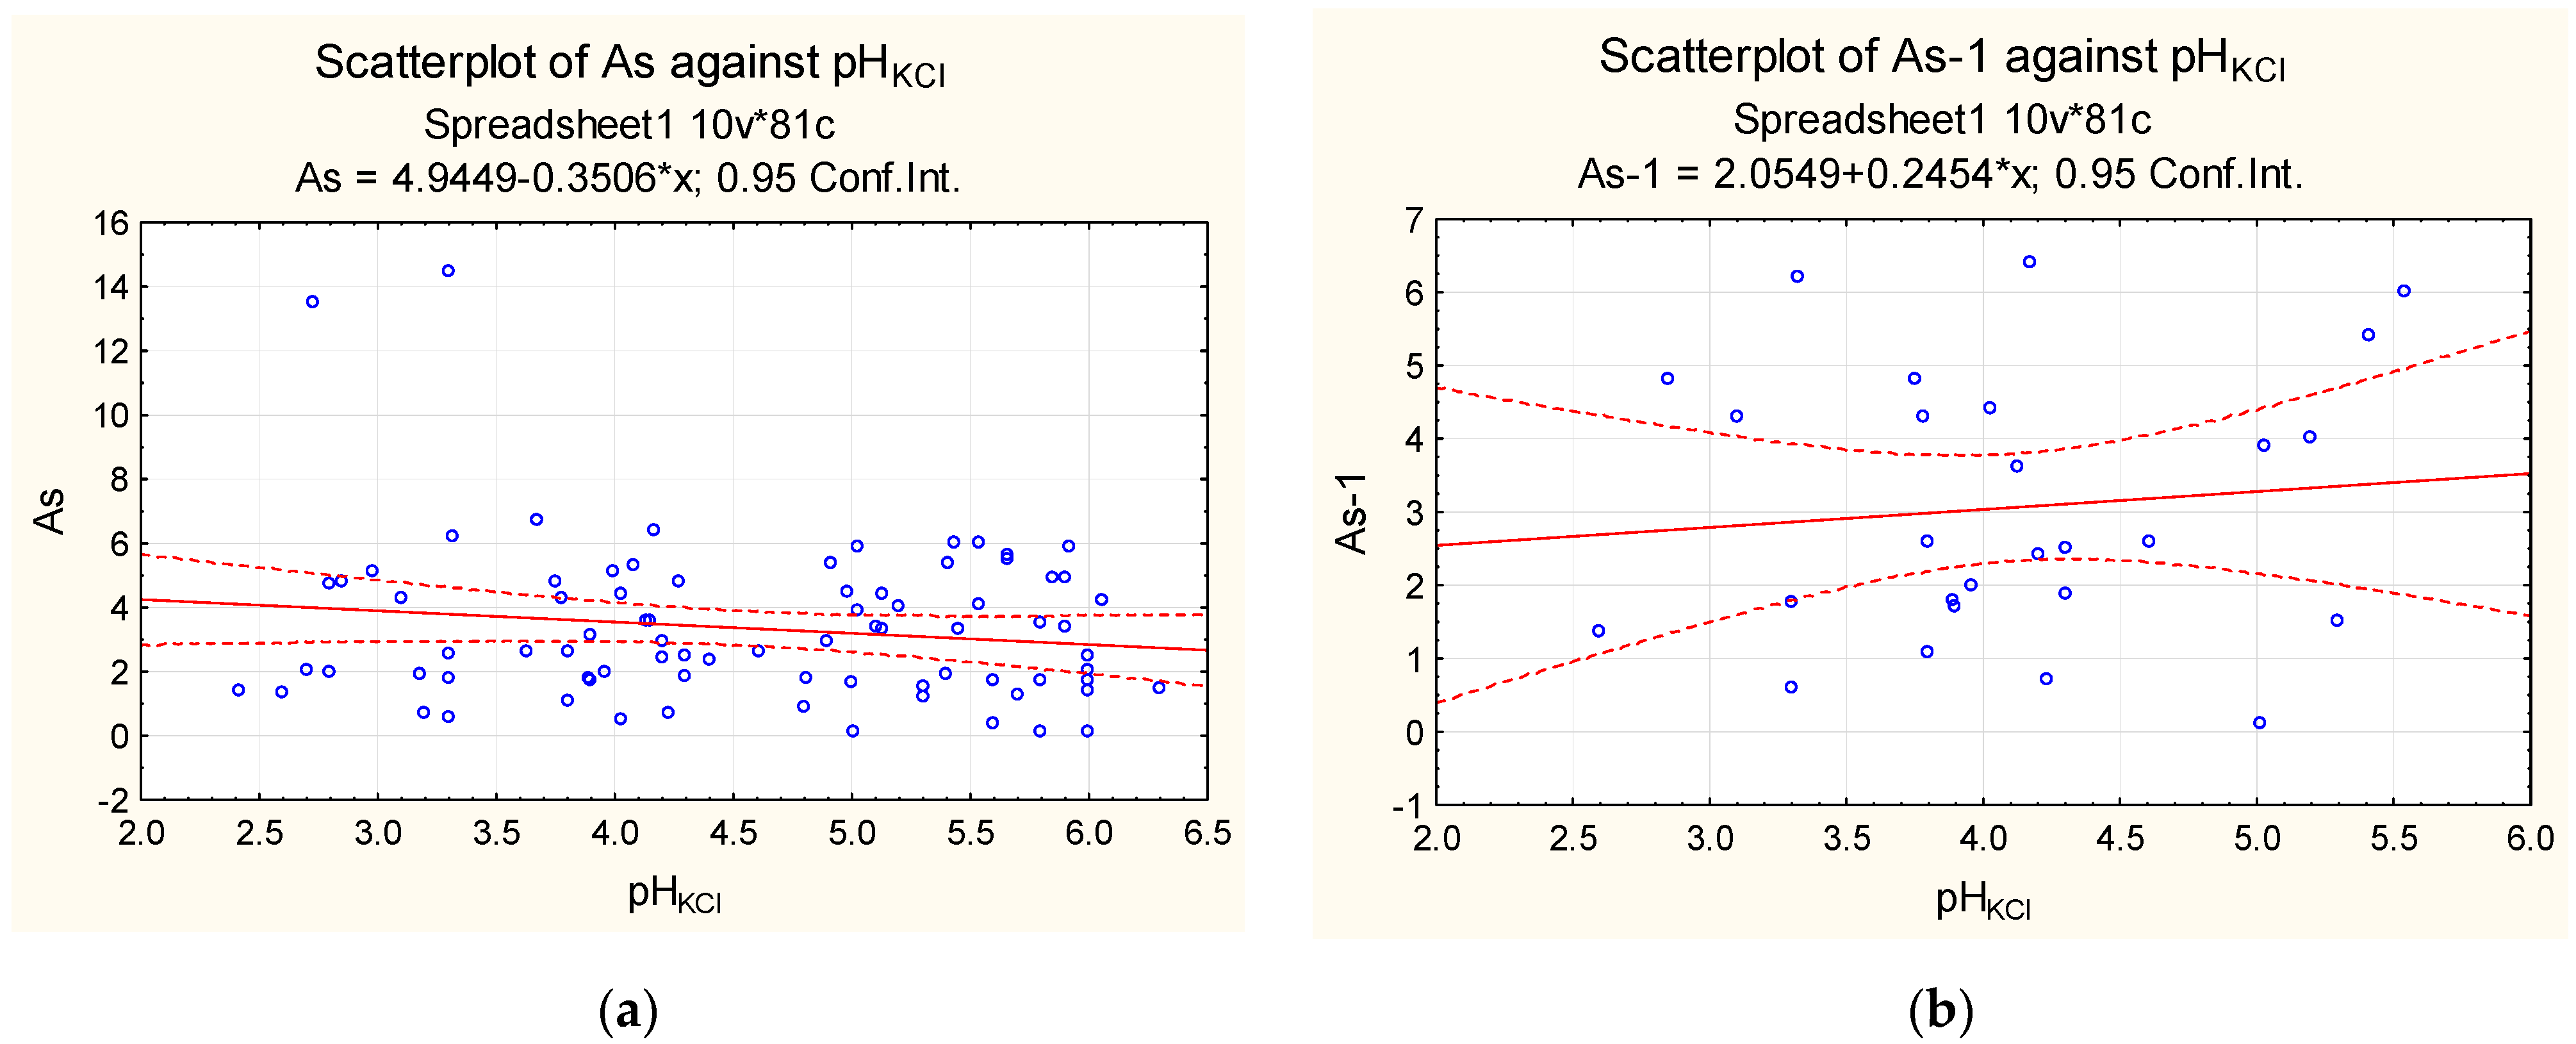
| Entire territory (n = 81) | 2.42 | 6.30 | 4.56 | 4.61 |
| by landscape type: | ||||
| Areas of eluvial and transit landscapes occupied by typical forest communities on zonal soils (n = 27) | 2.60 | 5.54 | 4.10 | 4.03 |
| Eluvial and transit former agricultural landscapes (n = 27) | 3.30 | 6.30 | 5.61 | 5.80 |
| Transaccumulative and accumulative landscapes within wetland ecotopes and floodplains of small rivers (n = 27) | 2.42 | 5.70 | 3.95 | 4.03 |
| Potash mining areas outside of soil salinisation areas: | ||||
| Entire territory (n = 64) | 3.10 | 7.40 | 5.03 | 4.90 |
| by landscape type: | ||||
| Areas of eluvial and transit landscapes occupied by forest vegetation on conditionally natural zonal soils (n = 36) | 3.10 | 7.40 | 4.55 | 4.20 |
| Eluvial and transit former agricultural landscapes (n = 16) | 4.10 | 6.40 | 5.40 | 5.80 |
| Transaccumulative landscapes within small river valleys (n = 12) | 4.20 | 7.40 | 5.98 | 6.20 |
| Areas of soil salinisation in the zone affected by the potash industry: | ||||
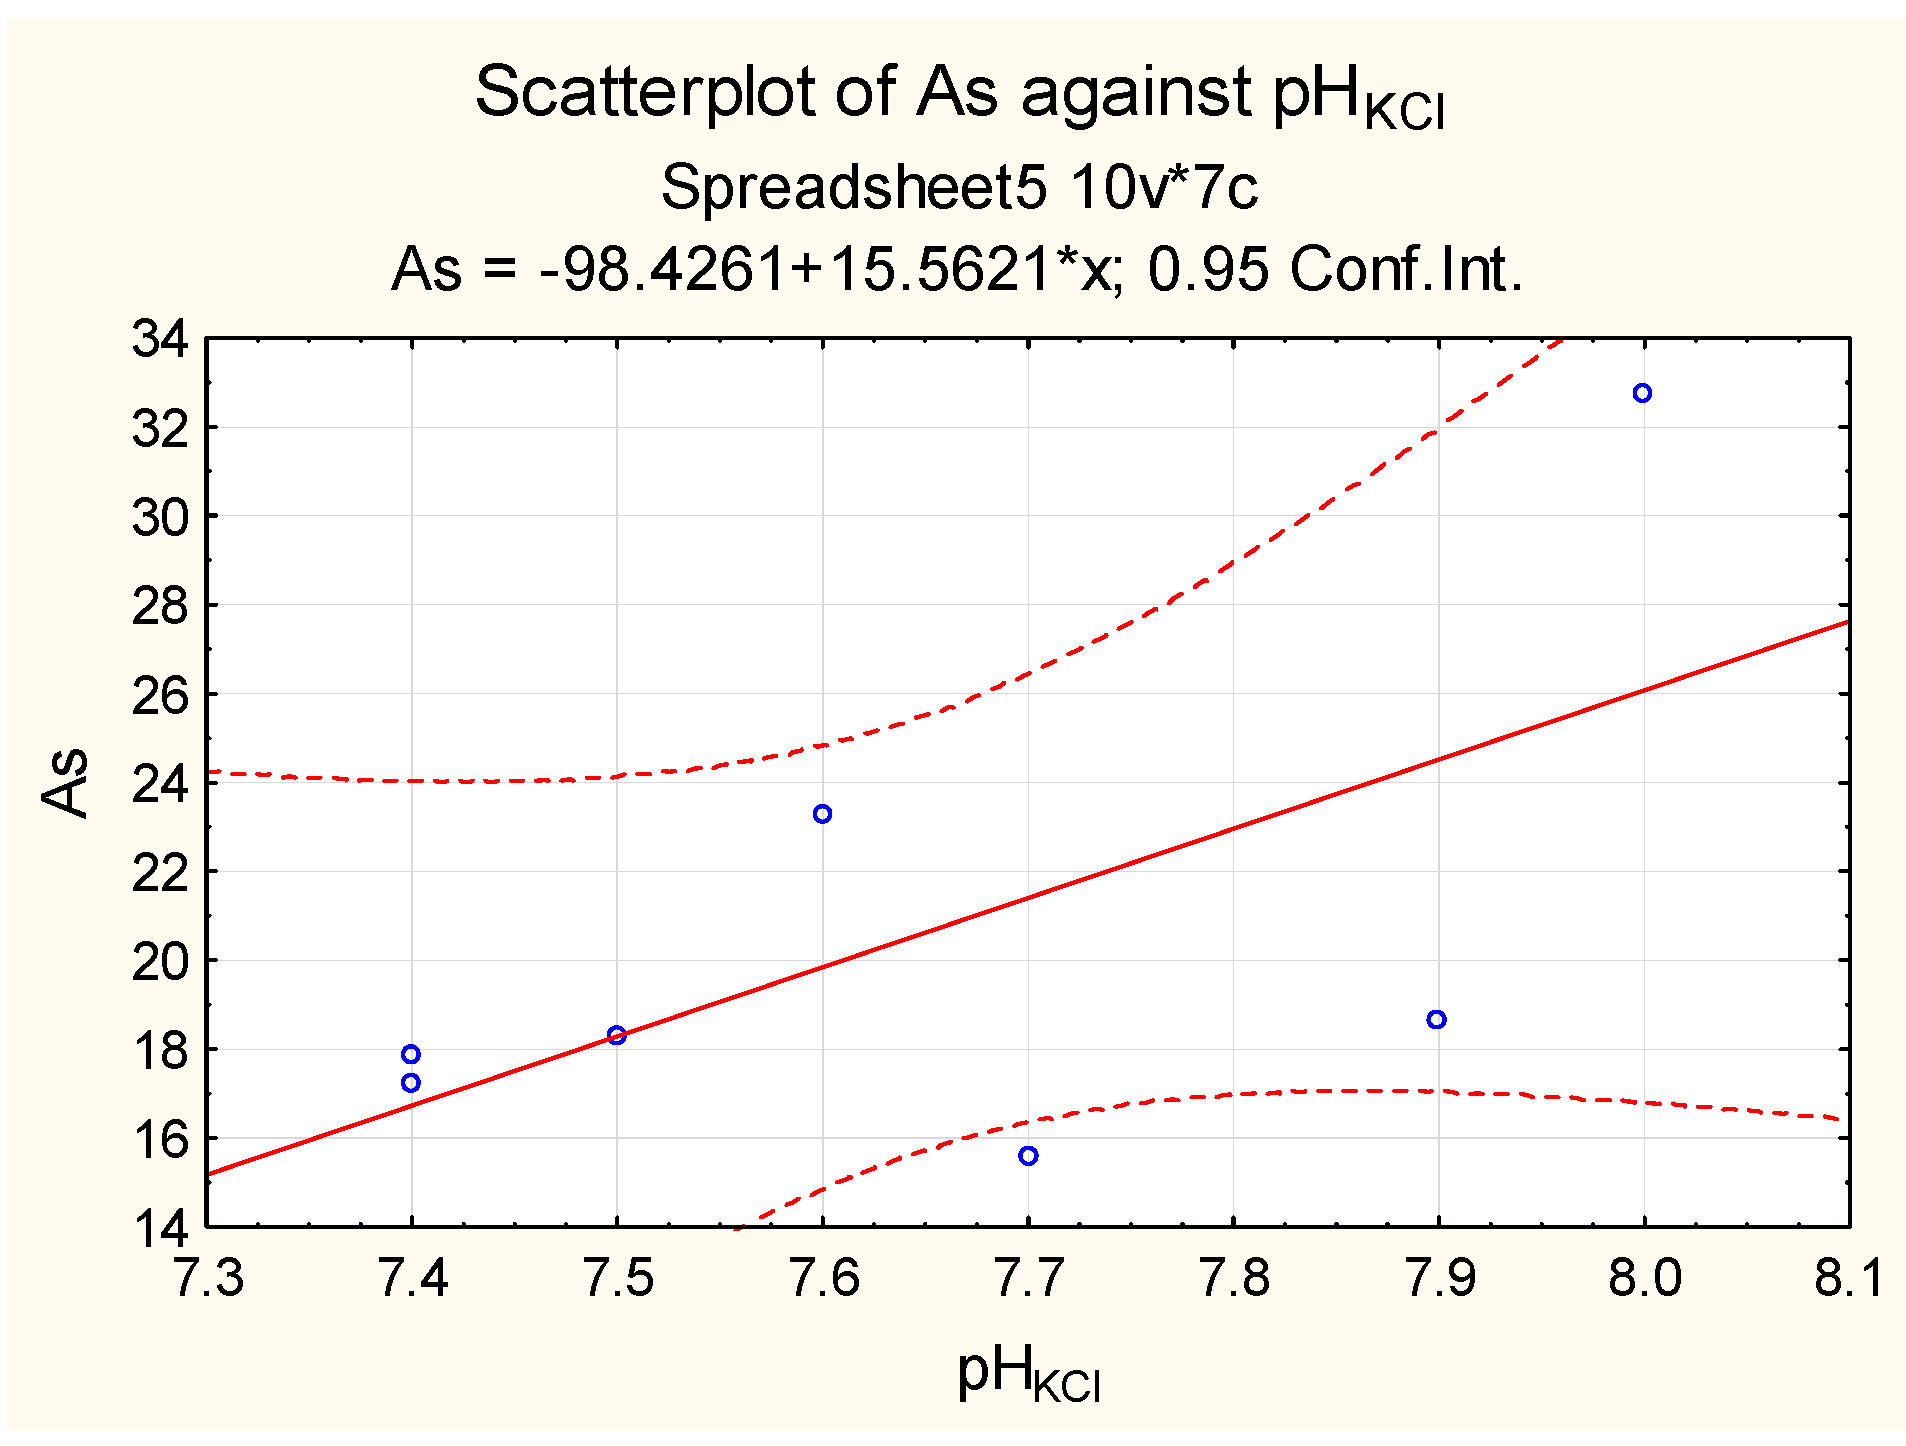
| Chloride-type soil salinity areas—content Cl− 1.49–36.35 g/kg (n = 7) | 7.40 | 8.00 | 7.64 | 7.60 |
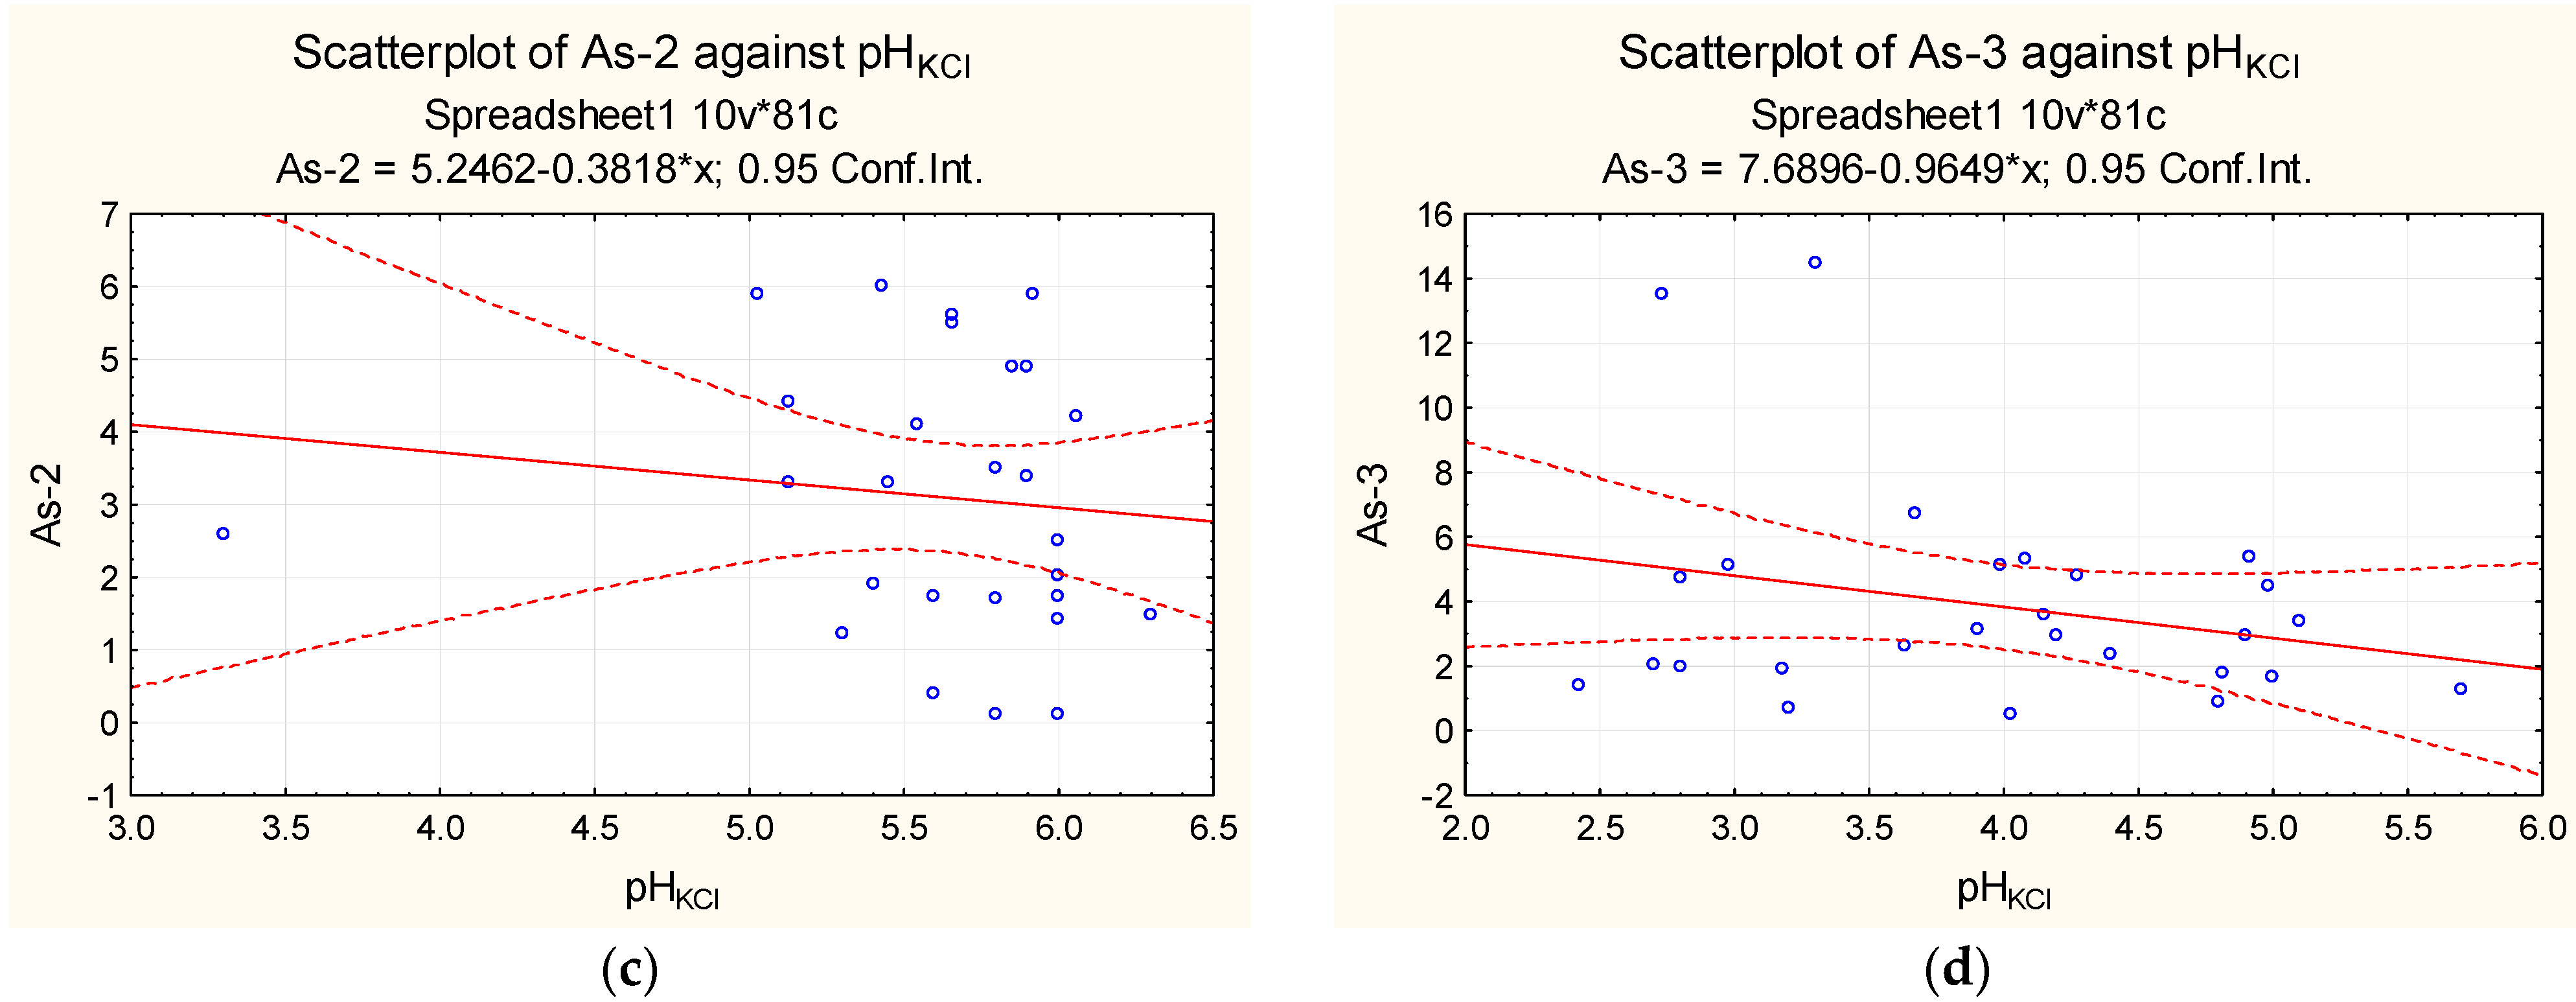
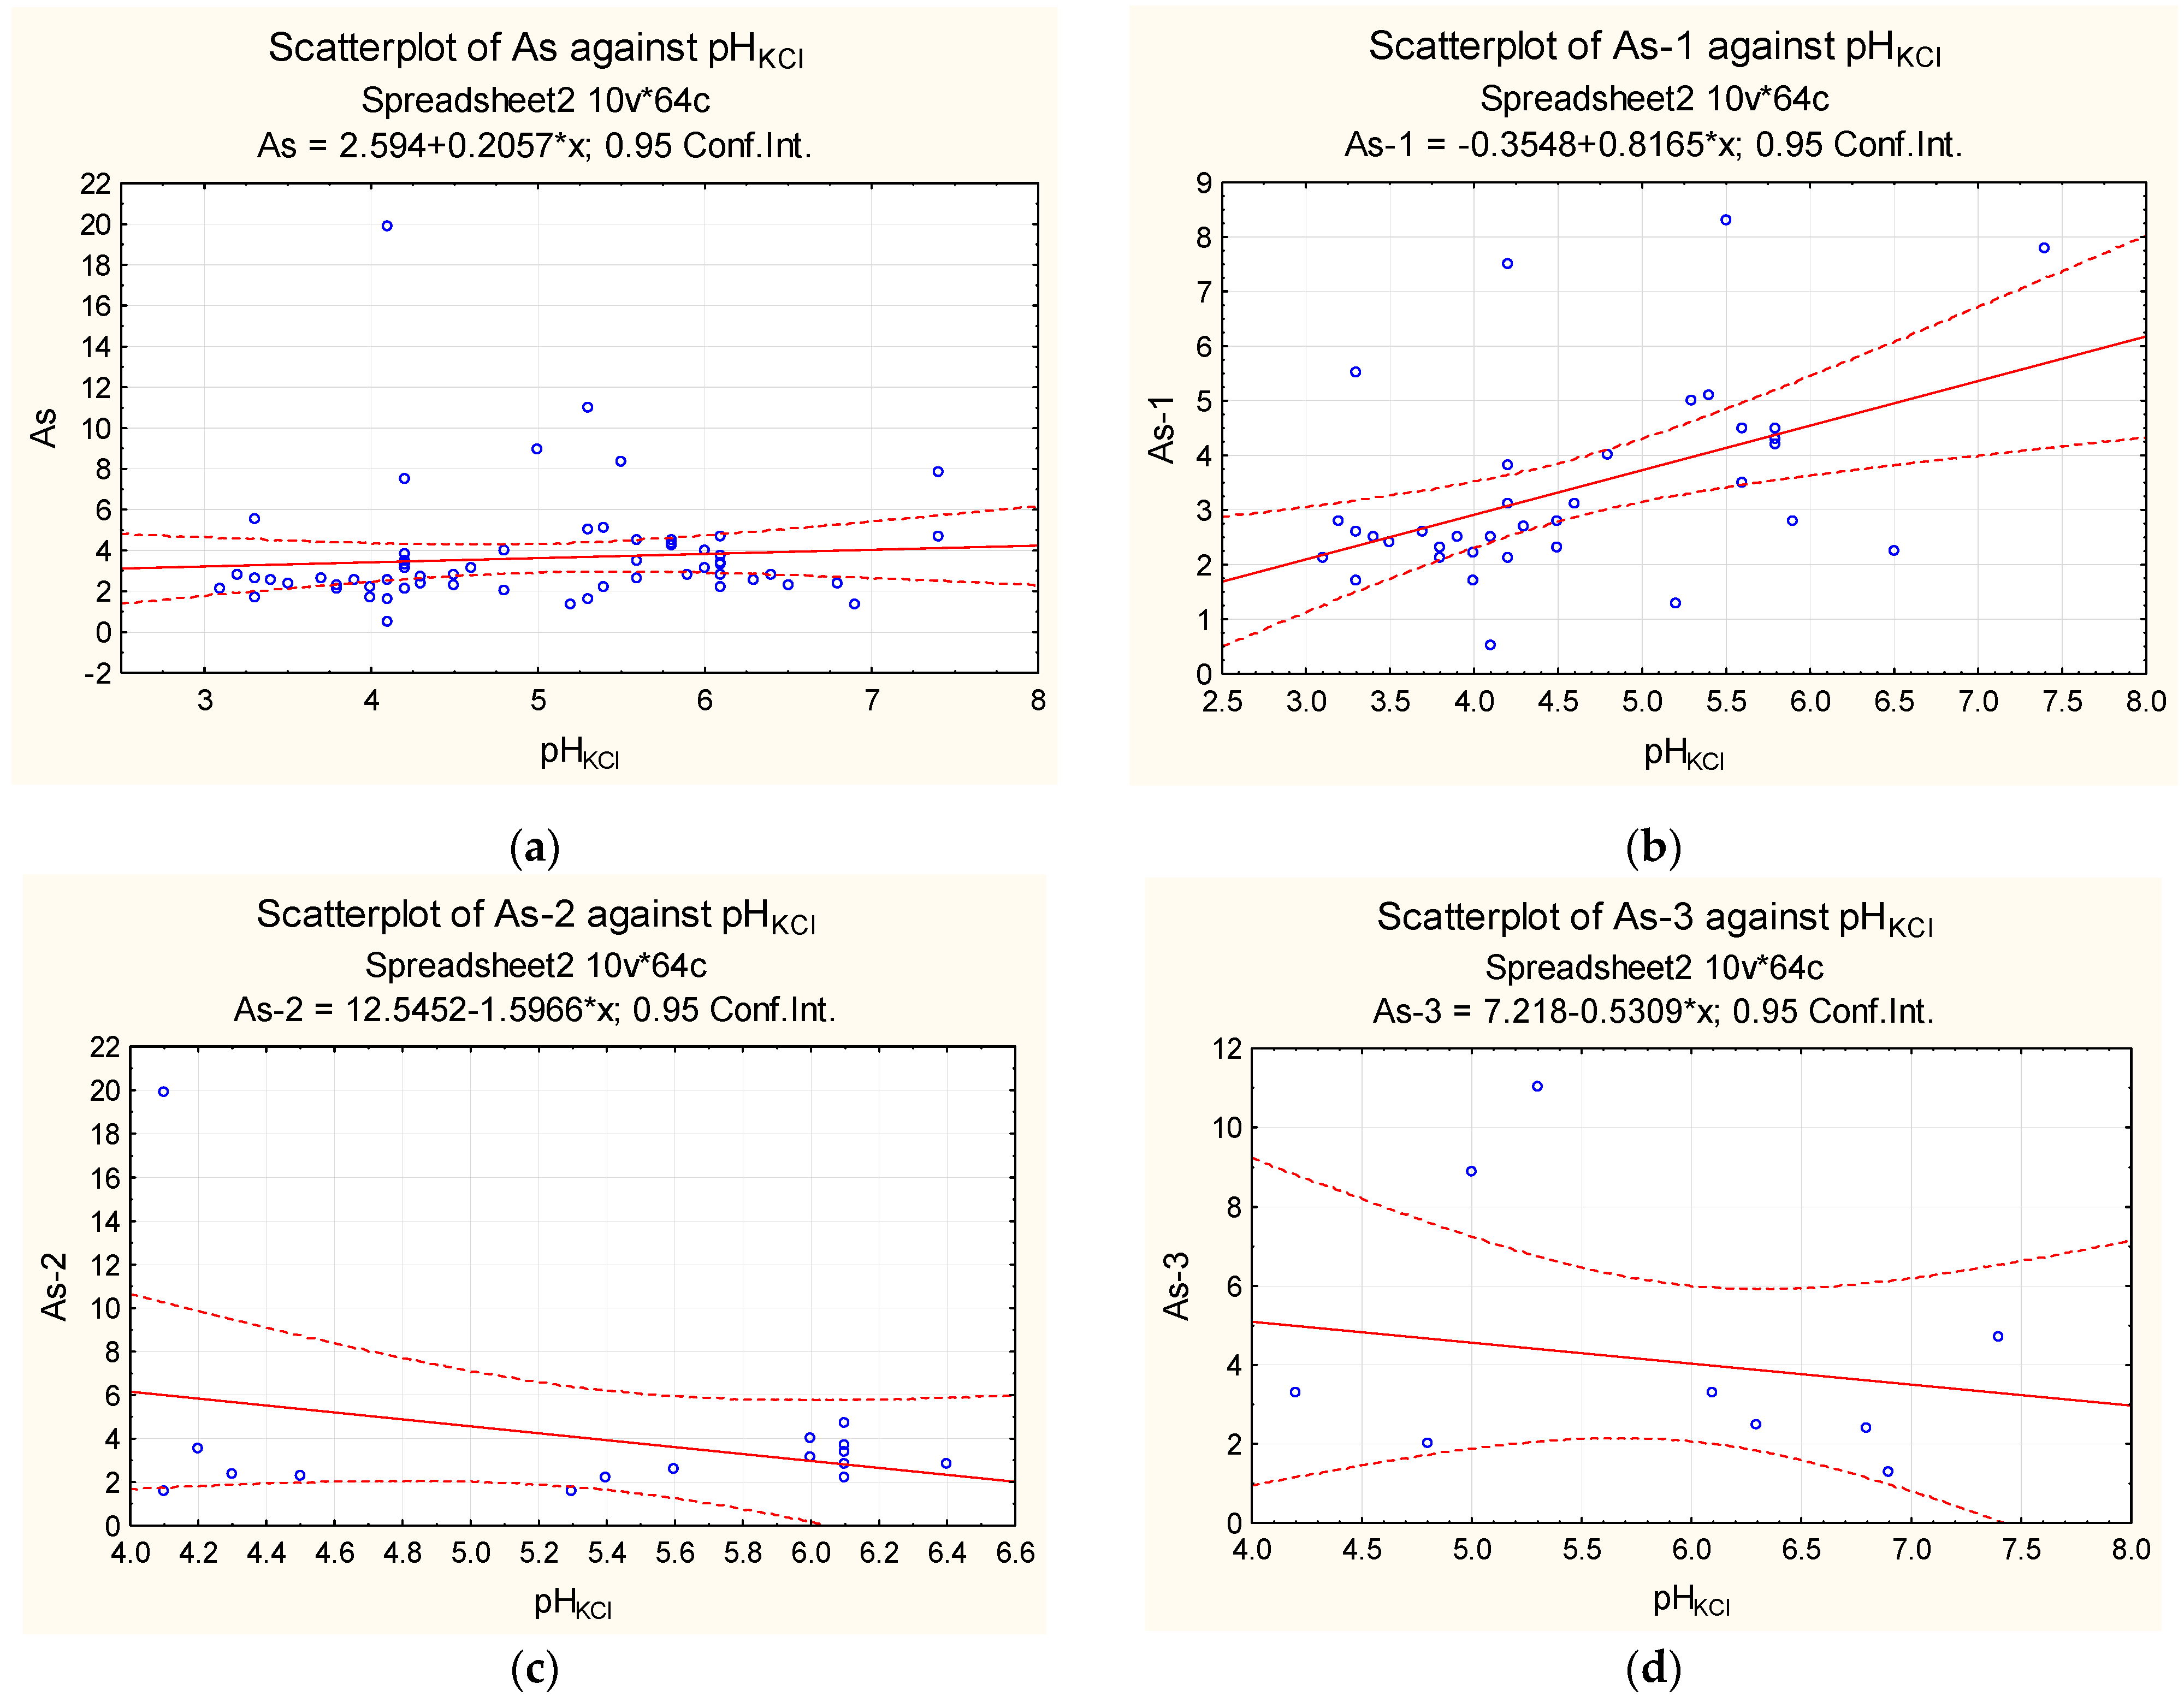
| Sampling | ρ * | Tightness of Correlation on the Cheddock Scale | Statistical Significance of the Spearman’s Correlation Coefficient | ||
|---|---|---|---|---|---|
| t (ρ) | tcritical (ρcritical) | Significance Assessment | |||
| Background area relative to potash mining area: | |||||
| Entire territory (n = 81) | −0.064 | low | −0.566 | 1.991 | the relationship is not statistically significant (p = 0.572786) |
| by landscape type: | |||||
| Areas of eluvial and transit landscapes occupied by typical forest communities on zonal soils (n = 27) | 0.064 | low | 0.064 | 0.382 | the relationship is not statistically significant (p > 0.05) |
| Eluvial and transit former agricultural landscapes (n = 27) | −0.225 | low | −0.225 | 0.382 | the relationship is not statistically significant (p > 0.05) |
| Transaccumulative and accumulative landscapes within wetland ecotopes and floodplains of small rivers (n = 27) | −0.105 | low | −0.105 | 0.382 | the relationship is not statistically significant (p > 0.05) |
| Potash mines outside of soil salinisation areas: | |||||
| entire territory (n = 64) | 0.276 | low | 2.262 | 1.999 | the relationship is statistically significant (p = 0.027297) |
| by landscape type: | |||||
| Areas of eluvial and transit landscapes occupied by forest vegetation on conditionally natural zonal soils (n = 36) | 0.485 | moderate | 0.485 | 0.33 | the relationship is statistically significant (p < 0.05) |
| Eluvial and transit former agricultural landscapes (n = 16) | 0.229 | low | 0.229 | 0.503 | the relationship is not statistically significant (p > 0.05) |
| Transaccumulative landscapes within small river valleys (n = 12) | 0.075 | low | 0.075 | 0.587 | the relationship is not statistically significant (p > 0.05) |
| Areas of soil salinisation in the zone affected by potash industry: | |||||
| Chloride-type soil salinity areas—content Cl− 1.49–36.35 g/kg (n = 7) | 0.563 | significant | 0.563 | 0.786 | the relationship is not statistically significant (p > 0.05) |
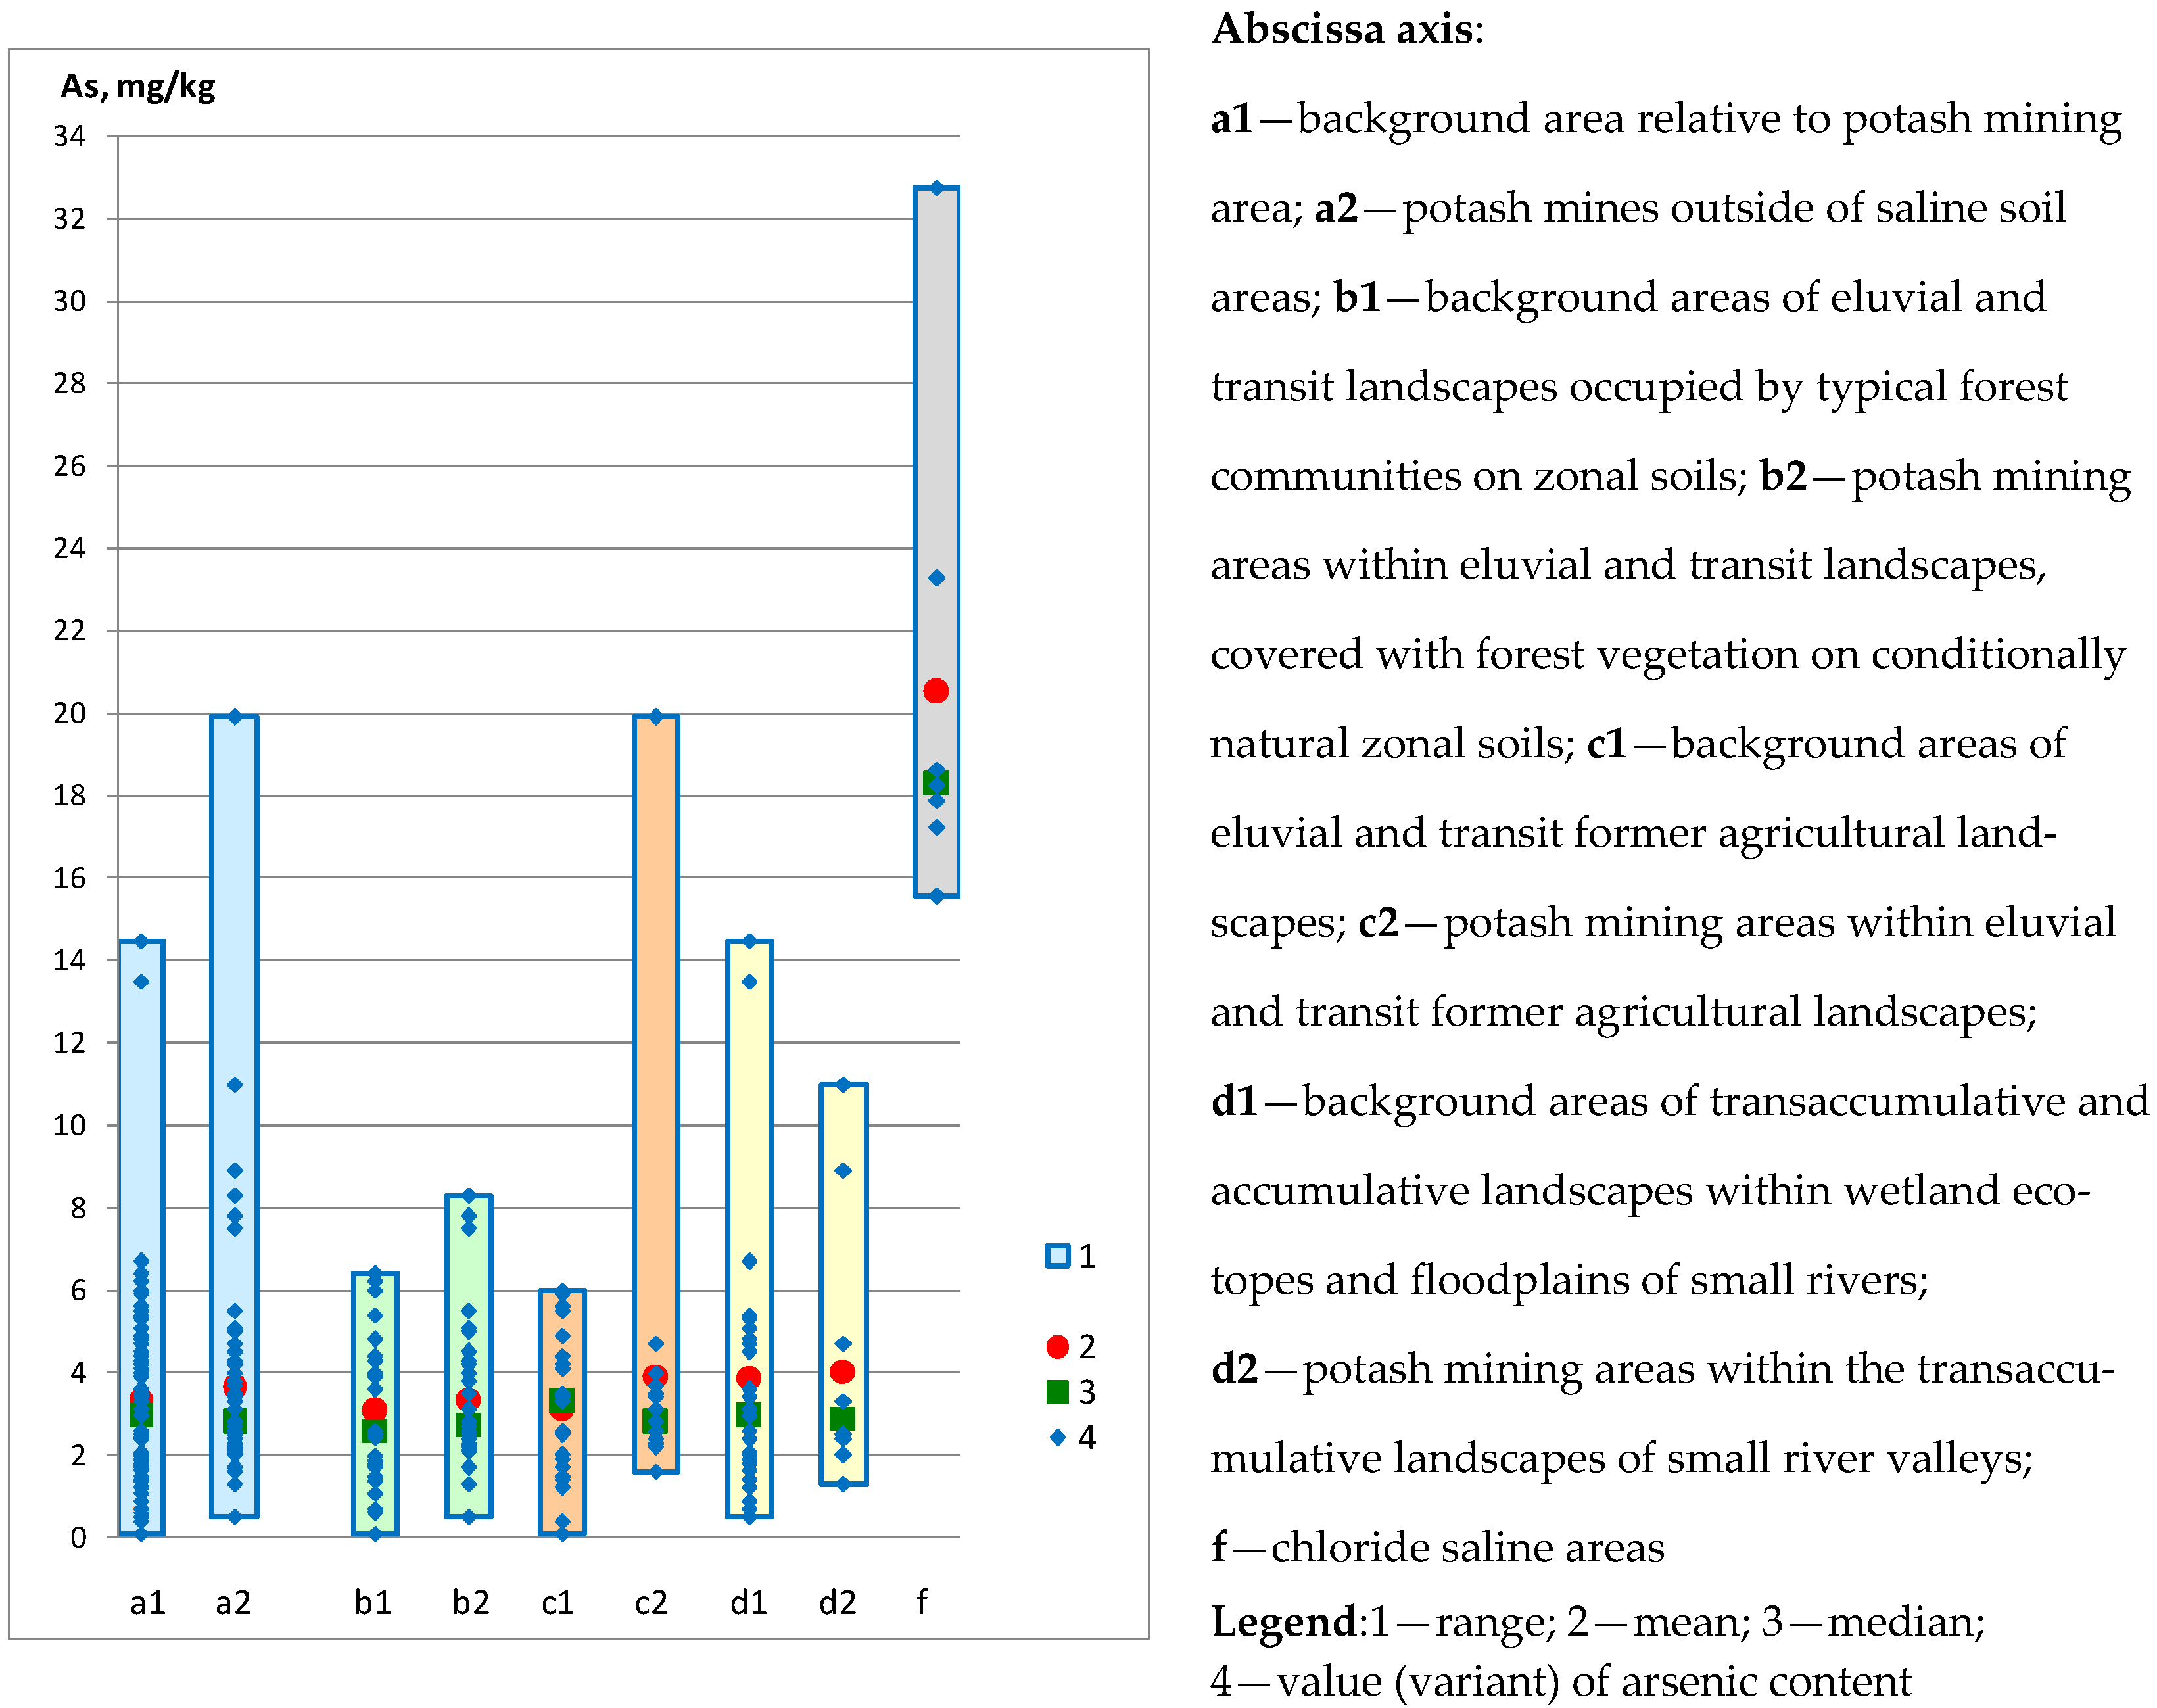
| Sampling | Min. Value | Max. Value | Average Value | Median | SD * | V |
|---|---|---|---|---|---|---|
| mg/kg | % | |||||
| Background area relative to potash mining area: | ||||||
| Entire territory (n = 81) | 0.10 | 14.48 | 3.35 | 2.96 | 2.45 | 73.17 |
| by landscape type: | ||||||
| Areas of eluvial and transit landscapes occupied by typical forest communities on zonal soils (n = 27) | 0.10 | 6.40 | 3.06 | 2.60 | 1.82 | 59.55 |
| Eluvial and transit former agricultural landscapes (n = 27) | 0.10 | 6.00 | 3.10 | 3.30 | 1.86 | 59.98 |
| Transaccumulative and accumulative landscapes within wetland ecotopes and floodplains of small rivers (n = 27) | 0.50 | 14.48 | 3.88 | 2.96 | 3.35 | 86.42 |
| Potash mines outside of soil salinisation areas: | ||||||
| Entire territory (n = 64) | 0.50 | 19.90 | 3.63 | 2.80 | 2.81 | 77.35 |
| by landscape type: | ||||||
| Areas of eluvial and transit landscapes occupied by forest vegetation on conditionally natural zonal soils (n = 36) | 0.50 | 8.30 | 3.36 | 2.75 | 1.77 | 52.67 |
| Eluvial and transit former agricultural landscapes (n = 16) | 1.60 | 19.90 | 3.92 | 2.80 | 4.34 | 110.71 |
| Transaccumulative landscapes within small river valleys (n = 12) | 1.30 | 11.00 | 4.04 | 2.90 | 2.98 | 73.70 |
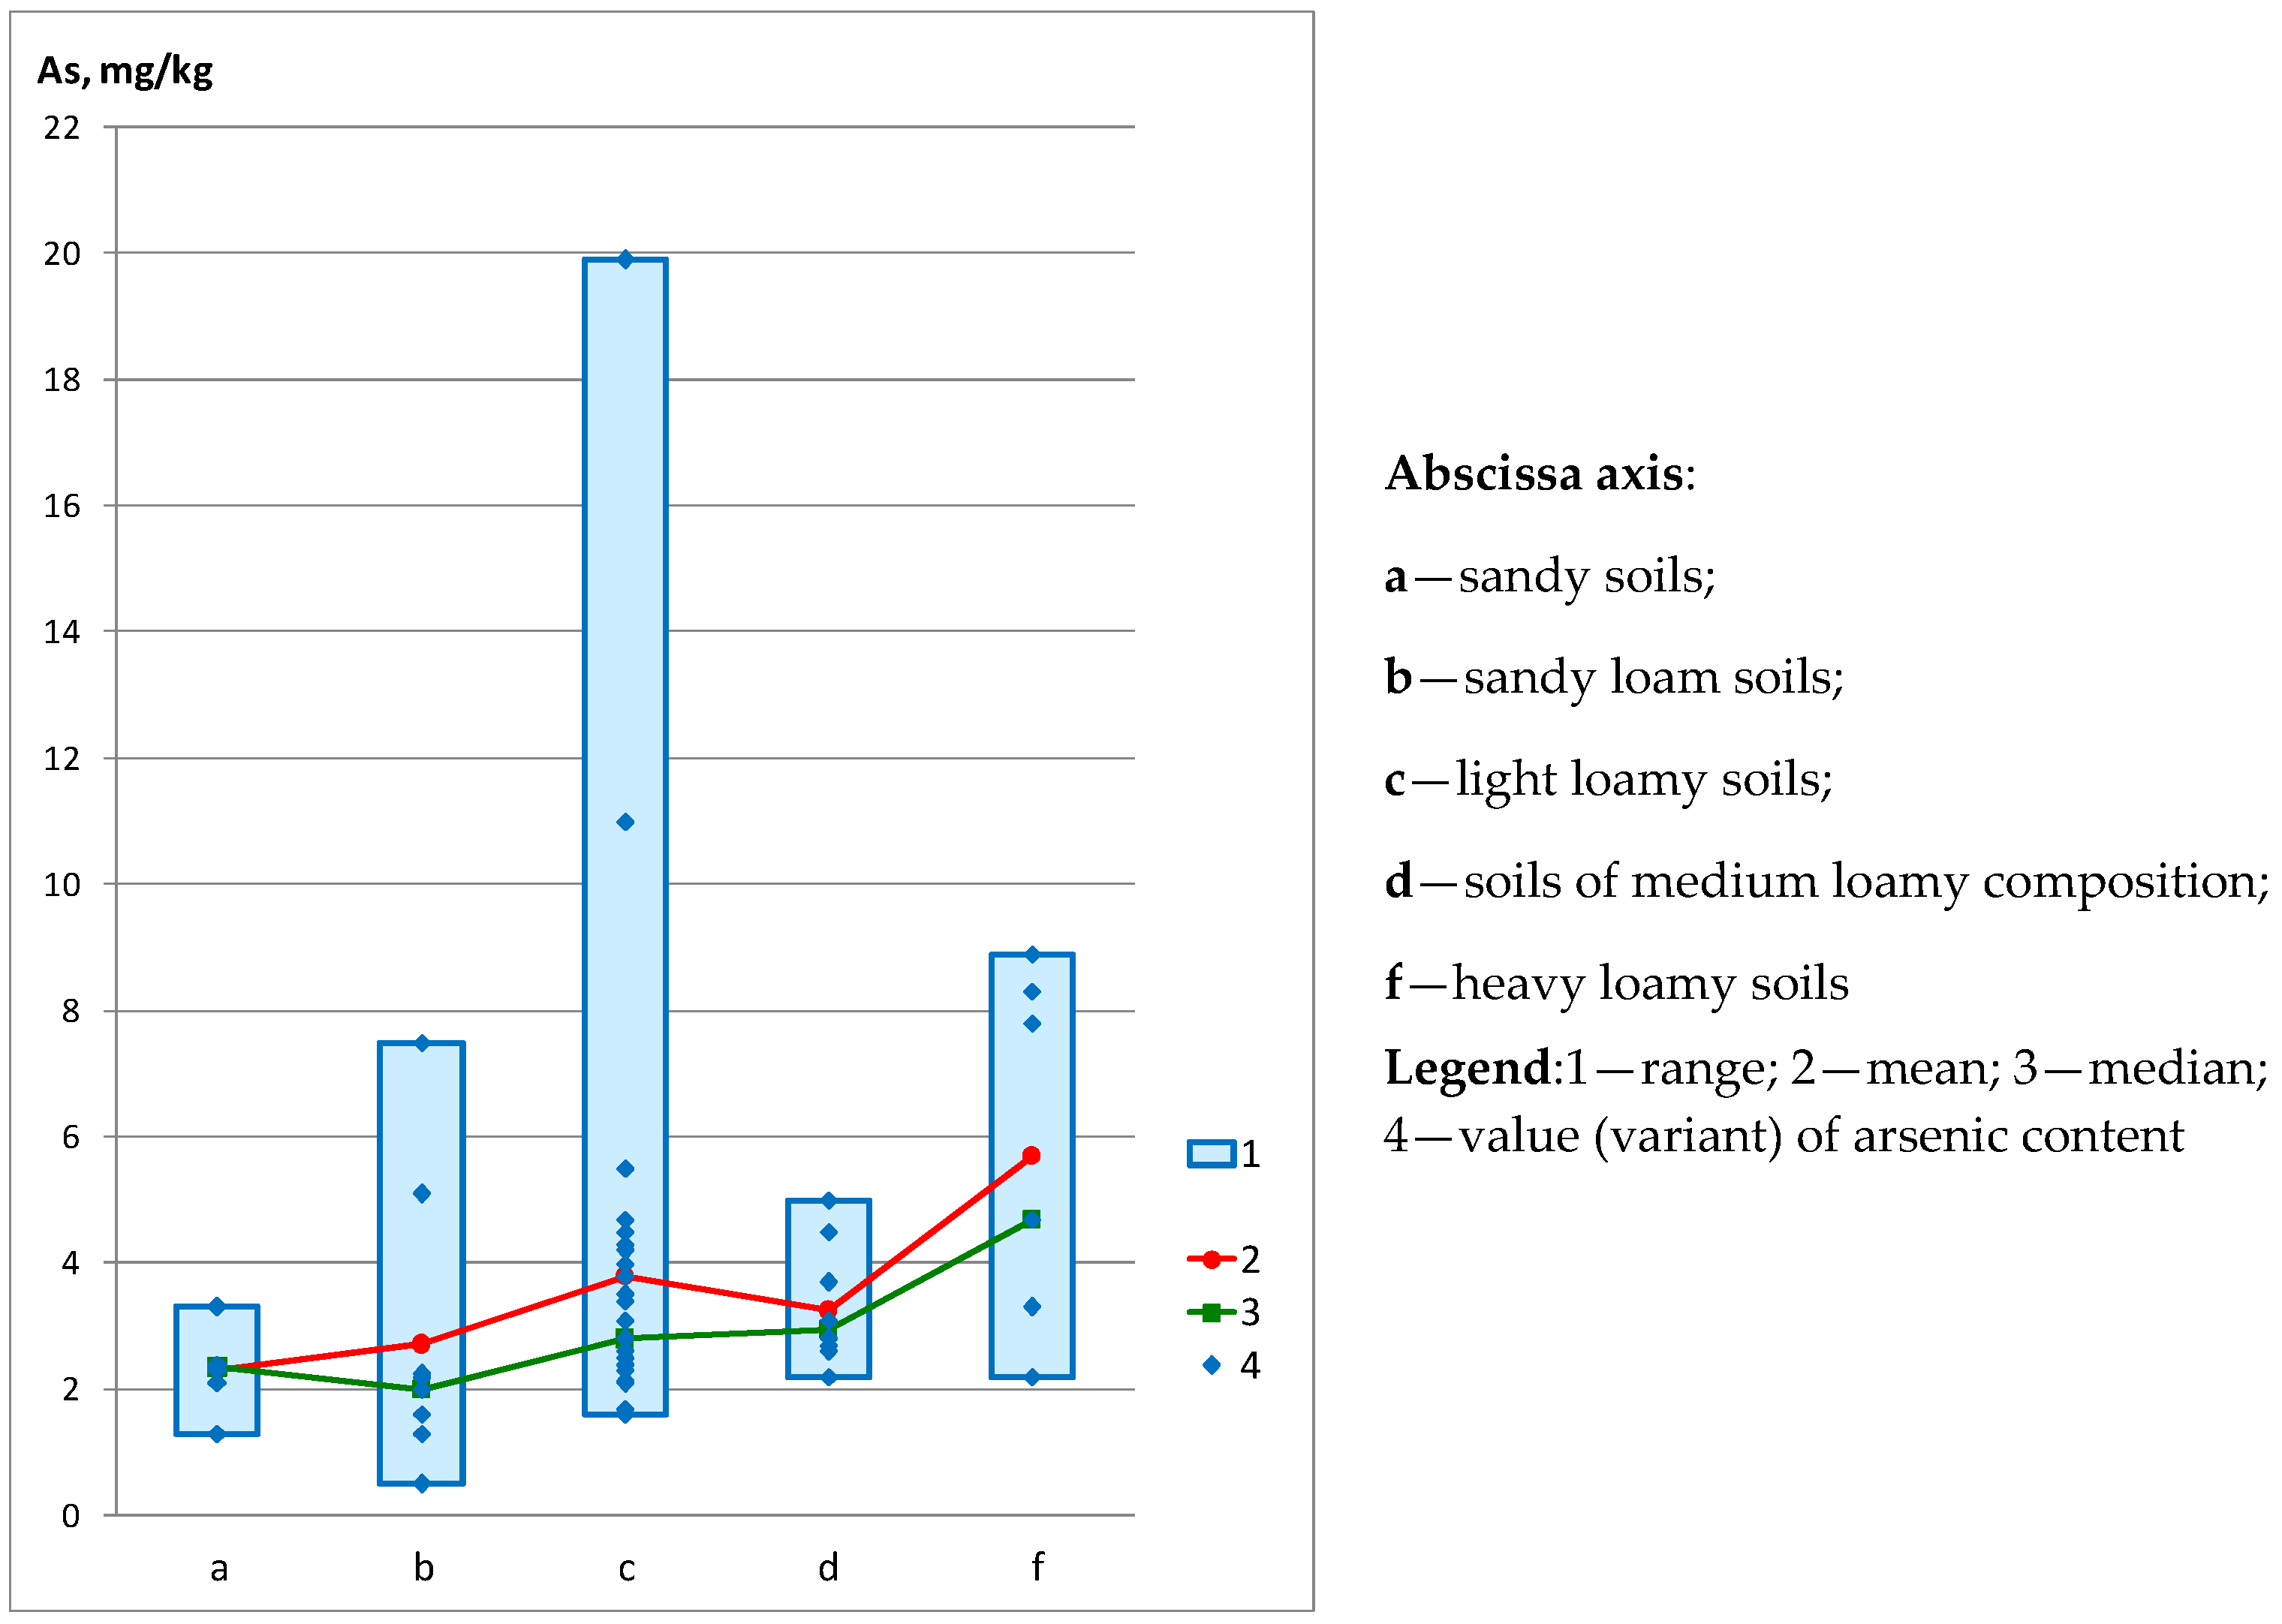
| - on the granulometric composition of soils | ||||||
| Sandy soils (n = 6) | 1.30 | 3.30 | 2.30 | 2.35 | 0.64 | 27.91 |
| Sandy loam soils (n = 9) | 0.50 | 7.50 | 2.72 | 2.00 | 2.19 | 80.52 |
| Light loamy soils (n = 32) | 1.60 | 19.90 | 3.80 | 2.80 | 3.39 | 89.30 |
| Soils of medium loamy composition (n = 10) | 2.20 | 5.00 | 3.25 | 2.95 | 0.89 | 27.34 |
| Heavy loamy soils (n = 7) | 2.20 | 8.90 | 5.70 | 4.70 | 2.63 | 46.10 |
| Areas of soil salinisation in the zone affected by the potash industry: | ||||||
| Chloride-type soil salinity areas—content Cl− 1.49–36.35 g/kg (n = 7) | 15.56 | 32.75 | 20.51 | 18.27 | 5.89 | 28.72 |
| № | Sampling | n * | T * | U * | Ucritical * | Assessing the Credibility of Differences |
|---|---|---|---|---|---|---|
| 1 | Background areas of eluvial and transit landscapes occupied by typical forest communities on zonal soils | 27 | 810 | 432 | 367 | Differences between samples are not significant |
| Potash mining areas within eluvial and transit landscapes, covered with forest vegetation on conditionally natural zonal soils | 36 | 1206 | ||||
| 2 | Background areas of eluvial and transit former agricultural landscapes | 27 | 588 | 210 | 150 | Differences between samples are not significant |
| Potash mining areas within eluvial and transit former agricultural landscapes | 16 | 358 | ||||
| 3 | Background areas of transaccumulative and accumulative landscapes within wetland ecotopes and floodplains of small rivers | 27 | 529 | 151 | 107 | Differences between samples are not significant |
| Potash mining areas within the transaccumulative landscapes of small river valleys | 12 | 251 |
| № | Sampling | n * | T * | H * | p-Value | Assessing the Credibility of Differences |
|---|---|---|---|---|---|---|
| 1 | Background areas of eluvial and transit landscapes occupied by typical forest communities on zonal soils | 27 | 1069 | 0.3485 | 0.84009 | The result is not significant at p < 0.05 |
| Background areas of eluvial and transit former agricultural landscapes | 27 | 1087 | ||||
| Background areas of transaccumulative and accumulative landscapes within wetland ecotopes and floodplains of small rivers | 27 | 1165 | ||||
| 2 | Potash mining areas within eluvial and transit landscapes, covered with forest vegetation on conditionally natural zonal soils | 36 | 1171 | 0.076 | 0.96269 | The result is not significant at p < 0.05 |
| Potash mining areas within eluvial and transit former agricultural landscapes | 16 | 506 | ||||
| Potash mining areas within the transaccumulative landscapes of small river valleys | 12 | 403 | ||||
| 3 | Background relative to potash mines area | 81 | 5759 | 19.8666 | 0.00005 | The result is significant at p < 0.05 |
| Potash mines outside of soil salinisation areas | 64 | 4831 | ||||
| Areas of soil salinisation in the zone affected by the potash industry | 7 | 1038 | ||||
| 4 | Potash mining areas with sandy soils | 6 | 115.5 | 14.2319 | 0.00659 | The result is significant at p < 0.05 |
| Potash mining areas with sandy loam soils | 9 | 171 | ||||
| Potash mining areas with light loamy soils | 32 | 1077.5 | ||||
| Potash mining areas with medium loamy soils | 10 | 370.5 | ||||
| Potash mining areas with heavy loam soils | 7 | 345.5 |
Publisher’s Note: MDPI stays neutral with regard to jurisdictional claims in published maps and institutional affiliations. |
© 2022 by the authors. Licensee MDPI, Basel, Switzerland. This article is an open access article distributed under the terms and conditions of the Creative Commons Attribution (CC BY) license (https://creativecommons.org/licenses/by/4.0/).
Share and Cite
Karavaeva, T.; Menshikova, E.; Belkin, P.; Zhdakaev, V. Features of Arsenic Distribution in the Soils of Potash Mines. Minerals 2022, 12, 1029. https://doi.org/10.3390/min12081029
Karavaeva T, Menshikova E, Belkin P, Zhdakaev V. Features of Arsenic Distribution in the Soils of Potash Mines. Minerals. 2022; 12(8):1029. https://doi.org/10.3390/min12081029
Chicago/Turabian StyleKaravaeva, Tatiana, Elena Menshikova, Pavel Belkin, and Vyacheslav Zhdakaev. 2022. "Features of Arsenic Distribution in the Soils of Potash Mines" Minerals 12, no. 8: 1029. https://doi.org/10.3390/min12081029
APA StyleKaravaeva, T., Menshikova, E., Belkin, P., & Zhdakaev, V. (2022). Features of Arsenic Distribution in the Soils of Potash Mines. Minerals, 12(8), 1029. https://doi.org/10.3390/min12081029