Article

A Real-Time, Non-Invasive Technique for Visualizing the Effects of Acid Mine Drainage (AMD) on Soybean

by
Danyang Li
1,
Uma Maheswari Rajagopalan
2,*,
Hirofumi Kadono
1,* and
Y. Sanath K. De Silva
1,3
1
Graduate School of Science and Engineering, Saitama University, Saitama 338-8570, Japan
2
Department of Mechanical Engineering, Faculty of Engineering, Shibaura Institute of Technology, Tokyo 135-8548, Japan
3
Department of Mechanical and Manufacturing, University of Ruhuna, Galle 80000, Sri Lanka
*
Authors to whom correspondence should be addressed.
Minerals 2022, 12(10), 1194; https://doi.org/10.3390/min12101194
Submission received: 21 July 2022 / Revised: 1 September 2022 / Accepted: 14 September 2022 / Published: 23 September 2022

Abstract

:
Acid mine drainage is a serious environmental problem faced by the mining industry globally, causing the contamination of numerous agricultural lands and crops. Against this background, this study aims to investigate the effects of AMD on soybean, one of the major crops. To monitor the effects of AMD on soybean quickly and non-destructively, we have proposed a technique called biospeckle optical coherence tomography (bOCT). Soaked soybean seeds were monitored by bOCT, once after 6 h and again after germination, i.e., 48 h, and the results were compared with conventional parameters such as enzyme activity, iron uptake, and seedling length. It was found that bOCT could detect the effects due to the AMD after just 6 h with a decrease in a parameter called bisopeckle contrast that reflects the internal activity of the seeds. On the other hand, the conventional parameters required a week for the effects to appear, and the results from bOCT after six hours were consistent with those obtained by conventional measures. Because of the non-invasive nature of bOCT, requiring only tens of seconds of measurement with an intact, it has not only the potential to screen but could also constantly monitor long-term changes, thus possibly contributing to the study of the effects of AMD on crops.

1. Introduction

Mining brings economic benefits while also causing environmental pollution. One of the most prominent pollution problems in the mining system is acid mine drainage (AMD), which has seriously threatened rivers and surrounding farmland. A large number of tailings are exposed to air during the mining process or in abandoned mine sites, and these tailings form AMD after dissolution and oxidation reactions under the action of rainwater washout or surface runoff [1,2]. AMD contains mainly high concentrations of Fe, sulfate, and other heavy metals (i.e., Zn, Cu, Pb, etc.) and the pH is generally around 3–5 [3]. AMD not only causes serious damage to the environment but is also difficult to prevent [4].
FAO (Food and Agriculture Organization of the United Nations) proclaimed the motto of 2018 to be “No food loss and food waste [5].” Untreated AMD spreads into surrounding farmland with runoff, posing a threat to food crop security and even human health. The risk of AMD to agriculture has attracted the attention of many researchers. Wang et al. investigated the response of bacteria and fungi to AMD in paddy soils [6]; Choudhury et al. studied the effect of AMD on rice productivity [7]; Lin et al. studied the impact of mining activities on nearby farmland at the Dabao Mountain mine in China [8]; Ma S.C. et al. determined the effects of mine drainage irrigation on soil enzyme activity and physiological characteristics, heavy metal uptake, and seed yield of winter wheat [9]; A metabolomic analysis of potatoes irrigated by acid mine drainage treated with quicklime was conducted by Munyai R et al. [10]. In these studies, plant response to AMD was monitored by conventional parameters such as enzyme activity, metabolite content, heavy metal uptake, and biomass. However, biomass measurements require waiting for plants to grow for a period of time, which is time-consuming, and the conventional chemical measurements, such as those used for enzyme activity, require grinding plants and some dangerous chemicals. Therefore, a less time-consuming, non-invasive, and secure technique is needed urgently.
Optical coherence tomography (OCT) is an interferometric imaging technique that provides a high-resolution cross-sectional view of the microstructure of biological tissues [11]. This technology is widely used in medical sciences such as ophthalmology due to its non-contact and non-destructive characteristics [12]. A growing number of studies have been conducted in recent years on the application of optical coherence tomography to plant science. For example, a quantitative analysis of plant morphology and leaf thickness by OCT was performed by de Wit et al. [13], microstructural changes in leaves during senescence were examined by Anna et al. [14], and imaging of plant root growth in soil was conducted by Larimer et al. [14]. Further, the biospeckle optical coherence tomography (bOCT) proposed by our group can monitor the dynamic response of plants beyond just the cross-sectional structural images. Our group has explored the leaf response under ozone exposure using bOCT [15,16], the internal biological activity of pea seeds during germination [17], rapid visualization of phytohormone action on plant leaves [18], and the phenotype of seeds at different concentrations of microplastics [19,20] and zinc [21]. In addition, we have demonstrated in previous experiments that bOCT has the potential to reveal the response of radish seeds to AMD within a few hours [22]. Meanwhile, a comparison of bOCT results with the commonly used physiological parameters such as enzyme activity, hydrogen peroxide (H2O2), malondialdehyde (MDA), and metal uptake was also conducted.

2. Materials and Methods

2.1. Simulated AMD and Plant Materials

AMD consists primarily of iron and sulfate. There are other metals such as Cu, Zn, Pd, and Cd that are also found in real AMD. However, the types and amounts of these metals can vary with the location of the mine site [23]. Therefore, this study focused on Fe and sulfate, the two main components of AMD. We prepared the simulated AMD stock solution by dissolving 0.744 g FeSO4·7H2O in 250 mL distilled water. Different concentrations of simulated AMD were obtained by diluting the stock solution with distilled water (pH = 6.9). A volume of 40 mL AMD was diluted to 1 L with distilled water to obtain a concentration of 40 mL/L AMD (pH = 3.0; Conductivity = 17.6 mS/m), and an amount of 80 mL AMD was diluted to 1 L with distilled water to obtain a concentration of 80 mL/L AMD (pH = 2.7; Conductivity = 27.7 mS/m). In these two simulated AMD treatments, Fe concentrations were 24 mg/L and 48 mg/L, respectively, which are close to the levels of pollution occurring at mines located in areas with calcareous soils [24,25]. During storage and before use, soybeans (Miyagi Prefecture Co., Ltd. Shosada, Japan) were kept at low temperatures and in dry conditions. Various concentrations of simulated AMD were applied to the seeds, while for control, seeds exposed to distilled water were used. A growth chamber (SANYO Electric Co., Ltd., Osaka, Japan) was used in this experiment to provide the seeds with the environmental conditions of a temperature of 26 °C, a light intensity of 350 mol m−2s−1, and a relative humidity of 60%.

2.2. Optical Coherent Tomography (OCT) Experimental System

Figure 1 depicts a schematic diagram of the OCT system (Figure 1). A high-resolution OCT image can be obtained using this experimental system. The SLD (SUPERLUM, SLD-137-HP3-DBUT-SM-PD, Cork, Ireland) with a total power of 15.6 mW is the light source, which has a central wavelength λ0 = 836.1 nm and a bandwidth ∆λ = 55.2 nm. The light is first coupled to the input port of the circulator (AC Photonics, Inc., Santa Clara, CA, USA) and further split into two beams by a 2 × 2 50/50 fiber coupler (TW850R5A2-2 × 2 Wideband Fiber Optic Coupler, 850 ± 100 nm, THORLABS, Exeter, UK), which illuminates the sample seed and the reference mirror, respectively. The reference arm is composed of collimating lens L1, objective L4, and mirror M1, and the sample arm is composed of lenses L2, L3 (LSM03-BB-Scanning lens, EFL = 36 mm, Thorlabs, Exeter, UK), and Galvano scanning mirrors.
The power of the light incident on the seeds (around 2.6 mW) was below the irradiance damage threshold of the seeds. The beam on the sample was scanned laterally by the Galvano scanning mirror. An area of 3.1 × 1.6 mm2 was scanned with 2048 (x) and 512 (z) raster scans at 10 frames per sec (fps), and a total of 100 cross-sectional images were captured. Equation (1) calculated the depth resolution of the system in free space as 6 μm, and Equation (2) calculated the lateral resolution as 22 μm;
z = 2 ln λ 0 2 π   n   λ
x = 4 λ 0 π     f d
where f is the focal length, λ0 is the central wavelength, Δ λ is the bandwidth, d is the beam diameter, and n is the reflectivity index (n = 1.4) [26].
The recombined backscattered light from the seed and the reflected light from the reference mirror passed through the circulator before being collected by the custom-made spectrometer. The light collimated through L5 illuminated the grating to obtain a spectral interference signal, which is focused onto a line scan camera with 2048 pixels through lens L6. A total of 100 OCT images were collected over a period of 10 s, and then analyzed by MATLAB to get one bOCT image, which will be described in the following section.
For accurate results, it is essential to dry the seed surface prior to the OCT measurement. A microscope CCD camera and an XYZ three-axis adjustable manual displacement stage were used to fine-tune the position of the seeds, ensuring that the beam was incident on each seed at the same position (cotyledon center). Six seeds used for each AMD treatment were obtained successively and replicated three times. A photograph of the typical seeds used for the scan is shown in Figure S1.

2.3. Biospeckle Contrast

When coherent light, such as laser light, is shone on a plant, the light is scattered by rough scattering structures on the surface and inside of the plant. Such scattered light interferes randomly to form a granular speckle pattern known as biospeckle [27]. It is suggested that moving scatterers cause the dynamic behavior of biospeckle [28]. The intensity of the speckle pattern of a static object does not change over time; however, the dynamic changes in scattering centers caused by the movement of organelles, cell growth, cell division, water transport, and cytoplasmic flow, lead to the generation of dynamic speckle patterns, i.e., biospeckle [29]. There are several interesting applications of the biospeckle method, such as a novel non-destructive approach for food quality assessment [30], biospeckle assessment of bruising in fruits [31], and live biospeckle laser imaging of root tissues [32].
The OCT images obtained in this experiment also contain speckles produced by scatterers within the seeds, and the intensity of the speckles varies continuously with time due to the movement of the scatterer within the seed. The biospeckle contrast was obtained by calculating the ratio of the standard deviation to the mean of the biospeckle signal for each pixel along the time axis obtained from the successive OCT images (Figure S2) with an acquisition interval of ∆t, and was given by,
γ   x , y = 1 I O C T x , y 1 N   j = 1 N I O C T x , y ;   j I O C T x , y 2 1 2
I O C T x , y = 1 N   j = 1 N I O C T x , y ; j ,
where x, y are the pixel coordinates, j represents the frame number, N is the total number of scans, Ioct (x,y; j) is the intensity at pixels (x,y) of a particular frame j and <Ioct(x,y)> indicates the mean of the images obtained over time. High biospeckle contrast corresponds to higher temporal fluctuations within the measured seeds, and low biospeckle contrast corresponds to lower temporal fluctuations. Therefore, the biospeckle contrast can be used as a parameter to evaluate the response of seeds to external environmental changes.
Figure S3 was obtained from the average of 100 OCT (x-z) scans. A total of six specific rectangular localized regions, or regions of interest (ROI), were selected in the area close to the seed coat. The depth of the selected ROI is up to 240 µm below the seed surface, which is well within the sensitivity range of the system. The biospeckle contrast of each ROI was obtained by equation (3) and then averaged over the six ROIs to obtain the averaged biospeckle contrast of each seed.

2.4. Traditional Physiological Indicators

The TTC method was used to determine seed vigor. Intact whole soybean seeds were soaked in 1% TTC solution for 3 h. The soaking was in dark conditions and the temperature was 30℃. The reduced TTC was extracted with ethyl acetate at 485 nm [33]. The determination of SOD (superoxide dismutase) activity, CAT (catalase) activity, and H2O2 (hydrogen peroxide) content was performed by weighting 0.2 g of each sample and placing it in an ice mortar (4℃) with quartz sand and 2 mL of phosphate buffer (pH = 7.4), and then homogenizing it. Assay kits (Wako Pure Chemical Industries, Ltd., Miyagi, Japan) were used to measure SOD enzyme activity and H2O2 content. Based on the method of Davis et al., one unit (U) of enzyme activity was defined as a decrease in absorbance of 0.1 in one minute [34]. The thiobarbituric acid method was used to determine the amount of MDA (malondialdehyde) in the sample [35]. ICP-AES was used to measure Fe concentration in seedling samples dried and processed according to Kos et al.’s method [36]. Using ImageJ software, the length of the shoots and roots of seedlings was measured using the photographs taken [37].

2.5. Data Analysis

In this study, Matlab 2016 was used for the calculation of biospeckle contrast images from OCT temporal images and IBM SPSS Statistics 26 was used for testing the significance between treatments using the LSD test (Least Significant Difference) (p < 0.05) [38].

3. Results

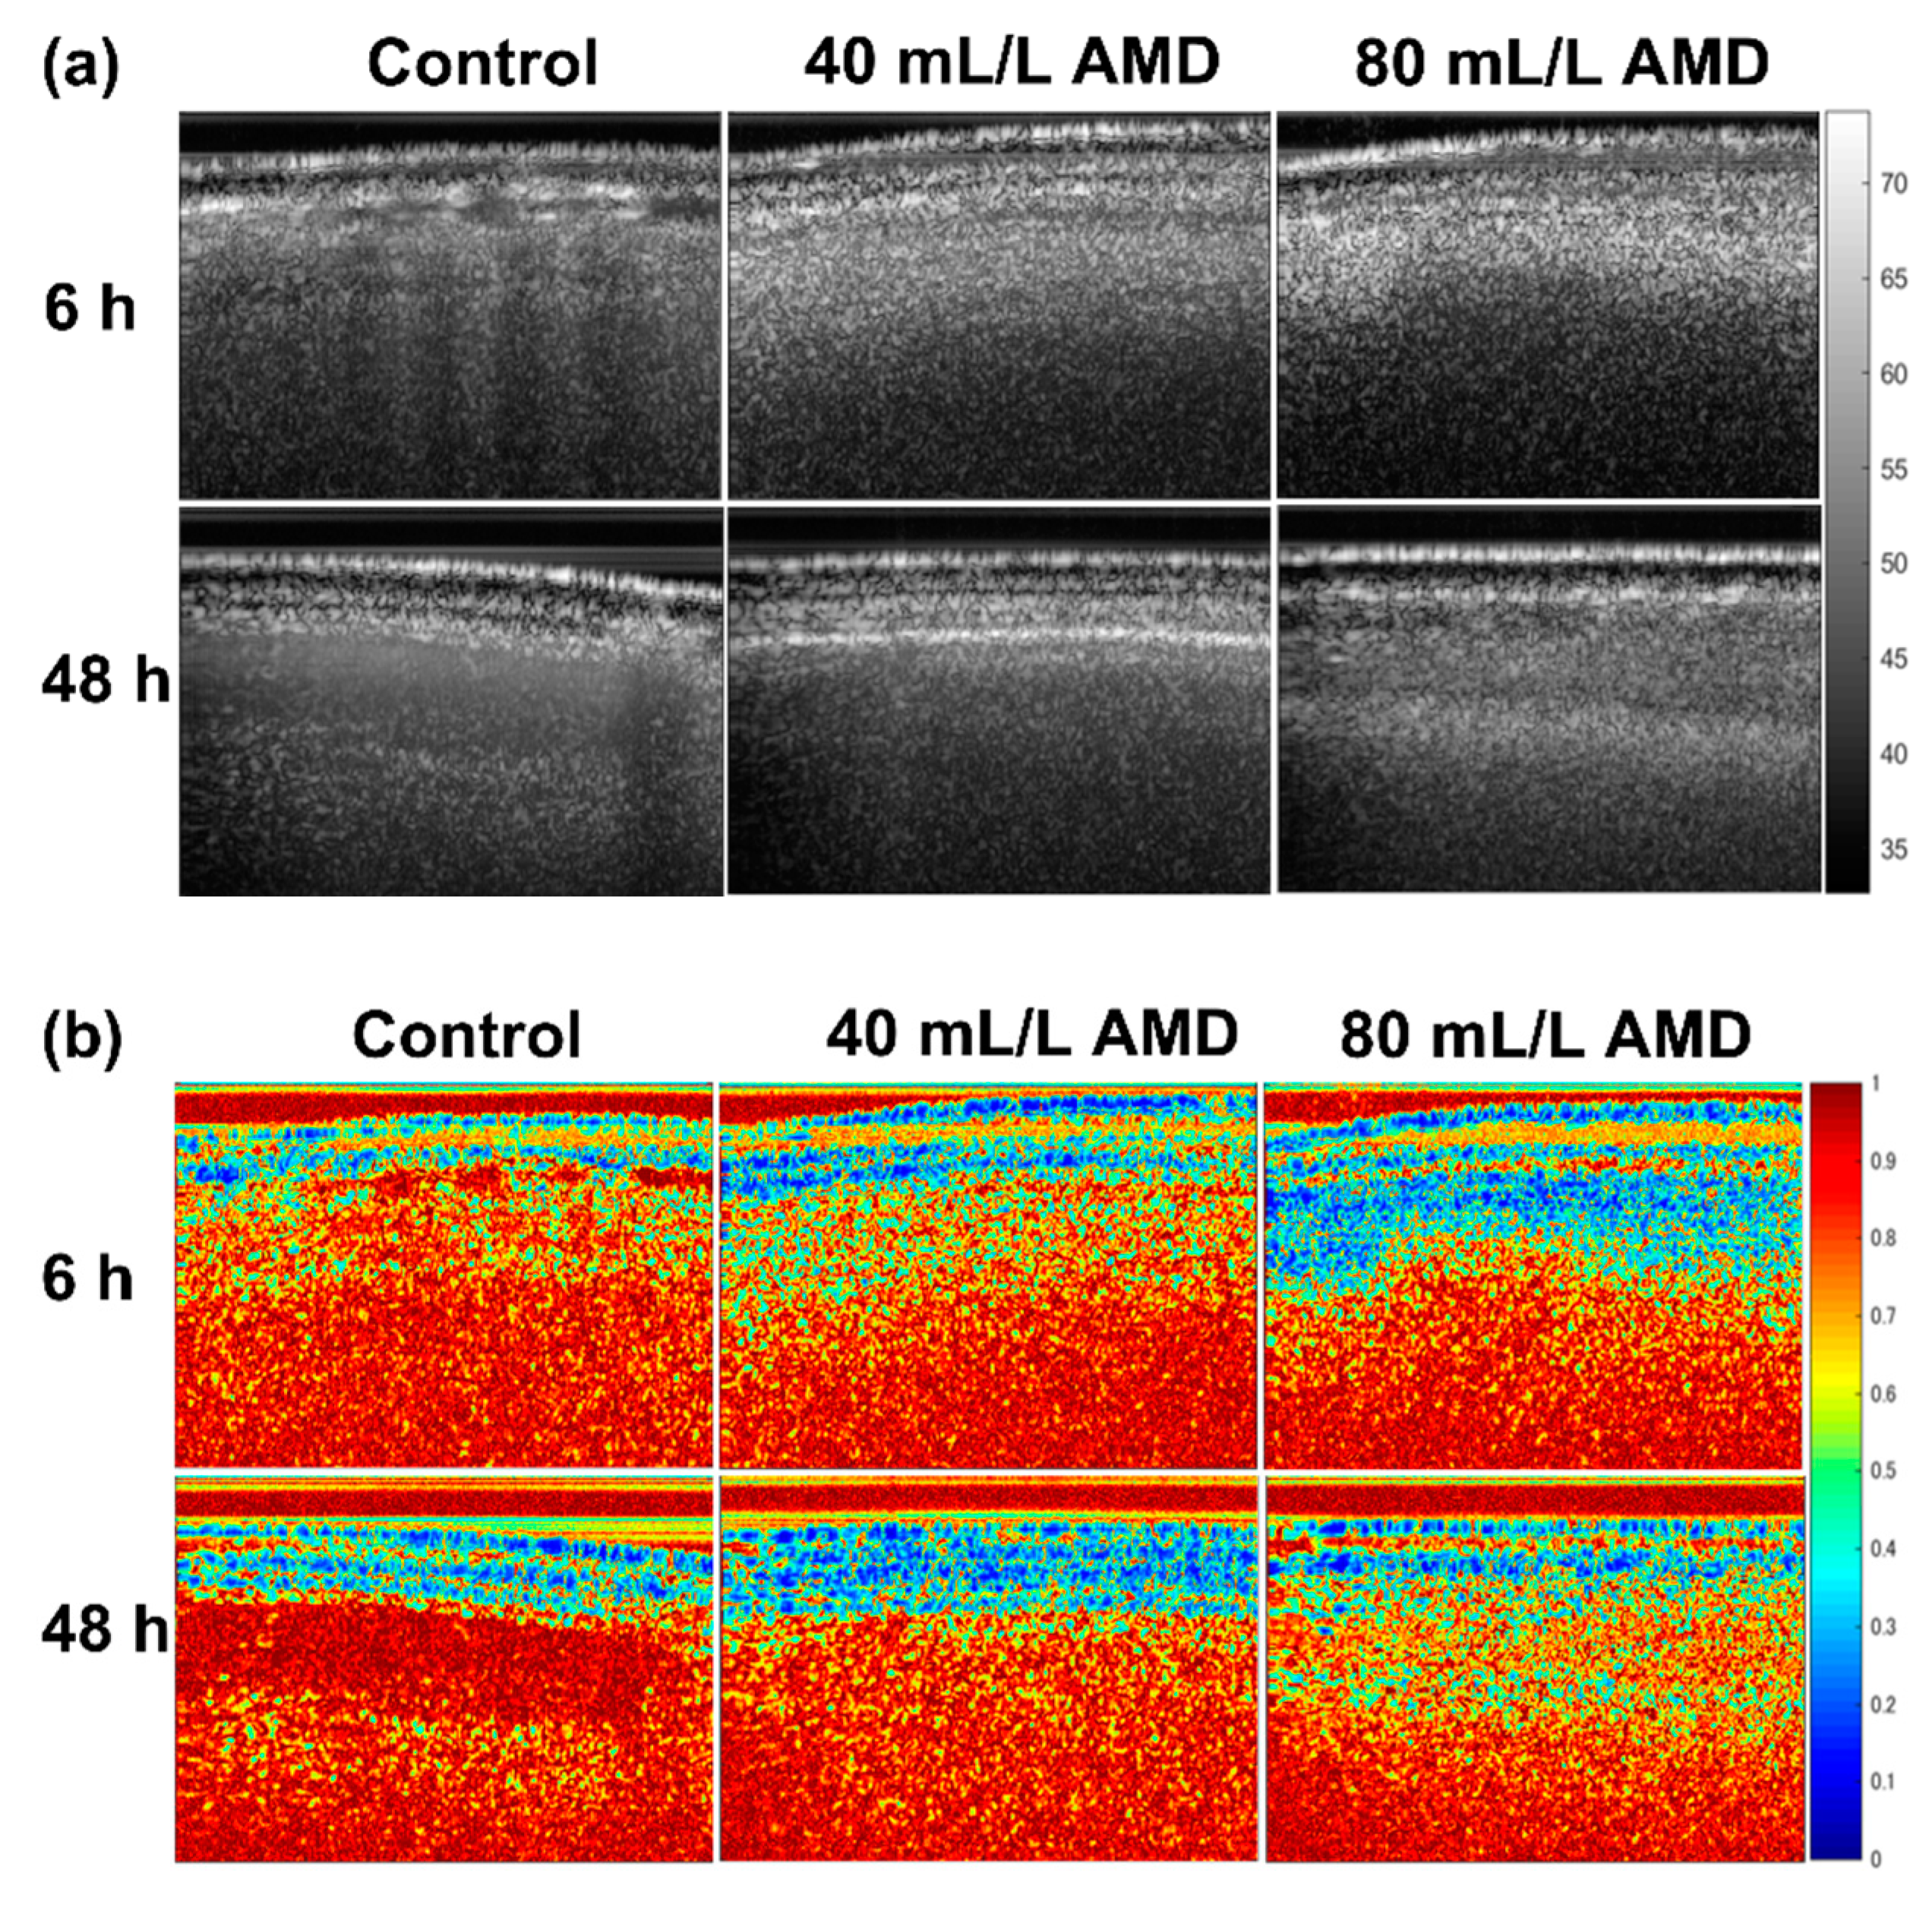
3.1. Comparison of OCT Structural Images and bOCT Biospeckle Contrast Images

The dried soybean seeds used in this experiment were soaked in AMD for 6 h to complete the water absorption and expansion, and then germination started after 48 h. To determine whether AMD affected the internal activity of the seeds during this period, OCT images (Figure 2a) and bOCT images (Figure 2b) of soybean seeds exposed to different concentrations of simulated AMD for 6 h and 48 h were obtained. The OCT images showed the structure of the seed cross-section, which is static information, while the bOCT images revealed the changes in biological activity inside the seed, which is dynamic information. From the OCT images (Figure 2a) we could not clearly distinguish the difference between the treatments either after 6 h or 48 h. Based on Equation (3), the bOCT images in Figure 2b were calculated from the corresponding OCT images (Figure 2a).
A red region in the bOCT image corresponds to higher temporal fluctuations and a blue region to lower temporal fluctuations. There is greater activity or movement within the seed in the bOCT images with a higher red color density. A high blue color density, in contrast, indicates a lower level of biological activity or movement within the seed. Figure 2b (top row) showed more blue regions in the bOCT image of seeds treated with AMD for only 6 h compared to the control. Furthermore, there were more blue regions in the bOCT images of the 80 mL/L AMD-treated seeds than in the bOCT images of the 40 mL/L AMD-treated seeds after 48 h, and there were clearly more in both than in the control.

3.2. Biospeckle Contrast

The bOCT images were further quantified and analyzed for significant differences between the treatments (Figure 3). The averaged biospeckle contrast for soybean seeds under different AMD treatments can be obtained by calculating the biospeckle contrast over specific local regions of interest (ROIs) in the bOCT image. In seeds exposed to 80 mL/L AMD treatment, the averaged biospeckle contrast was significantly lower than that in control seeds after 6 h. However, the difference between the averaged biospeckle contrast of the seeds in the low concentration AMD (40 mL/L) treatment and the control was not yet significant. The averaged biospeckle contrast of seeds under the 40 mL/L AMD treatment showed a significant decrease after 48 h compared to the control. And the averaged biospeckle contrast of the seeds under the 80 mL/L AMD treatment was significantly lower than that of the 40 mL/L AMD treatment. The bOCT results indicated that the internal biological activity of soybean seeds was found to be inhibited by 80 mL/L AMD after only 6 h, while the inhibitory effect of 40 mL/L AMD on soybean seeds was observed after 48 h.

3.3. Conventional Measurements

3.3.1. Seed Vigor

TTC measurement was used to determine seed vigor for comparison with bOCT results. TTC is reduced to TPF by the action of various dehydrogenases in the seeds, and the degree of the seeds’ vigor can be determined by measuring the absorbance of TPF [39]. As shown in Figure 4, the seed vigor of soybean under different treatments varies. It was found that the absorbance of TPF of soybean seeds exposed to 40 mL/L AMD was significantly lower than that of the control with a reduction of 39.7%, while for those exposed to 80 mL/L AMD, a reduction of 75.7% was observed. The result indicated that soybean seed vigor decreased when the AMD concentration increased. It was found that the results of the TTC test showed the same pattern as the results of the bOCT measurement.

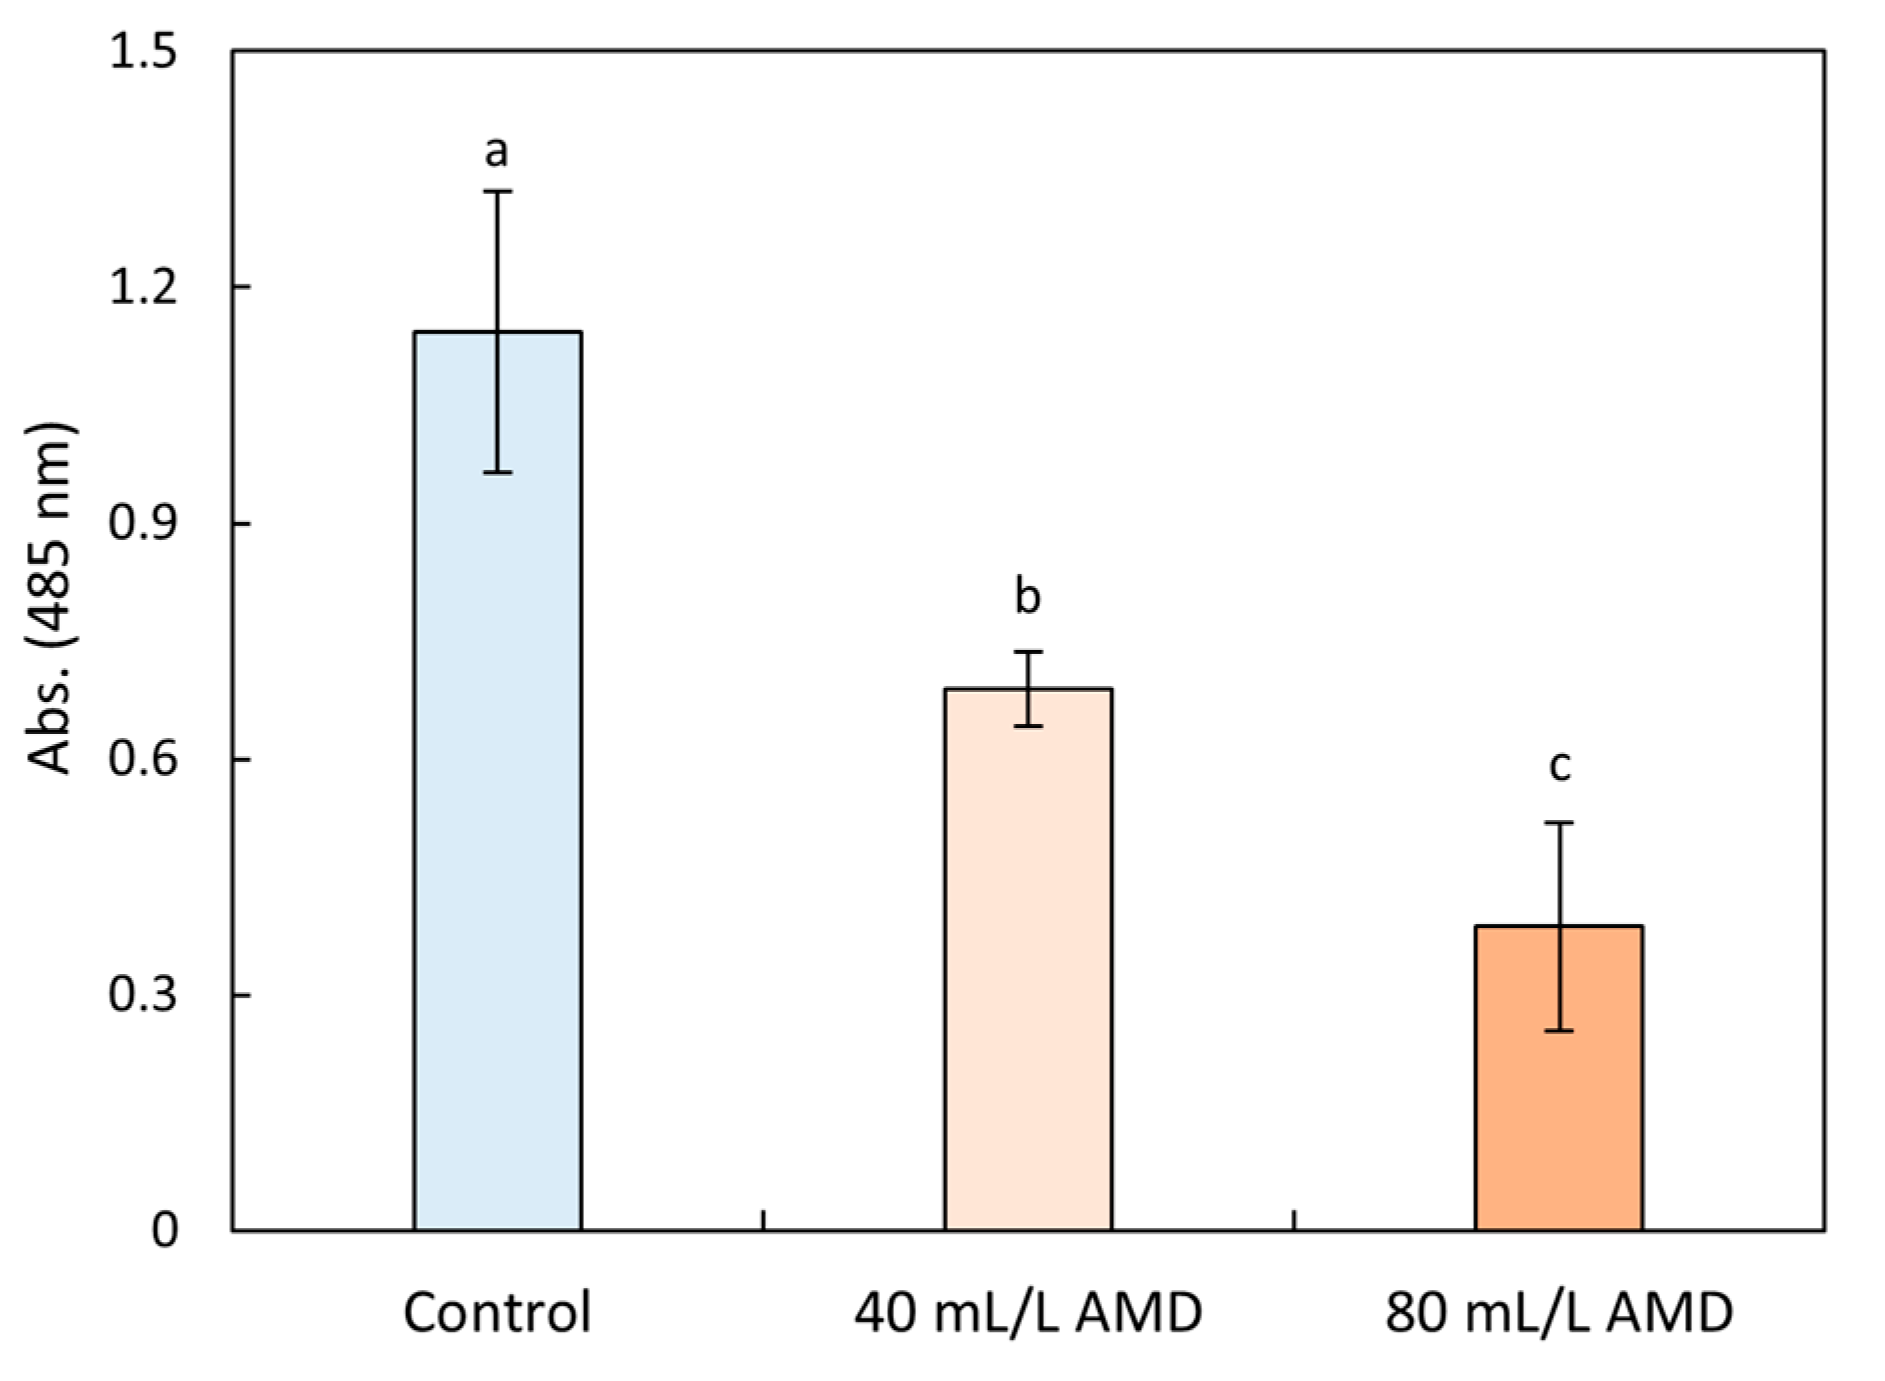
3.3.2. Antioxidative System Response

All seeds grew into seedlings within one week, except for the soybean seeds in 80 mL/L AMD, which did not grow. We measured the activity of SOD and CAT enzymes, H2O2, and MDA content to monitor the response of these seedlings’ antioxidative systems to AMD (Table 1). Compared to the control, soybean seedlings grown in 40 mL/L AMD had lower SOD and CAT activity, and those grown in 80 mL/L AMD failed to germinate. Seedlings grown in 40 mL/LAMD contained significantly higher levels of H2O2 and MDA compared to those of the control. The results showed that AMD appears to have caused oxidative damage to the soybean seedlings.

3.3.3. Fe Concentration

It was determined that soybean seedlings absorbed Fe from AMD after 7 days (Table 2). In addition to providing insight into the extent to which seedlings are affected by iron in AMD, iron content can be used to speculate whether the inhibitory effect of AMD is brought about by iron toxicity. In Table 2, it is indicated that Fe concentration was significantly higher in soybeans exposed to AMD than in the control; however Fe concentration in soybean seedlings exposed to 40 mL/L AMD was not significantly different from that of soybeans that failed to germinate at 80 mL/L AMD.

3.3.4. Length of Shoot and Root

Plant growth is a result of metabolic activity [40]. After 7 days, the shoot length and root length of soybean seedlings were measured (Figure 5a), and a photo was taken (Figure 5b). As shown in Figure 5a, the shoot and root lengths of soybean seedlings grown in 40 mL/L AMD were significantly inhibited, whereas soybean barely germinated in 80 mL/L AMD. The obvious inhibitory effect of AMD on soybean seedlings can also be clearly seen in the photograph in Figure 5b.

4. Discussion

Our study aimed to evaluate the impact of AMD on the soybean crop by using our method, biospeckle coherence tomography (bOCT), and to compare the bOCT results with conventional physiological parameters such as seed vigor, antioxidative system response, Fe concentration, and root and shoot lengths. In conventional plant physiology experiments, the plant must be grounded during the measurement process, whereas the bOCT measurement does not require any damage to the plant. Thus, bOCT measurements are capable of monitoring the growth of a seed continuously. As part of this study, soybeans exposed to AMD were measured by bOCT at two different time periods; one after completing water absorption and expansion, namely, after 6 h, and the other, after starting to germinate, which was after 48 h. The bOCT results showed that the internal biological activity of soybean seeds was significantly inhibited after only 6 h of exposure to 80 mL/L AMD; significantly decreased internal activity of soybean was captured by the bOCT results even at low concentrations of AMD (40 mL/L) after 48 h of AMD action on soybean. Interestingly, results with the same tendency were obtained by the conventional plant physiological measurements after 7 days.
The higher the AMD concentration, the lower the internal activity of soybean seeds monitored by bOCT. The red color in the bOCT image represents high biospeckle contrast, i.e., high internal biological activity, while the blue color represents low biospeckle contrast, i.e., low internal biological activity. By contrast, OCT images do not reveal such differences within the plant. OCT as a method mainly measures the optical reflectivity changes that we observe as structures in the OCT images. These OCT images contain not only the laminar organization of the seed but also fine granular structures called biospeckles. These speckles arise from the finer scattering structures and the random interference among them within the seed. Lim et al. demonstrated that the contrast of seeds inactivated by high temperature was much lower than that of seeds germinated at room temperature, suggesting that the biospeckle contrast measured by bOCT can quantify the biological activity of seeds during germination [41]. Changes in bOCT results before and after the application of hormones were found to be statistically significant by Rajagopalan et al. [18]. Further, the effect of AMD on radish seed germination speed was found to be predicted by bOCT results in our previous study [22]. These studies from our group indicated that biospeckle contrast can capture the effect of the environment on the internal biological activity of the plant.
Water is essential for the germination of seeds. In low pH solutions like AMD, the hard seed coat softens, allowing the seed to better absorb water, and allowing the embryo to penetrate through the seed coat more easily. Seed respiration and organic matter conversion begin after water uptake. Soybean seeds mainly contain proteins, and fats, which are gradually converted to glucose for germination, and this process requires the joint participation of different organelles [42]. Organelles inside the plant such as mitochondria, chloroplasts, and vesicles are possible scatterers, and changes in the external environment can affect the movement of organelles [43,44]. When the physiological changes take place that would lead to temporal variation of scattering characteristics and fine structural changes at the cellular level of the seeds, there will be changes in biospeckles. The biospeckles changes are monitored as a function of time over a period of a few seconds by bOCT. These may account for the differences in bOCT results caused by different concentrations of AMD.
The higher the absorbance of TPF, the higher the seed viability [45]. The seed vigor of soybean in 40 mL/L AMD was lower than that of the control, and seed vigor was the lowest in 80 mL/L AMD, which showed the same tendency as the results of bOCT. The bOCT results are correlated with the internal biological activity of seeds. TTC can be oxidized in metabolically active seeds. The results suggest that this metabolic activity may have been monitored by bOCT.
Environmental stress could lead to excessive accumulation of ROS (reactive oxygen species), such as H2O2, and thus induce oxidative stress [46]. CAT and SOD are antioxidant enzymes used to scavenge H2O2 and maintain cell membrane stability [47]. Increasing ROS results in damage to the cell membrane, and MDA content is a good indicator of lipid peroxidation [48]. In response to environmental stress, plants produce protective enzymes such as SOD and CAT to protect themselves. However, when the plant is subjected to stress that exceeds its tolerance range, the activity of protective enzymes decreases [49]. The SOD and CAT activities under the 40 mL/L AMD treatment decreased while the H2O2 and MDA contents increased, indicating that the oxidative damage to soybean seedlings in 40 mL/L AMD exceeded the threshold. The pH values of 40 mL/L AMD and 80 mL/L AMD in this study were 2.7 and 3, respectively. A study by Liu et al. demonstrated that antioxidant enzyme activities of soybean seeds increased when the pH was greater than 4, and decreased significantly when the pH was 3.5, 2.5, and 2 [50]. Wyrwicka et al. demonstrated that the CAT activity of cucumber leaves decreased when the pH was lower than 3 [51]. The MDA content of soybeans increased when the pH was lower than 4 [50]. These studies support the current results.
The iron uptake of soybean seedlings grown in 40 mL/L AMD was higher than that of the control, at 69.29 mg/kg; the iron uptake of soybeans grown in 80 mL/L AMD was 71.77 mg/kg. There is a risk of damage to plants when Fe accumulation exceeds 300 mg/kg [52]. In a study by Dhaliwal et al., soybean was foliar fertilized with FeSO4·7H2O to increase Fe uptake by soybean. The results showed that the Fe concentration of soybean seed and straw achieved was 70.3 mg/kg and 1146 mg/kg, respectively [53]. Heitholt et al. used three iron sources to promote soybean growth and showed that the iron concentration in soybean leaves was 109 mg/kg, and growth was not inhibited [54]. These studies could support that the iron concentration in soybean seedlings in our study (maximum iron concentration in seedlings was 71.8 mg/kg) was not enough to cause iron toxicity. Soybean seedlings did not accumulate excessive Fe concentration in each treatment but still showed a negative response, probably due to the inability of soybean to adapt to the low pH environment. Suthipradit et al. showed that soybean seeds grown at pH 3.75 had a 30% reduction in embryonic axis length [55]. Uguru et al. showed that soybean traits such as root length and fresh weight were significantly reduced when pH was less than 5.5 [56]. Even for acid-tolerant soybeans, the pH should be greater than 4 [57]. The pH of the simulated AMD in this study was 2.7 and 3. Sulfuric acid diluted with distilled water to obtain a solution with a pH of 3 inhibited the shoot and root length of soybean seedlings (Figure S4). The conductivity of the simulated AMD in the current study was 17.56 mS/m and 27.70 mS/m, respectively, which did not exceed the critical values for normal plant growth [58,59]. Therefore, the low pH of AMD is one of the reasons for the inhibition of shoot and root length in soybean seedlings.

5. Conclusions

The present study is the first to combine the internal biological activity obtained from bOCT measurements with traditional plant physiological parameters, such as seed vigor and enzyme activity, to reveal the effects of AMD on soybean, a major food crop. The negative effect of high AMD concentration (80 mL/L) on soybean seeds was non-invasively revealed by bOCT after only 6 h, which was not found in other studies. Conventional parameters, including seed vigor, SOD and CAT activities, H2O2 and MDA content, iron uptake, and root and shoot length also revealed the toxicity of AMD on soybean seeds. Moreover, the conventional results after 7 days revealed a pattern consistent with the bOCT results after 48 h. Biospeckle contrast has the potential to be a new physiological evaluation parameter that can reveal plant response at an early stage. This study revealed the mechanism of simulated AMD on soybean seeds, and studies on more complex natural AMD need to be conducted.

Supplementary Materials

The following are available online at https://www.mdpi.com/article/10.3390/min12101194/s1, Figure S1: A seed scanned by a probing beam. The bright region on the seed indicates the scan line. Figure S2: Time sequence speckle images for the calculation of biospeckle contrast. The red dot represents the intensity of reflected light at a point over time. Figure S3: OCT structural image (x-z) scans with six regions of interest (ROI) indicated by rectangles. Each rectangle corresponds to 512 × 25 pixels. The average contrast of the ROIs was used to calculate the average across six seeds to give the grand average. Figure S4: Effect of diluted H2SO4 solution (pH = 3) on the shoot and root length of soybean seedlings.

Author Contributions

Conceptualization, D.L. and H.K.; methodology, H.K., U.M.R.; software, H.K.; validation, D.L.; formal analysis, D.L.; investigation, D.L.; resources, D.L.; data curation, D.L.; writing—original draft preparation, D.L.; writing—review and editing, Y.S.K.D.S., U.M.R. and H.K.; visualization, D.L.; supervision, H.K.; project administration, H.K.; funding acquisition, H.K., U.M.R. All authors have read and agreed to the published version of the manuscript.

Funding

This research was partially funded by the JSPS Grant-in-Aid for Scientific Research (B) 19H04289 of the Ministry of Education, Culture, Sports, Science, and Technology in Japan awarded to H.K and the APC was funded from the SIT presidential grant fund of U.M.R.

Data Availability Statement

The data presented in this study are available on request from the corresponding author.

Conflicts of Interest

The authors declare no conflict of interest.

References

  1. Dang, Z.; Liu, C.; Haigh, M.J. Mobility of heavy metals associated with the natural weathering of coal mine spoils. Environ. Pollut. 2002, 118, 419–426. [Google Scholar] [CrossRef]
  2. Gunsinger, M.; Ptacek, C.; Blowes, D.; Jambor, J. Evaluation of long-term sulfide oxidation processes within pyrrhotite-rich tailings, Lynn Lake, Manitoba. J. Contam. Hydrol. 2006, 83, 149–170. [Google Scholar] [CrossRef]
  3. Akcil, A.; Koldas, S. Acid Mine Drainage (AMD): Causes, treatment and case studies. J. Clean. Prod. 2006, 14, 1139–1145. [Google Scholar] [CrossRef]
  4. Thomas, G.; Sheridan, C.; Holm, P.E. A critical review of phytoremediation for acid mine drainage-impacted environments. Sci. Total Environ. 2021, 811, 152230. [Google Scholar] [CrossRef]
  5. Prosekov, A.Y.; Ivanova, S.A. Food security: The challenge of the present. Geoforum 2018, 91, 73–77. [Google Scholar] [CrossRef]
  6. Wang, H.; Zeng, Y.; Guo, C.; Bao, Y.; Lu, G.; Reinfelder, J.R.; Dang, Z. Bacterial, archaeal, and fungal community responses to acid mine drainage-laden pollution in a rice paddy soil ecosystem. Sci. Total Environ. 2018, 616–617, 107–116. [Google Scholar] [CrossRef]
  7. Choudhury, B.U.; Malang, A.; Webster, R.; Mohapatra, K.P.; Verma, B.C.; Kumar, M.; Das, A.; Islam, M.; Hazarika, S. Acid drainage from coal mining: Effect on paddy soil and productivity of rice. Sci. Total Environ. 2017, 583, 344–351. [Google Scholar] [CrossRef] [PubMed]
  8. Lin, C.; Tong, X.; Lu, W.; Yan, L.; Wu, Y.; Nie, C.; Chu, C.; Long, J. Environmental impacts of surface mining on mined lands, affected streams and agricultural lands in the Dabaoshan mine region, southern China. Land Degrad. Dev. 2005, 16, 463–474. [Google Scholar] [CrossRef]
  9. Ma, S.-C.; Zhang, H.-B.; Ma, S.-T.; Wang, R.; Wang, G.-X.; Shao, Y.; Li, C.-X. Effects of mine wastewater irrigation on activities of soil enzymes and physiological properties, heavy metal uptake and grain yield in winter wheat. Ecotoxicol. Environ. Saf. 2015, 113, 483–490. [Google Scholar] [CrossRef]
  10. Munyai, R.; Raletsena, M.V.; Modise, D.M. LC-MS Based Metabolomics Analysis of Potato (Solanum tuberosum L.) Cultivars Irrigated with Quicklime Treated Acid Mine Drainage Water. Metabolites 2022, 12, 221. [Google Scholar] [CrossRef]
  11. Schmitt, J.M. Optical coherence tomography (OCT): A review. IEEE J. Sel. Top. Quantum Electron. 1999, 5, 1205–1215. [Google Scholar] [CrossRef]
  12. Fujimoto, J.G.; Drexler, W.; Schuman, J.S.; Hitzenberger, C.K. Optical Coherence Tomography (OCT) in ophthalmology: Introduction. Opt. Express 2009, 17, 3978–3979. [Google Scholar] [CrossRef] [PubMed]
  13. de Wit, J.; Tonn, S.; Van den Ackerveken, G.; Kalkman, J. Quantification of plant morphology and leaf thickness with optical coherence tomography. Appl. Opt. 2020, 59, 10304–10311. [Google Scholar] [CrossRef]
  14. Larimer, C.J.; Denis, E.H.; Suter, J.D.; Moran, J.J. Optical coherence tomography imaging of plant root growth in soil. Appl. Opt. 2020, 59, 2474–2481. [Google Scholar] [CrossRef]
  15. Srimal, L.; Kadono, H.; Rajagopalan, U. Optical Coherence Tomography Biospeckle Imaging for Fast Monitoring Varying Surface Responses of a Plant Leaf Under Ozone Stress. In Proceedings of the Sensing Technologies for Biomaterial, Food, and Agriculture 2013, Yokohama, Japan, 23–25 April 2013; pp. 96–101. [Google Scholar]
  16. Srimal, L.; Rajagopalan, U.; Kadono, H. Functional Optical Coherence Tomography (fOCT) Biospeckle Imaging to Investigate Response of Plant Leaves to Ultra-Short Term Exposure of Ozone. J. Phys. Conf. Ser. 2015, 664, 012013. [Google Scholar] [CrossRef]
  17. Lim, Y.; Funada, K.; Kadono, H. Monitor biological activities in seed germination by biospeckle optical coherence tomography. In Proceedings of the Dynamics and Fluctuations in Biomedical Photonics XVI, San Francisco, CA, USA, 2–3 February 2019; pp. 42–47. [Google Scholar]
  18. Rajagopalan, U.M.; Kabir, M.; Lim, Y.; Kadono, H. Biospeckle optical coherence tomography in speedy visualizing effects of foliar application of plant growth hormone to Chinese chives leaves. BMC Res. Notes 2020, 13, 377. [Google Scholar] [CrossRef] [PubMed]
  19. De Silva, Y.S.K.; Rajagopalan, U.M.; Li, D.; Kadono, H. Optical screening method to observe the biological activities of lentil (Lens culinaris) seeds quantitatively under the exposure of polyethylene microplastics (PEMPs) using ultrahigh accurate biospeckle optical coherence tomography. In Proceedings of the Tissue Optics and Photonics II, Strasbourg, France, 3–7 April 2022; pp. 70–77. [Google Scholar]
  20. De Silva, Y.S.K.; Rajagopalan, U.M.; Kadono, H.; Li, D. Effects of microplastics on lentil (Lens culinaris) seed germination and seedling growth. Chemosphere 2022, 303, 135162. [Google Scholar] [CrossRef] [PubMed]
  21. De Silva, Y.S.K.; Rajagopalan, U.M.; Kadono, H.; Li, D. Positive and negative phenotyping of increasing Zn concentrations by Biospeckle Optical Coherence Tomography in speedy monitoring on lentil (Lens culinaris) seed germination and seedling growth. Plant Stress 2021, 2, 100041. [Google Scholar] [CrossRef]
  22. Li, D.; Rajagopalan, U.M.; De Silva, Y.S.K.; Liu, F.; Kadono, H. Biospeckle optical coherence tomography (BOCT) in the speedy assessment of the responses of the seeds of Raphanus sativus L. (Kaiware Daikon) to acid mine drainage (AMD). Appl. Sci. 2021, 12, 355. [Google Scholar] [CrossRef]
  23. Kefeni, K.K.; Msagati, T.A.; Mamba, B.B. Acid mine drainage: Prevention, treatment options, and resource recovery: A review. J. Clean. Prod. 2017, 151, 475–493. [Google Scholar] [CrossRef]
  24. Dong, Y.; Liu, F.; Qiao, X.; Zhou, L.; Bi, W. Effects of acid mine drainage on calcareous soil characteristics and Lolium perenne L. germination. Int. J. Environ. Res. Public Health 2018, 15, 2742. [Google Scholar] [CrossRef] [PubMed]
  25. Fetisova, N. Arsenic speciation and sorption in acid mine drainage and the polluted water of the Kosva river basin, Russia. IOP Conf. Ser. Earth Environ. Sci. 2022, 962, 012050. [Google Scholar] [CrossRef]
  26. Seyfried, M.; Fukshansky, L. Light gradients in plant tissue. Appl. Opt. 1983, 22, 1402–1408. [Google Scholar] [CrossRef]
  27. Aizu, Y.; Asakura, T. Bio-speckle phenomena and their application to the evaluation of blood flow. Opt. Laser Technol. 1991, 23, 205–219. [Google Scholar] [CrossRef]
  28. Draijer, M.; Hondebrink, E.; van Leeuwen, T.; Steenbergen, W. Review of laser speckle contrast techniques for visualizing tissue perfusion. Lasers Med. Sci. 2009, 24, 639–651. [Google Scholar] [CrossRef]
  29. Zdunek, A.; Adamiak, A.; Pieczywek, P.M.; Kurenda, A. The biospeckle method for the investigation of agricultural crops: A review. Opt. Lasers Eng. 2014, 52, 276–285. [Google Scholar] [CrossRef]
  30. Pandiselvam, R.; Mayookha, V.; Kothakota, A.; Ramesh, S.; Thirumdas, R.; Juvvi, P. Biospeckle laser technique–A novel non-destructive approach for food quality and safety detection. Trends Food Sci. Technol. 2020, 97, 1–13. [Google Scholar] [CrossRef]
  31. Pajuelo, M.; Baldwin, G.; Rabal, H.; Cap, N.; Arizaga, R.; Trivi, M. Bio-speckle assessment of bruising in fruits. Opt. Lasers Eng. 2003, 40, 13–24. [Google Scholar] [CrossRef]
  32. Braga, R.A.; Dupuy, L.; Pasqual, M.; Cardoso, R. Live biospeckle laser imaging of root tissues. Eur. Biophys. J. 2009, 38, 679–686. [Google Scholar] [CrossRef]
  33. Liu, J.J.; Wei, Z.; Li, J.H. Effects of copper on leaf membrane structure and root activity of maize seedling. Bot. Stud. 2014, 55, 47. [Google Scholar] [CrossRef] [Green Version]
  34. Davis, D.G.; Swanson, H.R. Activity of stress-related enzymes in the perennial weed leafy spurge (Euphorbia esula L.). Environ. Exp. Bot. 2001, 46, 95–108. [Google Scholar] [CrossRef]
  35. Ren, X.; Zhu, J.; Liu, H.; Xu, X.; Liang, C. Response of antioxidative system in rice (Oryza sativa) leaves to simulated acid rain stress. Ecotoxicol. Environ. Saf. 2018, 148, 851–856. [Google Scholar] [CrossRef]
  36. Kos, V.; Budič, B.; Hudnik, V.; Lobnik, F.; Zupan, M. Determination of heavy metal concentrations in plants exposed to different degrees of pollution using ICP-AES. Fresenius J. Anal. Chem. 1996, 354, 648–652. [Google Scholar] [CrossRef]
  37. Tajima, R.; Kato, Y. 【Short Report】 A Quick Method to Estimate Root Length in Each Diameter Class Using Freeware ImageJ. Plant Prod. Sci. 2013, 16, 9–11. [Google Scholar] [CrossRef]
  38. Williams, L.J.; Abdi, H. Fisher’s least significant difference (LSD) test. Encycl. Res. Des. 2010, 218, 840–853. [Google Scholar]
  39. Lopez Del Egido, L.; Navarro-Miró, D.; Martinez-Heredia, V.; Toorop, P.E.; Iannetta, P.P. A spectrophotometric assay for robust viability testing of seed batches using 2, 3, 5-triphenyl tetrazolium chloride: Using Hordeum vulgare L. as a model. Front. Plant Sci. 2017, 8, 747. [Google Scholar] [CrossRef]
  40. Alia, F.J.; Shamshuddin, J.; Fauziah, C.I.; Husni, M.H.A.; Panhwar, Q.A. Effects of aluminum, iron and/or low pH on rice seedlings grown in solution culture. Int. J. Agric. Biol. 2015, 17, 702–710. [Google Scholar] [CrossRef]
  41. Lim, Y.; Kadono, H. Evaluation of germination ability of seeds at different temperatures by biospeckle optical coherence tomography. In Proceedings of the Tissue Optics and Photonics, Online, 6–10 April 2020; pp. 27–32. [Google Scholar]
  42. Taiz, L.; Zeiger, E.; Møller, I.M.; Murphy, A. Plant Physiology and Development; Sinauer Associates Incorporated: Sunderland, MA, USA, 2015. [Google Scholar]
  43. Perico, C.; Sparkes, I. Plant organelle dynamics: Cytoskeletal control and membrane contact sites. New Phytol. 2018, 220, 381–394. [Google Scholar] [CrossRef]
  44. Wada, M.; Suetsugu, N. Plant organelle positioning. Curr. Opin. Plant Biol. 2004, 7, 626–631. [Google Scholar] [CrossRef]
  45. Zhao, P.; Zhu, Y.; Wang, W. Evaluation and improvement of spectrophotometric assays of TTC reduction: Maize (Zea mays) embryo as an example. Acta Physiol. Plant. 2010, 32, 815–819. [Google Scholar] [CrossRef]
  46. Sies, H. Role of metabolic H2O2 generation: Redox signaling and oxidative stress. J. Biol. Chem. 2014, 289, 8735–8741. [Google Scholar] [CrossRef] [PubMed] [Green Version]
  47. Gajewska, E.; Skłodowska, M. Differential biochemical responses of wheat shoots and roots to nickel stress: Antioxidative reactions and proline accumulation. Plant Growth Regul. 2008, 54, 179–188. [Google Scholar] [CrossRef]
  48. Mittler, R. Oxidative stress, antioxidants and stress tolerance. Trends Plant Sci. 2002, 7, 405–410. [Google Scholar] [CrossRef]
  49. Hasanuzzaman, M.; Hossain, M.A.; Silva, J.A.; Fujita, M. Plant response and tolerance to abiotic oxidative stress: Antioxidant defense is a key factor. In Crop Stress and Its Management: Perspectives and Strategies; Springer: Berlin/Heidelberg, Germany, 2012; pp. 261–315. [Google Scholar]
  50. Liu, T.T.; Wu, P.; Wang, L.H.; Zhou, Q. Response of soybean seed germination to cadmium and acid rain. Biol. Trace Elem. Res. 2011, 144, 1186–1196. [Google Scholar] [CrossRef] [PubMed]
  51. Wyrwicka, A.; Skłodowska, M. Influence of repeated acid rain treatment on antioxidative enzyme activities and on lipid peroxidation in cucumber leaves. Environ. Exp. Bot. 2006, 56, 198–204. [Google Scholar] [CrossRef]
  52. Sahrawat, K.L. Elemental composition of the rice plant as affected by iron toxicity under field conditions. Commun. Soil Sci. Plant Anal. 2000, 31, 2819–2827. [Google Scholar] [CrossRef]
  53. Dhaliwal, S.S.; Sharma, V.; Shukla, A.K.; Kaur, J.; Verma, V.; Kaur, M.; Singh, P.; Kaur, L.; Verma, G.; Singh, J. Biofortification of Soybean (Glycine max L.) through FeSO4· 7H2O to Enhance Yield, Iron Nutrition and Economic Outcomes in Sandy Loam Soils of India. Agriculture 2022, 12, 586. [Google Scholar] [CrossRef]
  54. Heitholt, J.; Sloan, J.; MacKown, C.; Cabrera, R. Soybean growth on calcareous soil as affected by three iron sources. J. Plant Nutr. 2003, 26, 935–948. [Google Scholar] [CrossRef]
  55. Suthipradit, S.; Alva, A. Aluminum and pH limitations for germination and radicle growth of soybean. J. Plant Nutr. 1986, 9, 67–73. [Google Scholar] [CrossRef]
  56. Uguru, M.I.; Oyiga, B.C.; Jandong, E.A. Responses of some soybean genotypes to different soil pH regimes in two planting seasons. Afr. J. Plant Sci. Biotechnol. 2012, 6, 26–37. [Google Scholar]
  57. Kuswantoro, H.; Zen, S. Performance of acid-tolerant soybean promising lines in two planting seasons. Int. J. Biol. 2013, 5, 49. [Google Scholar] [CrossRef]
  58. Blanco, F.F.; Folegatti, M.V.; Gheyi, H.R.; Fernandes, P.D. Emergence and growth of corn and soybean under saline stress. Sci. Agric. 2007, 64, 451–459. [Google Scholar] [CrossRef] [Green Version]
  59. Samarakoon, U.; Weerasinghe, P.; Weerakkody, W. Effect of electrical conductivity (EC) of the nutrient solution on nutrient uptake, growth and yield of leaf lettuce (Lactuca sativa L.) in stationary culture. Trop. Agric. Res. 2006, 18, 3. [Google Scholar]
Figure 1. An illustration of spectral domain optical coherence tomography (SLD: superluminescent diode, L1~L6: lenses, M1~M2: mirror, PC: polarization controller).
Minerals 12 01194 g001
Figure 2. OCT images (a) and bOCT images (b) of soybean seed exposed in AMD for 6 and 48 h.
Minerals 12 01194 g002
Figure 3. Averaged biospeckle contrast of seeds exposed in AMD for 6 and 48 h. (Different letters, a, b, and c, represent statistical differences between treatments; the error bar represents standard deviation; Fisher LSD multiple comparison; p < 0.05 level; N = 6).
Minerals 12 01194 g003
Figure 4. TPF absorbance of seeds exposed in AMD for 48 h. (Different letters, a, b, and c, represent statistical differences between treatments; the error bar represents standard deviation; Fisher LSD multiple comparison; p < 0.05 level; N = 6).
Minerals 12 01194 g004
Figure 5. (a) Shoot and root length of soybean seedlings after 7 days. (b) Photo of soybeans after 7 days. (Different letters, a, and b, represent statistical differences between treatments; the error bar represents the standard deviation; Fisher LSD multiple comparison; p < 0.05 level; N = 6).
Minerals 12 01194 g005
Table 1. Response of antioxidative systems of soybean seedlings to AMD after 7 days. (Different letters, a, and b, represent statistical differences between treatments; the error represents standard deviation; Fisher LSD multiple comparison; p < 0.05 level; N = 3; N.D. indicates no data).
TreatmentSOD
(U·g−1 FW)
CAT
(U·g−1 FW·min−1)
H2O2
(μmol·g−1 FW)
MDA
(μmol·g−1 FW)
Control898.5 ± 64.3 a0.23 ± 0.03 a794.4 ± 170.3 b22.2 ± 1.2 b
40 mL/L AMD621.5 ± 101.5 b0.16 ± 0.01 b1180.4 ± 117.2 a35.9 ± 3.2 a
80 mL/L AMDN.D.N.D.N.D.N.D.
Table 2. Fe concentration in soybean seedlings in AMD after 7 days. (Different letters, a, and b, represent statistical differences between treatments; the error represents standard deviation; Fisher LSD multiple comparison; p < 0.05 level; N = 3).
TreatmentFe Concentration (mg·kg −1)
Control46.7 ± 3.4 b
40 mL/L AMD68.3 ± 4.5 a
80 mL/L AMD71.8 ± 4.8 a
Publisher’s Note: MDPI stays neutral with regard to jurisdictional claims in published maps and institutional affiliations.

