Article

Quantitative Study on Colour and Spectral Characteristics of Beihong Agate

School of Gemmology, China University of Geosciences, Beijing 100083, China
*
Author to whom correspondence should be addressed.
Minerals 2022, 12(6), 677; https://doi.org/10.3390/min12060677
Submission received: 2 May 2022 / Revised: 15 May 2022 / Accepted: 20 May 2022 / Published: 27 May 2022
(This article belongs to the Special Issue Gems and Gem Minerals)

Abstract

:
The Beihong agate from the southern section of the Xing’an Mountains in northeastern China is a kind of cryptocrystalline agate with a yellow to orange-red colour. However, it has been less studied in previous research, and there is a lack of quantitative study on the cause of its colour. In this study, the colour of Beihong agate was quantified by a colourimeter, and the quantitative relationships between colour and spectral characteristics of Beihong agate were studied by XRF, Raman spectra, UV-VIS spectra, and a heat treatment experiment. The results show a high correlation between the lightness and the hue angle of the Beihong agate. The change of total Fe content can significantly affect the lightness and the hue of the Beihong agate. The first derivative curve can effectively distinguish the relative contents of goethite and hematite in the Beihong agate, and the position of a primary trough is related significantly to the colour of the Beihong agate.

1. Introduction

Agate is a type of chalcedony with a striped structure and is loved for its varied colours and shapes. Its main component mineral is α-quartz, which is colourless. When the crystallite size, microstructure (including water content) [1,2], and porosity of α-quartz microcrystals change, it also produces different bands and colours, commonly white, grey, and blue [3]. When it contains other impurity minerals, such as chlorite, carbonaceous inclusions, iron oxides or hydroxides, etc., agate will have vivid colours. Red and yellow agates are mostly caused by iron oxides and hydroxides. The yellow colour of agate is related to goethite and or ferrihydrite [4,5,6], while the red colour is mostly caused by hematite or together with goethite [7,8]. Goethite and hematite have different colours, yellow for goethite and red for hematite, and produce different colours when the size and content vary [3]. They have different chromogenic properties, and under certain temperature and pressure conditions, goethite can be converted to hematite [9]. Variations in the microstructure of agate can also lead to uneven distribution of colour-causing minerals in the strips, resulting in abundant colour combinations.
As a kind of cryptocrystalline agate, the Beihong agate, which is usually yellow to orange-red and is found extensively distributed in the southern section of Xing’an Mountains in northeastern China, such as the Ating River basin in Xunke County, the Tangwang River basin in Yichun City, and the Nenjiang River basin [10]. Due to the popularity of Nanhong agate in the jewellery market of China in recent years, the Beihong agate, with similar colours but much cheaper, is gaining more and more attention from the public. The Beihong agate is mainly composed of α-quartz and moganite, with a minor amount of goethite and hematite responsible for its colour. Goethite and hematite exist in the form of scattered and disseminated forms and are presumed to be the aggregates at the submicron scale. Beihong agate contains more content of moganite, and the Raman band integral ratio I502/I465 can be used to distinguish Beihong agate from Nanhong agate [10,11].
Quantitative studies on the colour of gemstones can not only distinguish the subtle differences and grade the colour of gemstones more accurately but also explore the colour genesis of gemstones in a more detailed manner by combining the spectral characteristics, chemical composition and other studies. The current methods to obtain the colour of gemstones include colour chips [12], colourimetric stones [13], UV-VIS spectrophotometers [14], colourimeters [15] and digital image systems [16,17]. The latter three can be able to obtain accurate and quantified parameters of colour. Based on the CIE 1976 L*a*b* uniform colour space, many gemologists have carried out colour grading and quality evaluation of gemstones, such as green and red Jadeite [18,19], Corundum [20,21], Peridot [22,23], Chrysoprase [15,24], Garnet [25], Serpentinite [26], Turquoise [27], etc., as well as studies on the causes of colour-changing garnets [14] and the effect of heat treatment on the colour of amethyst [28]. This colour space has also been used in the study of the colour of goethite and hematite [29]. The accurate quantification of colour using this colour space can be used to differentiate between the different colours of Beihong and Nanhong agate [10].
In this study, we quantified the colour of yellow to orange-red Beihong agates based on the CIE 1976 L*a*b* uniform colour space and conducted the spectroscopic analysis using XRF, Raman spectroscopy, and UV-VIS spectroscopy to study the relationships between colour and spectral characteristics quantitively. We also performed heat treatment experiments on the samples to explore the changes in colour and spectral characteristics after heat treatment.

2. Materials and Methods
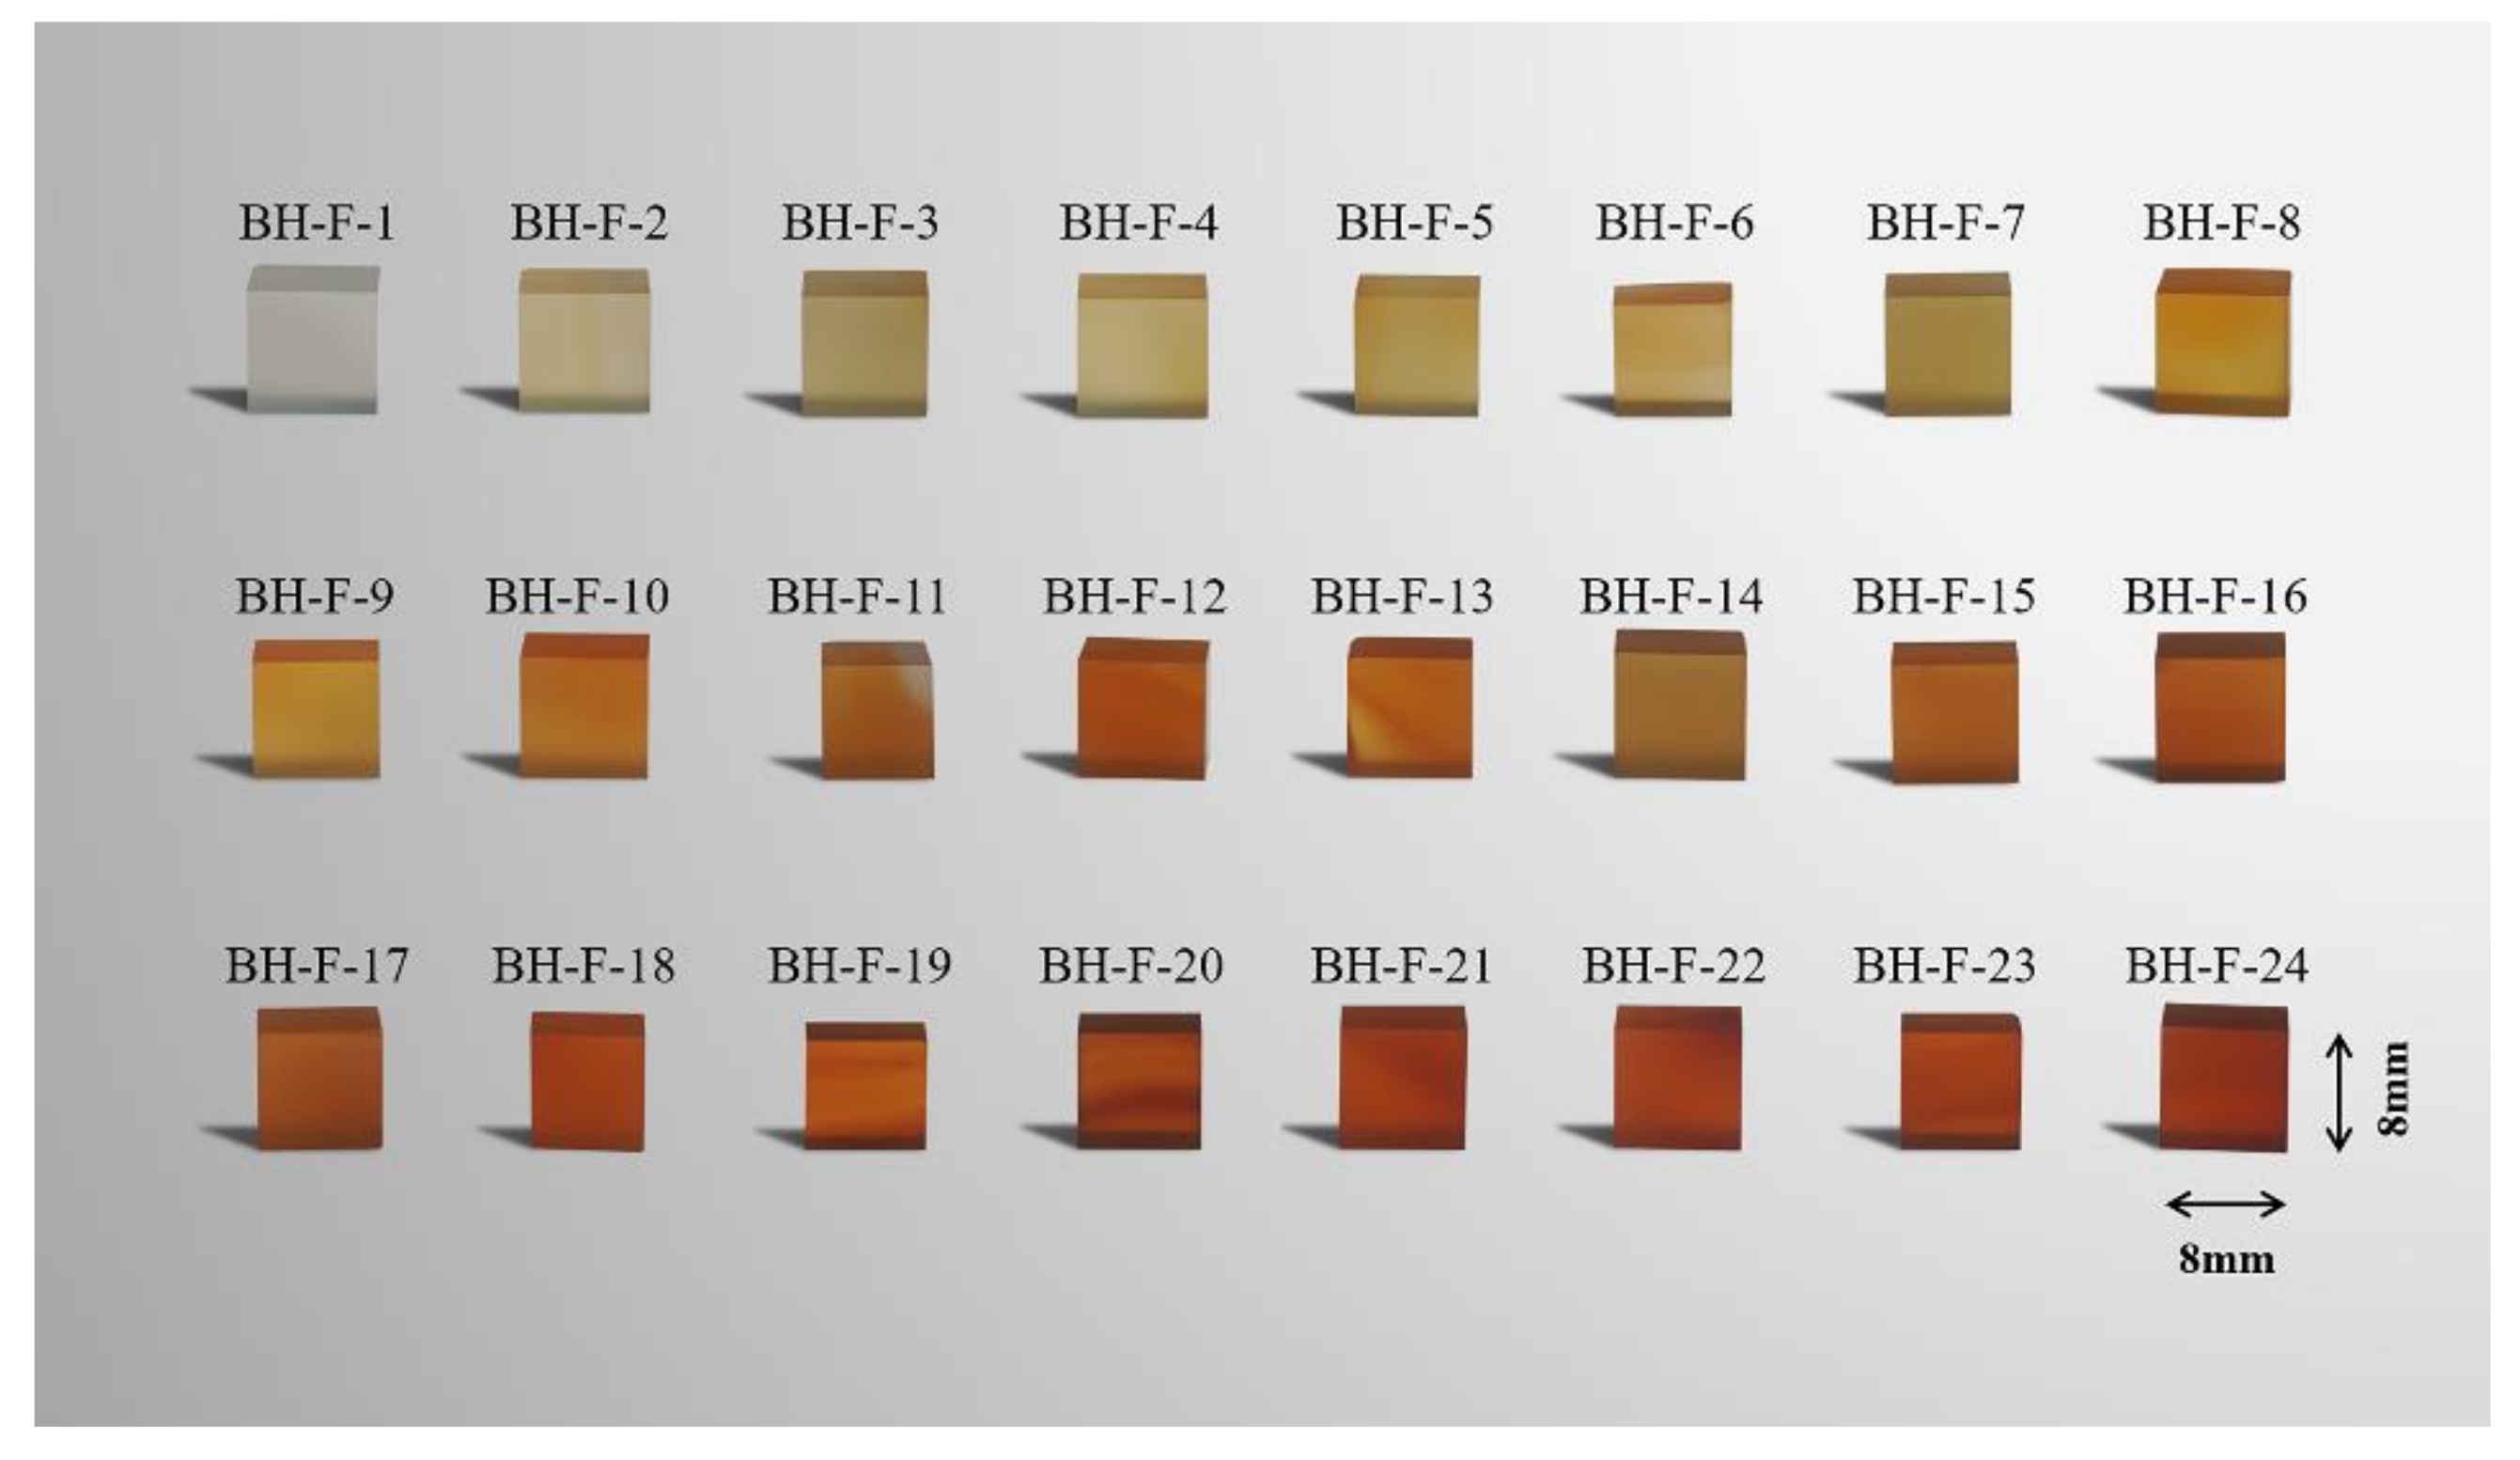
2.1. Samples

Twenty-four natural Beihong agates from Xunke County, Heilongjiang Province, China, were selected for this study with colours displayed evenly from pale yellow to vivid orange-red, including a nearly colourless control sample. Figure 1 shows the samples for Beihong, and each of them was polished into rectangular blocks with a length and width of 8 mm and a thickness of 5 mm. There is no obvious inclusion in the inner part of the samples observed by naked eyes, and some samples have circle colour bands. Selections of the leftover material from the previous samples were also grounded into a light sheet for polarisation microscopy and Raman testing.

2.2. Colourimetric Analysis

Colour parameters of the 24 samples initially and after heat treatment were measured by X-Rite SP62 spectrophotometer (X-Rite, Grand Rapids, MI, USA) in a standard illumination box, with a 6504-K fluorescent lamp as lighting source and N9.5 Munsell neutral colour chip as background. The spectrophotometer collects the surface reflection signal of the sample through the integrating sphere and then converts the signal into the colour parameters. In order to obtain accurate colour parameters, the average value of each sample was taken after three tests, and the correlations between colour parameters were also analysed. Test conditions were: CIE standard illumination, D65 standard lighting source; reflection, not including the specular reflection; observer view of 2°; measurement range of 400–700 nm, measurement time of less than 2.5 s; voltage of 220 V and a frequency of 50–60 Hz.
The colour parameters were characterised quantitatively based on the CIE 1976 L*a*b* uniform colour space. The system is composed of the colour coordinates a* and b* and the lightness L*. In the cast-point diagram of a* and b*, the distance from the projection point to the origin of coordinates represents chroma C* and the angle between the line from the projection point to the origin of coordinates and the +a* axis represents hue angle . Chroma C* and hue angle can be calculated by a* and b*:
C a b * = a * 2 + b * 2
h a b ° = a r c t a n b * a *
To calculate the colour difference ( Δ E 00 ) between Beihong agate before and after heat treatment, we chose the CIE DE2000 (1:1:1) colour difference formula, which is known to provide better visual uniformity than CIELAB.
Δ E 00 = Δ L K L S L 2 + Δ C K C S C 2 + Δ H K H S H 2 + R T Δ C K C S C Δ H K H S H
where Δ L , Δ C and Δ H are the differences in lightness, chroma and hue angle, respectively. RT is a conversion function to reduce the interaction between chroma and hue in the blue area. SL, SC, and SH are functions to calibrate the absence of visual uniformity of the CIE LAB formula. KL, KC, and KH are correction parameters of the experimental environment and KL = 1, KC = 1, KH = 1.

2.3. Energy Dispersive X-ray Fluorescence Spectrometer

XRF can be used to quickly detect the content of most elements in Beihong agate. Micro-area chemical components were measured by an EDX-7000 energy dispersive X-ray fluorescence spectrometer at the School of Gemmology, China University of Geosciences, Beijing, China, with the test conditions as follows: atmosphere, oxide; voltage of 50 kV; 108 μA; 30% DT; and a 3 mm collimator. The relationships between trace metal element content and colour parameters of Beihong agates were quantitatively analysed.

2.4. Raman Spectroscopy

Both the silica matrix and the inclusions in the Beihong agates were acquired between 100 and 2000 cm−1 using the Horiba LabRAM HR Evolution Raman spectrometer equipped with a Peltier-cooled charged-coupled device (CCD) detector, edge filters, and an Nd-YAG laser (100 mW, 532 nm) at the School of Gemmology, China University of Geosciences, Beijing, China. The confocal hole was fixed at 100 μ m , and the diffraction grating was 600 grooves/mm. The laser focusing and sample viewing were operated through 100×, 50×, and 10× objective lenses with a polaroid. With this configuration, the spatial resolution was <1 μm, and the spectral resolution was determined to be ~ 1 cm−1. The spectrometer calibration was set using the 520.5 cm−1 of a silicon wafer. The spectra were recorded at a laser power of 50 mW with 3 s acquisition time and once accumulation.

2.5. UV-VIS Spectroscopy

Absorption spectra in the ultraviolet to visible (UV-VIS) range of 200–800 nm of all the Beihong agate samples initially and after heat treatment were recorded with a UV-3600 UV-VIS spectrophotometer (SHIMADZU, Kyoto, Japan) at the School of Gemmology, China University of Geosciences, Beijing, China. The scanning speed was high, the sampling interval was 1 s, and the single scanning mode was used.
The original UV-VIS spectra are difficult to identify and quantitatively analyse iron oxide minerals. The first derivative of the UV-VIS spectra is an effective and rapid method to analyse the species and content of hematite and goethite [30,31,32]. The presence of either hematite or goethite in a quartz matrix can be detected at extremely low levels, at least as low as 0.01% by weight [33,34]. The characteristics of the first derivative curve of UV-VIS spectra were combined with the results of XRF and colourimetric analysis, and the quantitative relationships between them were discussed. Furthermore, the effects of heat treatment on Beihong agates were analysed by comparing the changes of UV-VIS spectra and its first derivative curves before and after heat treatment.

2.6. Heating Method

The heat treatment instrument was used the Nabertherm L9/11/P330 muffle furnace (Made in Germany) at the Hydrogeochemistry Laboratory, School of Water Resources and Environment, China University of Geosciences, Beijing, China. The heating element is a resistance wire, and the maximum heating temperature is 1100 °C. The temperature control system adopts intelligent programmable control, and the accuracy is ±1 °C with a heating power of 3000 W. To heat the samples evenly, they were buried in pure silica sand and placed in an alumina crucible. A total of 24 samples were heated to 310 °C under an oxidizing atmosphere. The heating rate is 10 °C per minute, and after holding for 15 min, the samples were naturally cooled down to room temperature in the muffle furnace and then taken out to test. The colour parameters and UV-VIS spectra were tested to analyse the changes in colour and spectra of Beihong agates after heat treatment.

3. Results and Discussion

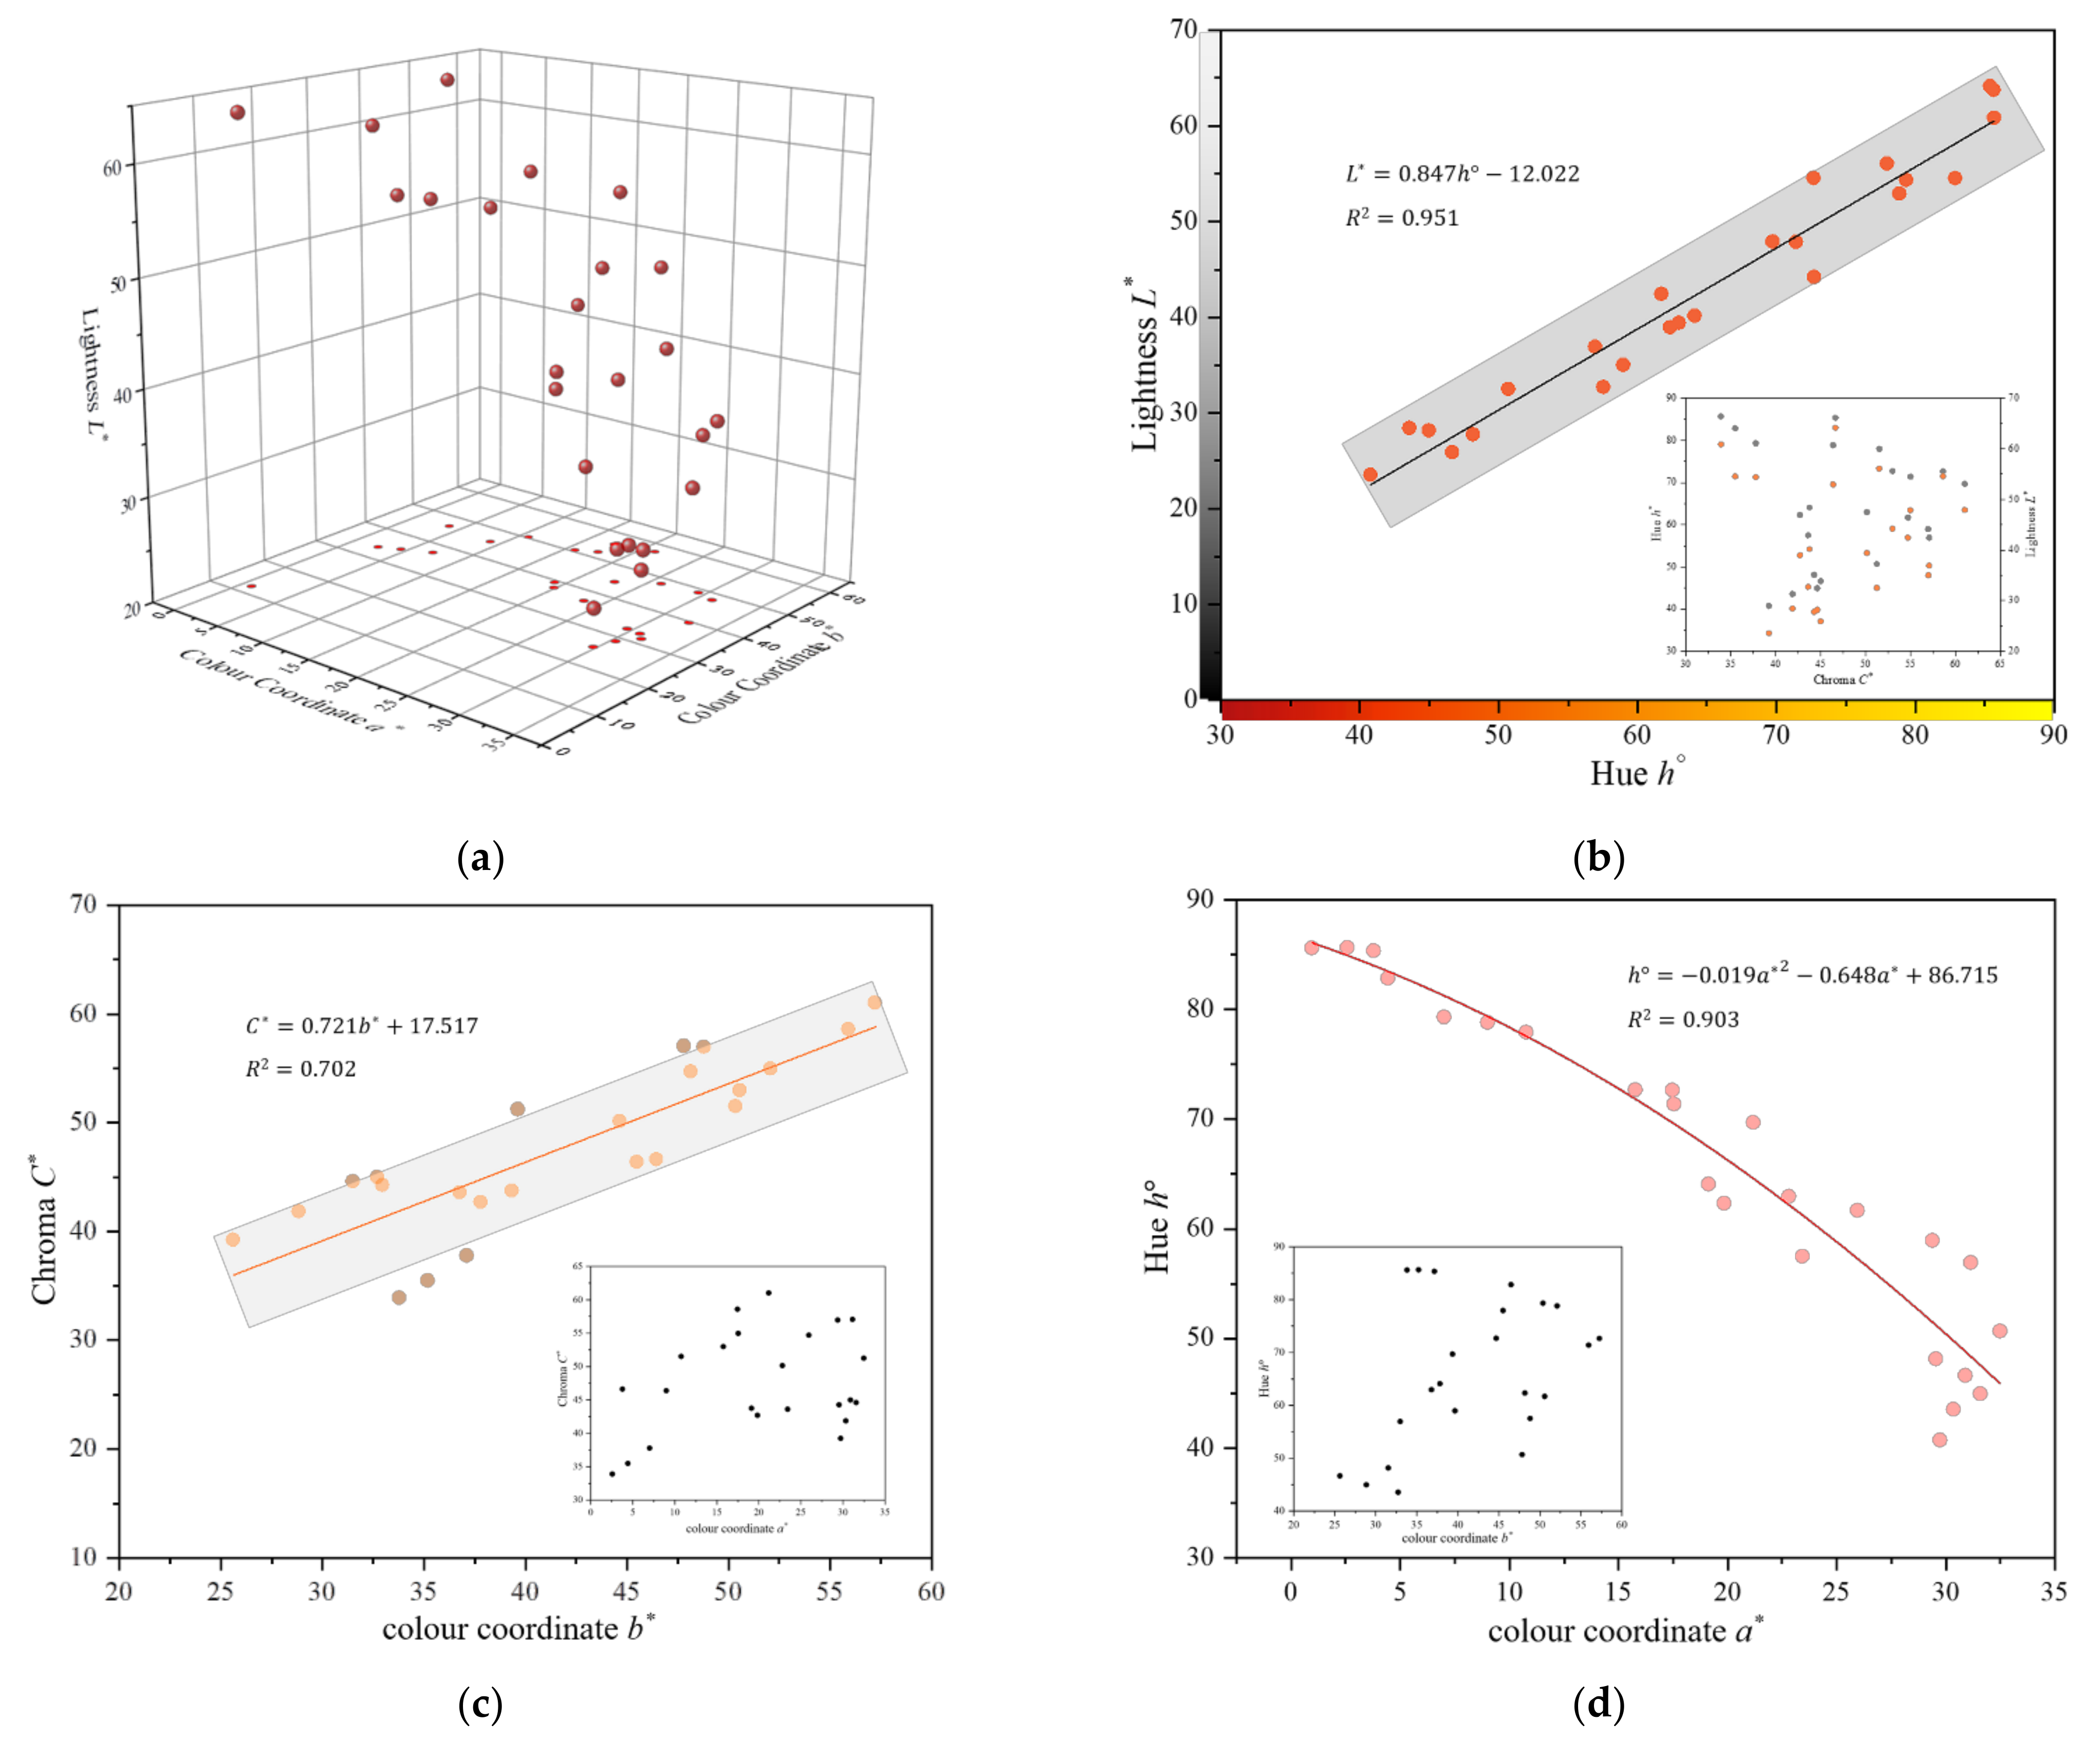
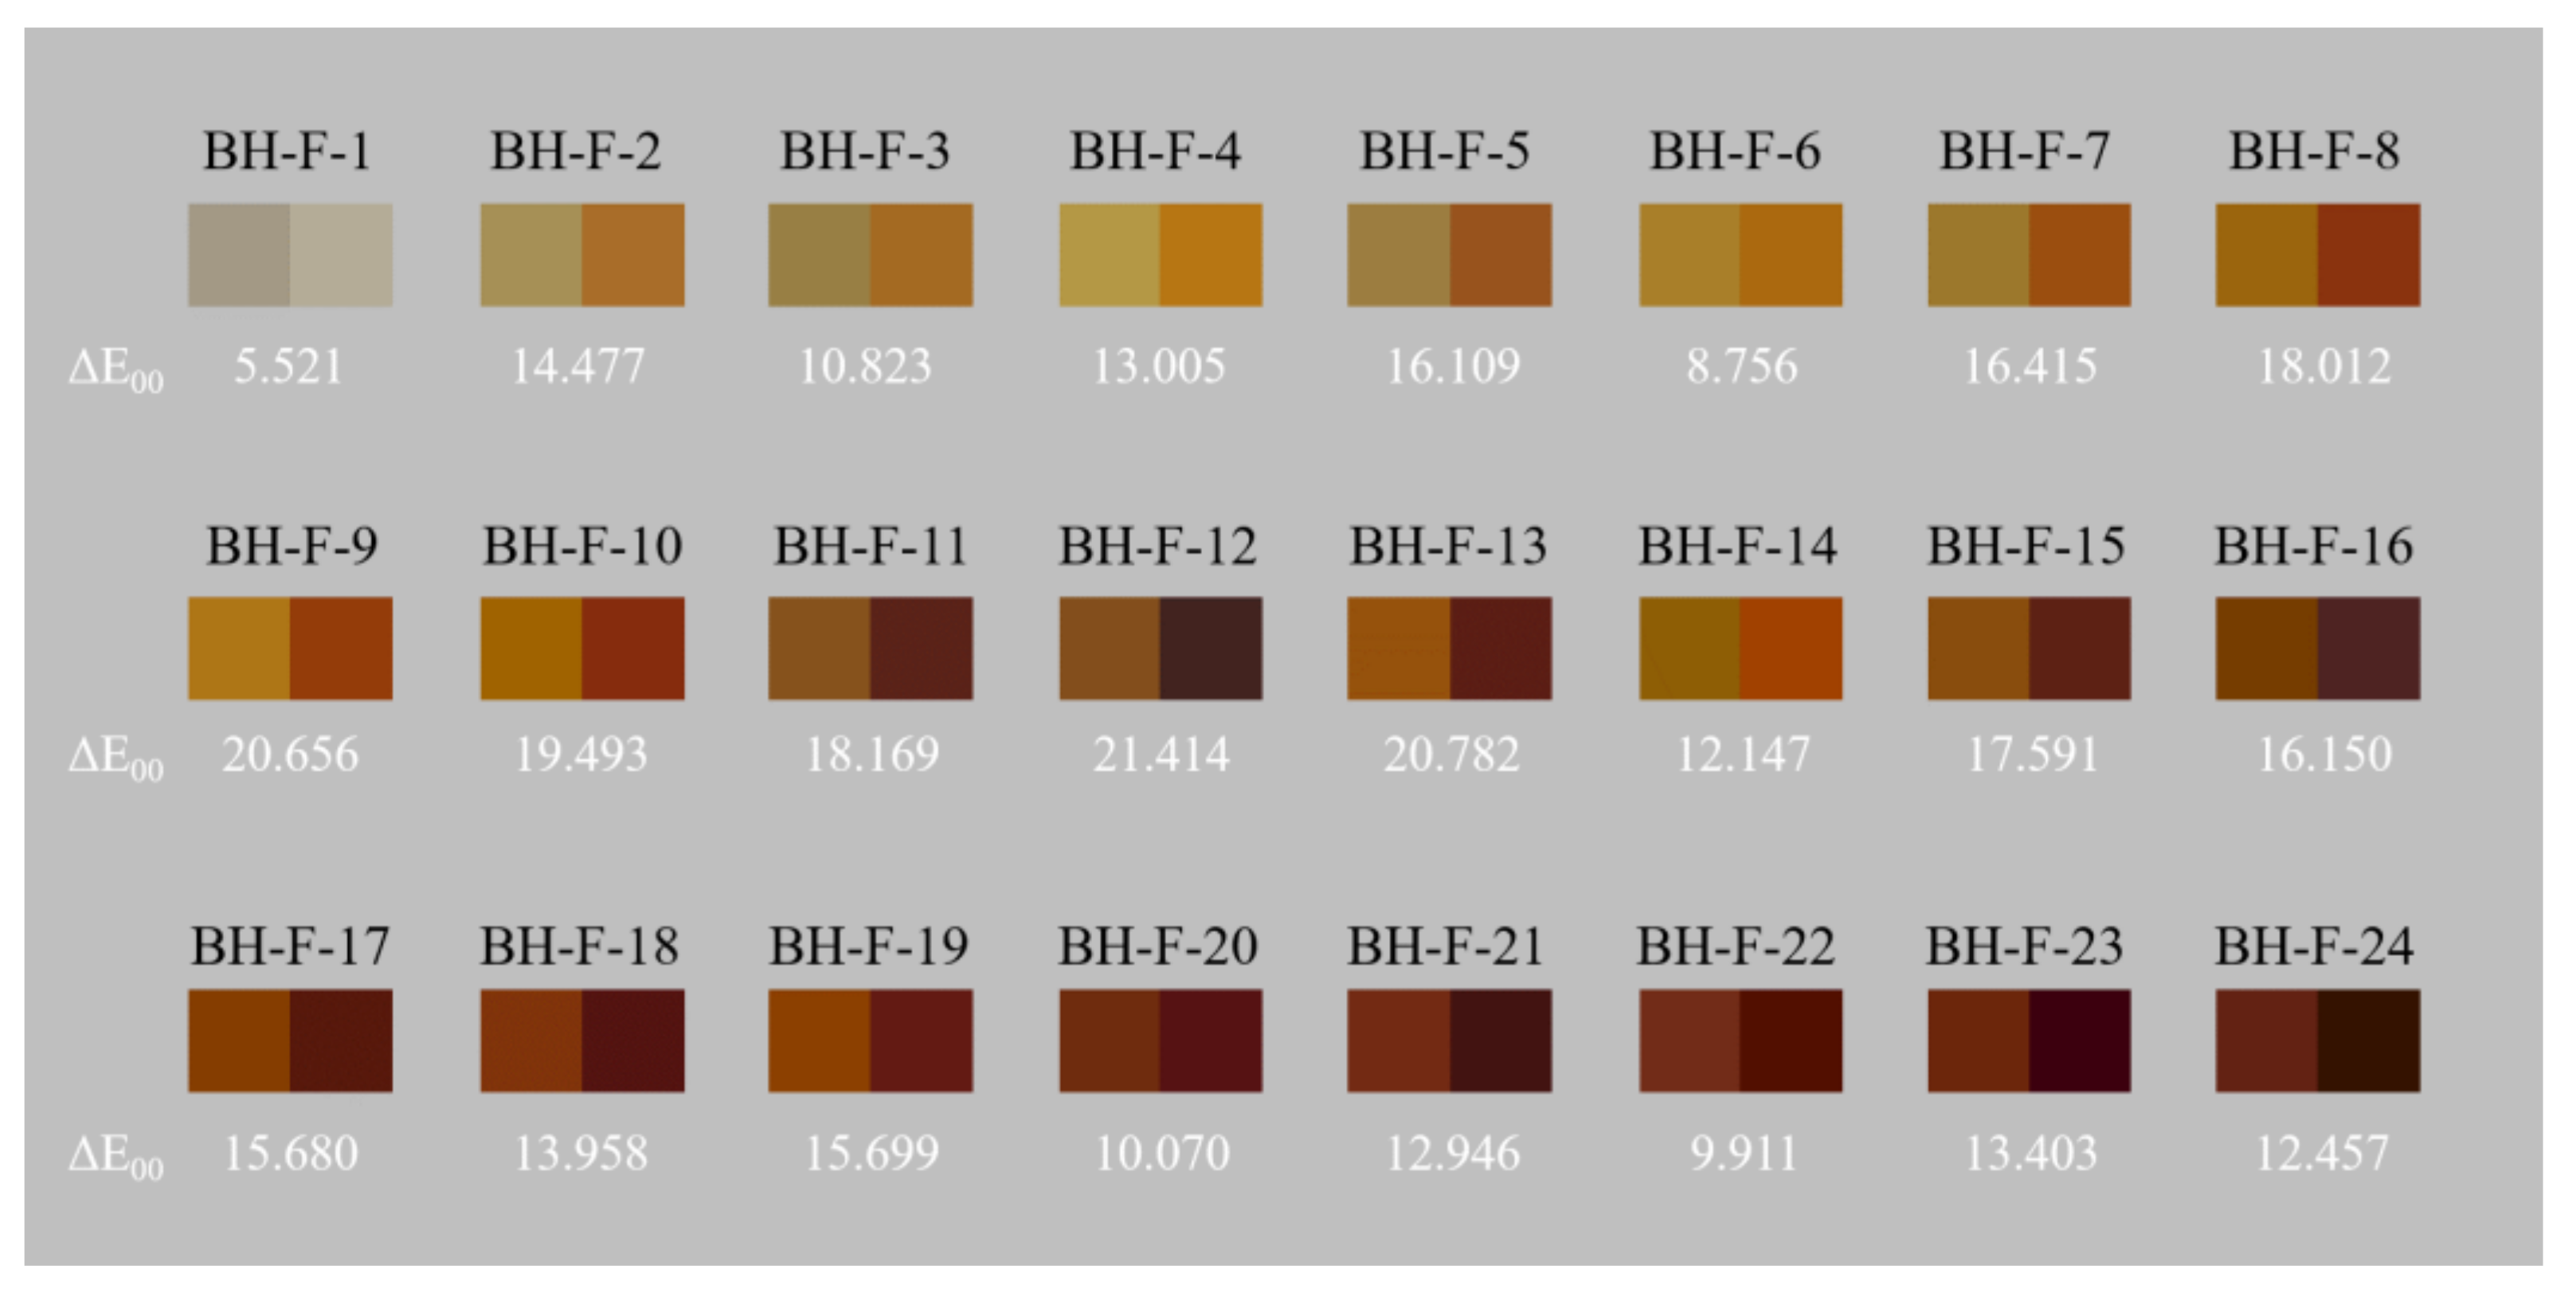
3.1. Colour Quantification

The obtained results of twenty-four Beihong agate samples were as follows: values of lightness L* (23.56–64.17), chroma C* (12.29–61.04), hue angle (40.75–85.65), colour coordinates a* (0.94–32.48) and b* (12.25–57.25). The test data for the colour parameters of the twenty-four samples are shown in Table S1. These values are consistent with the colour appearances of Beihong agates. The colour parameters of these 24 samples are projected in the CIE 1976 L*a*b* uniform colour space (Figure 2a).
Through the correlation analysis of colour parameters of 24 Beihong agates, there is a high positive correlation between the lightness L* and the hue angle h° (Pearson’s r = 0.975, R2 = 0.951) (when r   0.8, which means a high correlation) [24]. As shown in Figure 2b, with the increase in hue angle, the lightness of the samples also increases; that is, yellow Beihong agate has a higher lightness. However, the relationships between lightness L* and chroma C*, chroma C* and hue angle h° are weak.
Since chroma C* and hue angle are calculated by colour coordinates a* and b*, it is found that there is a high positive correlation between the colour coordinate b* and the chroma C* (Pearson’s r = 0.895, R2 = 0.702). As shown in Figure 2c, compared with b*, the relationship between a* and chroma C* is more discrete, so the chroma of Beihong agate is mainly controlled by b*. Moreover, there is a high negative correlation between the colour coordinate a* and the hue angle (Pearson’s r = −0.948, R2 = 0.903). As shown in Figure 2d, compared with a*, the relationship between b* and hue angle is more discrete, so the hue of Beihong agate is mainly controlled by a*.

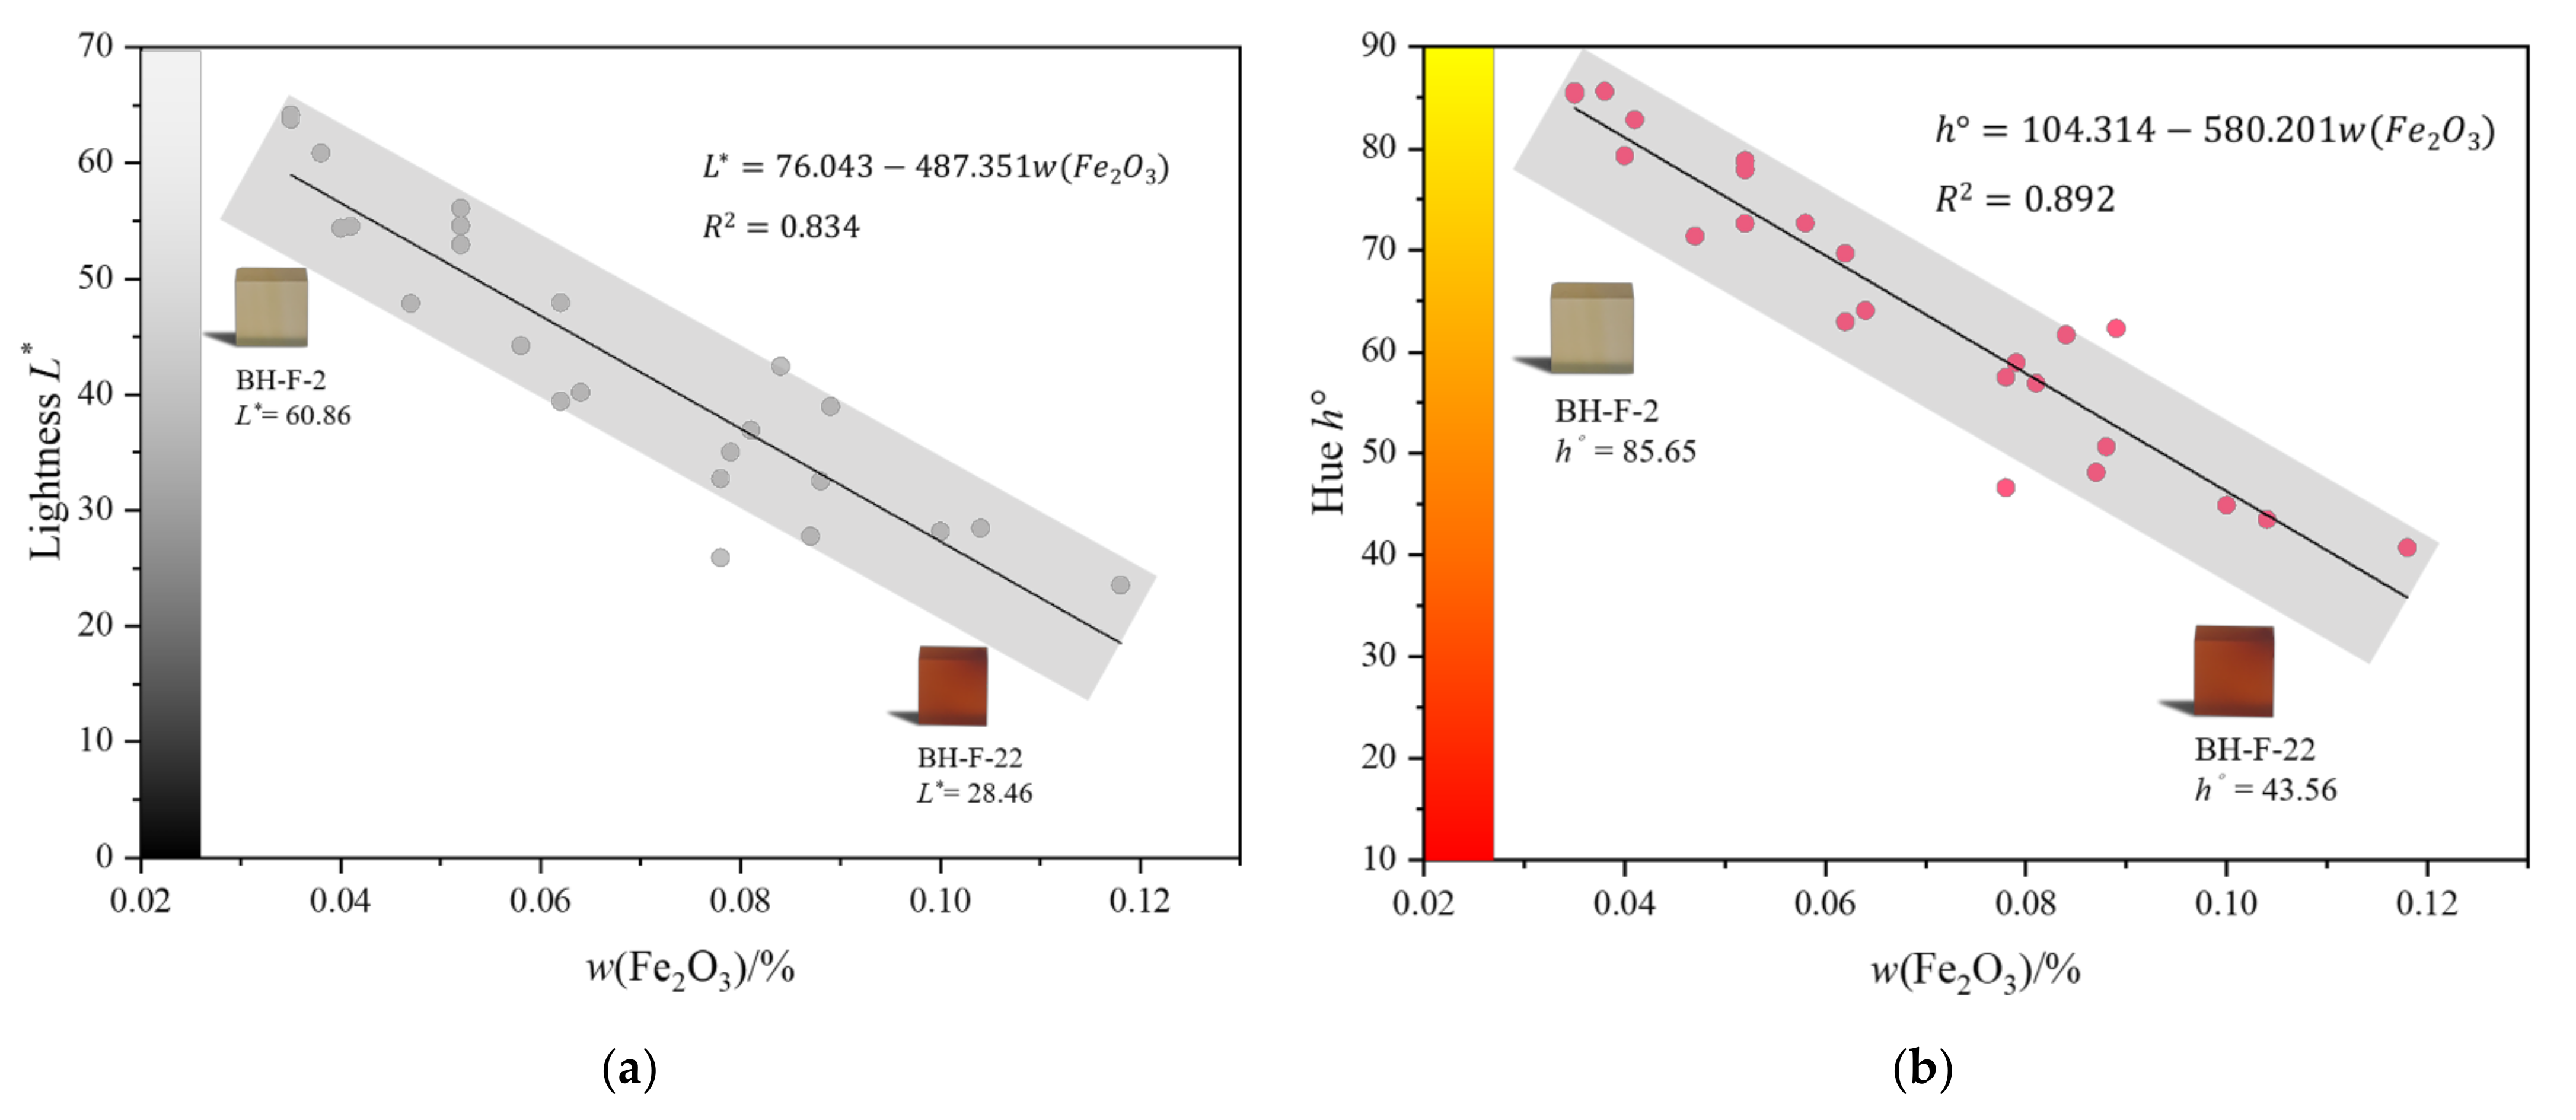
3.2. X-ray Fluorescence Measurement

The results show that the main component of Beihong agates of different colours is SiO2, whose weight percentage [wt%] is between 99.810 and 99.949. In addition, all Beihong agate samples contain varying amounts of iron oxides, with the weight percentage range of 0.035–0.118%, which represents the total Fe content detected in Beihong agates. The measurement results are shown in Table S2. Fe is a transition-mental element, which is often related to the colour of gemstones [23,27].
Correlation analysis was used to analyse the relationships between the total Fe content and the colour parameters of Beihong agates, respectively. According to the results (Figure 3), there is a high negative correlation between the Fe content and the lightness L* (Pearson’s r = −0.917, R2 = 0.834) and the hue angle h ° (Pearson’s r = −0.947, R2 = 0.892). However, there was a weak correlation between the Fe content and the chroma C* (Pearson’s r = 0.205, R2 = −0.0013) (when r < 0.3, it means weak or no correlation). Therefore, the total Fe content affects the lightness and the hue of Beihong agates but has no discernible effect on chroma.

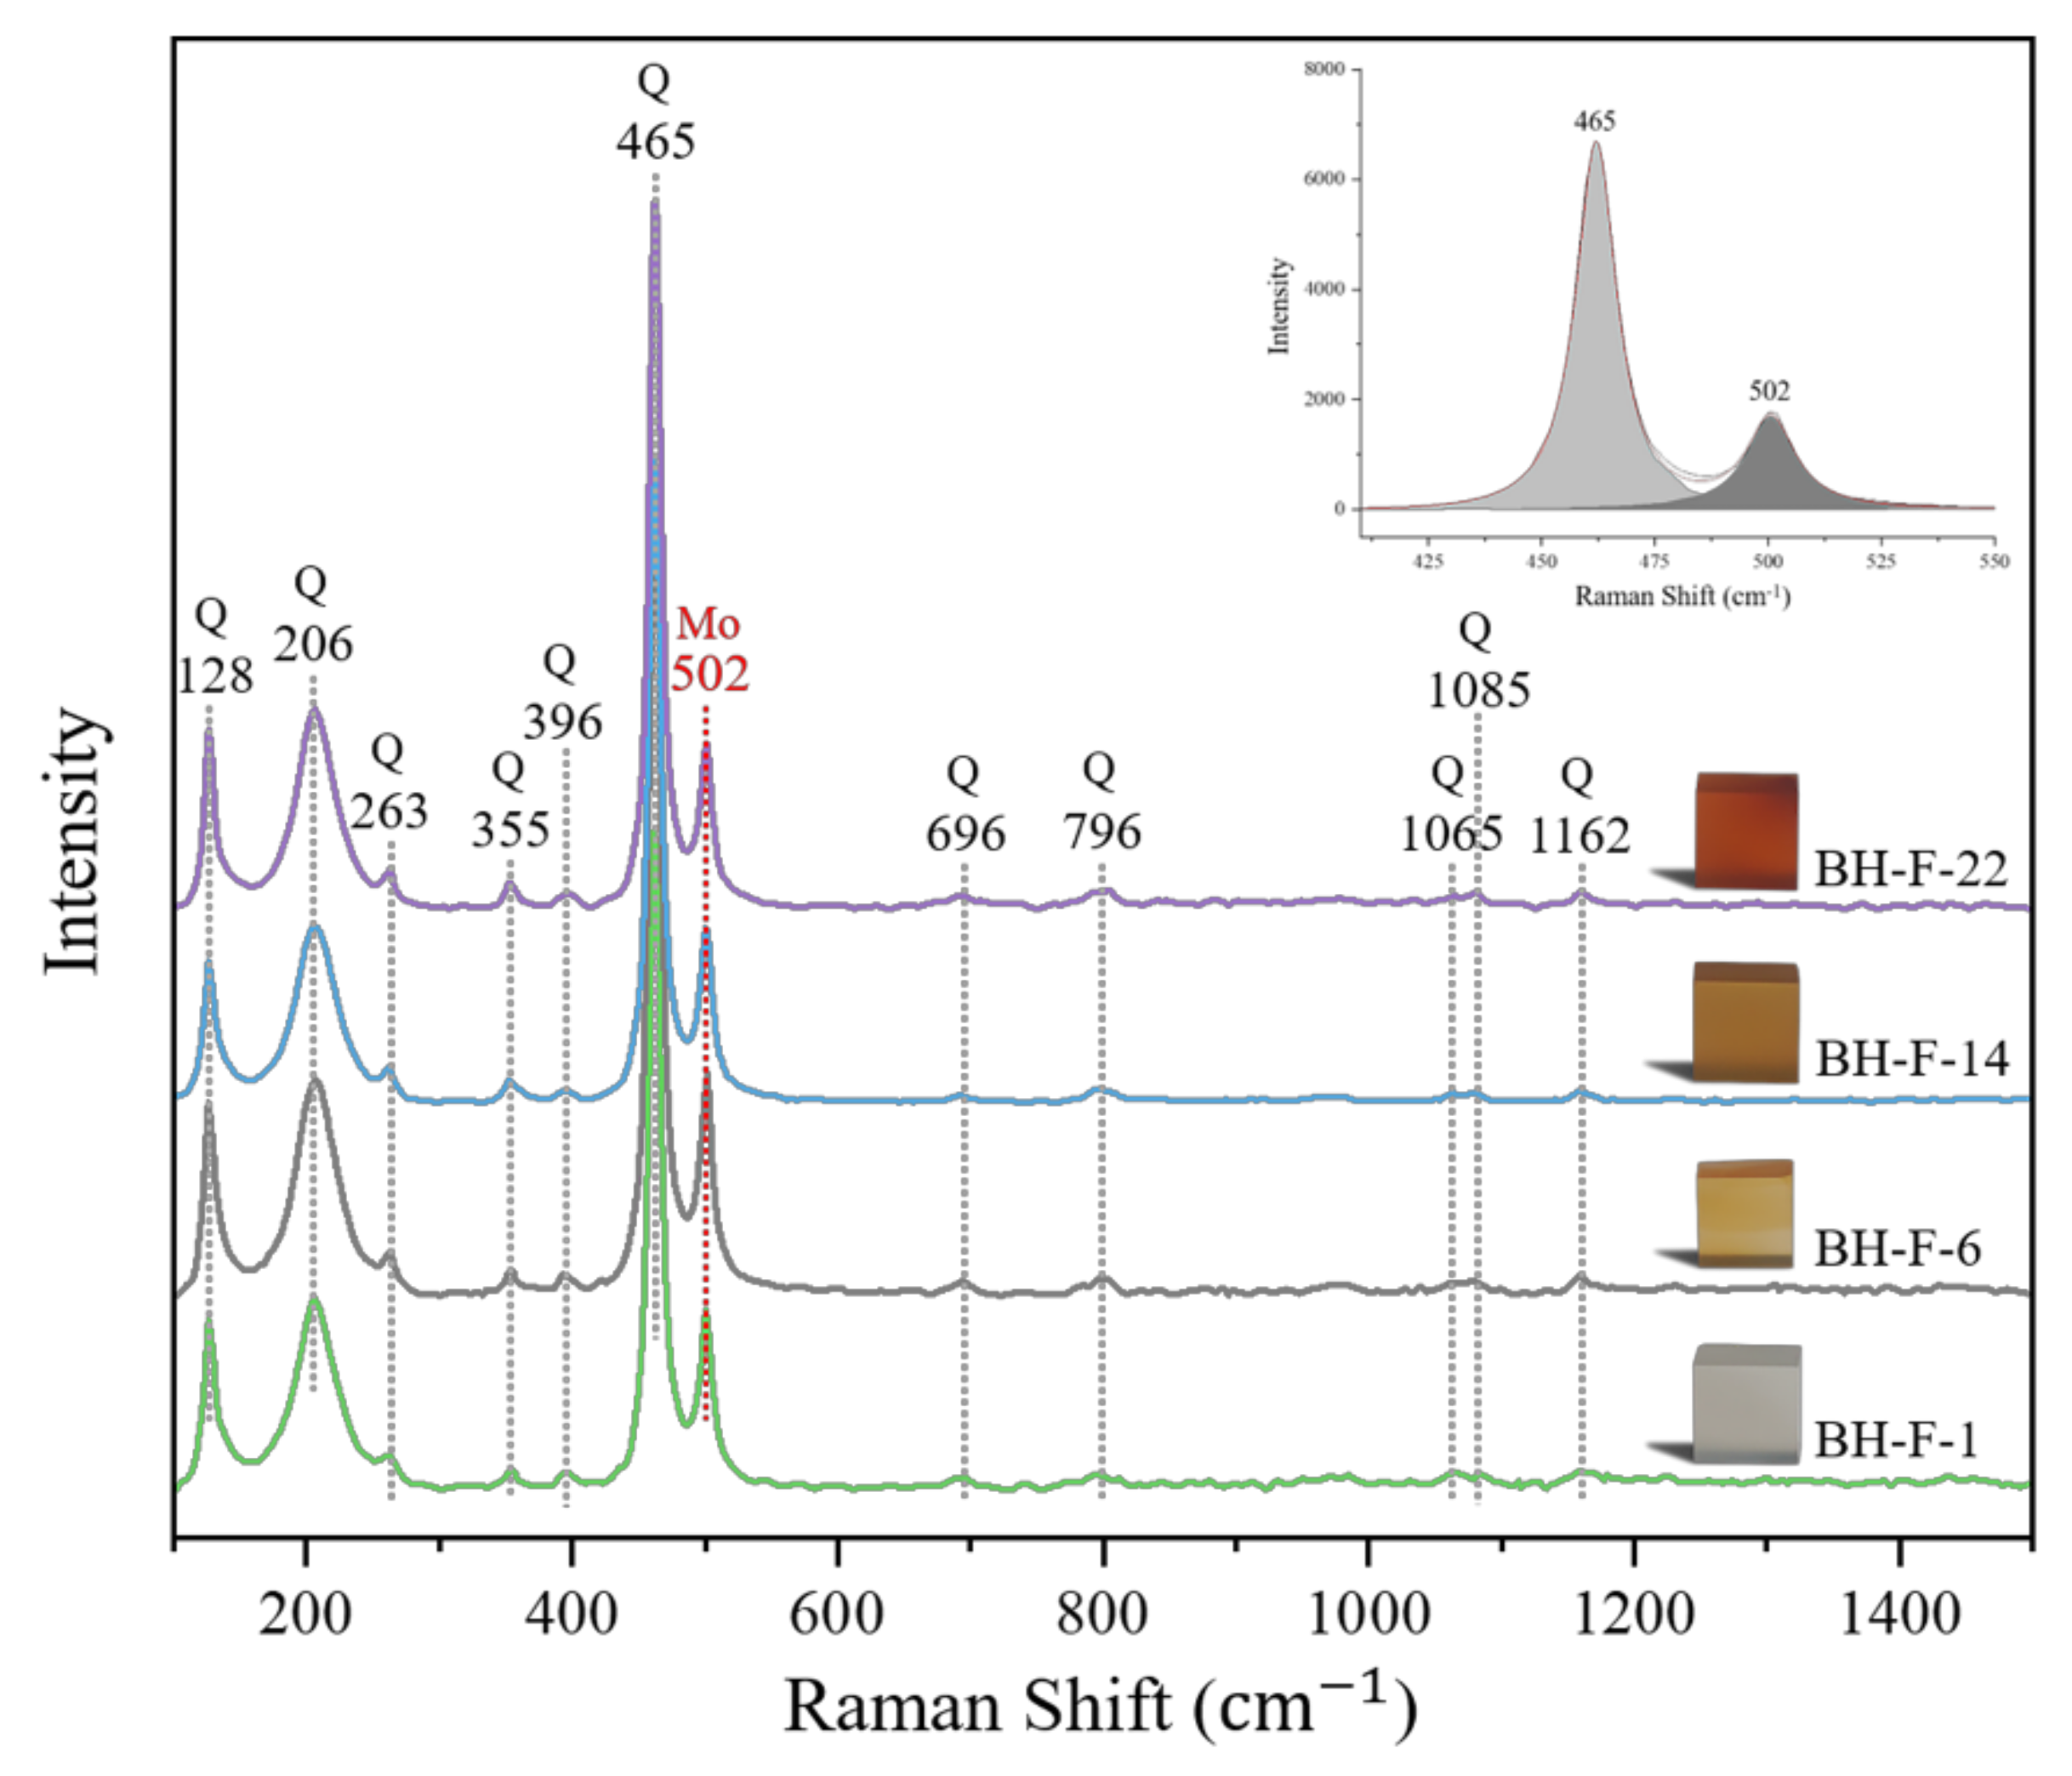
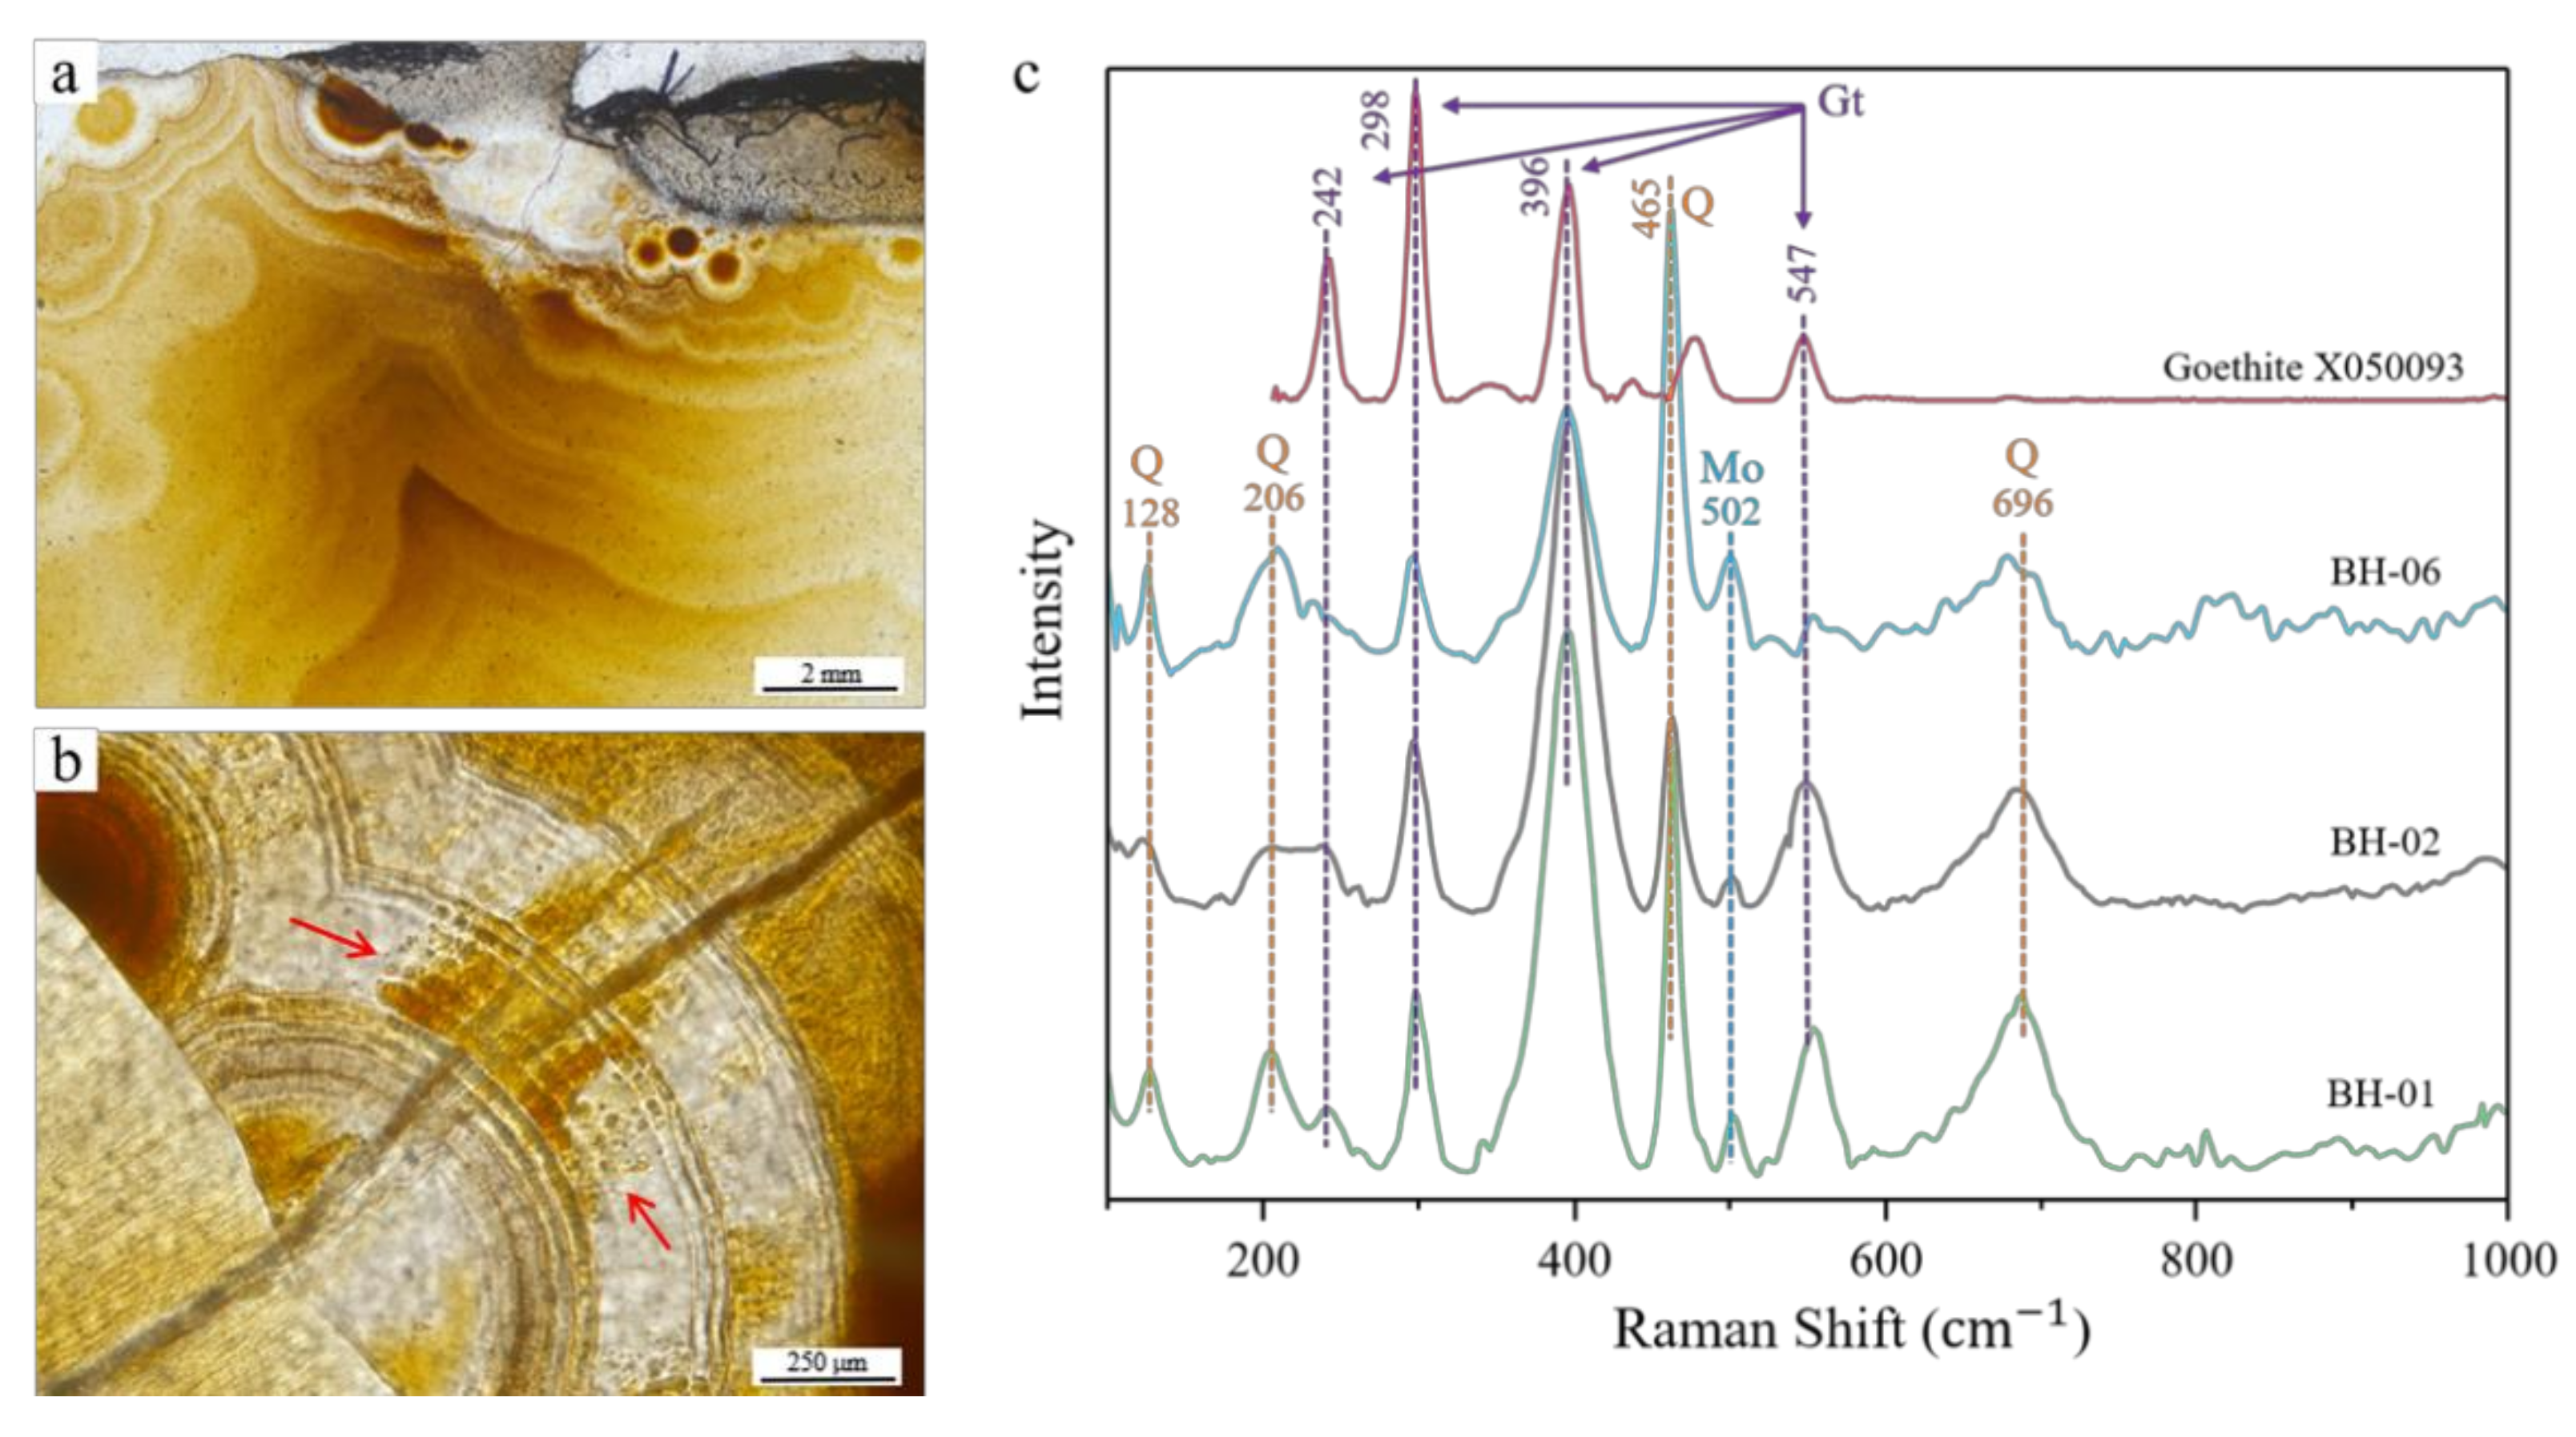
3.3. Raman Spectroscopic Analysis

3.3.1. Silica Matrix

The Raman spectra of twenty-four Beihong agate samples are almost the same, showing the peak positions of α-quartz and moganite, indicating that the silica matrix of Beihong agate consists of α-quartz and moganite (Figure 4). Marker bands were assigned for the silica phases (i.e., α-quartz and moganite) and are listed in Table 1.
As a homomorphic variant of quartz, moganite is often symbiotic with polycrystalline quartz [24]. Götze et al. [36] established a relative Raman calibration model for calculating the content of moganite in a sample using α-quartz as the internal standard. The moganite content can be calculated by substituting the Raman band integral ratio I502/I465 into the function fitting curve. Herein, the moganite contents of the samples in the silica matrix were evaluated by fitting the Raman band integral ratio I502/I465 and then substituted into the model. The results show that the Raman band integral ratio I502/I465 in this experiment ranges from 0.26 to 0.36, and the moganite weight percentage [wt%] is between 58.7 to 65.8 (Figure 5). The test data are shown in Table S3. It is found that both the integral ratio I502/I465 and the moganite content of Beihong agates are relatively higher than those of agates from other origins [5,24,35,37]. The formation of moganite can be attributed to the high structural defects generated by rapid silica growth from a strongly supersaturated solution [38,39,40], and a high concentration of moganite indicates the evaporitic origin [41]. According to previous studies, moganite is thermodynamically less stable [42]. It seems that with time (over millions of years), moganite diagenetically alters to quartzine [41] or in the presence of water (e.g., hydrothermal activity and weathering) [37,43,44].

3.3.2. Ferruginous Inclusions

The ferruginous inclusions are found to be mixtures of goethite, α-quartz and moganite (Figure 6). The bands at 128, 206, 465, 502, and 696 cm−1 come from the silica phases. The spectrum of goethite is evidenced by bands at 242, 298, 396, and 547 cm−1 [5,45]. The spectrum of goethite consists of two strong bands at 298 cm−1 (Fe-OH symmetric bending vibrations) and 396 cm−1 (Fe-O-Fe/-OH symmetric stretching vibrations) [46,47], and the band at 547 cm−1 originate from Fe-OH asymmetric stretching vibrations [47].

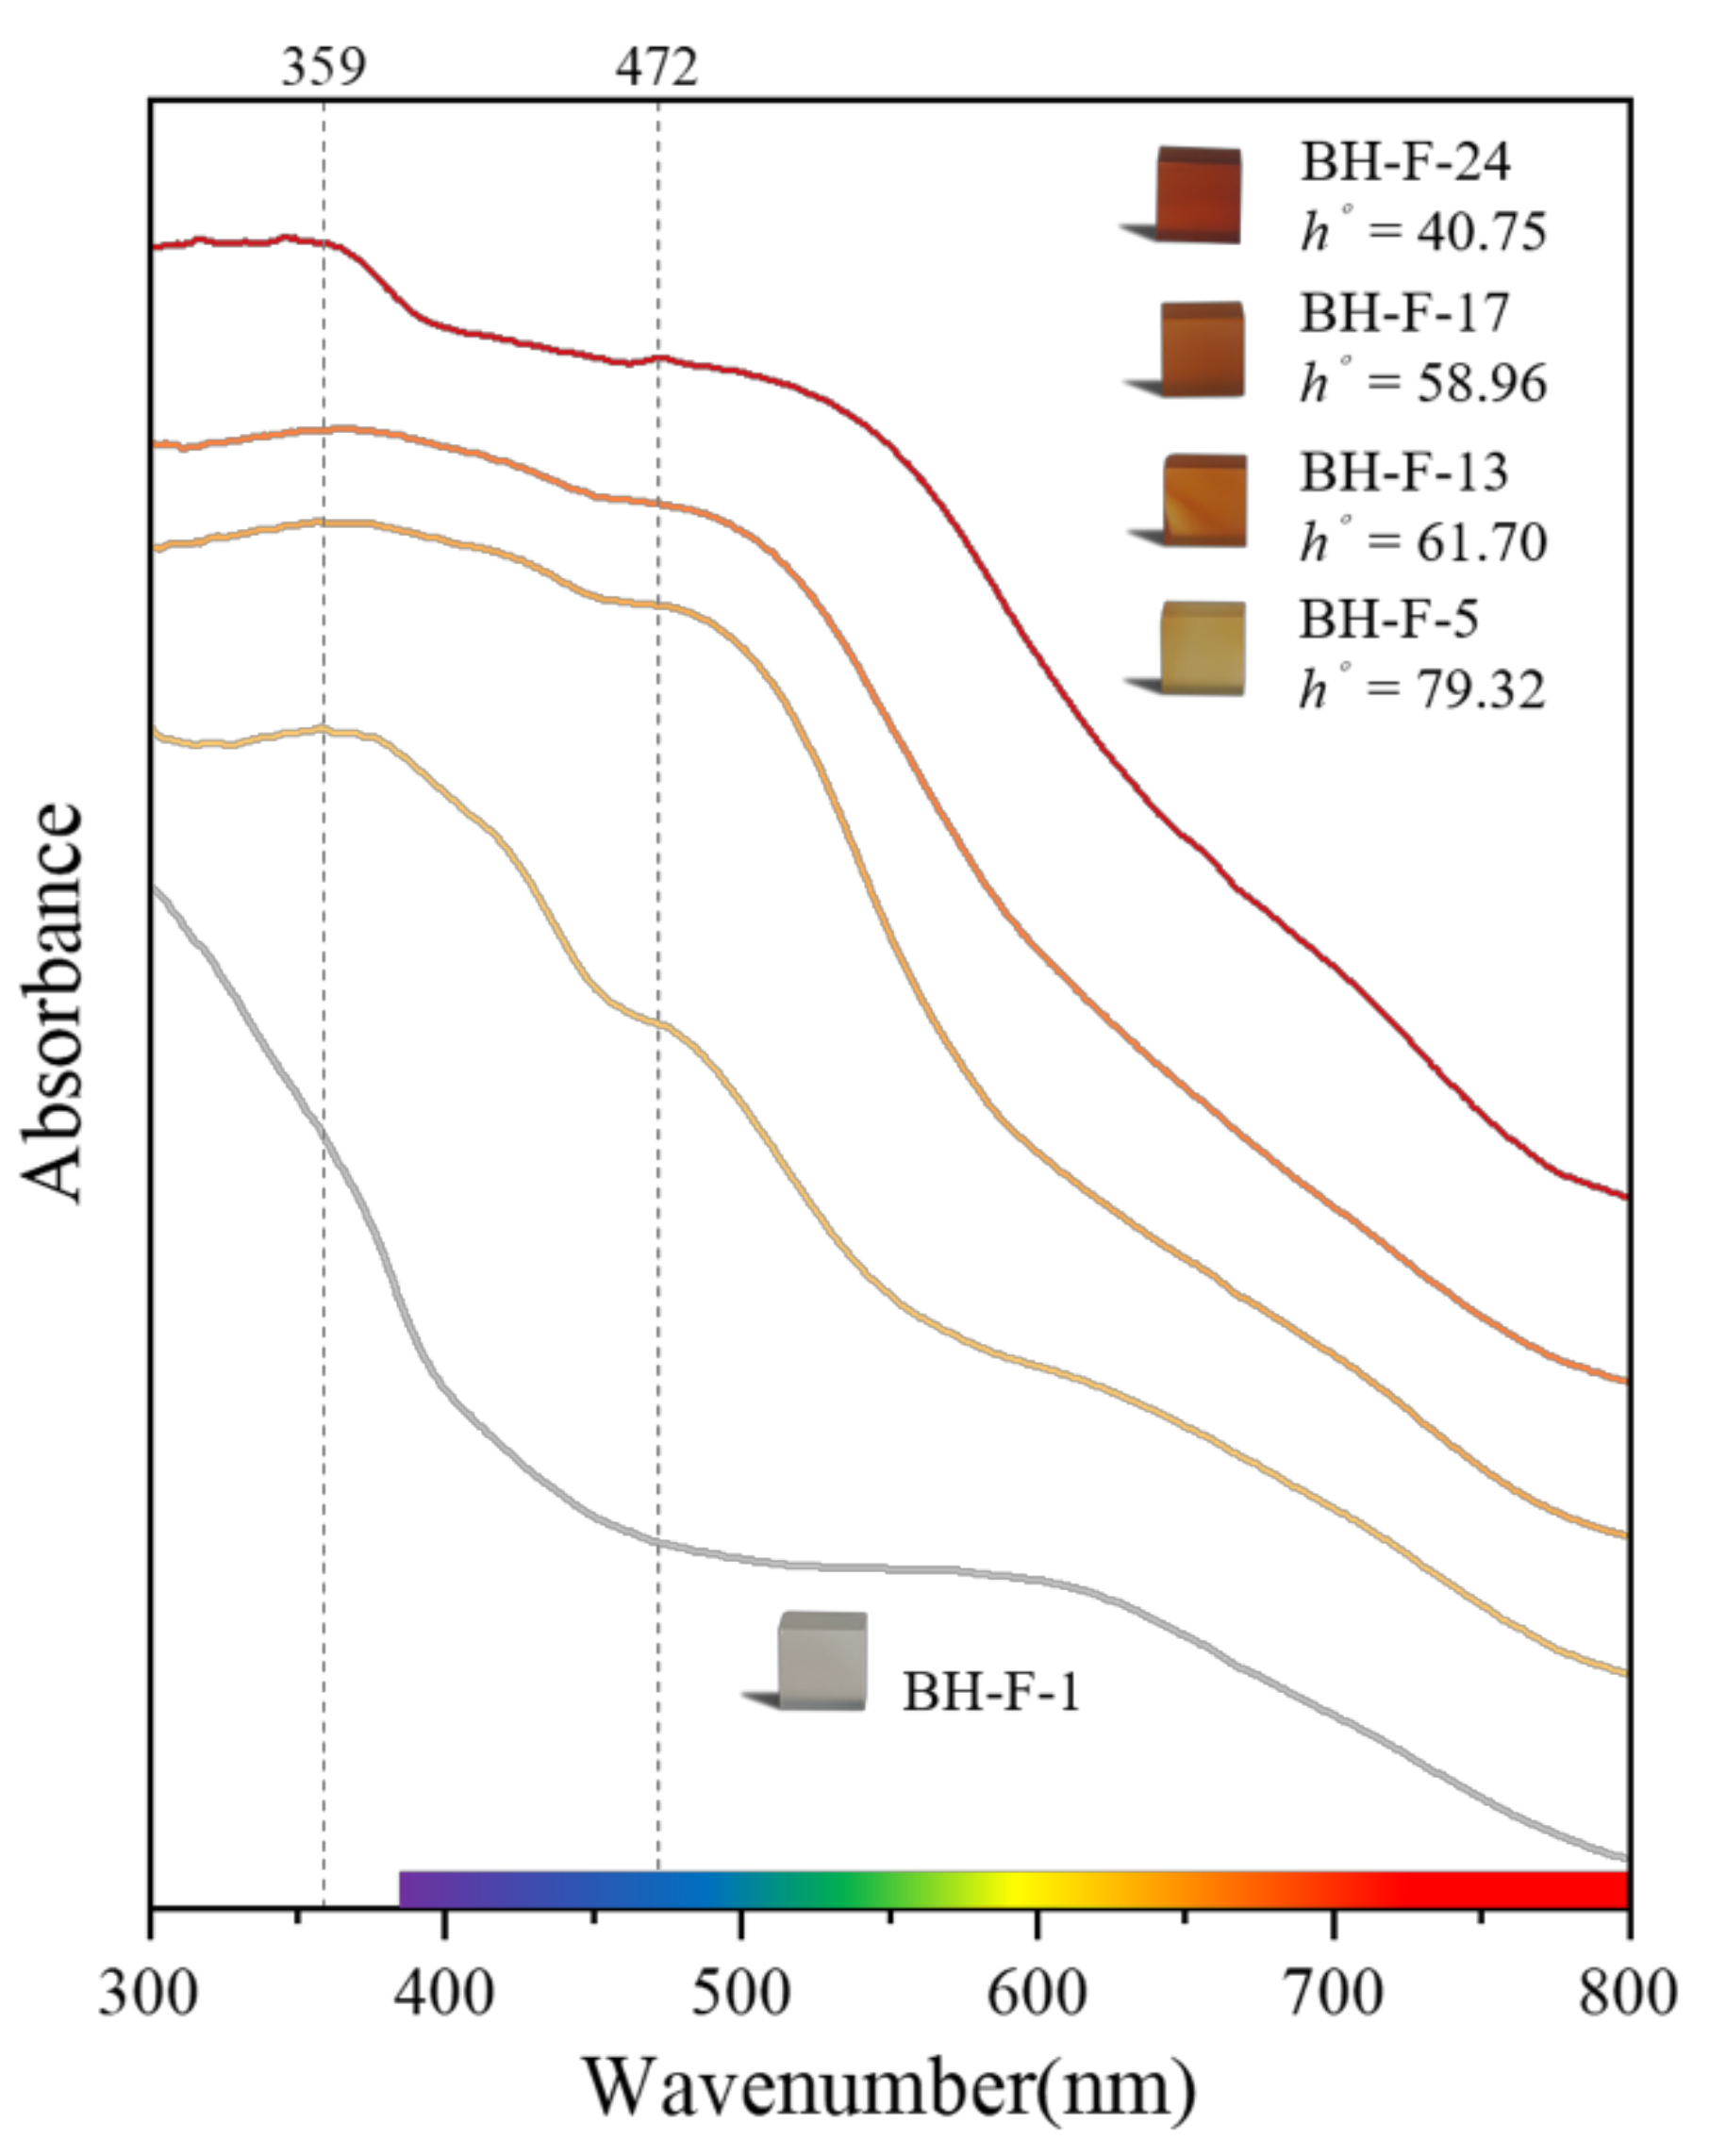
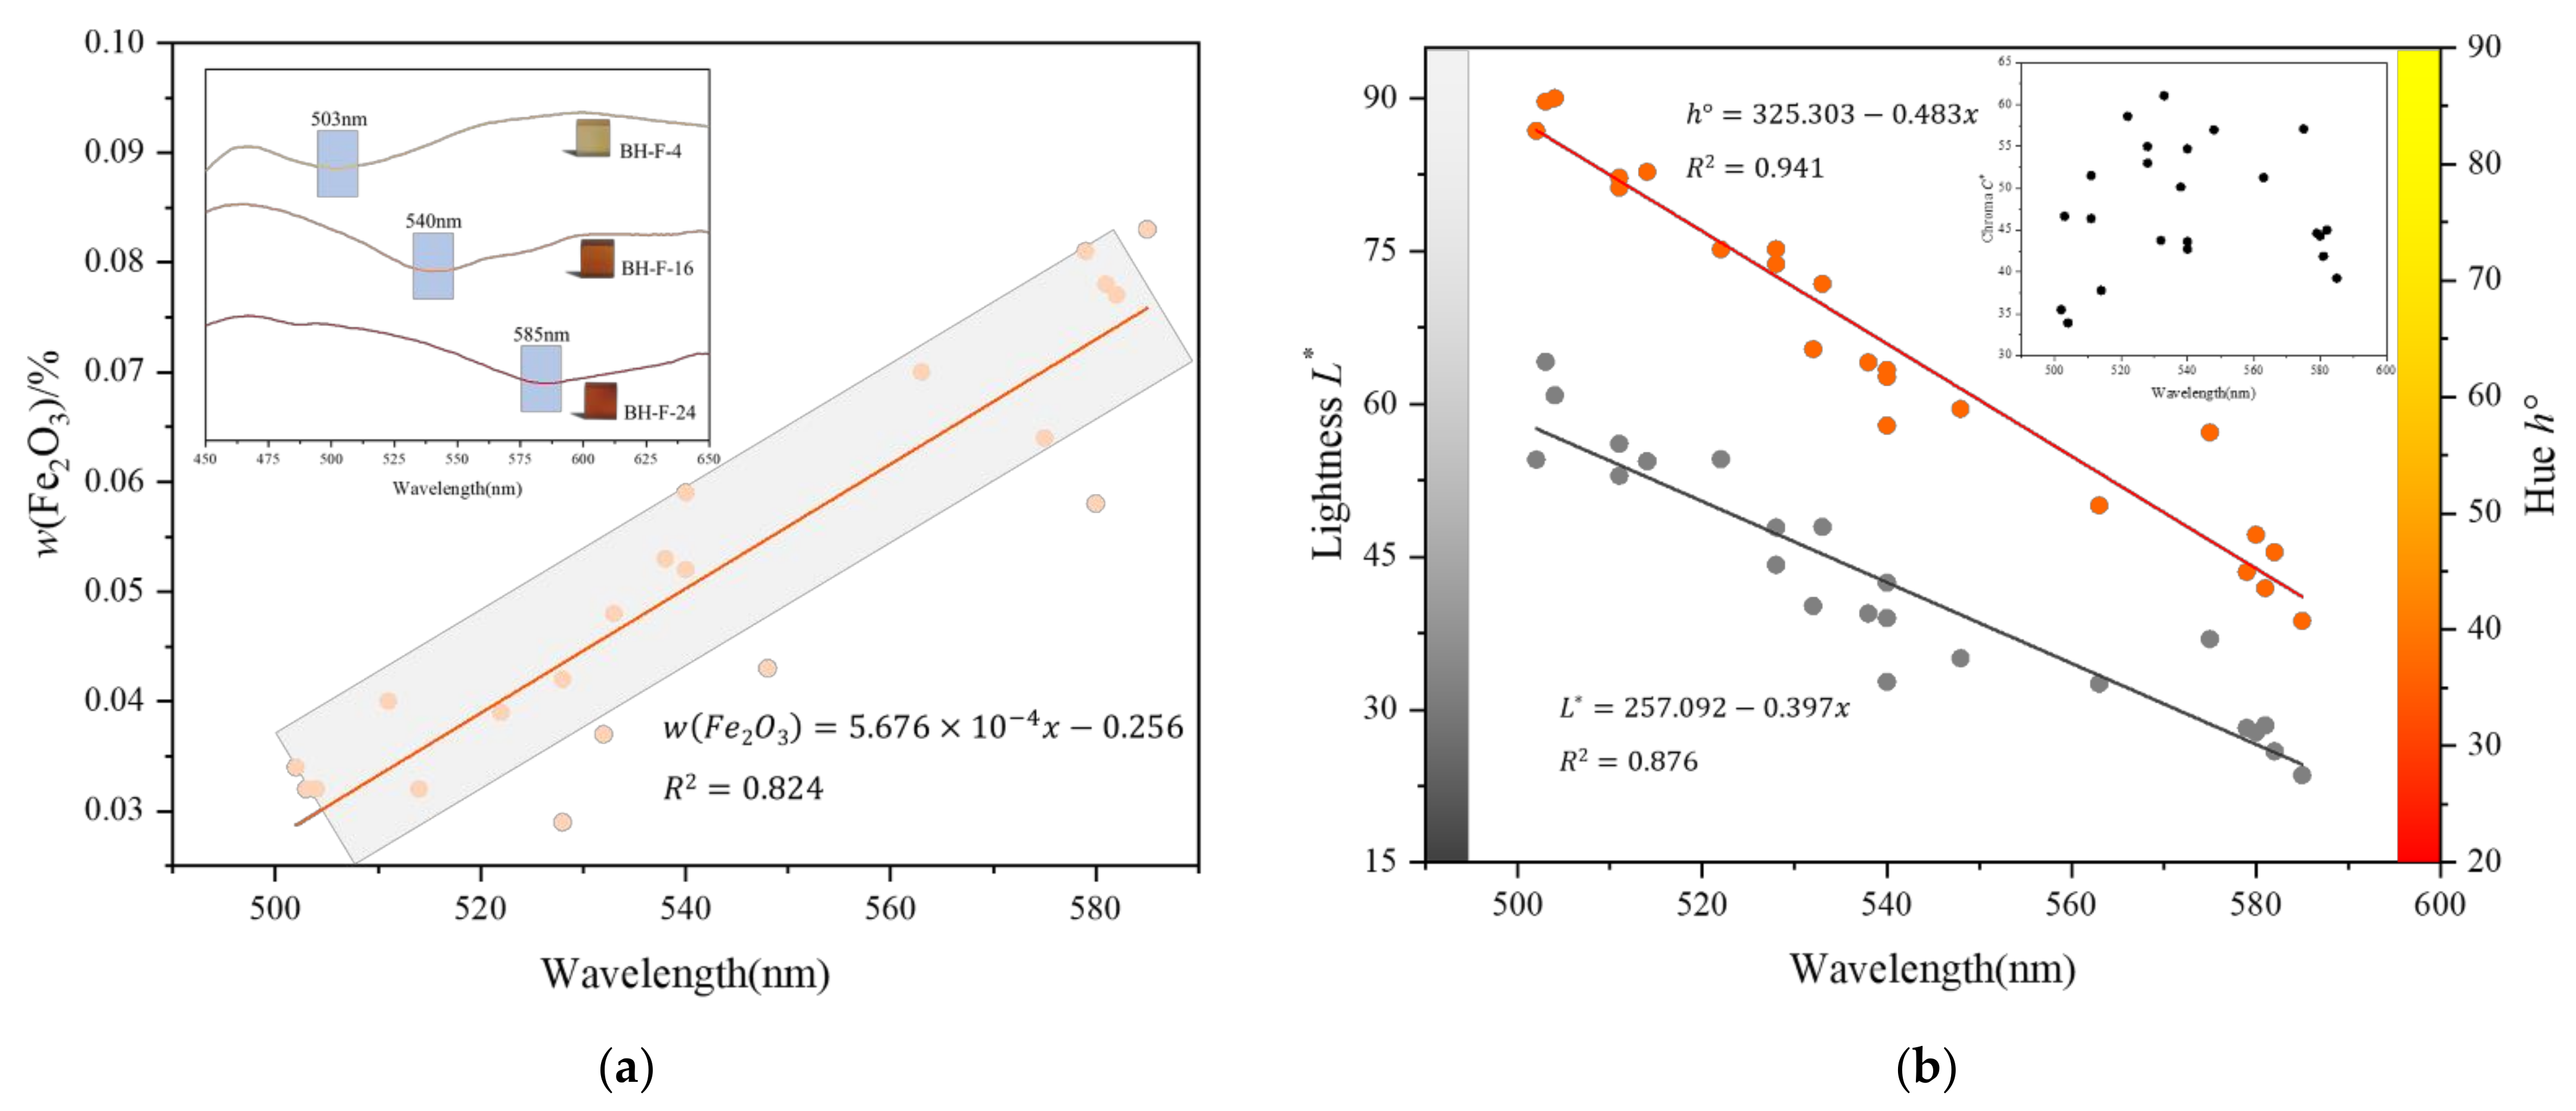
3.4. UV-VIS Spectral Analysis

The UV-VIS spectra of four typical Beihong agates and one control sample are shown in Figure 7. Four coloured samples show, essentially, a common shape of the absorption spectrum. The spectrum has a strong and broad absorption band in the ultraviolet and violet-blue regions, and the absorbance decreases rapidly near the blue-green region and gradually stabilises near the yellow region. That is, Beihong agate strongly absorbs violet and part blue of the visible light, while the rest parts of the visible light are passed through and thus presents a yellow colour on the appearance. These spectra are consistent with the presence of Fe3+ ions. The band near 359 nm corresponds to the 6A1 4E ligand field transition. The shoulder near 472 nm corresponds to the 2(6A1) 2(4T1)(4G) transition of Fe3+ [11], which is responsible for the hue of orange. When the shoulder peak at 472 nm gradually increases, the broad absorption band in the violet-blue region gradually widen to the green region, with the hue angle decreasing and shifting to orange-red. In contrast, the control sample (BH-F-1) does not show the absorption spectrum of Fe3+ ions, with weak absorption in the visible region, resulting in a nearly colourless colour.

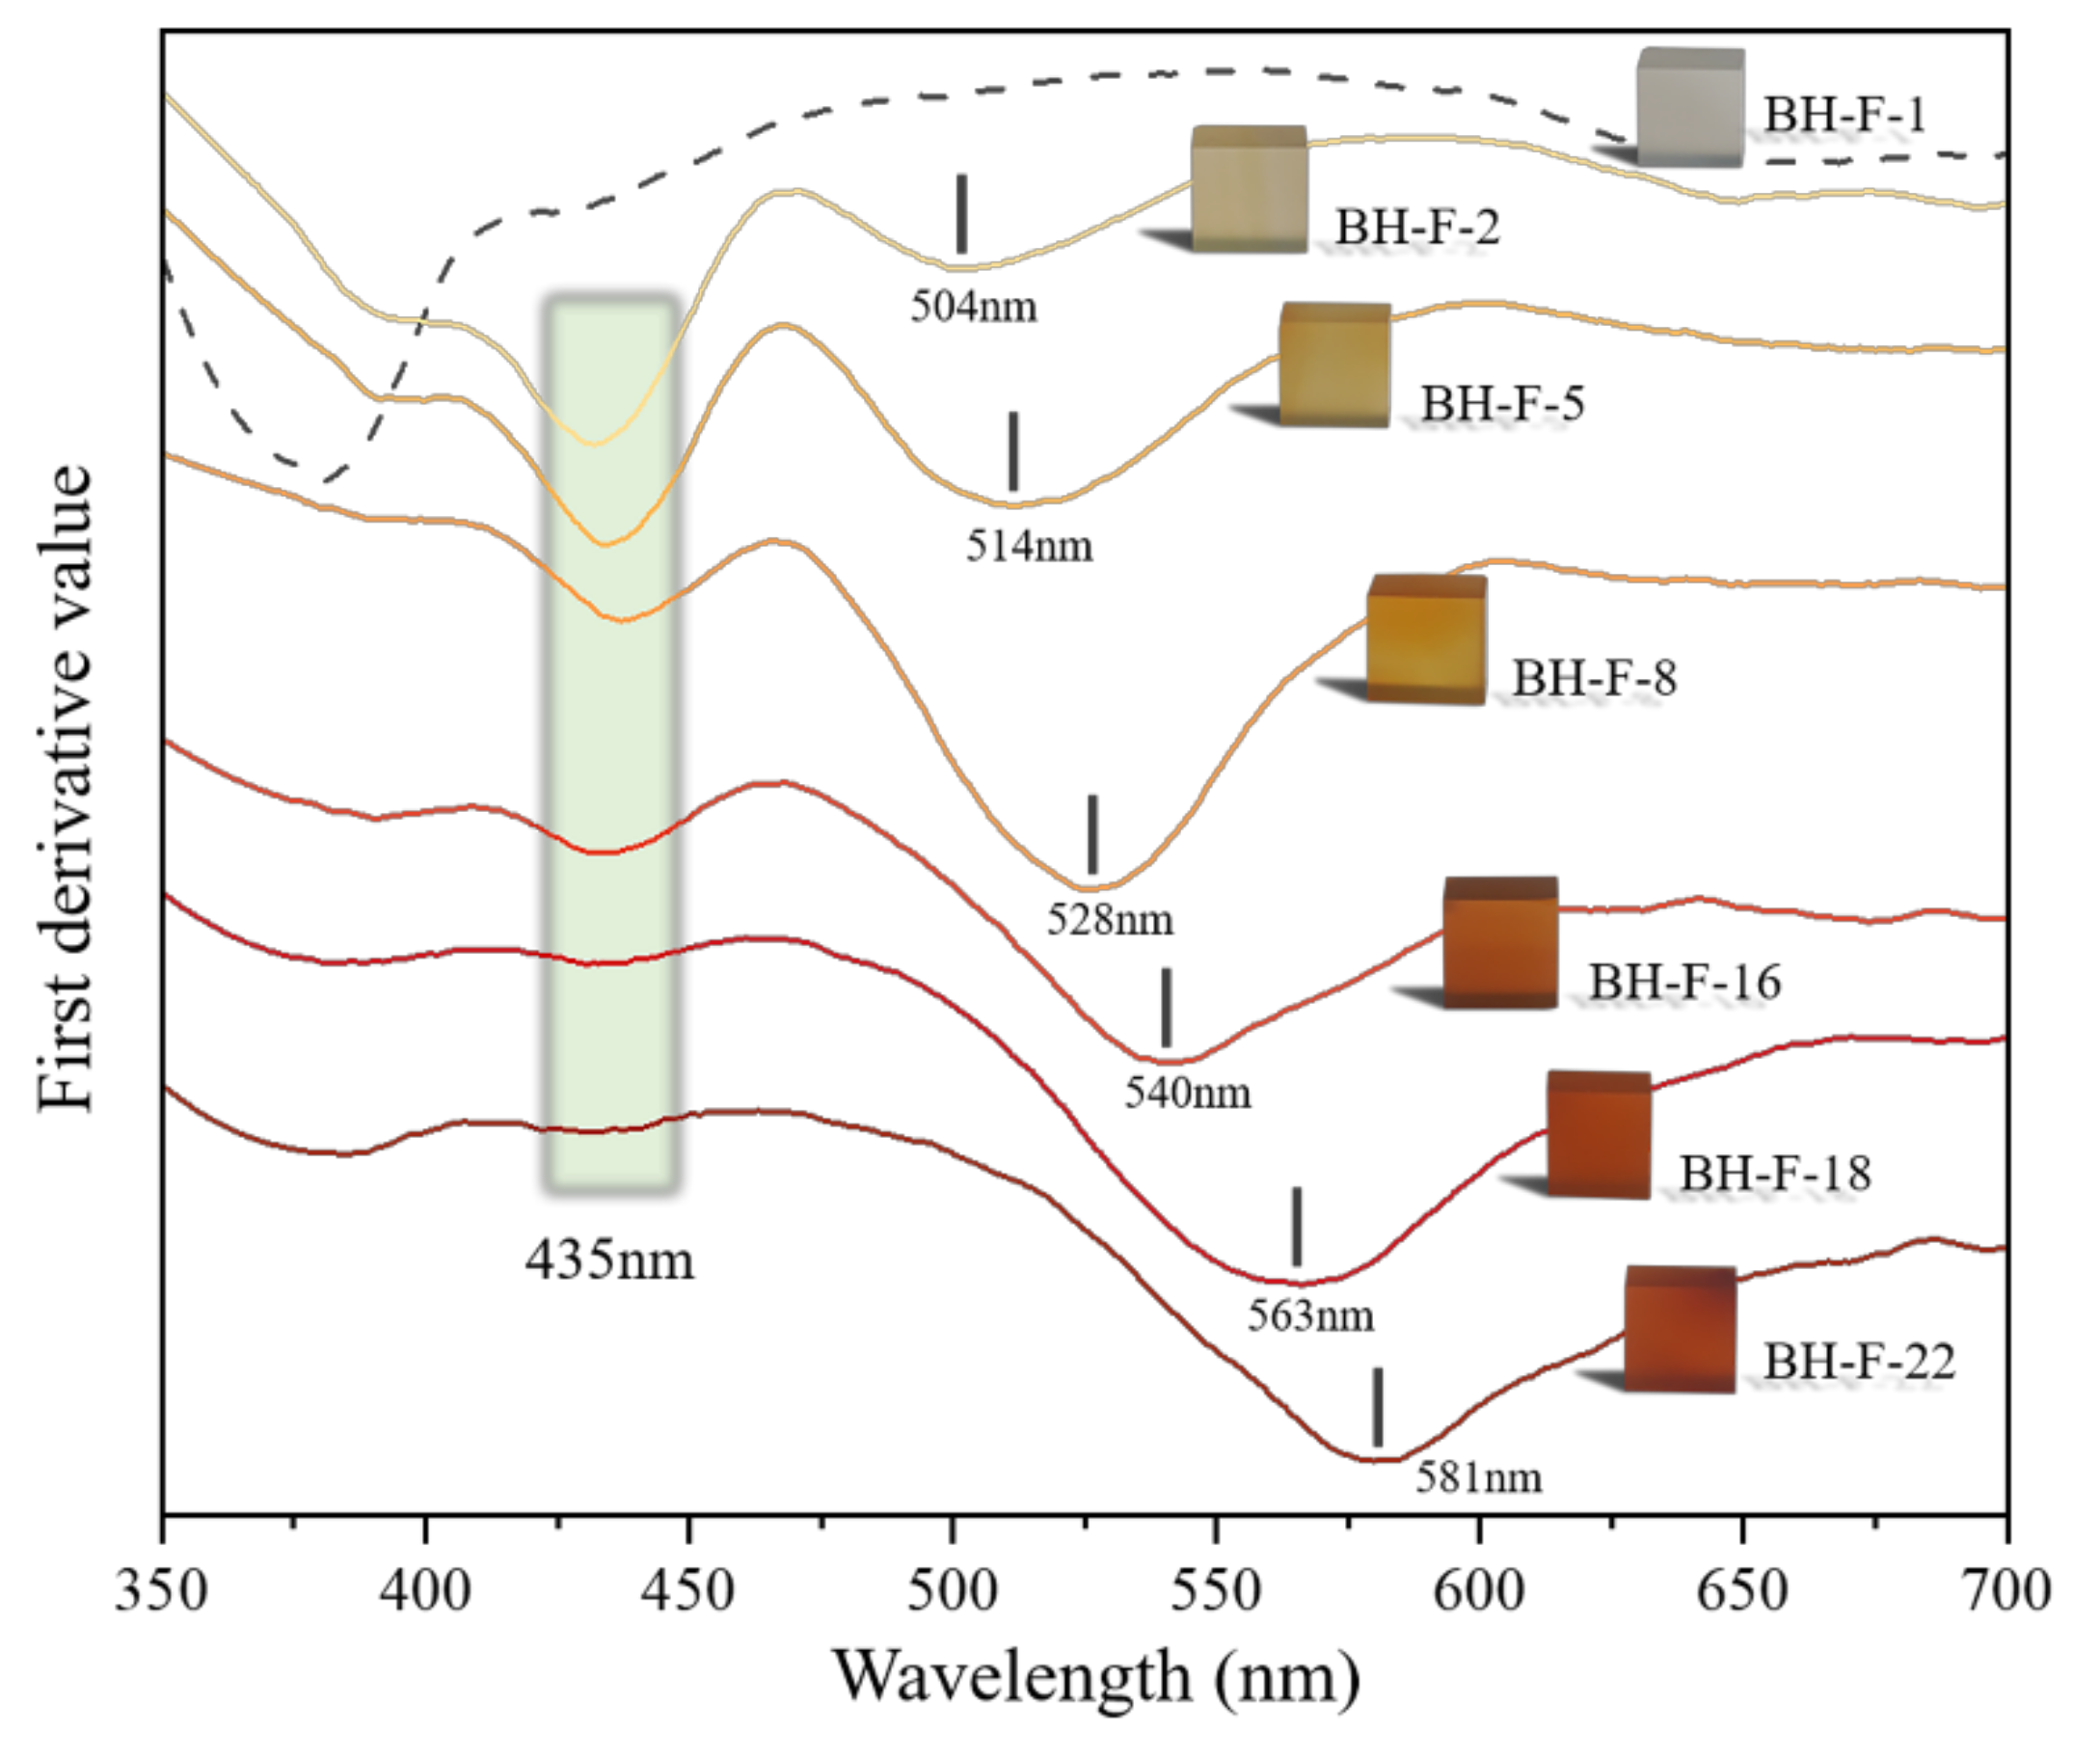
3.4.1. First Derivative Characteristics of UV-VIS Spectra

Take the first derivative of the twenty-four samples from 350–700 nm in the UV-VIS spectra. The results of several typical samples are shown in Figure 8. The spectra range from 400 to 600 nm, except for the nearly colourless control sample (BH-F-1), which does not show two troughs; most of the other samples show two troughs. The position of the second trough (some samples are primary trough) is stable at 435 nm, but the position of the primary trough varies from 502 nm to 585 nm. As the samples become darker and redder, the trough value at 435 nm increases, and the curve becomes flat and even harder to distinguish on the curves of samples from BH-F-18 to BH-F-24, while the primary trough position at 502–585 nm gradually shifts to the long-wave direction.
According to earlier studies, hematite displays a single prominent peak in the first derivative curve, which ranges from 555 nm to 575 nm. The height of the peak increases, and the position shifts to the long-wave direction as hematite concentration increases. Goethite displays two peaks, with the primary one at 535 nm and the secondary peak at 435 nm. With the increase in concentration, the primary peak of goethite has the same change as hematite, while the secondary peak only increases in height without an obvious change in the position [33,34,48,49]. In practice, the 435 nm peak is a better indicator of goethite because the 535 nm peak is frequently obscured by hematite [50,51]. Therefore, the colour of yellow Beihong agates is mainly caused by goethite, and that of red Beihong agates is hematite. The colour of orange Beihong agate is caused both by goethite and hematite. The results are consistent with the characteristic colours of the two minerals studied by scholars [29,52,53,54].
We analysed the relationships between the position of the primary trough within the range of 500–600 nm in the first derivative curves of 24 samples and the total Fe content and colour parameters of the samples, respectively, as shown in Figure 9. The test data are shown in Table S4.
There is a high positive correlation between the position of the primary trough and the total Fe content (Pearson’s r = 0.917, R2 = 0.824), while there is a high negative correlation between the position and the lightness and hue angle of Beihong agates (Lightness: Pearson’s r = −0.939, R2 = 0.876; Hue angle: Pearson’s r = −0.972, R2 = 0.941). Among these three correlation studies, Pearson correlation coefficient r between the position and the hue angle is the highest, indicating that the change of the position of the primary trough can directly reflect the change of hue, which is speculated can be used to predict the hue of Beihong agate.
On the one hand, the hue of Beihong agate is determined by the total Fe content. As the conclusion of the XRF measurement (Figure 3b), the higher the total Fe content, the smaller the hue angle of Beihong agate. Thus, the total Fe content also has a high correlation with the position of the primary trough, but the correlation is not so high. It is speculated that the relative contents of goethite and hematite are different, which is another determinant of the hue of Beihong agate. When the total Fe content is similar, but the relative contents of goethite and hematite are different, it will result in different hues of Beihong agates from yellow to red. Because yellow has a higher lightness, the lightness of Beihong agate is directly affected by the change of total iron oxide content and indirectly affected by the relative content of goethite and hematite.

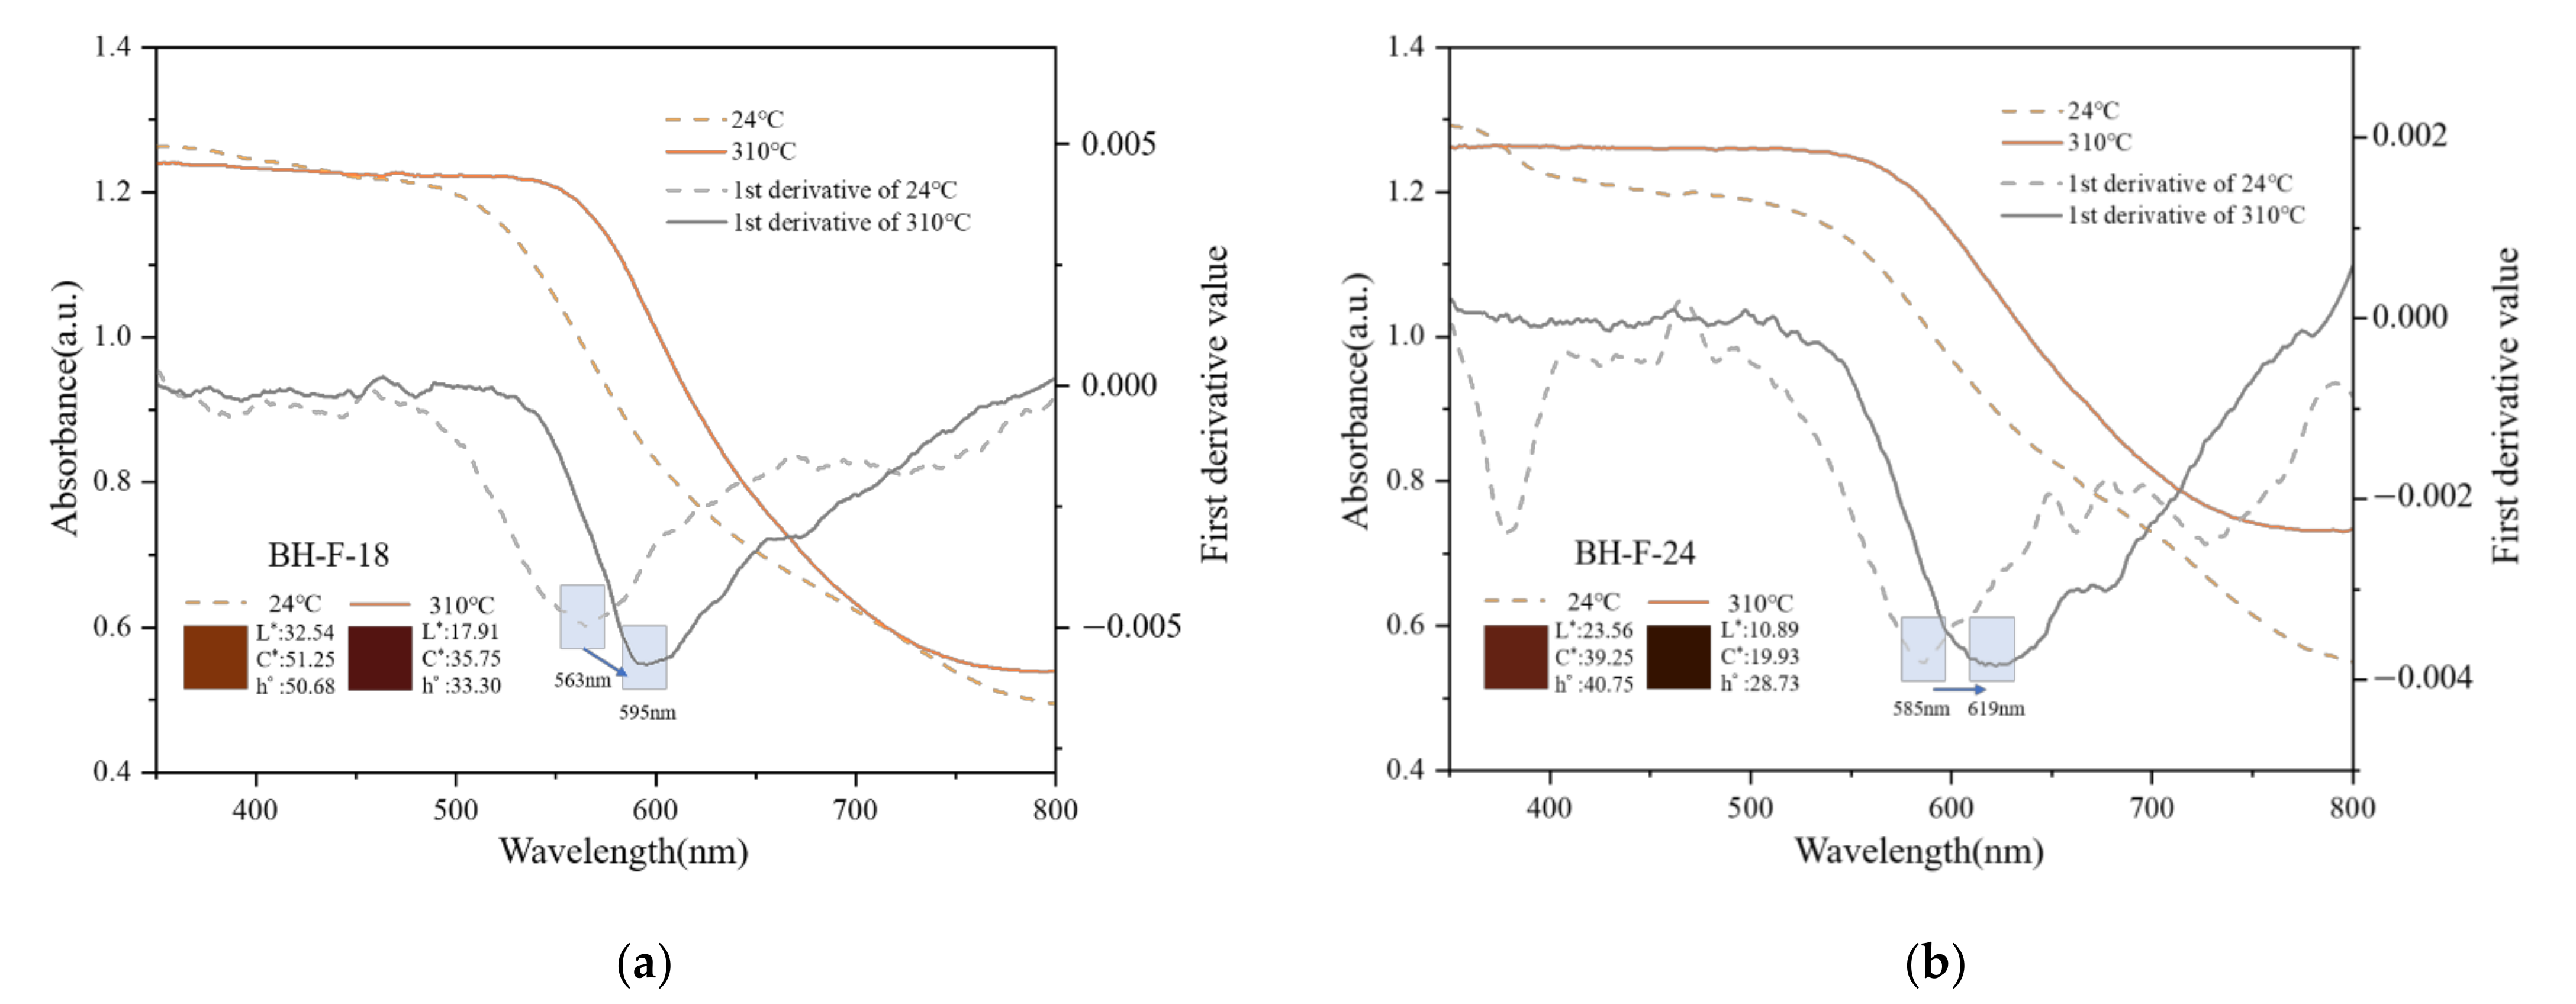
3.4.2. Heat Treatment

Because the hematite has a higher colour rendering property, it is easy to cover the signal of goethite [55]. Therefore, it is difficult to distinguish the existence of goethite from a single first derivative curve of red Beihong agate with hematite as the main colour causing mineral. Goethite will dehydrate into hematite after heat treatment at 230 °C [9,56]. If there is only hematite, the characteristic of the primary trough in the first derivative curve does not change after heat treatment [57]. Therefore, the existence of goethite can be judged by the change of the first derivative curve before and after heat treatment.
In this study, 24 samples were heat-treated at different temperatures (up to 310 °C). The comparison between samples at 310   and initial room temperature is shown in Figure 10, and Figure 11 shows the UV-VIS spectra and the first derivative curves of several typical samples before and after heat treatment. The test data for the colour parameters and colour differences before and after heat treatment are shown in Table S5. After heat treatment, the broad absorption band in the violet-blue region widens along the long wave direction, as well as the primary trough within the range of 500–600 nm shifts to the long-wave direction. The position of the primary trough even reached 619 nm. Hence the conclusion can be drawn that the red Beihong agate contains not only hematite but also a certain amount of goethite. Because the hematite has a higher colour rendering property, its red colour covers the yellow of goethite, so the colour of red Beihong agate is mainly influenced by hematite.

4. Conclusions

Based on the CIE 1976 L*a*b* uniform colour space, the colour of Beihong agate was measured. There is a high positive correlation between the lightness L* and the hue angle h ° . The chroma is mainly controlled by colour coordinate b*, and the hue is mainly controlled by colour coordinate a*.
Beihong agate is mainly composed of α-quartz and high content of moganite, with a minor amount of goethite and hematite responsible for its colour. There is a high negative correlation between the total Fe content and the lightness L* and the hue angle h ° . As the total Fe content increases, the colour of Beihong agate changes from yellow to orange-red. The shoulder peak near 472 nm was caused by Fe3+, which is responsible for the hue of orange. The first derivative curve can effectively distinguish the relative contents of goethite and hematite in Beihong agate. The position of the primary trough within 500–600 nm has a high correlation with the total Fe content, while there is a high negative correlation with the lightness L* and the hue angle h ° . When the position of the primary trough shifts to the long-wave direction in the range of 502–585 nm, the total Fe content increases and the colour of Beihong agate changes from light yellow to dark red. It is speculated that the position of the primary trough can be used to predict the hue of Beihong agate.
The colour of yellow Beihong agate is caused by a small amount of goethite. The colour of orange Beihong agate is caused by a combination of goethite and hematite, and the relative content of goethite is highest among different colours of Beihong agates. Red Beihong agates contain large amounts of goethite and hematite, but the relative content of hematite is higher than that of orange Beihong agate; thus, the colour mainly arises from hematite.

Supplementary Materials

The following supporting information can be downloaded at: https://www.mdpi.com/article/10.3390/min12060677/s1. Table S1: The colour parameters of twenty-four samples. Table S2: The results of XRF (wt%). Table S3: Moganite content and Raman band integral ratio I502/I465 in samples with different total Fe contents and hue angles. Table S4: Relationships between the position of the primary trough within the range of 500–600 nm and the total Fe content and colour parameters. Table S5: Colour parameters and colour differences before and after heat treatment.

Author Contributions

Conceptualization, Y.Z. and Y.G.; methodology, Y.Z.; validation, Y.Z., Z.L. and Z.Z.; formal analysis, Y.Z.; investigation, Y.Z.; resources, Y.Z.; data curation, Y.Z.; writing—original draft preparation, Y.Z., Z.L. and Z.Z.; writing—review and editing, Y.Z., Z.L. and Z.Z.; visualization, Y.Z.; supervision, Y.G.; project administration, Y.Z. All authors have read and agreed to the published version of the manuscript.

Funding

This research received no external funding.

Institutional Review Board Statement

Not applicable.

Informed Consent Statement

Not applicable.

Data Availability Statement

All data are contained within the article and Supplementary Tables.

Acknowledgments

The experiments in this research were conducted in the Gemological Institute Laboratory and the Hydrogeochemistry Laboratory, China University of Geosciences, Beijing. We would like to thank Jianyi Jin, Yuansheng Jiang, and Yuanya Lian for kind help in our experiments.

Conflicts of Interest

The authors declare no conflict of interest.

References

  1. Florke, O.W.; Kohlerherbertz, B.; Langer, K.; Tonges, I. Water in Microcrystalline Quartz of Volcanic Origin—Agates. Contrib. Miner. Petrol. 1982, 80, 324–333. [Google Scholar] [CrossRef]
  2. Moxon, T. A re-examination of water in agate and its bearing on the agate genesis enigma. Mineral. Mag. 2018, 81, 1223–1244. [Google Scholar] [CrossRef]
  3. Götze, J.; Möckel, R.; Pan, Y. Mineralogy, Geochemistry and Genesis of Agate—A Review. Minerals 2020, 10, 1037. [Google Scholar] [CrossRef]
  4. Saminpanya, S.; Saiyasombat, C.; Chanlek, N.; Thammajak, N.; Sirisurawong, E.; Viriyasunsakun, R.; Kingkanlaya, P.; Rakponramuang, P. Trace elements content and cause of color in ancient treated carnelian and its natural counterpart from SE Asia. Archaeol. Anthropol. Sci. 2020, 12, 1–11. [Google Scholar] [CrossRef]
  5. Zhang, X.; Ji, L.; He, X. Gemological Characteristics and Origin of the Zhanguohong Agate from Beipiao, Liaoning Province, China: A Combined Microscopic, X-ray Diffraction, and Raman Spectroscopic Study. Minerals 2020, 10, 401. [Google Scholar] [CrossRef]
  6. Zhou, D.; Shi, G.; Liu, S.; Wu, B. Mineralogy and Magnetic Behavior of Yellow to Red Xuanhua-Type Agate and Its Indication to the Forming Condition. Minerals 2021, 11, 877. [Google Scholar] [CrossRef]
  7. Götze, J.; Möckel, R.; Vennemann, T.; Müller, A. Origin and geochemistry of agates in Permian volcanic rocks of the Sub-Erzgebirge basin, Saxony (Germany). Chem. Geol. 2016, 428, 77–91. [Google Scholar] [CrossRef]
  8. Dumanska-Slowik, M.; Natkaniec-Nowak, L.; Weselucha-Birczynska, A.; Gawel, A.; Lankosz, M.; Wrobel, P. Agates from Sidi Rahal, in the Atlas Mountains of Morocco: Gemological Characteristics and Proposed Origin. Gems Gemol. 2013, 49, 148–159. [Google Scholar] [CrossRef]
  9. Ruan, H.D.; Frost, R.L.; Kloprogge, J.T. The behavior of hydroxyl units of synthetic goethite and its dehydroxylated product hematite. Spectrochim. Acta A 2001, 57, 2575–2586. [Google Scholar] [CrossRef]
  10. Lu, Z.; He, X.; Lin, C.; Jin, X.; Pan, Y. Identification of Beihong Agate and Nanhong Agate from China Based on Chromaticity and Raman Spectra. Spectrosc. Spectr. Anal. 2019, 39, 2153–2159. [Google Scholar] [CrossRef]
  11. Lu, Z.; He, X.; Guo, Q. Color and Genesis of Beihong Agate and Its Spectroscopic Characteristics. Spectrosc. Spectr. Anal. 2020, 40, 2531–2537. [Google Scholar] [CrossRef]
  12. King, J.M.; Moses, T.M.; Shigley, J.E.; Liu, Y. Color Grading of Colored Diamonds in the GIA Gem Trade Laboratory. Gems Gemol. 1994, 30, 220–242. [Google Scholar] [CrossRef]
  13. King, J.M.; Geurts, R.H.; Gilbertson, A.M.; Shigley, J.E. Color Grading “D-to-Z” Diamonds at the GIA Laboratory. Gems Gemol. 2008, 44, 296–321. [Google Scholar] [CrossRef]
  14. Qiu, Y.; Guo, Y. Explaining Colour Change in Pyrope-Spessartine Garnets. Minerals 2021, 11, 865. [Google Scholar] [CrossRef]
  15. Jiang, Y.; Guo, Y.; Zhou, Y.; Li, X.; Liu, S. The Effects of Munsell Neutral Grey Backgrounds on the Colour of Chrysoprase and the Application of AP Clustering to Chrysoprase Colour Grading. Minerals 2021, 11, 1092. [Google Scholar] [CrossRef]
  16. Zhang, S.; Guo, Y. Measurement of Gem Colour Using a Computer Vision System: A Case Study with Jadeite-Jade. Minerals 2021, 11, 791. [Google Scholar] [CrossRef]
  17. Liu, Z.; Guo, Y.; Shang, Y.; Yuan, B. Research on parameters optimization of digital imaging system in red-yellow jadeite color measurement. Sci. Rep. 2022, 12, 3619. [Google Scholar] [CrossRef]
  18. Liu, Z.; Guo, Y. The Effect of Munsell Neutral Value Scale on the Color of Yellow Jadeite and Comparison between AP and K-Means Clustering Color Grading Schemes. Crystals 2022, 12, 241. [Google Scholar] [CrossRef]
  19. Guo, Y.; Wang, H.; Du, H.M. The foundation of a color-chip evaluation system of jadeite-jade green with color difference control of medical device. Multimed. Tools Appl. 2016, 75, 14491–14502. [Google Scholar] [CrossRef]
  20. Dubinsky, E.V.; Stone-Sundberg, J.; Emmett, J.L. A Quantitative Description of the Causes of Color in Corundum. Gems Gemol. 2020, 56, 2–28. [Google Scholar] [CrossRef]
  21. Yuan, B.; Guo, Y.; Liu, Z. The influence of light path length on the color of synthetic ruby. Sci. Rep. 2022, 12, 5943. [Google Scholar] [CrossRef] [PubMed]
  22. Tang, J.; Guo, Y.; Xu, C. Color effect of light sources on peridot based on CIE1976L*a*b*color system androundRGB diagram system. Color Res. Appl. 2019, 44, 932–940. [Google Scholar] [CrossRef]
  23. Tang, J.; Guo, Y.; Xu, C. Metameric effects on peridot by changing background color. J. Opt. Soc. Am. A Opt. Image Sci. Vis. 2019, 36, 2030–2039. [Google Scholar] [CrossRef] [PubMed]
  24. Jiang, Y.; Guo, Y. Genesis and influencing factors of the colour of chrysoprase. Sci. Rep. 2021, 11, 9939. [Google Scholar] [CrossRef]
  25. Sun, Z.Y.; Palke, A.C.; Renfro, N. Vanadium- and Chromium-Bearing Pink Pyrope Garnet: Characterization and Quantitative Colorimetric Analysis. Gems Gemol. 2015, 51, 348–369. [Google Scholar] [CrossRef] [Green Version]
  26. Zhao, Z.; Guo, Y. Colour Quality Evaluation of Bluish-Green Serpentinite Based on the CIECAM16 Model. Minerals 2021, 12, 38. [Google Scholar] [CrossRef]
  27. Wang, X.; Guo, Y. The impact of trace metal cations and absorbed water on colour transition of turquoise. R. Soc. Open Sci. 2021, 8, 201110. [Google Scholar] [CrossRef]
  28. Cheng, R.; Guo, Y. Study on the effect of heat treatment on amethyst color and the cause of coloration. Sci. Rep. 2020, 10, 14927. [Google Scholar] [CrossRef]
  29. Nagano, T. The Use of Color to Quantify the Effects of pH and Temperature on the Crystallization Kinetics of Goethite Under Highly Alkaline Conditions. Clays Clay Miner. 1994, 42, 226–234. [Google Scholar] [CrossRef]
  30. Komadel, P.; Grygar, T.; Mehner, H. Reductive dissolution and Mossbauer spectroscopic study of Fe forms in the fine fractions of Slovak Fe-rich bentonites. Clay Min. 1998, 33, 593–599. [Google Scholar] [CrossRef]
  31. Poulton, S.W.; Canfield, D.E. Development of a sequential extraction procedure for iron: Implications for iron partitioning in continentally derived particulates. Chem. Geol. 2005, 214, 209–221. [Google Scholar] [CrossRef]
  32. Spinola, D.N.; Portes, R.d.C.; Srivastava, P.; Torrent, J.; Barrón, V.; Kühn, P. Diagenetic reddening of Early Eocene paleosols on King George Island, Antarctica. Geoderma 2018, 315, 149–159. [Google Scholar] [CrossRef]
  33. Deaton, B.C.; Balsam, W.L. Visible Spectroscopy—A Rapid Method for Determining Hematite and Goethite Concentration in Geological-Materials. J. Sediment. Pet. 1991, 61, 628–632. [Google Scholar] [CrossRef]
  34. Balsam, W.; Ji, J.; Renock, D.; Deaton, B.C.; Williams, E. Determining hematite content from NUV/Vis/NIR spectra: Limits of detection. Am. Mineral. 2014, 99, 2280–2291. [Google Scholar] [CrossRef]
  35. Kingma, K.J.; Hemley, R.J. Raman-Spectroscopic Study of Microcrystalline Silica. Am. Mineral. 1994, 79, 269–273. [Google Scholar]
  36. Gotze, J.; Nasdala, L.; Kleeberg, R.; Wenzel, N. Occurrence and distribution of “moganite” in agate/chalcedony: A combined micro-Raman, Rietveld, and cathodoluminescence study. Contrib. Miner. Petrol. 1998, 133, 96–105. [Google Scholar] [CrossRef]
  37. Heaney, P.J.; Post, J.E. The Widespread Distribution of a Novel Silica Polymorph in Microcrystalline Quartz Varieties. Science 1992, 255, 441–443. [Google Scholar] [CrossRef]
  38. Gotze, J.; Plotze, M.; Fuchs, H.; Habermann, D. Defect structure and luminescence behaviour of agate—Results of electron paramagnetic resonance (EPR) and cathodoluminescence (CL) studies. Mineral. Mag. 1999, 63, 149. [Google Scholar] [CrossRef]
  39. Hatipoglu, M.; Ajo, D.; Kirikoglu, M.S. Cathodoluminescence (CL) features of the Anatolian agates, hydrothermally deposited in different volcanic hosts from Turkey. J. Lumin. 2011, 131, 1131–1139. [Google Scholar] [CrossRef]
  40. French, M.W.; Worden, R.H.; Lee, D.R. Electron backscatter diffraction investigation of length-fast chalcedony in agate: Implications for agate genesis and growth mechanisms. Geofluids 2013, 13, 32–44. [Google Scholar] [CrossRef]
  41. Heaney, P.J. Moganite as an Indicator for Vanished Evaporites—A Testament Reborn. J. Sediment. Res. A 1995, 65, 633–638. [Google Scholar]
  42. Gislason, S.; Heaney, P.; Oelkers, E. Kinetic and thermodynamic properties of moganite, a novel silica polymorph. Geochim. Cosmochim. Acta 1997, 61, 1193–1204. [Google Scholar] [CrossRef]
  43. Rodgers, K.A.; Cressey, G. The occurrence, detection and significance of moganite (SiO2) among some silica sinters. Mineral. Mag. 2001, 65, 157–167. [Google Scholar] [CrossRef]
  44. Moxon, T.; Ríos, S. Moganite and water content as a function of age in agate: An XRD and thermogravimetric study. Eur. J. Mineral. 2004, 16, 269–278. [Google Scholar] [CrossRef]
  45. Oh, S.J.; Cook, D.C.; Townsend, H.E. Characterization of iron oxides commonly formed as corrosion products on steel. Hyperfine Interact. 1998, 112, 59–65. [Google Scholar] [CrossRef]
  46. Powolny, T.; Dumanska-Slowik, M.; Sikorska-Jaworowska, M.; Wojcik-Bania, M. Agate mineralization in spilitized Permian volcanics from “Borowno” quarry (Lower Silesia, Poland)—Microtextural, mineralogical, and geochemical constraints. Ore Geol. Rev. 2019, 114, 103130. [Google Scholar] [CrossRef]
  47. Legodi, M.; Dewaal, D. The preparation of magnetite, goethite, hematite and maghemite of pigment quality from mill scale iron waste. Dyes Pigment. 2007, 74, 161–168. [Google Scholar] [CrossRef]
  48. Sandeep, K.; Shankar, R.; Warrier, A.K.; Balsam, W. Diffuse reflectance spectroscopy of a tropical southern Indian lake sediment core: A window to environmental change. Episodes 2017, 40, 47–56. [Google Scholar] [CrossRef]
  49. Wu, C.; Long, H.; Cheng, T.; Liu, L.; Qian, P.; Wang, H.; Ren, S.; Zhou, L.; Zheng, X. Quantitative estimations of iron oxide minerals in the Late Pleistocene paleosol of the Yangtze River Delta: Implications for the chemical weathering, sedimentary environment, and burial conditions. Catena 2021, 207, 105662. [Google Scholar] [CrossRef]
  50. Balsam, W.L.; Wolhart, R.J. Sediment Dispersal in the Argentine Basin—Evidence from Visible-Light Spectra. Deep-Sea Res. Pt. II 1993, 40, 1001–1031. [Google Scholar] [CrossRef]
  51. Balsam, W.; Damuth, J. Further investigations of shipboard vs. shore-based spectral data: Implications for interpreting Leg 164 sediment composition. Proc. Ocean Drill. Program Sci. Results 2000, 164, 313–324. [Google Scholar] [CrossRef]
  52. Torrent, J.; Schwertmann, U.; Fechter, H.; Alferez, F. Quantitative Relationships between Soil Color and Hematite Content. Soil Sci. 1983, 136, 354–358. [Google Scholar] [CrossRef]
  53. Ji, J.F.; Balsam, W.; Chen, J.; Liu, L.W. Rapid and quantitative measurement of hematite and goethite in the Chinese loess-paleosol sequence by diffuse reflectance spectroscopy. Clays Clay Miner. 2002, 50, 208–216. [Google Scholar] [CrossRef]
  54. Torrent, J.; Barrón, V.; Liu, Q. Magnetic enhancement is linked to and precedes hematite formation in aerobic soil. Geophys. Res. Lett. 2006, 33, L02401. [Google Scholar] [CrossRef] [Green Version]
  55. Cornell, R.M.; Schwertmann, U. The Iron Oxides:Structure, Properties, Reactions, Occurences and Uses; Wiley: Weinheim, Germany, 2003. [Google Scholar]
  56. Zou, X.; Chen, T.; Liu, H.; Chen, D.; Zhang, P.; Xie, Q. Structural and Chromatic Evolution of Goethite by Thermal Treatment. J. Chin. Ceram. Soc. 2013, 41, 669–673. [Google Scholar] [CrossRef]
  57. Zhou, W.; Ji, J.; Balsam, W.; Chen, J. Determination of Goethite and Hematite in Red Clay by Diffuse Reflectance Spectroscopy. Geol. J. China Univ. 2007, 13, 730–736. [Google Scholar]
Figure 1. Photograph of the samples used in the present study. The sample named BH-F-1 in the upper left corner is a nearly colourless control sample.
Minerals 12 00677 g001
Figure 2. The colour analysis of Beihong agate samples. (a) 24 Beihong agate samples in CIE 1976 L*a*b* uniform colour space. (b) High positive correlation between the lightness L* and the hue angle . (c) High positive correlation between the colour coordinate b* and the chroma C*. (d) High negative correlation between the colour coordinate a* and the hue angle .
Minerals 12 00677 g002
Figure 3. Relationships between colour parameters and total Fe content. (a) The higher the total Fe content, the lower the lightness of Beihong agate. (b) The change in the total Fe content causes the hue of Beihong agates to vary from yellow to orange-red. The bars on the left of the two figures show the corresponding lightness and hue of different values.
Minerals 12 00677 g003
Figure 4. Representative Raman spectra of the silica matrix of Beihong agates. The Gaussian Lorentzian fit for the 465 cm−1 (Q) and 502 cm−1 (Mo) bands are shown in the upper right corner.
Minerals 12 00677 g004
Figure 5. Moganite content and Raman band integral ratio I502/I465 in samples with different total Fe contents and hue angles.
Minerals 12 00677 g005
Figure 6. (a,b) Microscopic characteristics under polarised optical microscopy. The red arrows in figure (b) indicate the distribution of chromogenic minerals along the strips. (c) Raman spectra of the ferruginous particles. The peak positions of ferruginous particles are similar to that of the goethite numbered X050093 in the RRUFF Raman database. The peaks of Gt, Q, and Mo are indicated by purple, yellow and blue dashed vertical lines, respectively.
Minerals 12 00677 g006
Figure 7. UV-VIS spectra of typical Beihong agate samples. Four typical samples (BH-F-5, -13, -17, -24) were pale yellow to orange-red (hue angle 79.32, 61.70, 58.96, and 40.75, respectively), and BH-F-1 as a nearly colourless control sample.
Minerals 12 00677 g007
Figure 8. The first derivative curves of UV-VIS Spectra of typical Beihong agate samples and a control sample. It is worth noting that previous studies mostly take the first derivative of the reflectance spectrum, so the characteristic peaks were studied in the curve. While in this study, the absorbance spectrum was tested, so we analysed the position of the wave trough (Note: troughs occur on the shoulders of absorption bands in UV-VIS Spectra).
Minerals 12 00677 g008
Figure 9. Relationships between the position of the primary trough within the range of 500–600 nm and the total Fe content and colour parameters. (a) With the position of the primary trough shifting to the long-wave direction, the total Fe content increases. (b) High negative correlations between the position of the primary trough and lightness and hue angle, but a weak correlation between the position and chroma shows in the upper right corner.
Minerals 12 00677 g009
Figure 10. Comparison of 24 Beihong agate samples before and after heat treatment at 310 °C. The colour square shows the simulated colour of Beihong agates. Left: Before heat treatment. Right: After heat treatment. The white value below represents the colour difference before and after heat treatment. It shows that most samples change from yellow to red after heat treatment. According to the values of colour difference, orange samples changed more in colour after heat treatment, presuming that the relative contents of goethite in these agates can be higher.
Minerals 12 00677 g010
Figure 11. Comparison of the UV-VIS spectra and the first derivative curves before and after heat treatment of samples named BH-F-18 (a) and named BH-F-24 (b). The curves of UV-UIS spectra and first derivative are indicated by yellow and grey, respectively. The primary trough of sample BH-F-18 is not only changing in position but also changes in value, while that of sample BH-F-24 only changes in position, indicating that BH-F-18 contains a higher relative content of goethite.
Minerals 12 00677 g011
Table 1. Raman frequencies of moganite, and α-quartz.
Moganiteα-Quartz
v 1 (cm−1) 1 v 1 (cm−1) 1Mode Symmetry
129128E(LO + TO)
141
220206A1
265263E(LO + TO)
317
355A1
370
377
398396E(TO)
401E(TO)
432
449450E(TO)
463465A1
502
511E(LO)
693696E(LO + TO)
792
796E(TO)
808E(LO)
833
(950)
(978)
1058
1065E(TO)
10841085A1
11711162E(LO + TO)
1177
1230E(LO)
1 Minor frequency differences (1–2 cm−1) between the values by Kingma et al. (1994) [35].
Publisher’s Note: MDPI stays neutral with regard to jurisdictional claims in published maps and institutional affiliations.

