Abstract
In this study, we report the experimental findings of a multi-methodological and comparative investigation of a natural (from the Wah Wah Mountains of Beaver County, Utah) and three synthetic (hydrothermally grown) gem-quality red beryls by means of: gemmological standard testing, laser ablation inductively coupled mass spectroscopy, infrared and Raman spectroscopy, ultraviolet–visible–near infrared absorption spectroscopy, and single-crystal X-ray diffraction. Gemmological, crystallo-chemical, and spectroscopic features of the natural and synthetic stones enabled us to unveil the causes of their color (from red, to purplish-red, or orange-red) and how different and complementary techniques can be efficiently used to discriminate between natural and synthetic materials, based on non-destructive, micro-destructive, and destructive techniques.
1. Introduction
Beryl (ideal composition: Be2Al3Si6O18) is one of the most popular and expensive colored gemstones. It occurs in a wide range of colors and has several important gemstone varieties, including the vivid green emerald and the blue aquamarine [1]. Other popular gem varieties of beryl are the pink morganite, the yellow heliodor, and the red beryl [1]. Beryl occurs worldwide: the leading producers of emeralds are Colombia, Brazil, and Zambia, whereas aquamarine, morganite, and heliodor varieties mainly come from Brazil and Africa (e.g., Madagascar, Zambia, Nigeria, Mozambique). The gemmological properties of this mineral, including for instance the wide range of colors, are governed by its crystal structure and crystal chemistry.
Beryl structure is hexagonal, described in the P6/mcc space group, and consists of six-membered ring of Si tetrahedra, perpendicular to the [001] axis, linked by Al octahedra and Be tetrahedra to form a three-dimensional framework, as shown in Figure 1. Alkali cations, H2O, and CO2 molecules can be incorporated as ‘extra-framework’ population, within the six-membered ring channel parallel to [001] (Figure 1). The presence of other elements, able to replace Al, gives rise to various colors (i.e., Fe, Cr, V, and Mn for coloration in both natural and synthetic, along with Co and Ni in synthetic beryls). However, replacement at the tetrahedral sites (in particular at the Be site, in synthetic stones) can also take place, e.g., [2] and references therein. Several studies have been carried out on natural and synthetic beryls with different extra-framework populations and various cationic substitutions, e.g., [3,4,5,6,7,8,9,10,11,12,13,14,15,16,17,18,19,20].
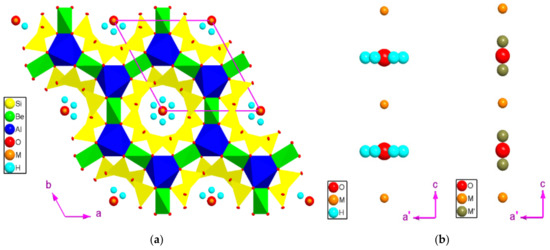
Figure 1.
(a) The crystal structure of beryl based on the structure refinement of the samples of this study. (b) Schematic configuration (with arbitrary ionic radii) of the channel sites along [001] obtained for the BS1R, BS2G, and BS3G samples (i.e., with the H site) and for the BN1R sample (i.e., without the H site).
Among the varieties of beryl used as gemstones, the rarest is the red variety [21]. In addition to its attractive and rare color, red beryl is also unique among beryls in its geological occurrence, being the only variety found in a volcanic rhyolite as host rock [21,22,23]. Moreover, there is only one known commercial occurrence of gem-quality red beryl worldwide, that is the Violet Mine, Wah Wah Mountains of south-western Utah, USA [21,22]. The rarity of the red color in natural beryl, as well as its unique genesis and occurrence, have contributed to generating much interest on this particular variety of beryl.
The market of beryl involves not only natural stones, but also synthetic ones. Almost all colors of beryl can be efficiently produced by the hydrothermal method, and emeralds are also flux grown. Synthetic red beryls have been produced in the past decades in order to respond to the market demand [24]. The synthetic red crystals are only grown by the hydrothermal technique, adding chromophore dopants—such as Co, Mn, Fe, and Ni—in an alkaline growth solution [24,25].
Despite a series of papers devoted to natural and synthetic gem-quality red beryls, e.g., [11,21,23,24,25,26,27,28,29,30,31], a multi-methodological and comparative investigation of natural and synthetic samples based on gemmological analysis, chemical characterization from major to trace-elements, vibrational spectroscopies, and structure refinements based on X-ray diffraction techniques is still missing. In this study, we report the experimental findings of a case-study based on a multi-methodological investigation of one natural and three doped synthetic gem-quality red beryls by means of: gemmological standard testing, laser ablation inductively coupled mass spectroscopy (LA-ICP-MS), infrared (IR) and Raman spectroscopy, ultraviolet–visible–near infrared (UV–vis–NIR) absorption spectroscopy, and single-crystal X-ray diffraction (XRD) in order to unveil the main differences between natural and synthetic stones using different probes.
2. Materials and Methods
2.1. Samples Description and Gemmological Testing
Three synthetic gem-quality red beryl crystals, hydrothermally grown by TAIRUS Created Gems, Co., Ltd. (Bangkok, Thailand), and belonging to the collection of the Istituto Gemmologico Italiano, were used for the present study (Figure 2). In details, one synthetic sample (i.e., BS1R) is a tabular rough with dimensions of about 18.88 mm × 18.38 mm × 6.70 mm and a weight of 18.38 ct, whereas the other two synthetic samples (i.e., BS2G and BS3G) are faceted gems, of 4.10 and 1.41 ct, respectively. A natural, rough gem-quality, red beryl sample (4.11 mm × 4.20 mm × 3.07 mm, 0.21 ct), detached from a multiple rough consisting of two prismatic crystals (Figure 2) and kindly provided by the Istituto Gemmologico Italiano (Milan, Italy), was also studied as a comparison. The sample comes from the Wah Wah Mountains of Beaver County, Utah, the only mine worldwide of gem-quality red beryl [21].
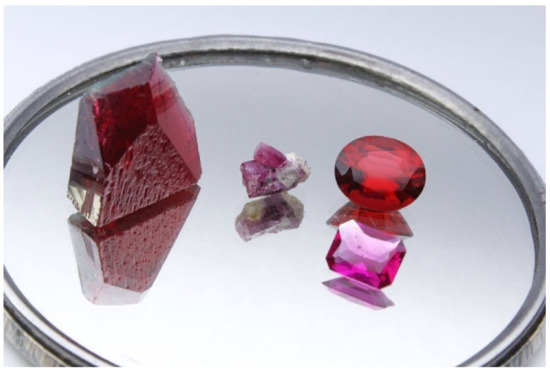
Figure 2.
The gem-quality red beryls analyzed in the present study. The rough sample (BS1R, 18.38 ct) on the left is a hydrothermally grown synthetic beryl, as well as the two faceted samples on the right (above BS2G, 4.10 and below BS3G, 1.41 ct). The sample in the middle is a rough of a natural red beryl (1.91 ct in total), consisting of two crystals, the smallest of which was investigated in the present study. BS1R dimensions: 18.88 mm × 18.38 mm × 6.70 mm.
The samples were first examined by standard gemmological methods, in order to determine the optical properties (refractive indices, birefringence, and pleochroism), specific gravity, ultraviolet fluorescence, and microscopic features. The refractive indices were measured with a Krüss refractometer (A. Krüss Optronic, Hamburg, Germany) using ordinary light source with a sodium filter (589 nm) and methylene iodide as a contact liquid (n = 1.79). A Mettler hydrostatic balance was used to determine the specific gravity of the stones, whereas pleochroism measurements were carried out by a calcite dichroscope. The reaction of the samples to the ultraviolet radiation was investigated with a long (366 nm) and short (254 nm) wavelength ultraviolet Wood’s lamp unit. A Motic GM168 dark-field gemmological microscope (MoticEurope, Barcelona, Spain) was used for the microscopic observations of the samples. The gemmological properties of both the faceted and rough synthetic and natural red beryls are described in Table 1.

Table 1.
Gemmological properties of the hydrothermal synthetic and natural red beryls of this study.
2.2. LA-ICP-MS Measurements
The LA-ICP-MS measurements were performed at the Department of the Materials Science of the University of Milan-Bicocca (DMS-UniMIB), Milan, Italy. The probe comprises an Elan DRC-e mass spectrometer coupled with a Q-switched Nd:YAG laser source (Quantel Brilliant), whose fundamental emission (1064 nm) is converted to 213 nm by two harmonic generators. Helium was used as a carrier gas, mixed with Ar downstream of the ablation cell. The spot size was 100 μm in diameter.
Calibration was performed using NIST SRM 610 glass as an external calibration sample. The internal standardization was based on the stoichiometric content of Si, previously measured by SEM-EDS analysis, which proved an almost ideal Si content for all the samples. Chemical data based on the LA-ICP-MS measurements are listed in Table 2.
Table 2.
Chemical composition (in wt ppm) of the synthetic and natural red beryls based on LA-ICP-MS analysis.
2.3. Infrared Spectroscopy
The IR spectroscopic investigation of the stones in the near- and mid-infrared (8000–400 cm−1) range was carried out using a PerkinElmer Frontier Fourier-transform infrared (FTIR) spectrophotometer, at the Istituto Gemmologico Italiano, Milan, Italy. The unpolarized room temperature IR spectra were collected on unoriented single crystals in diffuse reflectance mode (DRIFT), using a Harrick Praying Mantis accessory and operating at a resolution of 4 cm−1. The IR spectra are shown in Figure 3.

Figure 3.
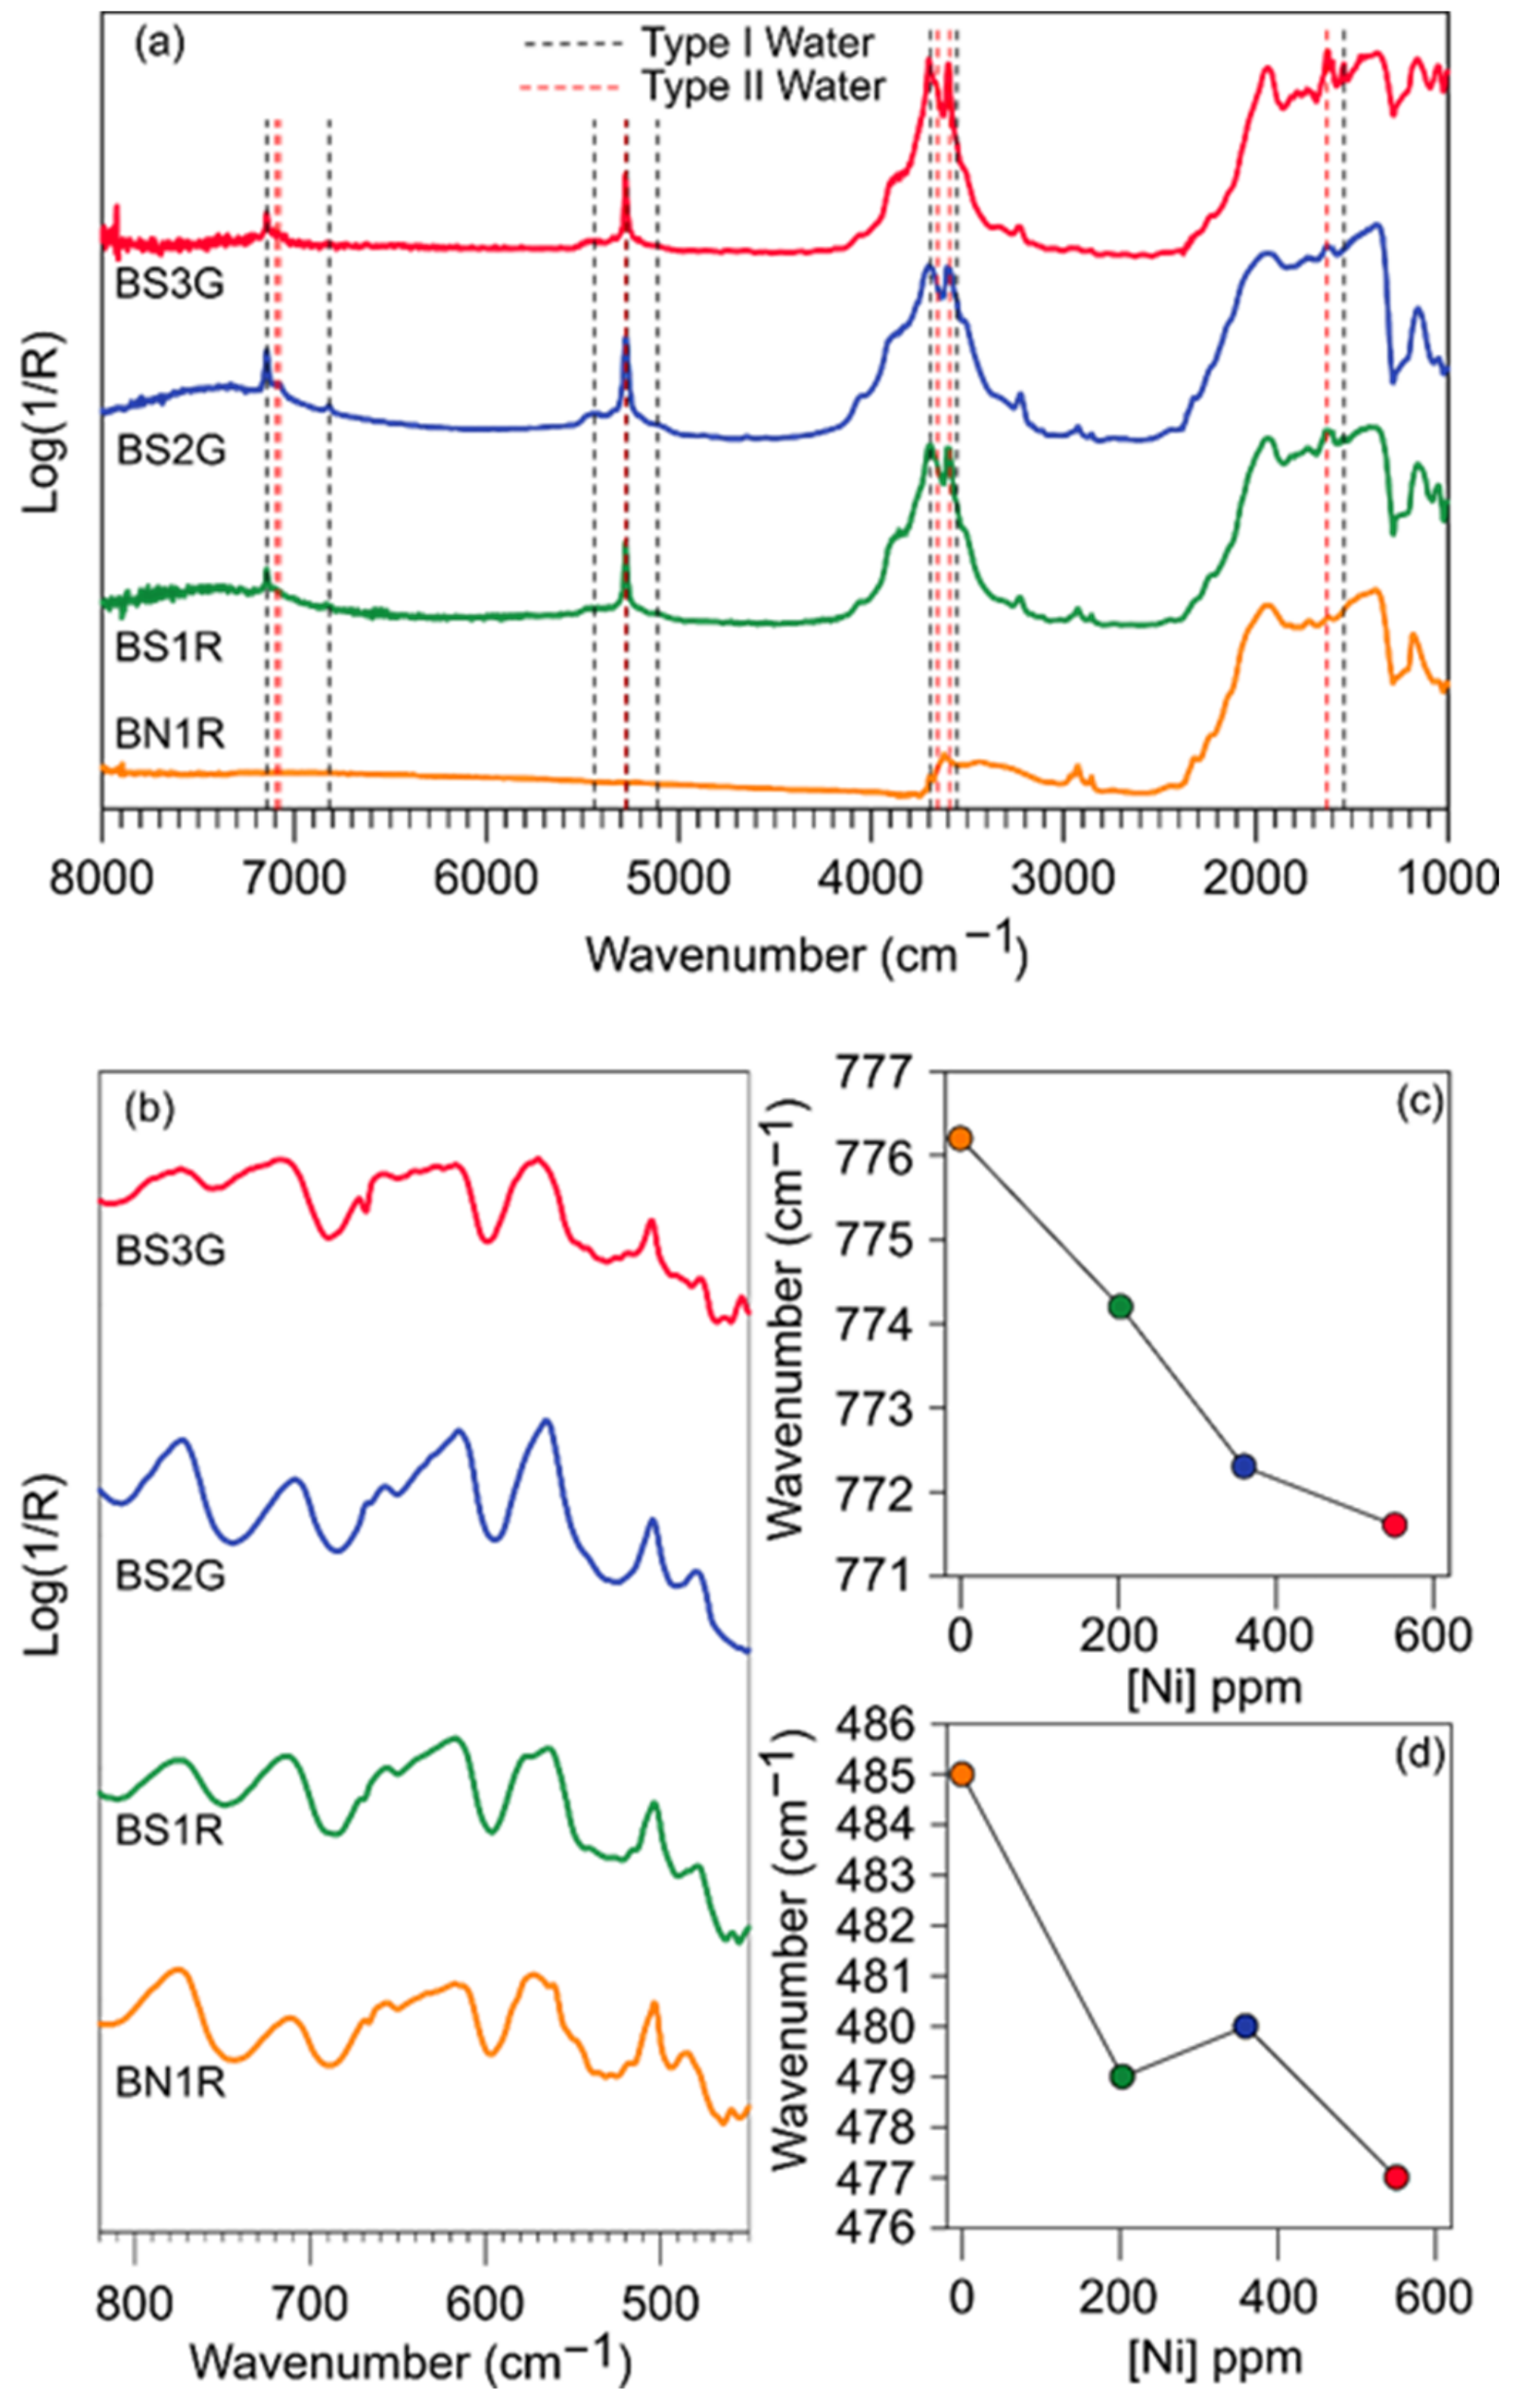
(a,b) Infrared spectra, in the 8000–400 cm−1 range, of the three synthetic (BS1R, BS2G, and BS3G) and of the natural (BN1R) red beryl samples. Positions of the modes ascribable to the “type I” and “type II” H2O molecules are marked by dashed black (I) and red (II) lines, respectively. (c,d) Shift of the Al-O and Be-O stretching modes (at about 485 cm−1 and 775 cm−1, respectively) as a function of the Ni content (see text for details).
2.4. Raman Spectroscopy
Raman spectra of the samples were collected in backscattering configuration with a LabRAM HR (Horiba–Jobin Yvon) spectrometer, at the DST-UniMIB, using either an argon laser (488 nm) or a He-Ne laser (633 nm) as excitation source, in the spectral range 200–1200 cm−1. Measurements were done on faces perpendicular to the optical axis of the beryl. The Raman spectra are shown in Figure 4.
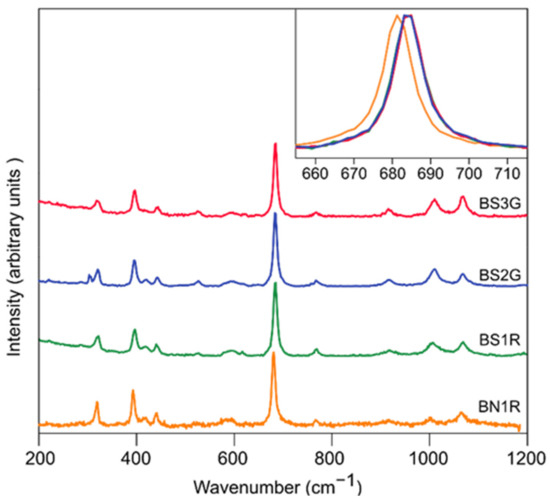
Figure 4.
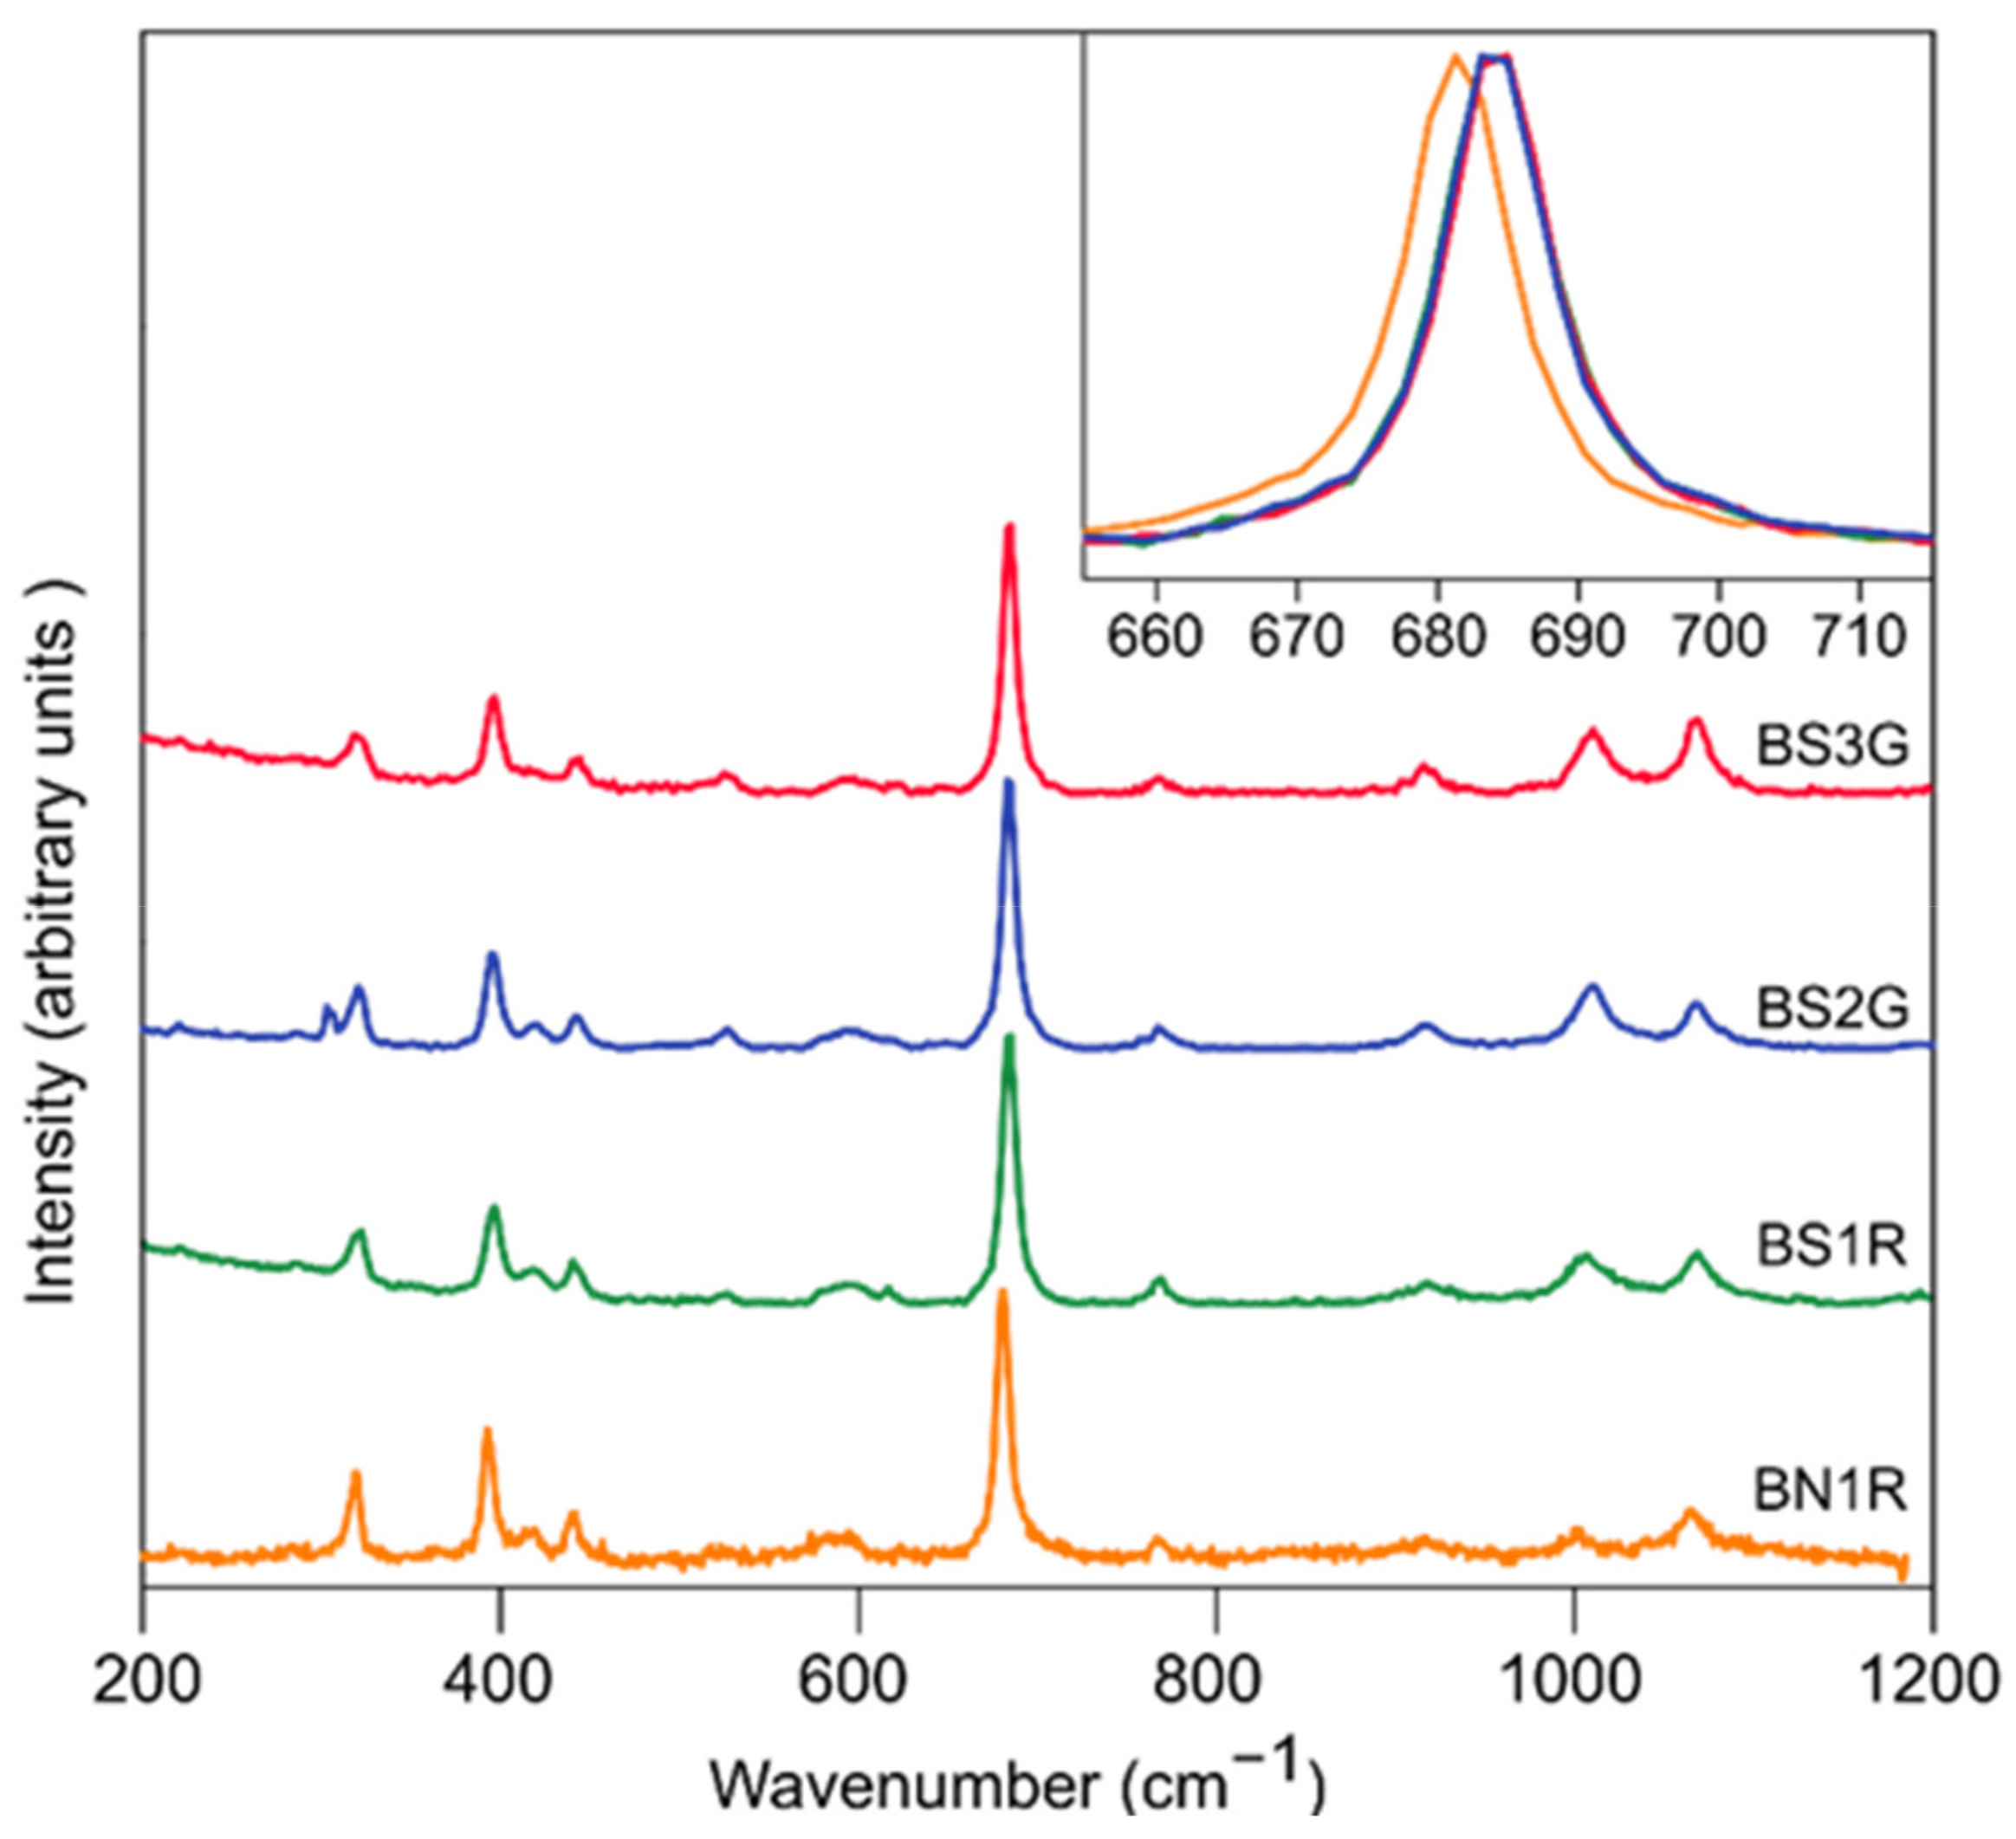
Raman spectra, collected in the range 200–1200 cm−1, of the natural and synthetic red beryls of this study. Inset: shift of the mode at ca. 681 cm−1 in response to the different substituents at the octahedral site, in natural and synthetic samples (see text for details).
2.5. UV–vis–NIR Spectroscopy
UV–visible diffuse optical absorption spectra were collected using a Perkin Elmer Lambda 950 spectrophotometer (PerkinElmer, Waltham, MA, USA) at the UniMIB, equipped with a 60 mm integrating sphere coated with Spectralon. BN1R spectrum has been collected in reflection mode, and reflection data have been transformed according to the Kubelka–Munk law and plotted as F(R) = (1 − R)2/2R (where R is the diffuse reflectance), with a resulting graphical representation comparable to the absorbance spectra. The UV–vis–NIR spectra are shown in Figure 5.
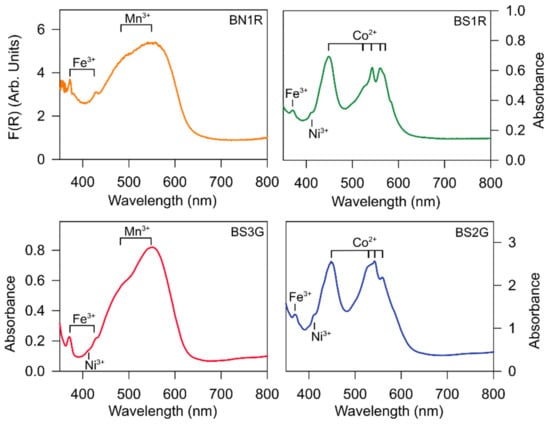
Figure 5.
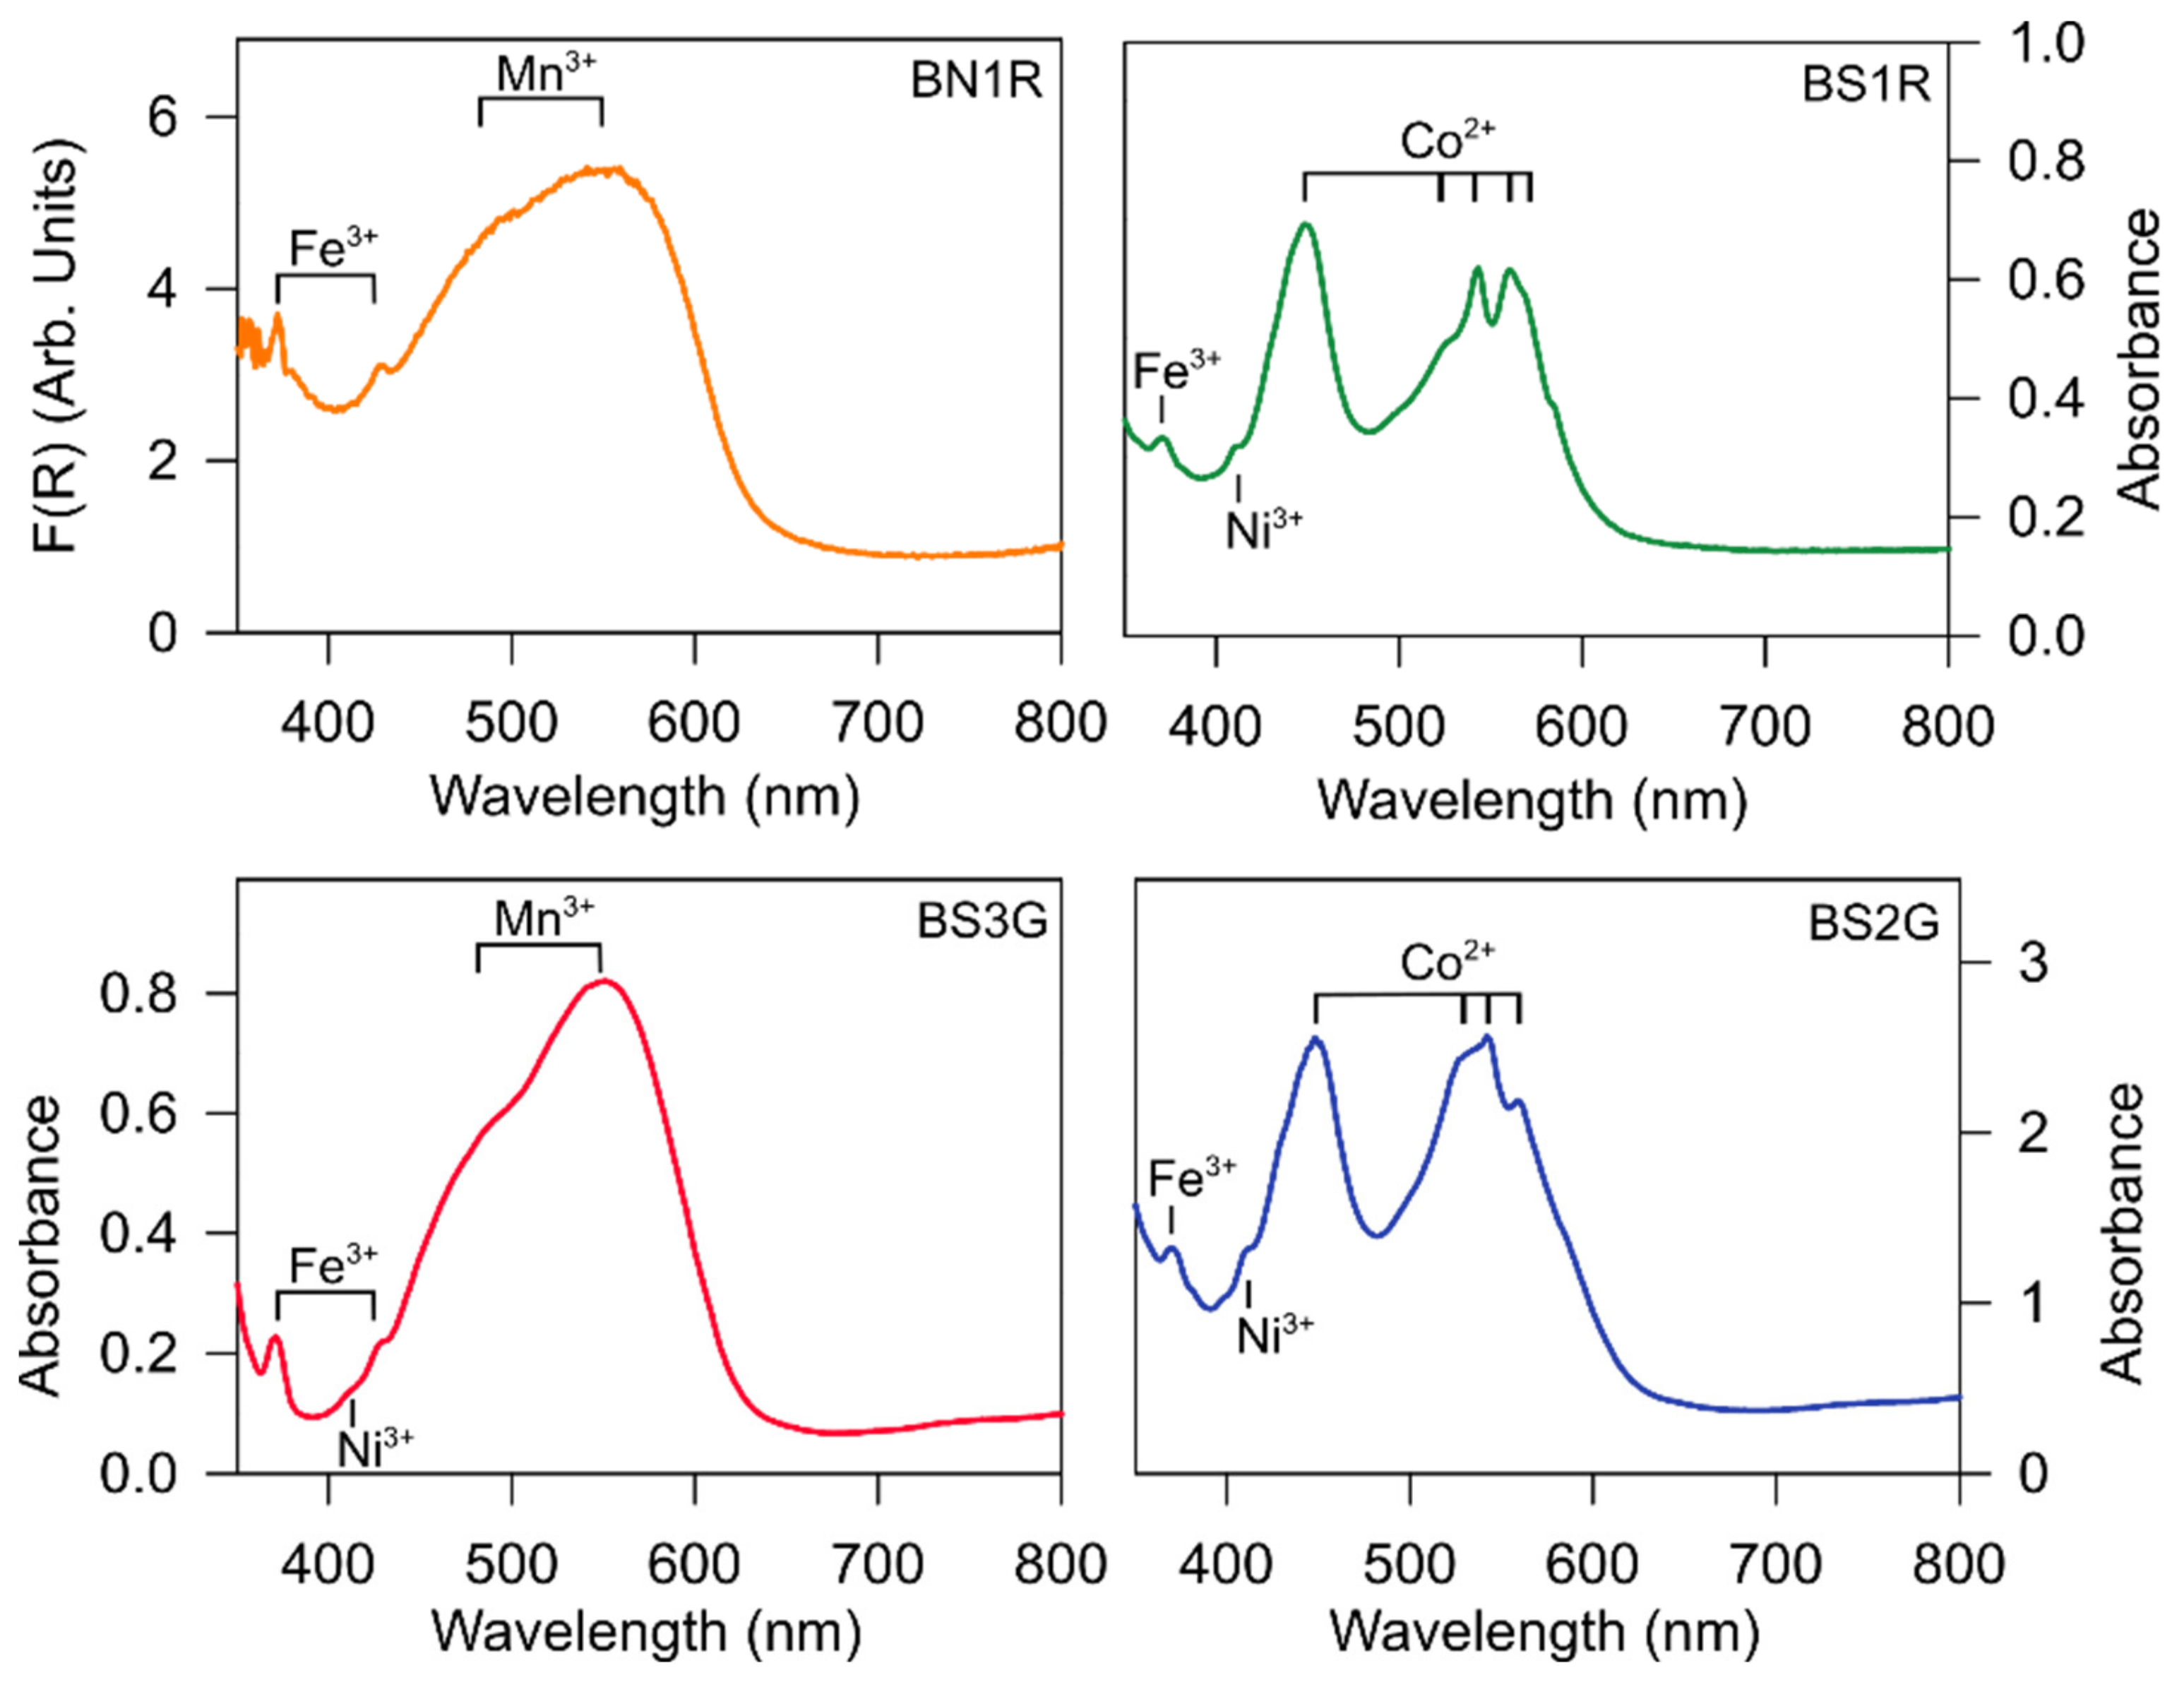
UV–vis–NIR spectra of the natural and synthetic red beryls, collected in the range between 300 and 800 nm. The BN1R spectrum has been collected in reflection mode and data are reported according to the Kubelka–Munk function.
2.6. X-ray Diffraction Data Collection and Treatment
Single-crystal X-ray diffraction data were collected from four fragments of the beryl samples under investigation. Experiments were performed at room temperature, with a Rigaku XtaLABSynergy-i diffractometer, equipped with a PhotonJet-i MoKα microfocus source and a HyPix-6000HE Hybrid Photon Counting (HPC) detector, at the Earth Science Dept., University of Milan. A series of collection runs were optimized using an ad hoc routine of the CrysAlisPro™ suite [32], with ω scan strategy, step size of 0.5° and an exposure time per frame of 2 s, in order to maximize the reciprocal space coverage and the quality of the intensity data. All the crystals were found to be metrically hexagonal (Table 3). Corrections for Lorentz-polarization effects and (semi-empirical) X-ray absorption were applied using the ABSPACK routine, implemented in the CrysAlisPro™ package [32]. The systematic extinctions were consistent with the space group P6/mcc. X-ray intensity data were then processed with the E-STATISTICS program, implemented in the WinGX package [33]: the statistics of distributions of the normalized structure factors showed that the structure is centrosymmetric for all the sample (>90%). The total number of reflections collected up to 2θmax of about 80°, the hmax–hmin, kmax–kmin, lmax–lmin ranges, the number of unique and ‘observed’ reflections, and the statistical parameter pertaining to the equivalent reflections are given in Table 3.
Table 3.
Details pertaining to the X-ray data collections and refinements of beryls.
Anisotropic crystal-structure refinements were conducted in the space group P6/mcc using the SHELXL-2018 software [34]. Neutral X-ray scattering factors of Si, Al, Fe, Be, O, K, Cs, and H were taken from the International Tables for X-ray Crystallography (Vol. C) and used for the refinement. Secondary isotropic extinction effect was corrected according to the formalism of Larson [35], implemented in SHELXL. The starting model of the crystalline edifice was that reported by Gatta et al. [19], with empty [001] channels and a mixed scattering curve of (Al + Fe) to model the octahedral site, according to the chemical composition of the samples that shows the presence of Fe and Co as main Al substituents. For all the refinements, convergence was rapidly achieved after the first cycles, with a series of (positive) residual peaks in the final difference-Fourier map of the electron density, ascribable to the [001] channel population. After a series of tests, the best figures of merit were obtained allocating the O of the H2O molecules and monovalent cations (Na, K, Cs) as channel population. Evidence of disorder of the H2O molecules was observed, and only in some of the refinements was it possible to allocate the H sites. After the implementation of the channel populations, convergence was achieved and the variance–covariance matrix showed no significant correlation among the refined variables; all the principal mean-square atomic displacement parameters were positive. Additional details pertaining to structure refinements are given in Table 3. Atomic coordinates and displacement parameters are listed in Table 4. Selected interatomic distances and angles are given in Table 5. The structure configuration based on the experimental findings of this study is shown in Figure 1.
Table 4.
Refined positional and displacement parameters (Å2) of the beryl samples, based on single-crystal XRD data. The anisotropic displacement factor exponent takes the form: −2π2[(ha*)2U11 +…+ 2hka*b*U12]; Ueq = 1/3(U11 + U22 + U33).
Table 5.
Relevant bond distances (Å) and angles (°) based on single-crystal XRD structure refinements.
3. Results and Discussion
3.1. Gemmological Properties
The natural red beryl crystal here investigated (i.e., BN1R) is a semi-transparent rough, showing a purplish red color (Figure 2). The color of the synthetic samples (i.e., BS1R, BS2G, and BS3G) ranges from red, to purplish-red, or orange-red (Figure 2). All of the samples are uniaxially negative, with refractive indices ω ranging from 1.572–1.580 and ε 1.564–1.570, with a birefringence of 0.010, and the measured specific gravity ranges from 2.67 to 2.70 g/cm3. These values are in agreement with those reported in the literature [1,21,24,25]. All the samples are not fluorescent in short/long wavelength ultraviolet radiation. When viewed with a dichroscope, all the faceted samples exhibit a moderate to strong, purplish-red (nε) and orange-red (nω) dichroism, as previously observed for red beryls [24]. When observed with a gemmological microscope, the synthetic samples are easily distinguishable from the natural counterpart. In particular, the most distinctive and diagnostic visual features of the hydrothermal synthetic red beryls are the strong inhomogeneous growth structures, with a chevron-like pattern. This internal growth zoning is typical of hydrothermal synthetic beryls, as is well-known in the literature [24,25]. Moreover, the synthetic red beryls of this study contain liquid veils and, in the rough sample, there is also a seed plate consisting of a synthetic emerald, which is another distinctive feature of the hydrothermal growth [24]. On the contrary, the natural beryl sample did not contain any of these inclusions, but it was characterized by numerous healed and unhealed fractures, which are common in natural red beryl [21,24].
3.2. Chemical Composition
The natural red beryl of this study is characterized by a number of minor and trace elements. Considering the transition metals, the most abundant are Fe (i.e., 21,921 wt ppm) and Mn (i.e., 3057 wt ppm), the latter playing an important role in determining its red color [11,21,24] (Table 2). The sample also contains Ti (i.e., 2595 wt ppm) and Zn (i.e., 600 wt ppm), Zr (i.e., 155 wt ppm), and Sc (i.e., 76 wt ppm), in agreement with the results of Shigley and Foord [21]. Considering the alkaline and alkaline-earth elements, the most relevant ones are Cs (i.e., 5103 wt ppm), Mg (i.e., 3101 wt ppm), K (i.e., 1378 wt ppm), and Rb (i.e., 1319 wt ppm) (Table 2), in agreement with the chemical composition of the natural red beryl reported by Aurisicchio et al. [11] and Shigley and Foord [21]. In particular, Aurisicchio et al. [11] considered the red beryl from Utah as a K-rich beryl, with potassium from the volcanic alkali rhyolite (see also the chemical analysis of rhyolite in Shigley and Foord [21]). Li and Na are also present, although in modest fractions (i.e., 819 and 274 wt ppm, respectively) (Table 2). The relatively low content of Na in natural red beryl, if compared to other varieties of beryl, is a distinctive feature of this variety [21] (Table 2). The occurrence of this suite of minor and trace elements—in addition to the lower but significant fractions of Nb, Sn, and Ga—is very distinctive and peculiar among the different variety of natural beryls (Table 2). Indeed, its particular chemical composition reflects the unique geological occurrence of the natural red beryl, which is influenced by the rhyolite host rock [21].
The hydrothermal synthetic red beryls contain Fe and Mn, as the natural counterpart, although in lower amounts (i.e., Mn: 3057 wt ppm in natural vs. 1097–1670 wt ppm in synthetics; Fe: 21,921 wt ppm in natural vs. 8796–14,654 wt ppm in synthetics) (Table 2), in agreement with the results of Henn and Milisenda [25] and Shigley et al. [24]. In addition to Fe and Mn, the synthetic red beryls of this study contain significant fraction of Ni (i.e., from 203 to 551 wt ppm) and, for two of them, also of Co (i.e., 3404 and 2393 wt ppm, respectively for BS1R and BS2G) (Table 2). In particular, the sample showing the higher Ni content is that with the lower amount of Co (i.e., BS3G) (Table 2). Ni and Co are always substantially absent in the natural red beryl and are considered the most diagnostic elements for identifying synthetic red beryls (Table 2), as previously reported in the literature (e.g., [21,24,25]). We also detected little fraction of Cr in all the synthetic stones (Table 2), as already reported in Shigley et al. [24]. Cu and V are instead virtually absent in our synthetic samples (Table 2). Low fractions of Ti (i.e., 15–132 wt ppm), Sc (i.e., 19–30 wt ppm), and Zn (i.e., 3–43 wt ppm) were also measured (Table 2). Concerning the alkali elements, the synthetic stones show a relatively high fraction of Li (i.e., 3072–4021 wt ppm) and Na (i.e., 648–1823 wt ppm), higher than what measured in the natural red beryl (Table 2).
We are inclined to believe that these relatively high fractions of Li and Na, in the synthetic samples, likely reflect the alkali-bearing growth solution used for the synthesis procedure. For the same samples, the infrared spectra show the occurrence of the alkali-related “type-II” H2O, described in the next section. Mg is also present (i.e., 1750–2252 wt ppm) in our synthetic samples, whereas the fraction of K in the synthetic samples is drastically lower if compared to the natural counterpart (i.e., K: 1378 wt ppm in natural vs. 38–125 wt ppm in synthetics) (Table 2).
3.3. Infrared Spectra
The crystal structure of beryl is described in the hexagonal space group P6/mcc (D26H), with two formula units per unit cell, and a total of N = 58 atoms per cell [36,37]. Without considering possible contributions from the channel population, a total of 3·N = 174 normal modes are predicted, out of which 38 modes are IR active (6A2u + 16E1u), 65 modes are Raman active (7A1g + 13E1g + 16E2g), 68 modes are inactive (9A2g + 7B1g + 6B2g + 5A1u + 9B1u + 8B2u + 12E2u), and 3 modes correspond to rigid translation of the crystal (A2u + E1u); all of the E modes are doubly degenerate [38]. As a result, the IR and Raman spectra of beryl are quite complex.
The infrared spectra from 8000 to 400 cm−1 of the samples here investigated are shown in Figure 3. The fundamental vibrational modes of H2O molecules, trapped in the beryl structural channels, can be observed between 4000 and 3500 cm−1, which is the range of the stretching modes of H2O, and between about 1500 and 1600 cm−1, the range of the deformation mode of the molecule [4,5]. In particular, the frequencies of these fundamental vibrations allow us to classify the H2O molecules in the beryl channels as “type I” H2O, i.e., H2O molecules with H-H vector parallel to [001]; and “type II” H2O, i.e., H2O molecules with the H-H vector perpendicular to [001] [4,5]. The IR spectra of the hydrothermal synthetic red beryls of this study (i.e., BS1R, BS2G, BS3G) are characterized by strong absorption features of H2O molecules with both “type I” (i.e., 3695, 3555, and 1542 cm−1) and “type II” (i.e., 3655, 3595, and 1628 cm−1) configurations [4,5,38,39,40,41,42], with similar intensities of their fundamental vibrational bands. The presence of both types of H2O in the synthetic samples is also in agreement with their chemical compositions, and in particular due to alkalis occurring as channel population [4,5,11,38], interacting with the H2O molecules.
Conversely, the natural red beryl here investigated displays very weak H2O absorption features: low intensity peaks at 3694 and 1542 cm−1, ascribable to “type I” H2O, and at 1628 cm−1, ascribable to “type II” H2O configuration [4,5,39,40,41,42,43]. The very low intensity of the fundamental vibrations of H2O reflects the very low water content in natural red beryl, due to its peculiar genetic conditions [4,5,11,21]. In particular, Shigley and Foord [21] measured only 0.36 wt % of H2O in the red beryl from Utah, in contrast to the other varieties of beryl that show higher content of H2O.
The presence of molecular H2O in both the orientations—i.e., “type I” and “type II”—can be also confirmed on the basis of the overtones and recombination bands of H2O in the spectral range between 8000 and 4000 cm−1. In the synthetic samples of this study, we observed absorption bands related to “type I” H2O at 7143, 6820, 5450, 5275, and 5107 cm−1 and to “type II” at 7107, 7079, and 5275 cm−1 [4,5,42,43,44]. In the natural red beryl, these combination bands and overtones of H2O are not detectable, in agreement with the very low content of water in this crystal.
According to Wood and Nassau [5], the spectral region <2200 cm−1 is populated by the so-called crystal vibrations (‘lattice modes’), including modes involving breathing of the six-membered rings, Si-O, Al-O, and Be-O bending and stretching. We have analyzed the isolated Al-O and Be-O stretching modes at about 485 cm−1 and 775 cm−1, respectively, to infer crystal distortions arising from heteroatomic substitution in octahedral and tetrahedral coordination, respectively [41,45,46]. It is worth noting that any potential substitution at the Al site is expected to have a significant effect not only on the vibrational modes pertaining to the octahedral AlO6 unit, but also on the adjacent BeO4 tetrahedral units. AlO6 and BeO4 units are mutually connected, by edge sharing, to give large 12-membered rings, lying on (001) (Figure 1). As shown in Figure 3b,c, for both the modes at about 485 cm−1 and 775 cm−1, we observe a shift toward lower wavenumbers with increasing the nickel concentration, with Ni concentration being almost irrelevant in the natural sample (i.e., <1 wt ppm BNR1) and with a significant and increasing concentration in the synthetic stones (i.e., 203 wt ppm BS1R, 360 wt ppm BS2G, 551 wt ppm BS3G) (Table 2). This experimental finding indicates that the Al vs. Ni substitution affects the vibrational modes of the AlO6 octahedral and BeO4 tetrahedral units [47,48].
3.4. Raman Spectra
The Raman spectra of the four samples of this study are shown in Figure 4. The observed bands are in accordance with those reported in the literature [36,41]. The spectral region below 1500 cm−1 is characterized by crystal vibrations, including active Raman modes involving breathing of the six-membered rings, Si-O, Al-O, and Be-O bending and stretching. The main peak at about 680 cm−1 has been attributed either to an E1g or to an E2g mode [37,45]. According to these interpretations, this stretching mode involves the contribution of the relative motion of the tetrahedrally coordinated Be atoms and the octahedrally coordinated Al atoms, bonded to O atoms. However, the motion of the six-membered ring of SiO4 tetrahedra also partly contributes to this signal, as confirmed by ab initio calculation [41]. This peak is spectrally shifted toward lower wavenumbers in highly substituted beryls and/or in absence of molecular H2O in the channels [49]. Actually, natural samples from Utah, due to their unconventional magmatic origin, have both these features [50]. As expected, the main Raman peak of the sample BN1R lies at 681 cm−1, about 3 cm−1 less than those observed for the other synthetic samples (inset of Figure 4).
3.5. UV–vis–NIR Spectra
From a gemmologist perspective, elemental substitutions at the octahedral or tetrahedral sites are important as they control the visible optical properties of red-colored beryls. The different colors of the sample set of this study offer the opportunity to analyze the main causes of red and pink colors of natural or synthetic beryls. The natural sample of this study (i.e., BN1R) is characterized by an irregular shape and by the presence of a layer of residual rhyolite host rock, as commonly found in beryls from Utah [50]. Thus, the UV–vis spectrum of this sample has been collected in reflection mode, as there was no clear area for in-line transmission measurements. The spectrum, after the Kubelka–Munk transform, is shown in Figure 5 and contains the distinguishing absorption bands of Mn3+ in octahedral coordination [51]. This absorption is characterized by two broad bands centred at about 480 nm and 550 nm ascribable to 5E(D) → 3T1(H) and 5E(D) → 5T2(d) transitions, respectively. Two additional peaks are present in the spectrum at about 430 nm (i.e., 6A1(S) → 4A1(G)) and 370 nm (i.e., 6A1(S) → 4T2(D)), both ascribable to Fe3+ in octahedral coordination [52].
Similar features have been observed even for the synthetic sample BS3G (Figure 5). This synthetic beryl has a very low content of Co and is rich in Ni and Mn (Table 2). The absorption spectrum shows a main contribute attributable to Mn3+ and minor contributes to Ni3+ and Fe3+ at 410 nm (i.e., 4T1g(F) → 2A1g(G)) and 370 nm (i.e., 6A1(S) → 4T2(D)), respectively [29,52]. By contrast, the other two synthetic samples (i.e., BS1R and BS2G) show the typical absorption signal of Co2+ in octahedral coordination, with an intense peak at 450 nm (i.e., 4T1g(F) → 4T1g(P)) and a structured band in the range of 500–600 nm (i.e., 4T1g(F) → 4A2g(F) + 2T1g(G)) [29,30], along with contributions from Ni3+ and Fe3+ as previously described (Figure 5). Cobalt is one of the common dopants used to generate red coloration in synthetic beryls, and its UV–vis absorption features are considered a clear indication of the artificial origin of a gem [24]. However, the red hue of Co-doped samples is deeper than the typical red of natural beryls, while higher levels of Mn doping better mimic the pinkish color of the natural samples.
3.6. Crystallographic Data
The general structure model of the four beryl samples here investigated is in good agreement with that previously reported in the literature. It is worth noting that all the samples show potential substituents at the octahedral Al (4c) site (e.g., Fe + Co vs. Al), the three synthetic samples (i.e., BS1R, BS2G, BS3G) show a channel population mainly represented by Na + H2O, whereas the natural sample (i.e., BN1R) is represented by K + Cs + H2O (Table 4).
All the beryl samples here investigated lie between the ranges ascribed to “octahedral beryls” (i.e., with c/a = 0.991–0.996) and “normal beryls” (i.e., with c/a = 0.999–1.003) [11] (Table 3). None can be ascribed to the “tetrahedral beryl” (i.e., with c/a = 0.997–0.998) [11] (Table 3). This implies that the only significant effects, in response to cationic substitution, are those pertaining to the octahedral Al (4c) site (Table 4). Accordingly, all the structure refinements show that the Al (4c) site is populated by Al and by a low, but significant, fraction of Fe (or Fe + Co), consistently with the chemical compositions of the samples obtained by LA-ICP-MS (Table 2). Other potential substitutions at the tetrahedral site Be (6f), e.g., Li vs. Be, do not generate any effect that is detectable by X-ray diffraction (Table 2 and Table 4).
The c/a ratio reflects the effects of cation substitution at the unit-cell level. However, more direct evidence is provided by the bonding configuration of the coordination polyhedra. The (Fe + Co) vs. Al substitutions at the octahedral Al (4c) site generates a change of the (average) Al-O2 distances (Table 5). The ideal Al3+-O, Fe3+-O, and Co2+-O bond distances, with octahedral coordination configuration, are ~1.904, ~2.016, and ~2.130 Å, respectively [11,20,53,54]. The refined bond distances for the four samples here investigated range between 1.9139(4) and 1.9164(5) Å, suggesting the presence of Fe (+Co) at the octahedral Al (4c) site (Table 5). In addition, it is possible to correlate the average bond distance value and the (Fe + Co) content: the shortest distance (1.9139(4) Å, Table 5) is observed for the sample with the lowest Fe + Co content (i.e., with ~9000 wt ppm, sample BS3G, Table 2), a slightly longer distance (i.e., 1.9145(5) Å, Table 5) for the mid Fe+Co content (i.e., with ~11,400 wt ppm, sample BS2G, Table 2), and the longest distance (i.e., 1.9164(5) Å, Table 5) for the highest Fe + Co content (i.e., ~18,700 wt ppm, sample BS1R, Table 2). It is worth noting that the natural sample (i.e., BN1R) contains substantially only Fe3+ (i.e., ~21,000 wt ppm, Table 2), and its refined Al-O2 distance is 1.9163(4) Å (Table 5): a virtually identical bond distance is generated either by ~21,000 wt ppm of Fe3+ or by [15,000 wt ppm Fe3+ + 3700 wt ppm Co2+].
The cationic substitution at the octahedral sites does not generate any significant effect on the displacement regime of the Al (4c) site: the differences in magnitude and shape of the anisotropic displacement parameters (here described in the form: −2π2[(ha*)2U11 + … + 2hka*b*U12]) are not significant (Table 4).
The channel population of the three synthetic samples is consistently modeled with one site populated by Na (i.e., M (2b) at 0,0,0, Table 4), one site populated by the oxygen atom of the H2O molecule (i.e., Ow (2a) at 0,0,1/4, Table 4), and one additional site populated by H (i.e., H (12k), 2x,x, 1/4), in plane with the Ow site and with Ow-H distances ~1 Å (Table 4 and Table 5). All the channel sites were modeled with isotropic displacement parameters, even in response of their partial site occupancy. As usually found in H2O-bearing beryl, the H2O molecule shows a disordered configuration, because of its point symmetry (i.e., 2mm) and that of the beryl structure along [001] (e.g., [19,55]). Of the two aforementioned disordered configurations (i.e., “type I”, with O atom lying on the 6-fold axis, H out of plane and H-H vectors oriented almost parallel to [001]; “type II”, with O atoms on the 6-fold axis, H atoms in plane and H–H vectors on (001)), the structure model here obtained for the beryl samples BS1R, BS2G, and BS3G is more compatible with the presence of the “type II” H2O, despite the geometry of the molecule cannot be entirely described, due to the disorder. For these three samples, the M-Ow distance (i.e., Na-OH2) is about 2.297–2.298 Å and the M-O1 about 2.574–2.578 Å (Table 5).
More complex is the configuration of the channel sites of the natural sample BN1R. In this case, the oxygen of the H2O molecule lies at the 2a site, as for all the other samples, but the cation population consists of one site mainly occupied by K (M(2b) at 0,0,0, Table 4) and an additional site mainly occupied by Cs (i.e., M’(4e) at 0,0,z, Table 4). All the sites are here modeled with partial site occupancy and isotropic displacement. In this case, it was not possible to locate any H site. The refined M ↔ Ow distance is about 2.298 Å, the M ↔ O1 distance of ~2.582 Å and M’ ↔ O1 of ~3.04 Å (Table 5).
4. Conclusions
In this multi-methodological and comparative study, we have reinvestigated the gemmological, crystallo-chemical, and spectroscopic features of one natural and three synthetic red beryls, the causes of their color (from red, to purplish-red, or orange-red) and how different and complementary techniques allow to efficiently discriminate between natural and synthetic gemstones. On the basis of the experimental findings of this case-study, some concluding remarks can be given:
- -
- The gemmological properties of the stones under investigation allow us to distinguish the synthetic samples from the natural counterparts, as proved by the observation under the gemmological microscope. The most distinctive features of the hydrothermal synthetic stones are the strong inhomogeneous growth structures, with chevron-like patterns.
- -
- Chemical data of the natural and synthetic stones of this study show significant (and diagnostic) difference for the minor/trace elements content (i.e., from 102 to 104 wt ppm, Table 2), in particular for the transition metals as Fe3+, Mn3+, Co2+, Ti4+, and Ni3+. Ni3+ and Co2+ are always substantially absent in the natural red beryl and are considered the most diagnostic elements for identifying synthetic red beryls. Significant difference pertains also to the alkalis content: the synthetic stones show a relatively higher fraction of Li+ (i.e., 3–4·103 wt ppm, Table 2) and Na+ (i.e., 0.6–1.8·103 wt ppm, Table 2) if compared to the natural red beryl (i.e., Li+ 0.8·103 wt ppm, Na+ 0.3·103 wt ppm) (Table 2), whereas the fraction of K+ in the synthetic samples is drastically lower (i.e., 0.04–0.12·103 wt ppm) than the natural one (i.e., 1.4·103 wt ppm) (Table 2). As proved by UV–vis–NIR spectroscopy, cobalt is one of the common dopants used to generate red coloration in synthetic beryls, and its occurrence is considered a clear indication of the artificial origin of a gem. In addition, the red hue of Co-doped samples is deeper than the typical red of natural beryls, while higher levels of Mn3+ better mimic the pinkish color of the natural samples.
- -
- Vibrational spectroscopy data, collected on the natural and synthetic red beryls of this study, provide a series of complementary information. Raman spectra proved how local structural distortions, generated by heteroatomic substitution in octahedral coordination, can be efficiently detected even when generated by transition metals with modest concentration (i.e., Ni3+ 2–5·102 wt ppm, Table 2). IR spectra provide evidence about the presence (and, therefore, the content), the orientation and the interaction of the structurally incorporated H2O molecules, lying into the [001] channel. Natural red beryls from Utah have a very low H2O content if compared to other varieties of natural beryls and to the synthetic ones of this study, and its IR spectrum clearly shows that.
- -
- Chemical and crystallographic data consistently show that, for all the samples (natural or synthetic) here investigated, the potential substituents at the tetrahedral sites, occupied by Be (6f) and Si (12l), are only modest, at least for the natural sample. A significant fraction of Li is observed in the synthetic samples (i.e., 3–4·103 wt ppm, Table 2), and we cannot exclude a replacement of Be, though with no crystallographic evidence. In contrast, Al at the octahedral site (4c) is partially replaced by elements with higher atomic number: Fe, Co, and Mn (along with Ti for the natural and Ni for the synthetic stones), and the effect of such a replacement is manifested at the unit-cell level (with c/a ranging between the domain of the “octahedral beryls”) and at the atomic level (in terms of electron density at the 4c site and Al-O bond distances, Table 4 and Table 5). The similar atomic number of Mn, Fe, and Co (and Ni) does not allow any reliable discrimination among these transition metals in X-ray structure refinements, but the aggregate effect of these substituents is observable (e.g., a virtually identical Al-O2 bond distance is generated either by ~2.1·104 wt ppm of Fe or by ~1.5·104 Fe + 0.4·104 Co wt ppm).
Author Contributions
Conceptualization, G.D.G., I.A., A.Z. and L.P.; Methodology and investigation, G.D.G., I.A., A.Z., N.R., V.G., L.F. and R.L.; Writing—original draft preparation, G.D.G. and I.A.; Writing—review and editing, G.D.G., I.A., A.Z., N.R., V.G., L.F., R.L. and L.P. All authors have read and agreed to the published version of the manuscript.
Funding
G.D.G. and N.R. acknowledge the support of the Italian Ministry of Education (MIUR) through the project “Dipartimenti di Eccellenza 2018–2022—Le Geoscienze per la Società: Risorse e loro evoluzione”; R.L. acknowledges the support of the University of Milano-Bicocca through “Bando Infrastrutture di Ricerca—Edizione 2021”.
Acknowledgments
Three competent reviewers and the academic editor are thanked for the revision of the manuscript.
Conflicts of Interest
The authors declare no conflict of interest.
References
- Webster, R. Gems: Their Sources, Descriptions and Identification, 6th ed.; Butterworth-Heinemann: Oxford, UK, 2006; p. 1072. [Google Scholar]
- Adamo, I.; Gatta, G.D.; Rotiroti, N.; Diella, V.; Pavese, A. Gemmological investigation of a synthetic blue beryl: A multi-methodological study. Min. Mag. 2008, 72, 799–808. [Google Scholar] [CrossRef]
- Bragg, W.L.; West, I. The structure of beryl. Proc. R. Soc. Lond. 1926, 3A, 691–714. [Google Scholar]
- Wood, D.L.; Nassau, K. Infrared spectra of foreign molecules in beryl. J. Chem. Phys. 1967, 42, 2220–2228. [Google Scholar] [CrossRef]
- Wood, D.L.; Nassau, K. The characterization of beryl and emerald by visible and infrared absorption spectroscopy. Am. Miner. 1968, 53, 777–800. [Google Scholar]
- Morosin, B. Structure and thermal expansion of beryl. Acta Crystallogr. 1972, B28, 1899–1903. [Google Scholar] [CrossRef]
- De Almeida Sampaio Filho, H.; Sighinolfi, G.; Galli, E. Contribution to crystal chemistry of beryl. Contr. Miner. Petr. 1973, 38, 279–290. [Google Scholar] [CrossRef]
- Gibbs, G.V.; Breck, D.W.; Meagher, E.P. Structural refinement of hydrous and anhydrous beryl, Al2(Be3Si6)O18 and emerald, Al1.9Cr0.1(Be3Si6)O18. Lithos 1968, 1, 275–285. [Google Scholar] [CrossRef]
- Goldman, D.S.; Rossman, G.R.; Parkin, K.M. Channel constituents in beryl. Phys. Chem. Miner. 1978, 3, 225–235. [Google Scholar] [CrossRef]
- Hawthorne, F.C.; Černý, P. The alkali-metal position in Cs-Li beryl. Can. Miner. 1977, 15, 414–421. [Google Scholar]
- Aurisicchio, C.; Fioravanti, G.; Grubessi, O.; Zanazzi, P.F. Reapprasail of the crystal chemistry of beryl. Am. Miner. 1988, 73, 826–837. [Google Scholar]
- Sheriff, B.L.; Grundy, D.H.; Hartman, J.S.; Hawthorne, F.C.; Černý, P. The incorporation of alkalis in beryl: Multi-nuclear MAS NMR and crystal structure study. Can. Miner. 1991, 29, 271–285. [Google Scholar]
- Artioli, G.; Rinaldi, R.; Ståhl, Z.; Zanazzi, P.F. Structure refinement of beryl by single-crystal neutron and X-ray diffraction. Am. Mineral. 1993, 78, 762–768. [Google Scholar]
- Artioli, G.; Rinaldi, R.; Wilson, C.C.; Zanazzi, P.F. Single-crystal pulsed neutron diffraction of a highly hydrous beryl. Acta Crystallogr. 1995, B51, 733–737. [Google Scholar] [CrossRef]
- Kolesov, B. Vibrational states of H2O in beryl: Physical aspects. Phys. Chem. Miner. 2008, 35, 271–278. [Google Scholar] [CrossRef]
- Kolesov, B.A.; Geiger, C.A. The orientation and vibrational states of H2O in synthetic alkali-free beryl. Phys. Chem. Miner. 2000, 27, 557–564. [Google Scholar] [CrossRef]
- Černý, P.; Anderson, A.J.; Tomascak, P.B.; Chapman, R. Geochemical and morphological features of beryl from the Bikita granitic pegmatite, Zimbabwe. Can. Miner. 2003, 41, 1003–1011. [Google Scholar] [CrossRef] [Green Version]
- Andersoon, L.O. The position of H+, Li+ and Na+ impurities in beryl. Phys. Chem. Miner. 2006, 33, 403–416. [Google Scholar] [CrossRef]
- Gatta, G.D.; Nestola, F.; Bromiley, G.D.; Mattauch, S. The real topological configuration of the extra-framework content in alkali-poor beryl: A multi-methodological study. Am. Miner. 2006, 91, 29–34. [Google Scholar] [CrossRef]
- Bačík, P.; Fridrichová, J. The site occupancy assessment in beryl based on bond-length constraints. Minerals 2019, 9, 641. [Google Scholar] [CrossRef] [Green Version]
- Shigley, J.E.; Foord, E.E. Gem-quality red beryl from the Wah Wah Mountains, Utah. G&G 1984, 20, 208–221. [Google Scholar]
- Keith, J.D.; Christiansen, E.H.; Tingey, D.G. Geological and chemical conditions of formation of red beryl, Wah Wah Mountains, Utah. Utah Geol. Assoc. Publ. 1994, 23, 155–169. [Google Scholar]
- Shigley, J.E.; Thompson, T.J.; Keith, J.D. Red beryl from Utah: A review and update. G&G 2003, 39, 302–313. [Google Scholar]
- Shigley, J.E.; McClure, S.F.; Cole, J.E.; Koivula, J.I.; Lu, T.; Elen, S.; Demiantes, L.N. Hydrothermal synthetic red beryl from the Institute of Crystallography, Moscow. G&G 2001, 37, 42–55. [Google Scholar]
- Henn, U.; Milisenda, C.C. Synthetic red beryl from Russia. J. Gemm. 1999, 26, 481–486. [Google Scholar] [CrossRef]
- Nassau, K.; Wood, D.L. An examination of red beryl from Utah. Am. Miner. 1968, 53, 801–806. [Google Scholar]
- Flamini, A.; Gastaldi, L.; Grubessi, O.; Viticoli, S. Sulle caratteristiche particolari del berillo rosso dell’Utah. Gemmologia 1983, 9, 12–20. (In Italian) [Google Scholar]
- Solntsev, V.P.; Mashkovtsev, R.I. Valent state and coordination of cobalt ions in beryl and chrysoberyl crystals. Phys. Chem. Miner. 2004, 31, 1–11. [Google Scholar] [CrossRef]
- Solntsev, V.P.; Tsvetkov, E.G.; Alimpiev, A.I.; Mashkovtsev, R.I. Coordination and valent state of nickel ions in beryl and chrysoberyl crystals. Phys. Chem. Miner. 2006, 33, 300–313. [Google Scholar] [CrossRef]
- Taran, M.N.; Rossman, G.R. Optical spectra of Co2+ in three synthetic silicate minerals. Am. Mineral. 2001, 86, 889–895. [Google Scholar] [CrossRef]
- Czaja, M.; Radoslaw, L.; Chrobak, A.; Sitko, R.; Mazurak, Z. The absorption- and luminescence spectra of Mn3+ in beryl and vesuvianite. Phys. Chem. Miner. 2018, 45, 475–488. [Google Scholar] [CrossRef] [Green Version]
- Rigaku Oxford Diffraction, CrysAlisPro Software System. Rigaku Corporation. 2019. Available online: https://www.rigaku.com/products/crystallography/crysalis (accessed on 19 March 2022).
- Farrugia, L.J. WinGX suite for small-molecule single-crystal crystallography. J. Appl. Cryst. 1999, 32, 837–838. [Google Scholar] [CrossRef]
- Sheldrick, G.M. Crystal structure refinement with SHELXL. Acta Crystallogr. 2015, C71, 3–8. [Google Scholar]
- Larson, A.C. Inclusion of secondary extinction in least-squares calculations. Acta Crystallogr. 1967, 23, 664–665. [Google Scholar] [CrossRef]
- Adams, D.M.; Gardner, I.R. Single-crystal vibrational spectra of beryl and dioptase. J. Chem. Soc. Dalton Trans. 1974, 14, 1502–1505. [Google Scholar] [CrossRef]
- Kim, C.C.; Bell, M.; McKeown, D. Vibrational analysis of beryl (Be3Al2Si6O18) and its constituent ring (Si6O18). Phys. B Condens. Matter 1995, 205, 193–208. [Google Scholar] [CrossRef]
- Prencipe, M.; Noel, Y.; Civalleri, B.; Roetti, C.; Dovesi, R. Quantum-mechanical calculation of the vibrational spectrum of beryl (Al4Be6Si12O36) at the Γ point. Phys. Chem. Miner. 2006, 33, 519–532. [Google Scholar] [CrossRef]
- Aines, R.D.; Rossman, G.R. The high-temperature behaviour of water and carbon dioxide in cordierite and beryl. Am. Miner. 1984, 69, 319–327. [Google Scholar]
- Charoy, B.; de Donato, P.; Barres, O.; Pinto-Coelho, C. Channel occupancy in an alkali-poor beryl from Serra Branca (Goias, Brazil): Spectroscopic characterization. Am. Miner. 1996, 81, 395–403. [Google Scholar] [CrossRef]
- Makreski, P.; Jovanovski, G. Minerals from Macedonia XXIII. Spectroscopic and structural characterization of scholr and beryl cyclosilicates. Spectrochim. Acta Part A 2009, 73, 460–467. [Google Scholar] [CrossRef]
- Mashkovtsev, R.I.; Thomas, V.G.; Fursenko, D.A.; Zhukova, E.S.; Uskov, V.V.; Gorshunov, B.P. FTIR spectroscopy of D2O and HDO molecules in the c-axis channels of synthetic beryl. Am. Miner. 2016, 101, 175–180. [Google Scholar] [CrossRef]
- Taran, M.N.; Dyar, M.D.; Khomenko, V.M. Spectroscopic study of synthetic hydrothermal Fe3+-bearing beryl. Phys. Chem. Miner. 2017, 31, 489–496. [Google Scholar] [CrossRef]
- Hu, Y.; Lu, R. Color characteristics of blue to yellow beryl from multiple origins. G&G 2020, 56, 54–65. [Google Scholar]
- Hofmeister, A.; Hoering, T.; Virgo, D. Vibrational spectroscopy of beryllium aluminosilicates: Heat capacity calculations from band assignments. Phys. Chem. Miner. 1987, 14, 205–224. [Google Scholar] [CrossRef]
- Łodziński, M.; Sitarz, M.; Stec, K.; Kozanecki, M.; Fojud, Z.; Jurga, S. ICP, IR, Raman, NMR investigations of beryls from pegmatites of the Sudety Mts. J. Mol. Struct. 2005, 744, 1005–1015. [Google Scholar] [CrossRef]
- Aurisicchio, C.; Grubessi, O.; Zecchini, P. Infrared spectroscopy and crystal chemistry of the beryl group. Can. Miner. 1994, 32, 55–68. [Google Scholar]
- Bačík, P.; Fridrichová, J.; Uher, P.; Rybár, S.; Bizovská, V.; Luptákovás, J.; Vrábliková, D.; Pukančik, L.; Vaculovič, T. Octahedral substitution in beryl from weakly fractionated intragranitic pegmatite Predné Solisko, Tatry Mountains (Slovakia): The indicator of genetic conditions. J. Geosci. 2019, 64, 59–72. [Google Scholar] [CrossRef]
- Hagemann, H.; Lucken, A.; Bill, H.; Gysler-Sanz, J.; Stalder, H.A. Polarized Raman spectra of beryl and bazzite. Phys. Chem. Miner. 1990, 17, 395–401. [Google Scholar] [CrossRef]
- Christiansen, E.; Keith, J.; Thompson, T. Origin of gem red beryl in Utah’s Wah Wah Mountains. Min. Engin. 1997, 49, 37–41. [Google Scholar]
- Fridrichová, J.; Bačík, P.; Ertl, A.; Wildner, M.; Dekan, J.; Miglierini, M. Jahn-Teller distortion of Mn3+-occupied octahedra in red beryl from Utah indicated by optical spectroscopy. J. Mol. Struct. 2018, 1152, 79–86. [Google Scholar] [CrossRef]
- Taran, M.N.; Vyshnevskyi, O.A. Be, Fe2+-substitution in natural beryl: An optical absorption spectroscopy study. Phys. Chem. Miner. 2019, 46, 795–806. [Google Scholar] [CrossRef]
- Knop, O.; Reid, K.I.G.; Sutarno; Nakagawa, Y. Chalkogenides of the transition elements. VI. X-Ray, neutron, and magnetic investigation of the spinels Co3O4, NiCo2O4, Co3S4, and NiCo2S4. Can. J. Chem. 1968, 46, 3463–3476. [Google Scholar] [CrossRef] [Green Version]
- Rinaldi, R.; Gatta, G.D.; Knight, K.S.; Geiger, C.; Artioli, G. Crystal chemistry, cation ordering and thermoelastic behaviour of CoMgSiO4 olivine at high temperature as studied by in-situ neutron powder diffraction. Phys. Chem. Miner. 2005, 32, 655–664. [Google Scholar] [CrossRef]
- Gatta, G.D.; Hradil, K.; Meven, M. Where is the hydrogen? Elements 2021, 17, 163–168. [Google Scholar] [CrossRef]


Publisher’s Note: MDPI stays neutral with regard to jurisdictional claims in published maps and institutional affiliations. |
© 2022 by the authors. Licensee MDPI, Basel, Switzerland. This article is an open access article distributed under the terms and conditions of the Creative Commons Attribution (CC BY) license (https://creativecommons.org/licenses/by/4.0/).