Article

Automated Quantitative Characterization REE Ore Mineralogy from the Giant Bayan Obo Deposit, Inner Mongolia, China

1
State Key Laboratory of Continental Dynamics, Department of Geology, Northwest University, Xi’an 710069, China
2
Technology Innovation Transfer Chamber, BIC Brno (Podnikatelské a Inovační Centrum), 61200 Brno, Czech Republic
3
Institute of Mining Engineering, Inner Mongolia University of Science and Technology, Baotou 014000, China
*
Author to whom correspondence should be addressed.
Minerals 2022, 12(4), 426; https://doi.org/10.3390/min12040426
Submission received: 31 January 2022 / Revised: 23 March 2022 / Accepted: 28 March 2022 / Published: 30 March 2022
(This article belongs to the Special Issue Ore Mineralogy and Geochemistry of Rare Metal Deposits)

Abstract

:
Rare earth elements (REEs) are considered critical elements in modern society due to their irreplaceable role in new innovative and energy technologies. The giant carbonatite-related Bayan Obo deposit contributes most REE resources in the world’s market, while its origin is still unclear because of the complicated and diverse REE ore mineralogy and texture. Thescanning electron mircroscopy SEM)-based automated mineralogy allows for the numeric assessment of rocks and ores’ compositional and textural properties. Here, we use TIMA (TESCAN Integrated Mineral Analyzer) to quantitatively characterize REE ore mineralogy from the deep drill core within the H8 unit (“dolomite marble”) to better understand the deposit. The mineral composition, occurrence, and Ce elemental deportment of the borehole ores at different depths (i.e., 1107 m, 1246 m, 1406 m, 1546 m, and 1682 m) were obtained. The results show that the main types of ores in the investigated samples can be divided into banded REE-Fe ores, banded REE ores, disseminated REE-Fe ores, and veined REE ores. REE and gangue minerals vary significantly in abundance and occurrence. Monazite-(Ce) and bastnäsite-(Ce) are the primary REE host minerals, and both contribute the most to the REE budget. Other REE minerals, such as parisite-(Ce)/synchysite-(Ce), cerite-(Ce), huanghoite-(Ce)/cebaite-(Ce), and aeschynite-(Ce), are significant contributors. The gangue minerals generally include fluorite, barite, magnetite, pyrite, quartz, magnesio-arfvedsonite, and minerals of the biotite and apatite groups, among others. Combined with the newly published mineral-scale chronological and isotopic geochemical analyses, it is reasonable to conclude that the later hydrothermal fluids remobilized and redistributed the original Mesoproterozoic carbonatitic REE minerals and formed a high variable ore mineral assemblage. Furthermore, it is demonstrated that the mineralogical study using TIMA can provide accurate and reliable mineralogy data for the comprehensive interpretation of the complex REE ores, and extend our understanding of the deposit.

1. Introduction

Rare earth elements (REEs—the lanthanides plus Y and Sc) have been the subject of significant international interest because of their application in the development of “low carbon” technologies and are widely considered critical elements—that is, they combine geopolitical supply limitations with essential applications of specific technologies. The market demand for REEs is expected to multiply in the future. Although REEs are relatively abundant in the earth’s crust, deposits with economic concentration levels are less common than for most other ores. China, Vietnam, Brazil, the United States, Russia, India, and Australia constitute the most significant percentage of the world’s rare earth economic resources, according to the 2021 report by the United States Geological Survey [1].
China currently has 34% of REE reserves in the world [1], as represented by the world’s largest REE resource in the Bayan Obo deposit. The giant Bayan Obo REE-Nb-Fe deposit is situated at the northern margin of the North China Craton (NCC), adjacent to the Central Asian Orogenic Belt (Figure 1a) [2,3,4]. The deposit is an exceptional rare earth element (REE) resource, especially in light rare earth elements (LREE). It is the largest REE deposit worldwide, with more than 48 million tons of REE reserves at mean grades of 6 wt. % REE2O3 (total abundance of rare earth oxides) [5,6]. Notably, the Nb (niobium) reserve of the deposit reaches the world’s second rank behind Brazil’s weathered carbonatitic profiles [7], and it is also a producer of iron ore.
Strongly influenced by hydrothermal reworking and multifold deformation and metamorphism, a geochemical indicator of the whole rock and monomineral alone cannot accurately trace its origin mineralization and, therefore, result in various genetic understandings in the orebody. Thus, detailed reports on the mineralogy of the Bayan Obo orebody, particularly complex mineral species, associations, and grain size, are scarce and in urgent demand to date. Many mineralogy parameters in ore samples, such as mineral composition and assemblage, can reflect their ore-forming features and genesis to a great degree [3,8]. However, the REE ores from Bayan Obo show various mineral compositions and small grain sizes, as well as complex dissemination characteristics and associations with other minerals. Ore mineralogy is predominantly investigated by traditional optical microscopy and scanning electron microscopy (SEM). These methods are relatively low in efficiency and time consuming when dealing with complicated metal mineralogy. Therefore, the mineralogical information they provide is usually incomplete, fragmented, and lacks quantitative information [9,10,11,12], hindering a comprehensive understanding of the ores. Although automated mineralogy was initially used to focus on process mineralogy research, it is now widely applicable in variously complicated geological samples [13,14,15,16,17] and accumulating some specific mineral databases (such as in rare-earth deposits). Therefore, the rapid and accurate analysis of the complex mineralogical characteristics (e.g., mineral texture, composition, and granular size distribution) of the ores from the Bayan Obo deposit has become possible.
In this paper, we use TIMA (TESCAN Integrated Mineral Analyzer) technology to quantitatively characterize the REE ores from deep drill samples of the Bayan Obo deposit. The borehole ore samples are from the Eastern orebody within the H8 unit (“dolomite marble”) and have a depth of up to 1776 m. The brief mineralogy of the borehole ores was previously investigated by Song et al. [18]. These drill ore samples could provide deep mineralization information, which is poorly known for the deposit. The borehole samples with typical REE mineralization were selected for mineralogical analysis. Based upon the high-precision and high-quality mineralogical dataset provided by TIMA, we present in detail the REE mineralization types with emphasis on the mineral abundance, paragenetic assemblage, texture, and REE elemental distribution for the deep drilling ore samples. These data provide a better understanding of the characteristics of the ore-forming processes responsible for REE mineralization.

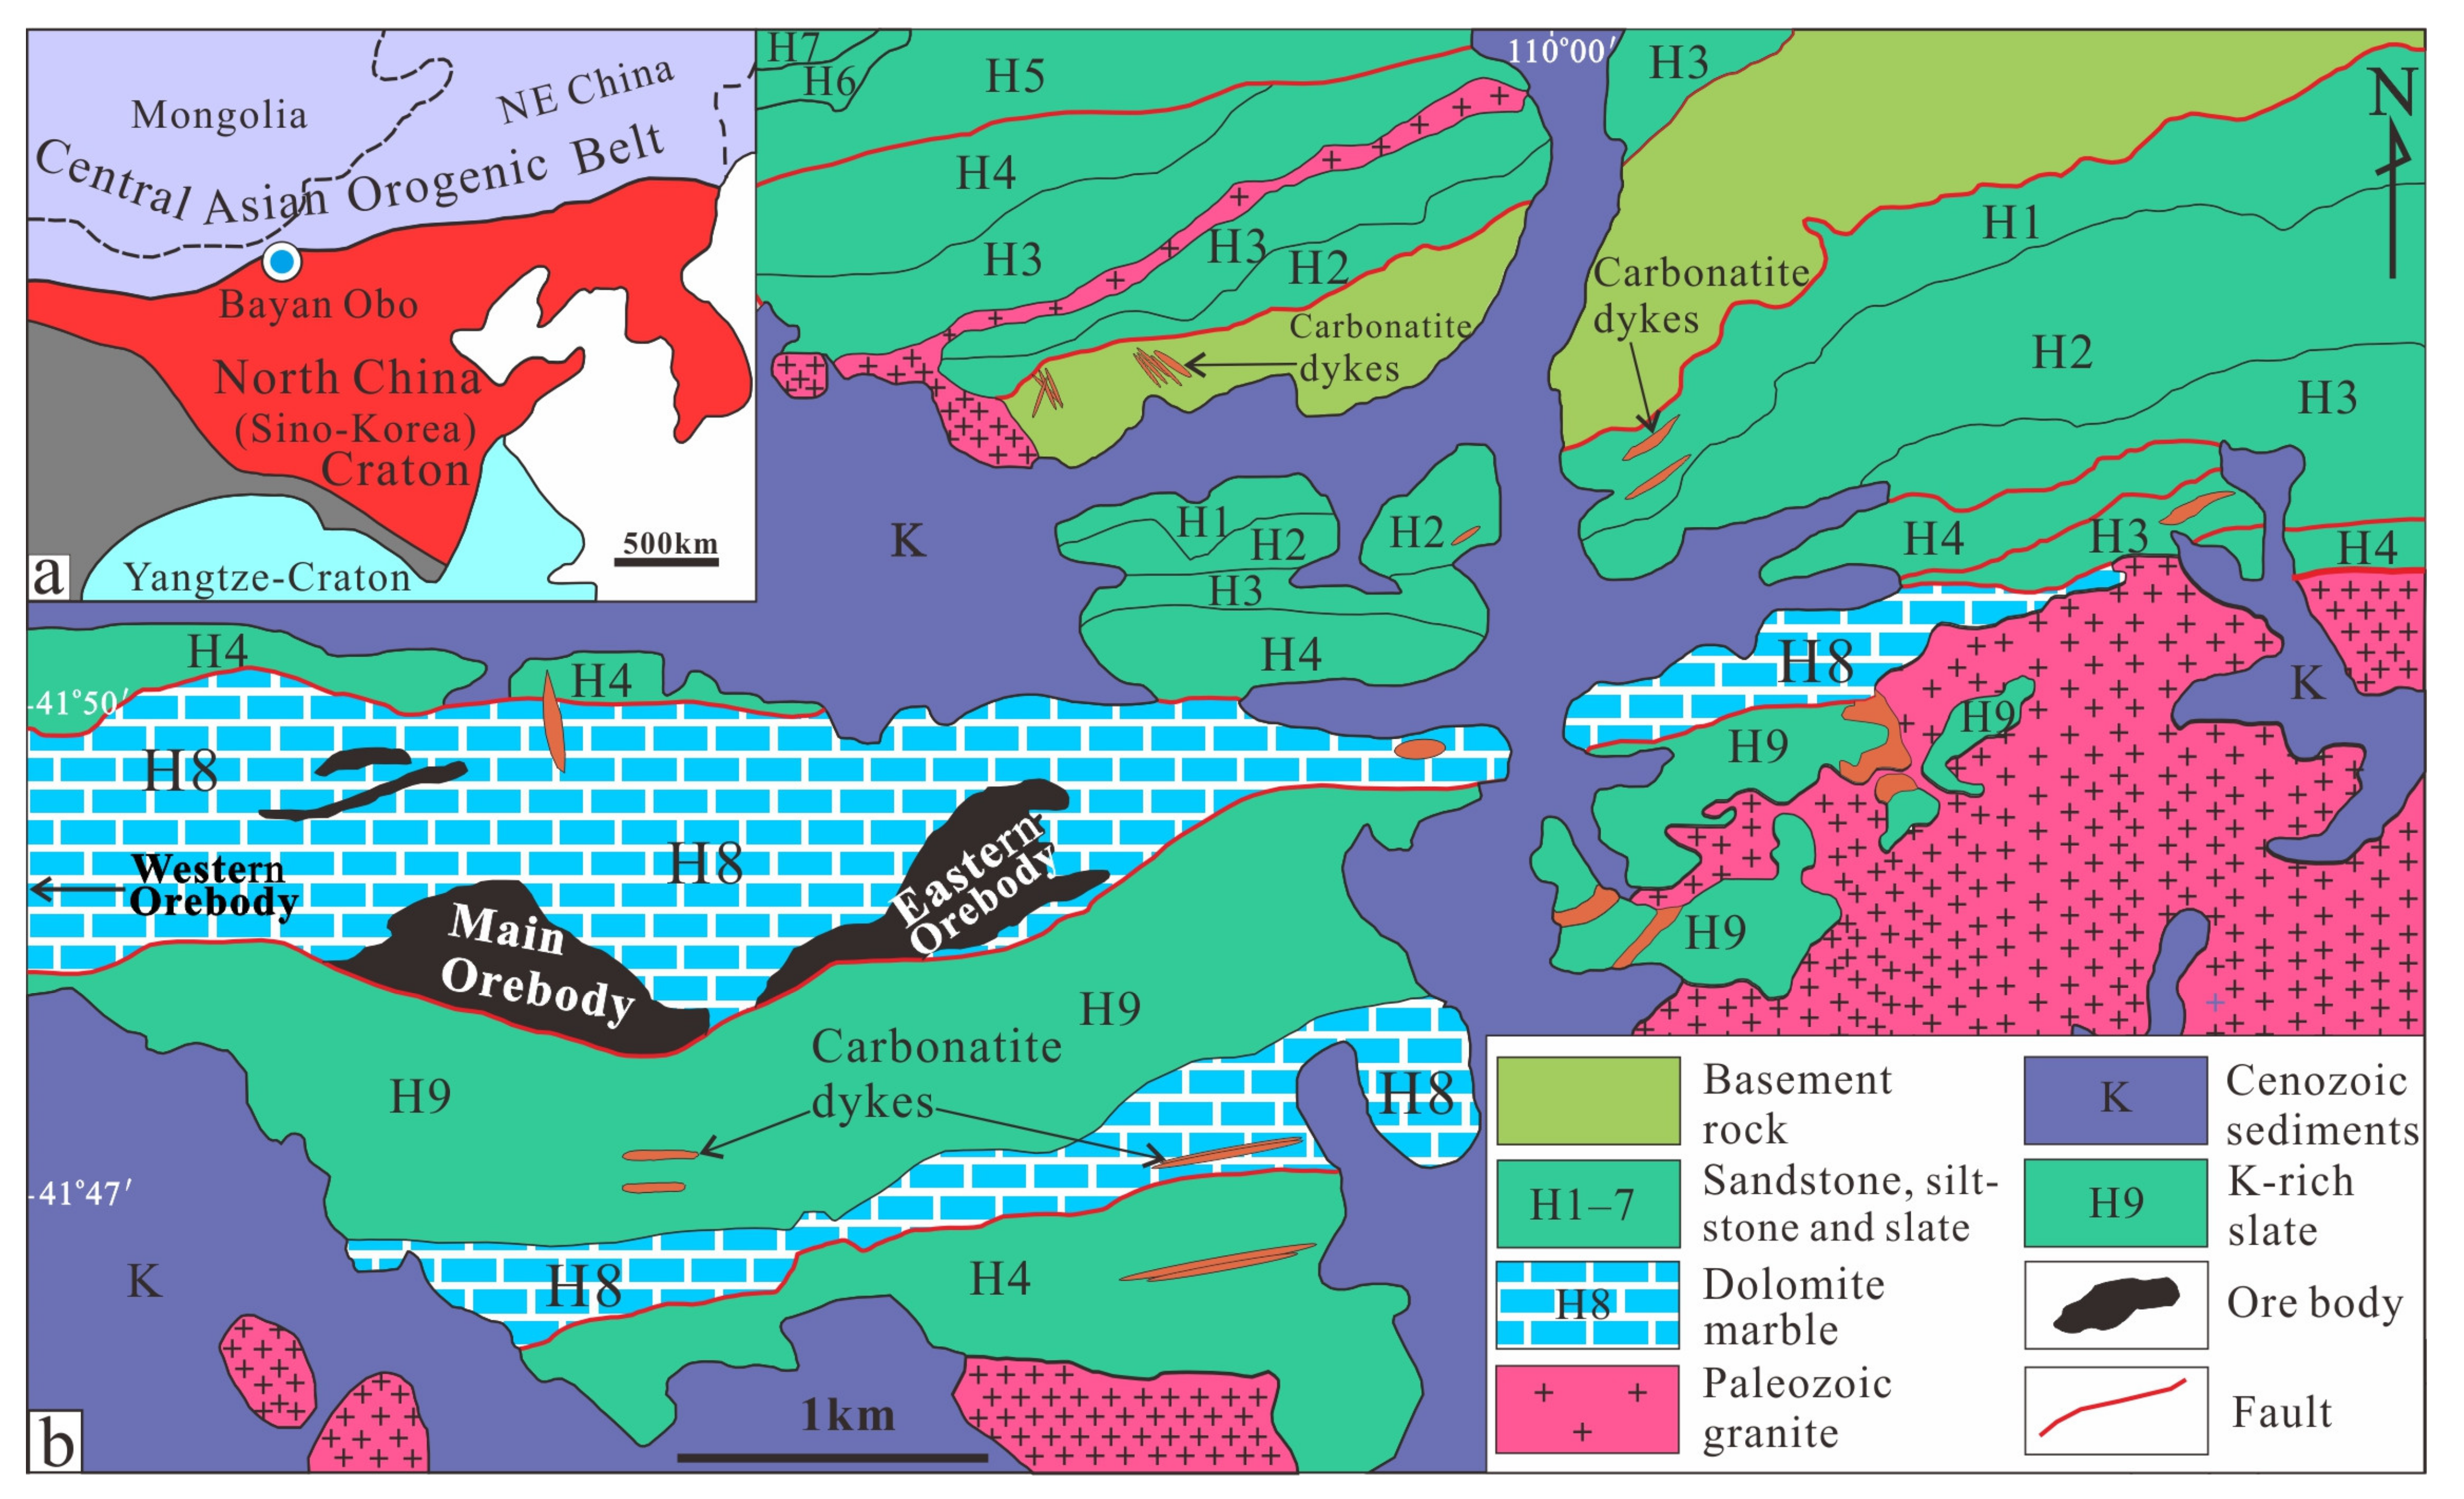
2. Geological Context

The Bayan Obo deposit (109°59′ E; 41°48′ N) is situated ca. 150 km north of Baotou City, Inner Mongolia, China. Geologically, the deposit is located on the northern margin of the North China Craton (NCC), bordered by the southern part of the Central Asian Orogenic Belt (CAOB) (Figure 1a). The regional geological setting, evolution, and geological characteristics of this deposit are described in detail in previous studies [19,20,21,22]. In general, the crystalline basement in this area comprises Archean–Paleoproterozoic metamorphic complexes consisting of gneiss, migmatite, granodiorite, syenite, etc. The zircon U-Pb geochronology study suggests that basement complexes show two prominent peak ages at ca. 2.5 Ga and ca. 1.9–2.0 Ga [23,24]. A thick sequence of the Mesoproterozoic unconformably covers the basement to Neoproterozoic sediments of the Bayan Obo Group [6,25,26,27]. Due to multiple tectonic events in the region, a series of NE-, NW-, and EW-striking faults are formed.
The Bayan Obo deposit is hosted by the Proterozoic Bayan Obo Group, divided into 18 different lithologic units named H1 to H18 in ascending chronological order. The Bayan Obo Group is a low-grade metamorphic rock sequence composed predominantly of slate, sandstone, limestone, siltstone, and dolomite. The ore-hosting rock is primarily the H8 dolomite marble unit (a few small-scale orebodies are hosted in the H9 unit). Meanwhile, the strike of the H8 unit occurs in the nearly EW-trending (Figure 1b) [2,3,4], mainly occurring in the Bayan Obo syncline [26].
The ore deposit comprises three portions: Main Orebody, Eastern Orebody (Figure 1b), and Western Orebody [3,4]. It should be mentioned that the ore-controlling structure is still not clear due to the highly regional deformation and metamorphism. It is suggested that a Bayan syncline controls the distribution of the ores, and the Main and Eastern orebodies occur in the north limb of the syncline [7]. However, recent deep-drilling exploration work demonstrates that the syncline is probably nonexistent [4]. These orebodies are present in the strata of the spindle-shaped stratiform body and extend for 18 km from west to east, covering approximately 48 km2. The Eastern Orebody and Main Orebody are distributed between the ore-bearing H8 dolomite marble unit and the K-rich H9 slate unit (Figure 1b). The scale of the mineralization and ore reserve of the West Orebody is significantly less than that of the Main Orebody and Eastern Orebody [3,4].
There is no unified classification scheme for the ore types exposed in the Bayan Obo deposit. An early classification proposed by IGCAS (Institute of Geochemistry, Chinese Academy of Sciences, Guiyang, China) [28] has been widely used by many researchers, where all ore types are classified into nine main types: massive Nb-REE-Fe ore, banded Nb-REE-Fe ore, aegirine-type Nb-REE-Fe ore, riebeckite-type Nb-REE-Fe ore, dolomite-type Nb-REE-Fe ore, aegirine-type Nb-REE ore, dolomite-type Nb-REE ore, diopside-type Nb ore, and biotite-type Nb-REE-Fe ore. The economic ore minerals are mainly monazite-(Ce), REE fluorocarbonate minerals (e.g., bastnäsite-(Ce) and parisite-(Ce), columbite-(Fe), aeschynite-(Ce), hematite, and magnetite). The gangue minerals consist of aegirine, fluorite, alkali amphibole, quartz, barite, etc.
It is noted that there are over 100 diverse carbonatite dykes occurring in the Bayan Obo deposit nearby, some of which emplace into the basement rock, whereas others intrude into the lower Bayan Obo Group (Figure 1b) [29,30]. Carbonatites can be divided into ferrocarbonatite, magnesiocarbonatite, and calciocarbonatite [30]. The REE concentrations in these carbonatite dykes are incredibly heterogeneous, ranging from hundreds of ppm to 20 wt. %. From ferrocarbonatite to magnesiocarbonatite, the REE content increases. Calciocarbonatite is the most enriched in REEs [30,31,32].

3. Samples and Methods

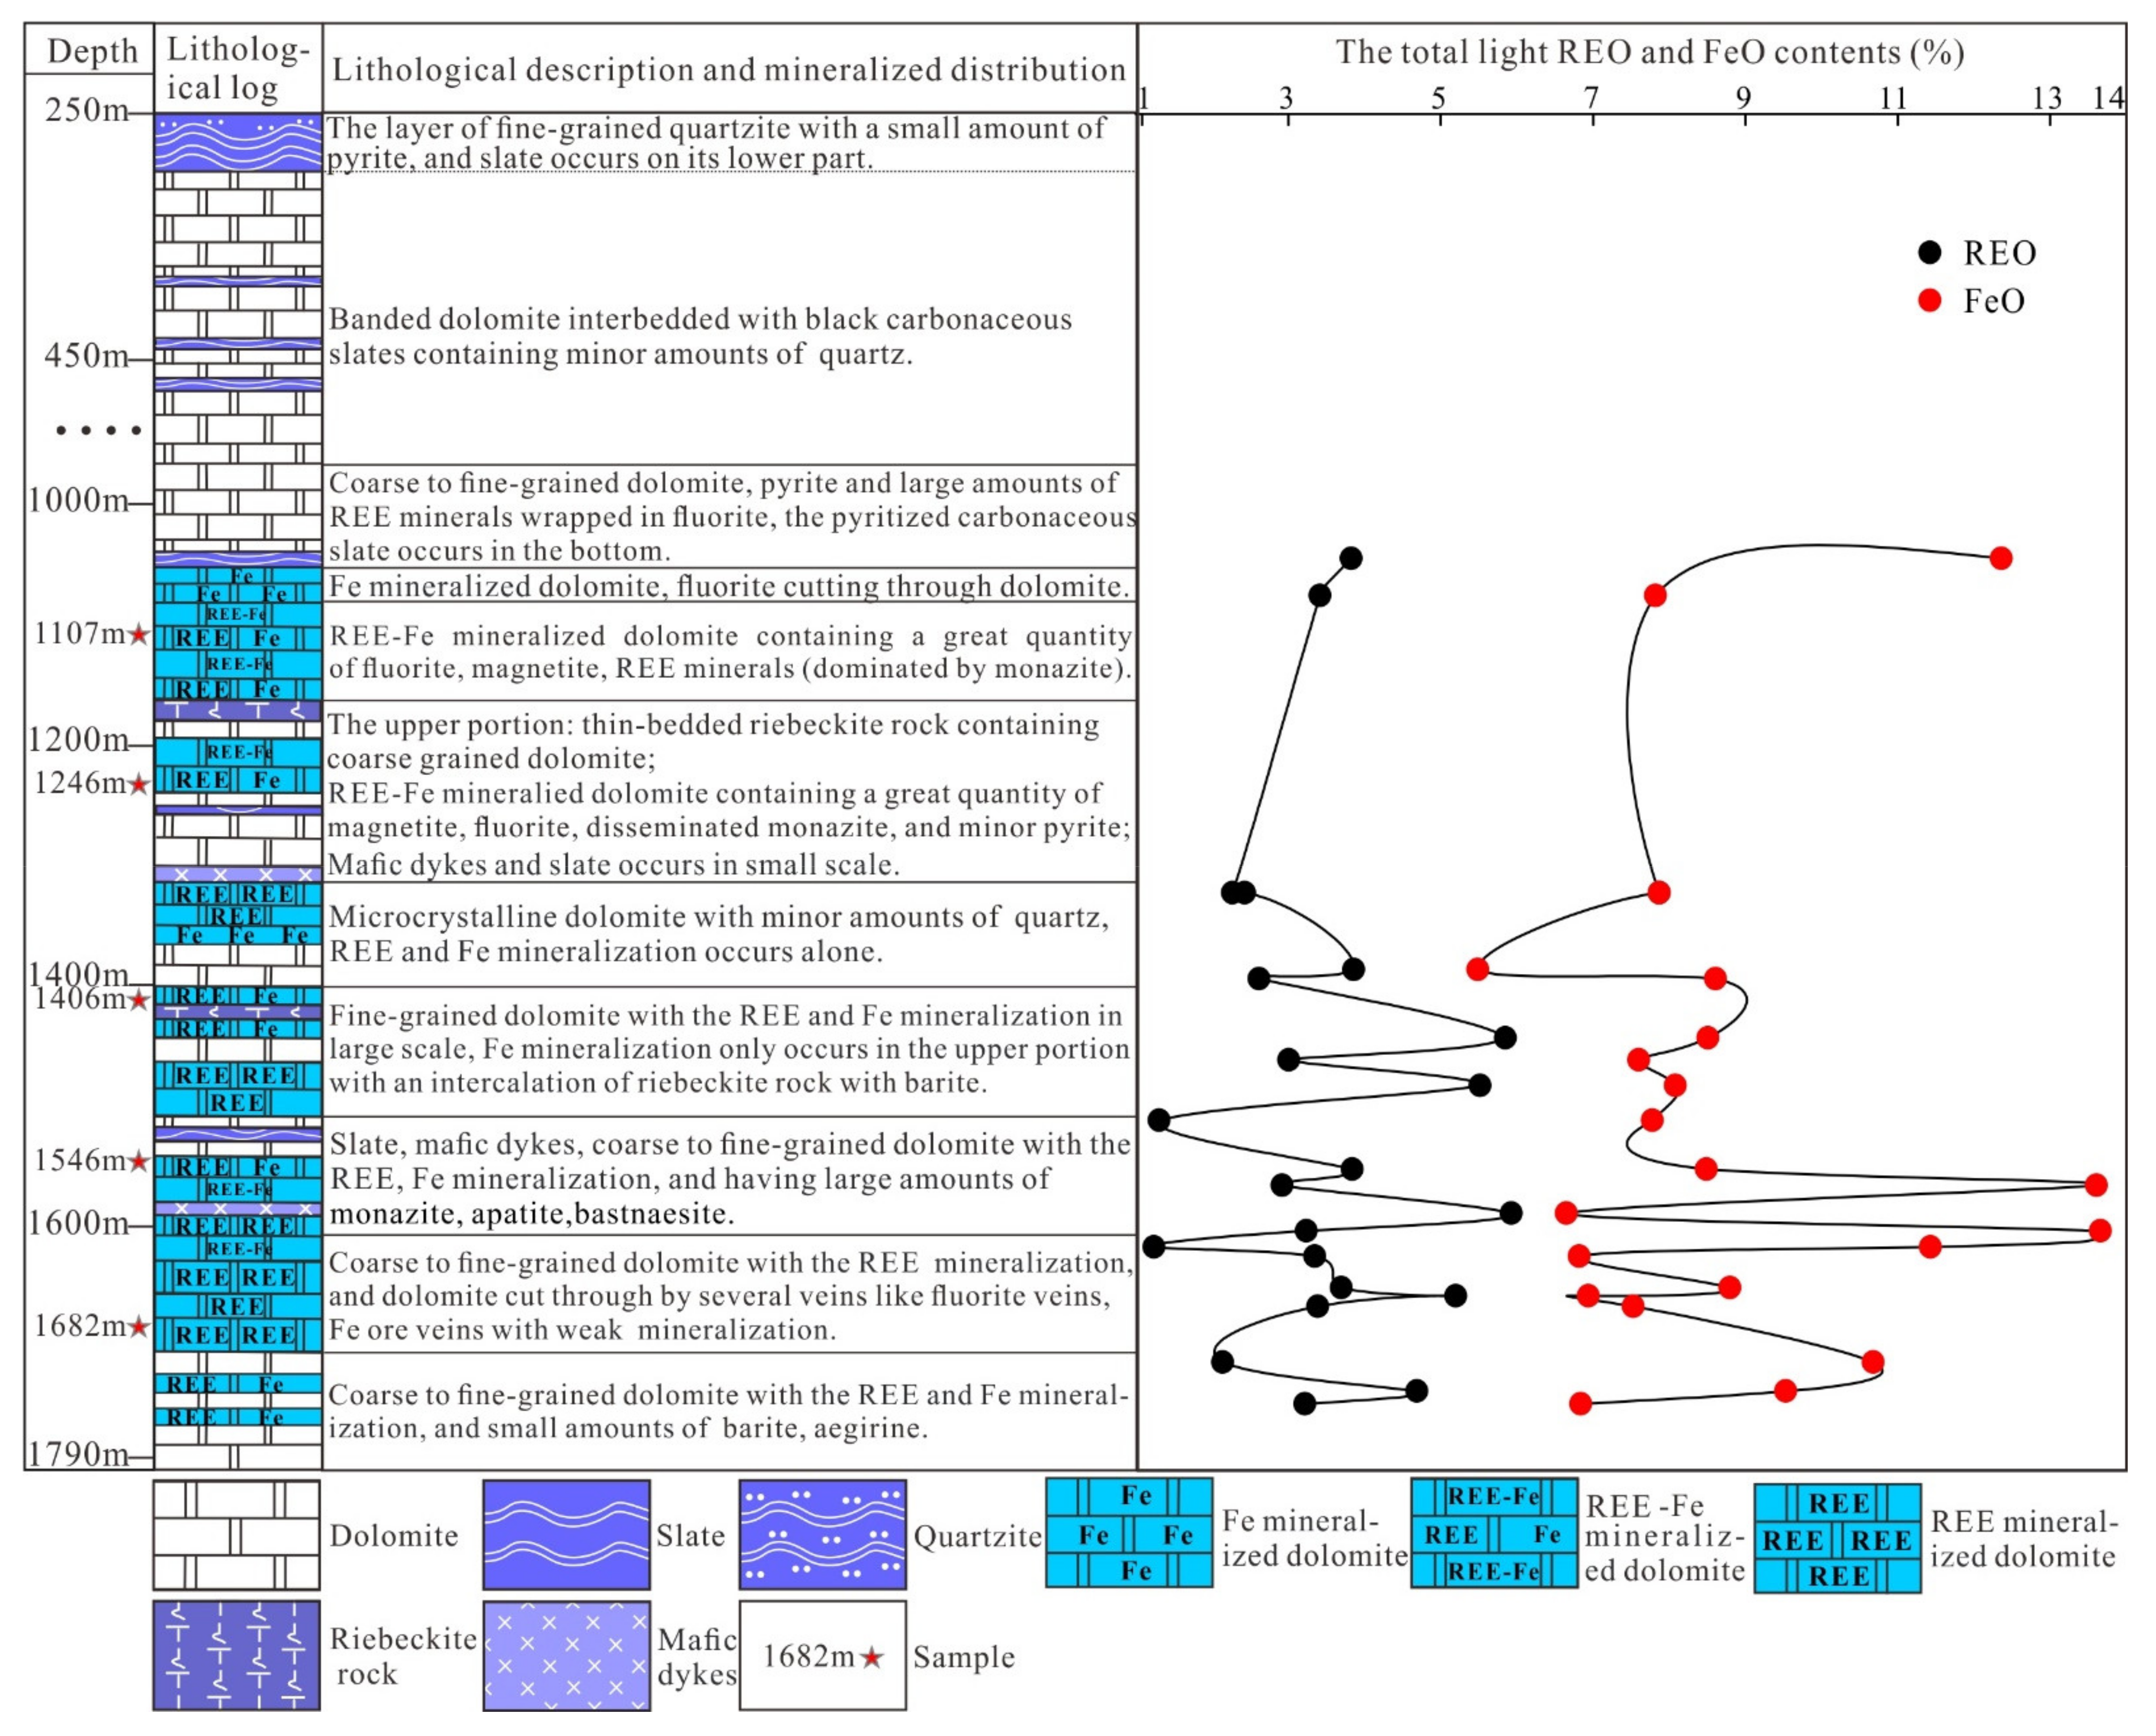
3.1. Sample Collection

Previous research focused on the Bayan Obo deposit was based on ore samples obtained from the upper–middle part of the ore body, while there are very few reports concerning the ore samples collected from the deep part of the ore body. In this study, more than 20 drill core samples were collected from the Eastern Orebody borehole at a depth of 1776 m, as described previously by Song et al. [18]. The lithology of the borehole mainly consists of fine- to coarse-grained dolomite (related to igneous genesis) and a small number of mafic dykes, quartzite, and carbonaceous slate. A detailed description of the borehole samples is shown in Figure 2.
According to Song et al. [18], the drill core showed significant REE2O3 concentration variations, reaching up to 5.8 wt. %, indicating significant REE resources in the deep. REE and Fe mineralization were heterogeneously distributed in the borehole, and these two types of mineralization were presented independently in most cases. We chose six drill core samples with typical REE mineralization, using a TESCAN Integrated Mineral Analyzer (TIMA) to characterize the REE ore mineralogy quantitatively. These cores were extracted from depths of about 1107 m, 1246 m, 1406 m, 1546 m, and 1682 m, respectively.

3.2. Automated Mineralogy (TIMA) Analysis

Before automated mineralogical analyses, these REE ore samples were prepared as well-polished thin sections and carbon-coated under vacuum. The mineralogical studies were carried out using the new generation of the fully automated quantitative mineral analysis system, namely TESCAN Integrated Mineral Analyzer (TIMA, with modal of TIMA3 X GHM), at the State Key Laboratory of Continental Dynamics, Department of Geology, Northwest University, China. The TIMA system comprises a TESCAN MIRA-3 SEM equipped with four high-throughput energy dispersive spectral (EDAX Element 30) silicon-drift detectors, two back-scattered electron BSE) detectors (one inside the lens and another in the chamber), two secondary electrons (SE) detectors, a color cathodoluminescence (CL) detector, and TIMA software (detailed Supplementary Materials Figure S1). Nine thin section samples of ca. 47 mm × 27 mm in size or 22 epoxy resin blocks with a diameter of 25 mm can be placed into the chamber of the TIMA system at one time and carried out the mineralogical analysis. In addition, the basic information of nearly 5000 known species of minerals, such as chemical composition and compositional spectra, can be easily found in the TIMA offline software database.
The TIMA analysis could accurately, quickly, and automatically determine the mineral composition, mineral assemblage, elemental deportment, elemental distribution, and mineral texture of the sample by combining the analysis of energy-dispersive X-ray spectral and back-scattered electron images [10]. The analysis process is outlined herein. First, the BSE image and energy dispersive spectral (EDS) spectrum data obtained by the SEM are used to differentiate the boundaries of different mineral phases. The collected spectroscopic data of the particular mineral is then compared with the TIMA classification scheme (a built-in comprehensive mineral database) to identify its mineral species. The mineral spectra in the database were taken from the previously measured sample or calculated from stoichiometry values. Finally, all the minerals’ EDS and graphic data will be summarized, counted, and automatically calculated to form modal mineralogy and false-colored digital images created by TIMA software. The false-colored digital mineral image can directly and better display the mineral textures and mineral phase than the gray presentation by the SEM BSE images. In this work, the TIMA analysis was operated with a 25 kV acceleration voltage using a spot size of 77 nm, a fixed sample current of 9 nA, a high vacuum, and a 15-mm working distance. In addition, a dot mapping analysis model was applied because of its relatively high efficiency and accuracy. In this model, BSE imaging is first acquired at high resolution, and the image is used to detect boundaries between different phases. Each phase is covered by a lower-resolution mesh of X-ray points. The elements and EDS spectral lines used for the analysis and identification of the minerals are listed in Table 1. In our analysis, each point of an X-ray collection was 1000 counts with BSE pixel spacing of 3 μm and EDS dot spacing of 9 μm. During measurement, the relatively low-count spectra scan a thin section in a few hours. The TIMA system has a patented spectrum similarity zonation algorithm that combines all the low-count spectra within a mineral grain to create a single high-count and statistically reliable spectrum. This combined spectrum is an excellent average for the mineral, is easy to classify, and can be used directly to determine the mineral composition. Furthermore, correcting the current and back-scattered electron signal intensity was conducted at a platinum standard and a Faraday cup, whereas the EDS signal used an Mn standard sample. A more detailed description of the instrumentation and its applications can be found in [10].

4. Results

4.1. Summary of the Quantitative Mineralogy of the Studied REE Ores

The summary of mineral modal compositions and calculated Ce deportment of the studied REE ores given by TIMA software are listed in Table 1 and Table 2 and graphically shown in Figure 3. The results show that the mineralogy of deep drill core samples is mainly ferruginous dolomite [abbreviated as dolomite-(Fe) in this work], magnetite/hematite, fluorite, monazite-(Ce), apatite, quartz, biotite, bastnäsite-(Ce), magnesio-riebeckite, pyrite, ilmenite, etc. The most important industrial REE minerals are predominantly monazite-(Ce) and bastnäsite-(Ce), as previous works reported (see summary by [21,33,34]), and small amounts of parisite-(Ce)/synchysite-(Ce), huanghoite-(Ce)/cebaite-(Ce), cerite-(Ce), and aeschynite-(Ce). Due to similar chemical composition, minerals, such as magnetite and hematite, parisite and synchysite, and huanghoite and cebaite, cannot be distinguished in this study. The automated mineralogical system predominantly uses EDS spectra for phase identification. We set very low counts (1000) in this study to quickly acquire the data. Therefore, the tiny difference between the above mineral pairs will not be noticed, and the result of the phase assignment is uncertain. The problem could be solved when the counts were at least 10,000, but it takes much more time. Therefore, we will group the mentioned mineral pairs, such as parisite/synchysite, in the text in our case. It should be noted that the TIMA found a few low-abundance minerals, such as parisite, cerite, and Nb-rich minerals (such as columbite, fersmite) (Table 1 and Figure 3). However, traditional optical microscopic and SEM technologies are usually difficult to identify these minerals.
In the Bayan Obo deposit, REE mineralization is always accompanied by Fe mineralization, mainly in the form of magnetite (sometimes altered to hematite). Monazite-(Ce) and bastnäsite-(Ce) are the primary REE hosts, and both of them contribute to the majority of REE budgets of the whole rock (Table 2 and Figure 3). In addition, other REE minerals, such as parisite-(Ce)/synchysite-(Ce), cerite-(Ce), huanghoite-(Ce)/cebaite-(Ce), and aeschynite-(Ce), are significant contributors. Gangue minerals generally include biotite, fluorite, apatite, barite, magnetite, pyrite, quartz, and magnesio-arfvedsonite.
The REE behavior from the shallowest to the deepest is a function of the abundance of these REE mineral species deposited at each level, among which monazite and bastnäsite stand out. The TIMA system could identify and quantify all REE-bearing phases in the studied ores, as presented in Table 1 and Figure 3. TIMA could also evaluate the distribution of REEs between an individual or different REE minerals (elemental deportment) among the ores. The value of the elemental deportment is calculated according to the mass of an element (e.g., Ce) in a phase (e.g., monazite) analyzed by the EDS and it’s corresponding phase percent in all phases. Cerium is the most abundant in light rare earth (LREE) minerals, such as monazite and bastnäsite. Based on the TIMA Ce elemental deportment (Table 2 and Figure 3), there is complicated Ce element deportment in these drill cores. For example, in the 1107 m sample, 88.18% of the total Ce abundance was distributed into monazite, 6.26% in huanghoite/cebaite, 3.49% in bastnäsite, and the rest in cerite, aeschynite, and fersmite (Table 2). On the contrary, most (76.86%) of the Ce is in bastnäsite in the sample of 1406 m, and the monazite only takes 8.86% of total Ce. Cerite and parisite/synchysite have 7.75% and 6.42% Ce, respectively.
The mineral association function of TIMA shows a spatial relation between different mineral phases inside a sample. The TIMA software determines associations using the proportion of the shared perimeter length of all grains. Given that monazite and bastnäsite are the most common REE minerals, their mineral associations are shown in Figure 4.

4.2. Description of the REE Ore Mineralogy from Different Depths

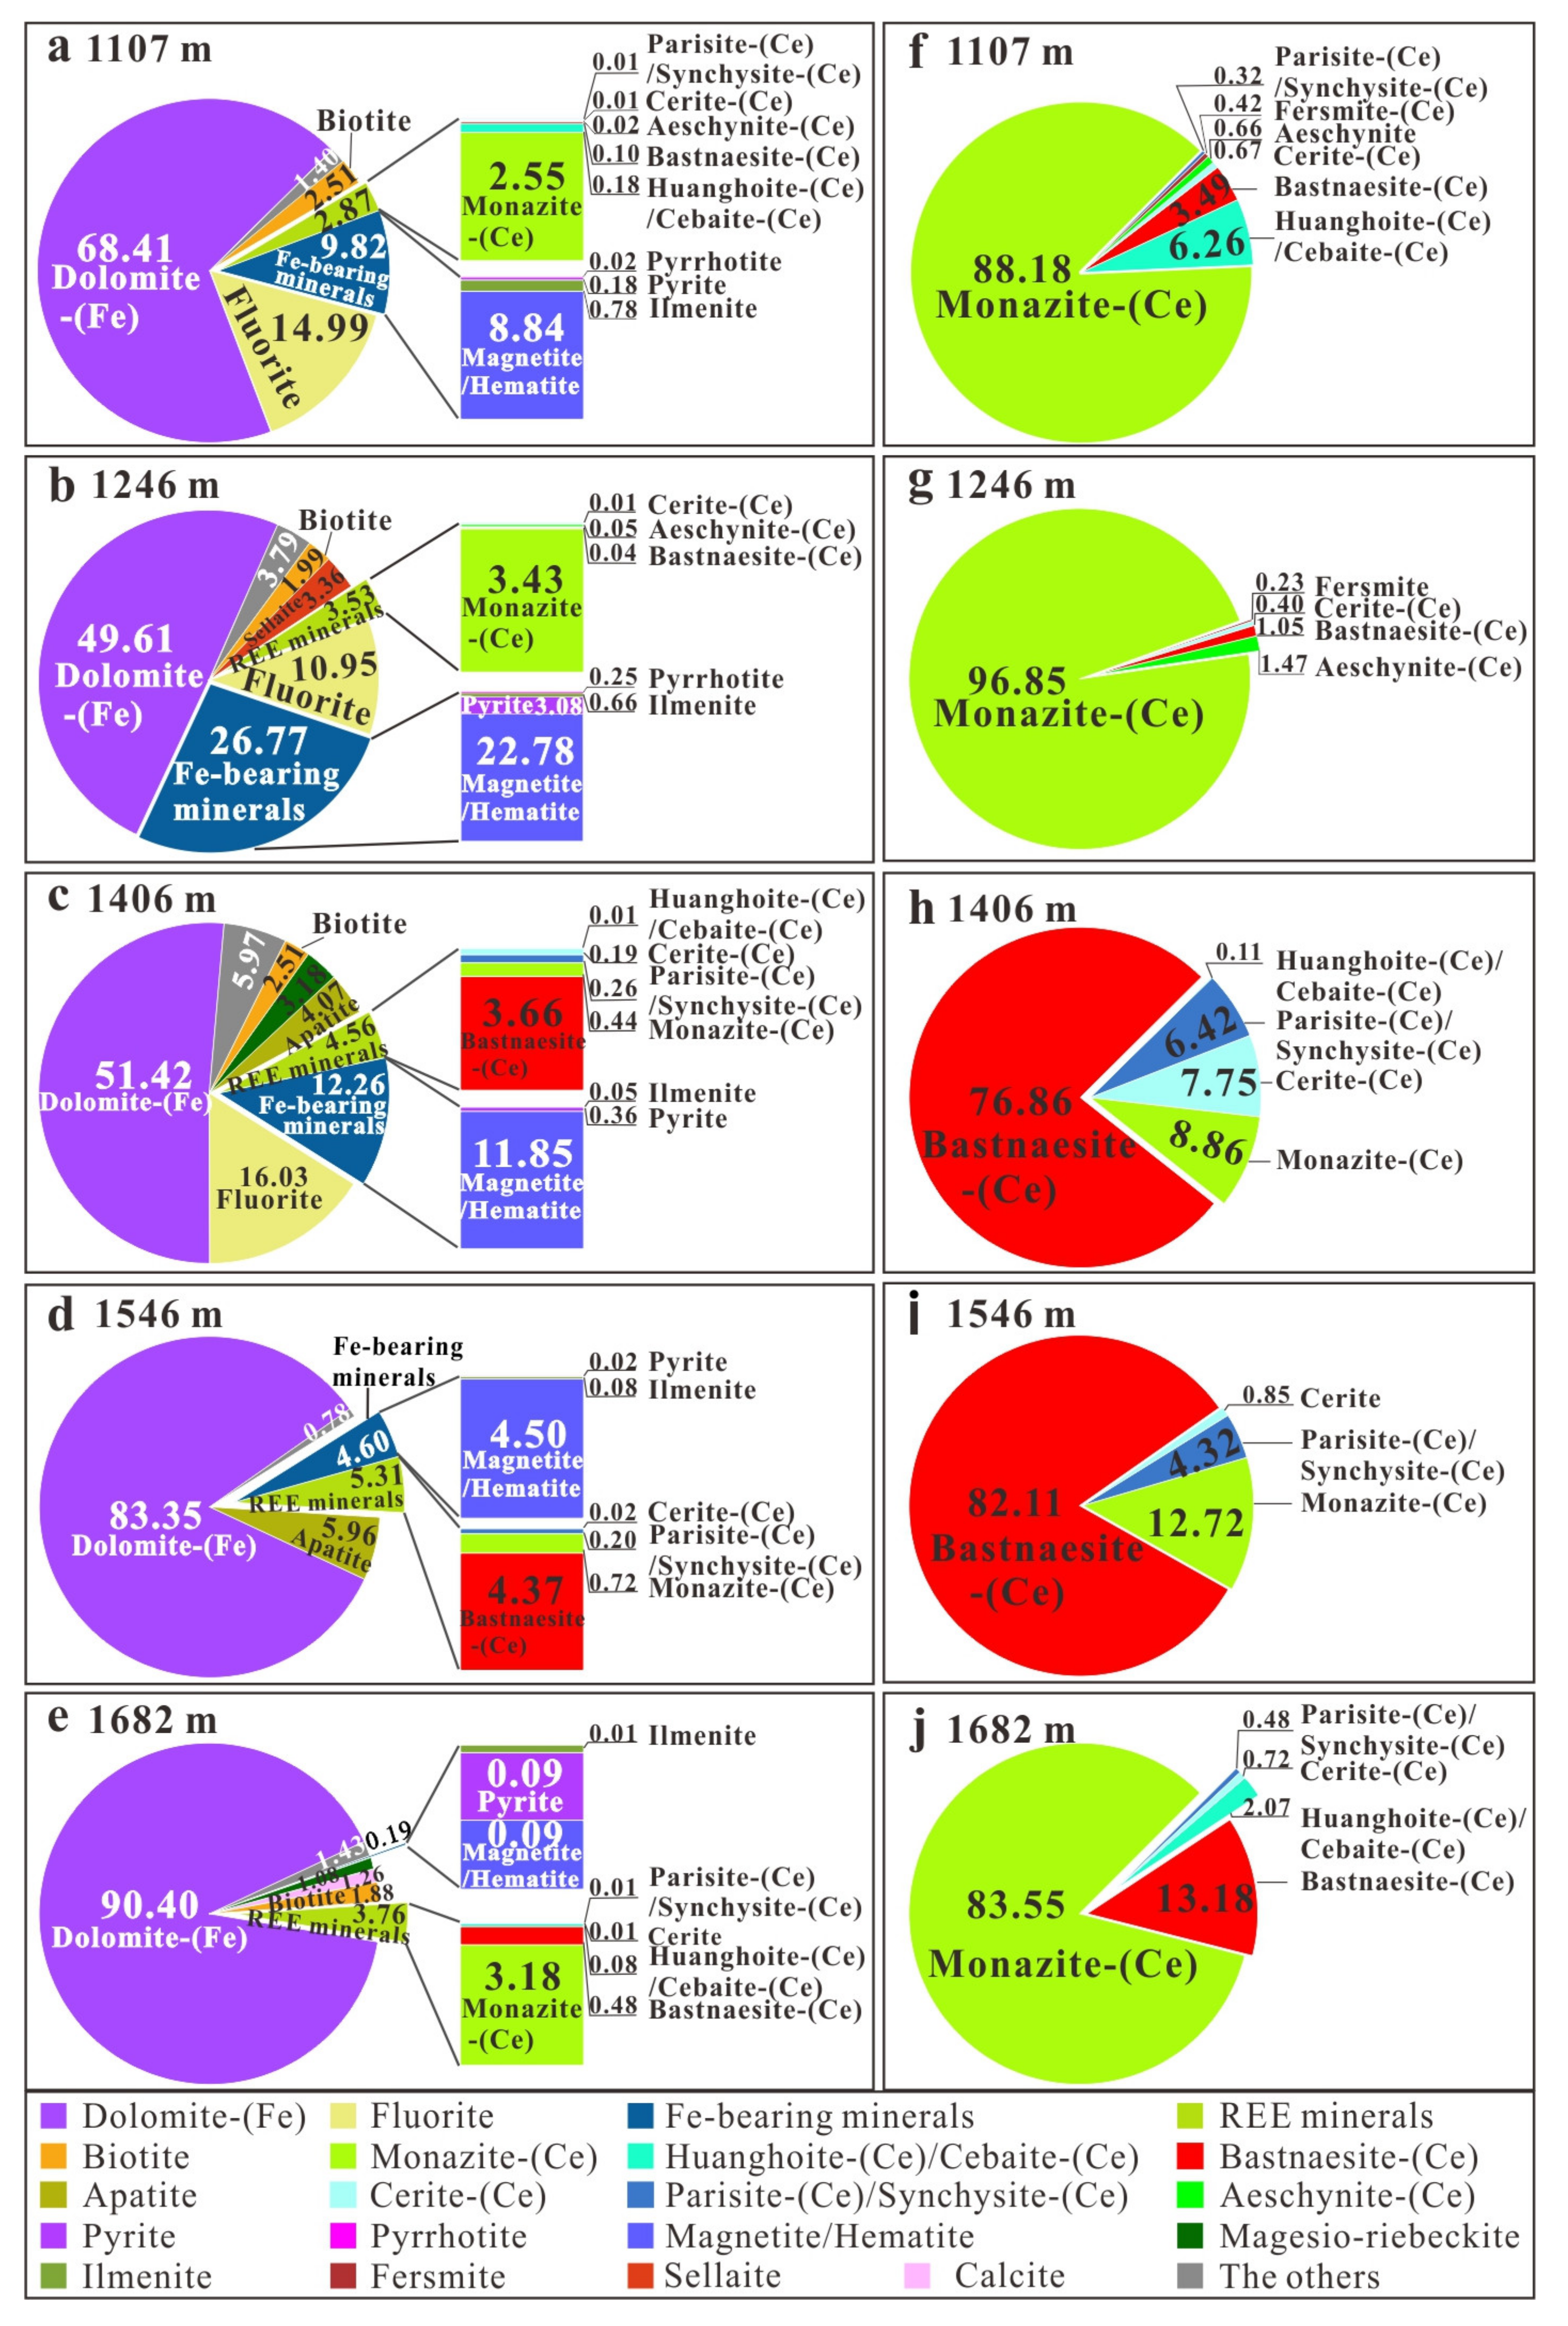
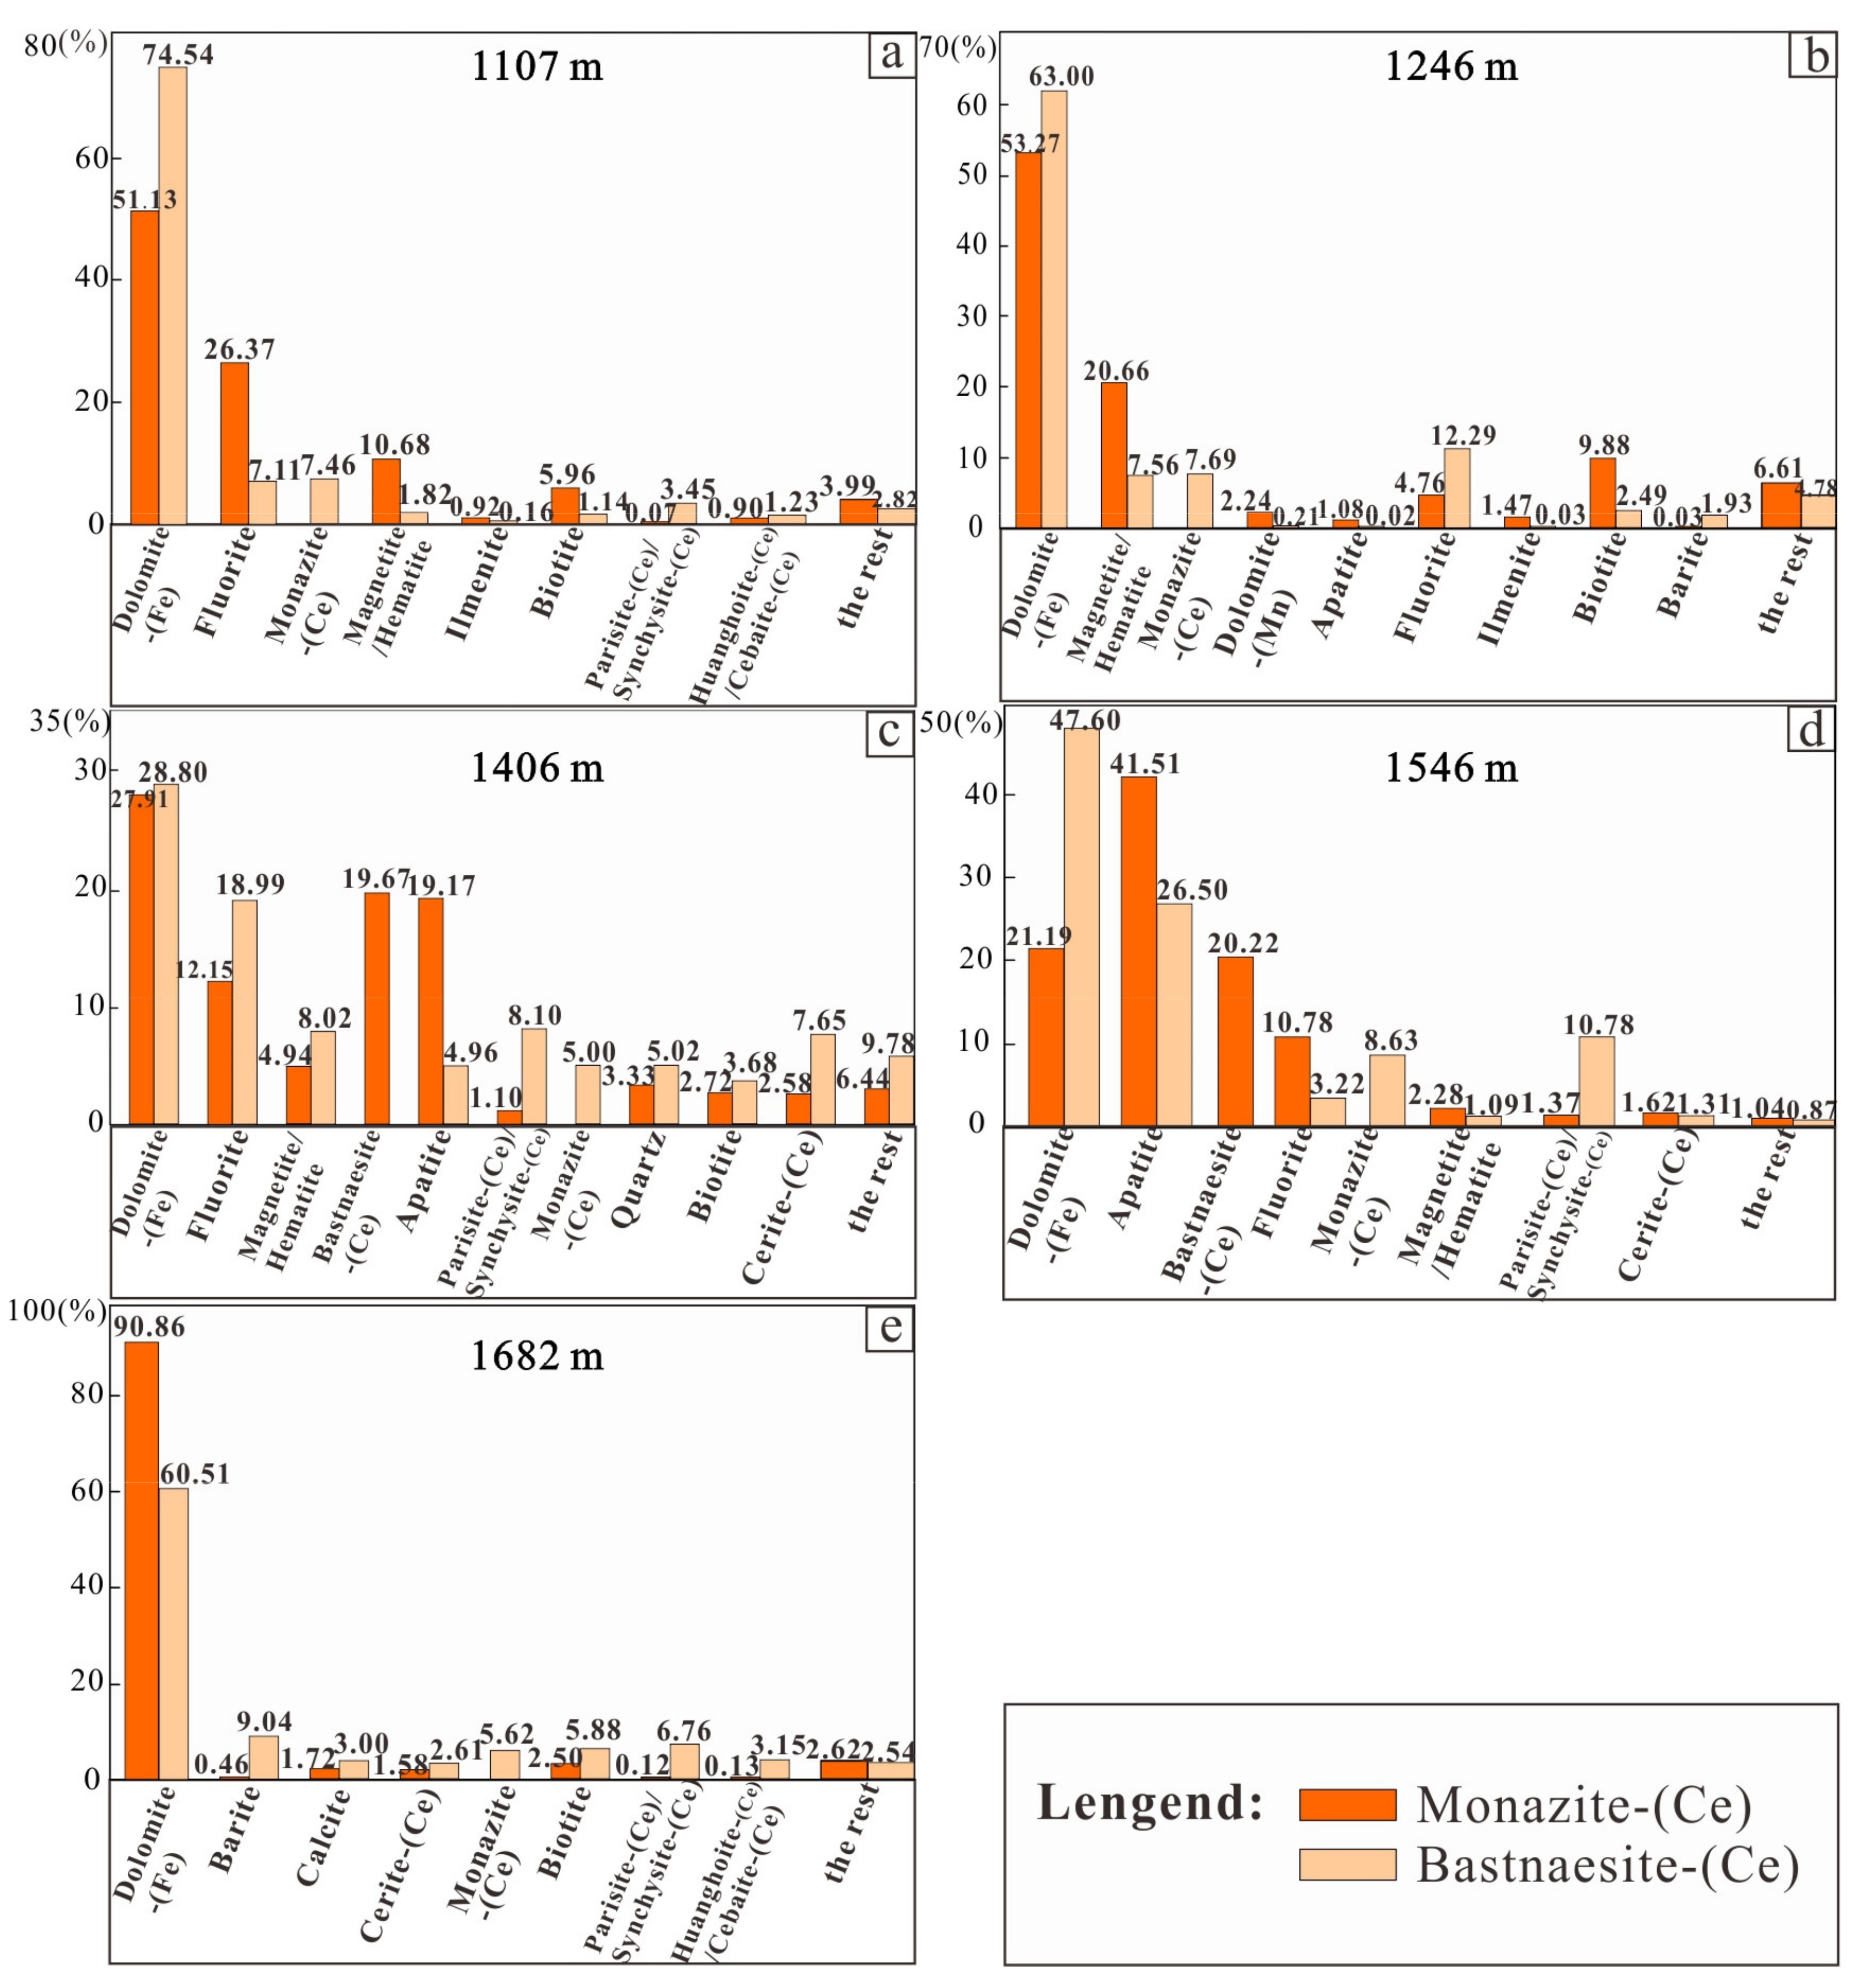
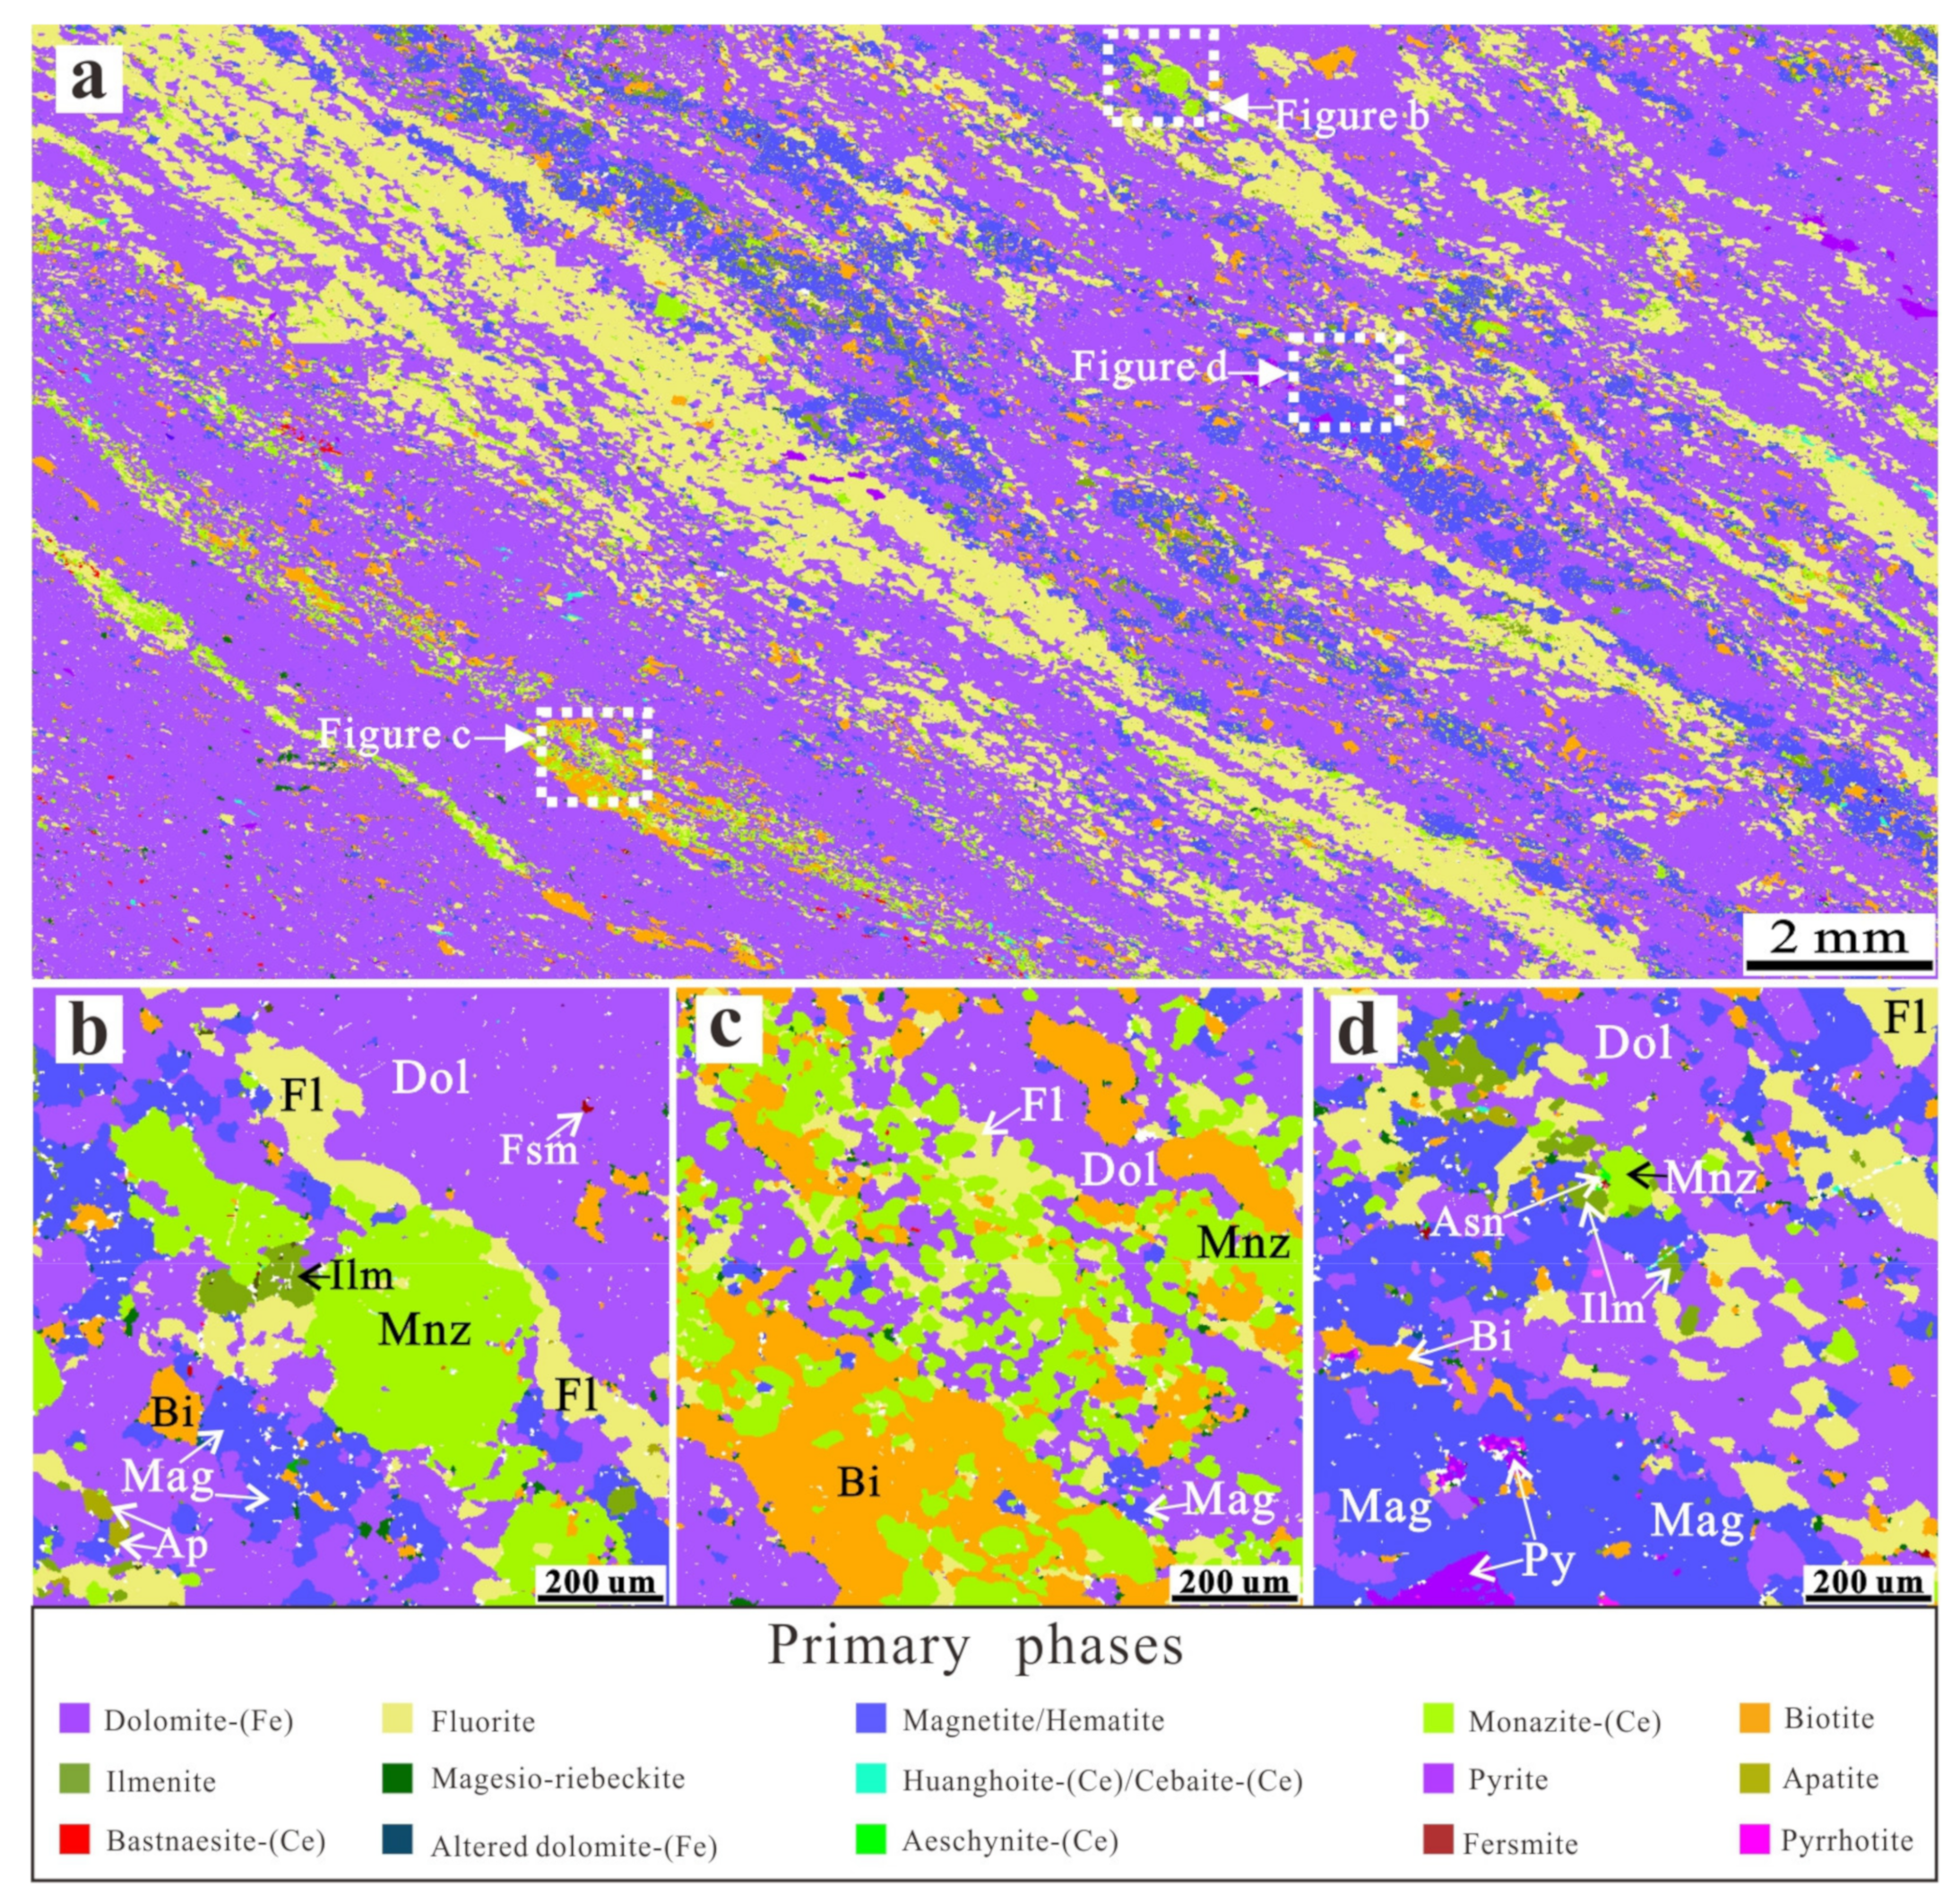
4.2.1. Sample 1107 m

The overall TIMA phase map reveals that the REE mineralization at 1107 m is mainly characterized by banded REE-Fe ores (Figure 5a). Apart from dolomite-(Fe), other major mineral phases in ores comprise Fe-bearing minerals, rare earth minerals, and fluorite. They all occur as vein-like aggregates with a preferred orientation. The mineral modal composition analyzed by TIMA is as follows (Table 1 and Figure 3a): dolomite-(Fe) accounting for 68.41%, fluorite at 14.99%, Fe-bearing minerals, including magnetite, hematite, ilmenite, pyrite, and pyrrhotite, making up 9.82%, REE minerals, including monazite-(Ce), huanghoite-(Ce), bastnäsite-(Ce), aeschynite-(Ce), cerite-(Ce) and parisite-(Ce), 2.87%, biotite (2.51%) and the others, such as apatite, magnesio-riebeckite attaining an accumulated modal volume of 1.40%.
In this sample, the subhedral to anhedral magnetite (identified based on the SEM images) is the most abundant mineral among the Fe-bearing minerals. Its grain size is relatively coarse (Figure 5). The REE minerals are chiefly subhedral to anhedral monazite-(Ce) and their grain size is uneven (Figure 5b–d) with lengths of several to 300 μm. Moreover, a small amount of other REE minerals, such as bastnäsite-(Ce) and huanghoite-(Ce), have also been detected unevenly distributed in the dolomite matrix-(Fe). It can be seen from Figure 3f that Ce element mainly concentrated up to 88.18% in veined-like monazite-(Ce). In contrast, only small amounts of Ce are endowed in huanghoite-(Ce), bastnäsite-(Ce), cerite-(Ce), parisite-(Ce), and niobium-bearing minerals.
The REE mineralization occurs in the studied ores mainly as hydrothermal overprints of the dolomite-(Fe) matrix. The ore-hosted rock of the Bayan Obo deposit is dolomite-(Fe), and dolomite-(Fe) commonly appears in matrix minerals. In the 1107 m sample, the monazite-(Ce) (51.13%) and bastnäsite-(Ce) (74.57%) show the closest association with the dolomite-(Fe) (Figure 4a), indicating that most of these two minerals appear as independent mineral or mineral aggregates. Besides dolomite-(Fe), monazite-(Ce) is mainly associated with fluorite (26.37%) and magnetite (10.68%), as well as biotite (5.96%). However, the amount of bastnäsite-(Ce) is minor in this sample, and the mineral tends to be associated with monazite-(Ce) (7.46%), followed by fluorite (7.11%) and parisite-(Ce) (3.45%).

4.2.2. Sample 1246 m

The TIMA phase map shows that the ore mineralogy in this sample is represented by both disseminated and banded REE- and Fe- mineralization (Figure 6a). The disseminated or banded metal mineral aggregates occur in the dolomite matrix. In addition, the quantitative mineral compositios comprise dolomite-(Fe) (49.61%), iron-bearing minerals (magnetite, hematite, pyrite, ilmenite, and pyrrhotite, with a total modal percentage of 26.77%), fluorite (10.95%), rare earth minerals (monazite-(Ce), aeschynite-(Ce), bastnäsite-(Ce) and cerite-(Ce), 3.53%), biotite (1.99%), and sellaite (3.36%), as well as the others (such as sphalerite, fersmite, accounting for 3.79%) (Table 1 and Figure 3b).
Iron mineralization is strong compared to the other ores studied in this work. Magnetite distributes as disseminated, patchy, and banded aggregates within the dolomite-(Fe) matrix (Figure 6a). The rare earth minerals mostly exhibit disseminated or irregular veined textures (Figure 6b), with monazite-(Ce) the most abundant mineral. The proportion of Ce elements occurring in the monazite-(Ce) is up to 96.85%. Only minor amounts of Ce are distributed in other REE-bearing minerals, including aeschynite-(Ce) (1.47%), bastnäsite-(Ce) (1.05%), cerite-(Ce) (0.40%), and fersmite (0.23%) (Table 1 and Figure 3g).
The paragenetic relationships of rare earth minerals with other minerals (Figure 4b) show that monazite-(Ce) is generally coexistent with iron-bearing minerals (20.66%), followed by biotite (9.88%) and fluorite (4.76%). In comparison, bastnäsite-(Ce) preferred to coexist with fluorite (up to 12.29%), monazite-(Ce) (7.69%), and iron-bearing minerals (7.56%). Compared with the banded ores of 1107 m, the principal mineral species, modal compositions, and coexistent mineral assemblages in this sample do not change significantly, suggesting that they are likely to be derived from the same phase of mineralization, only with different output states.

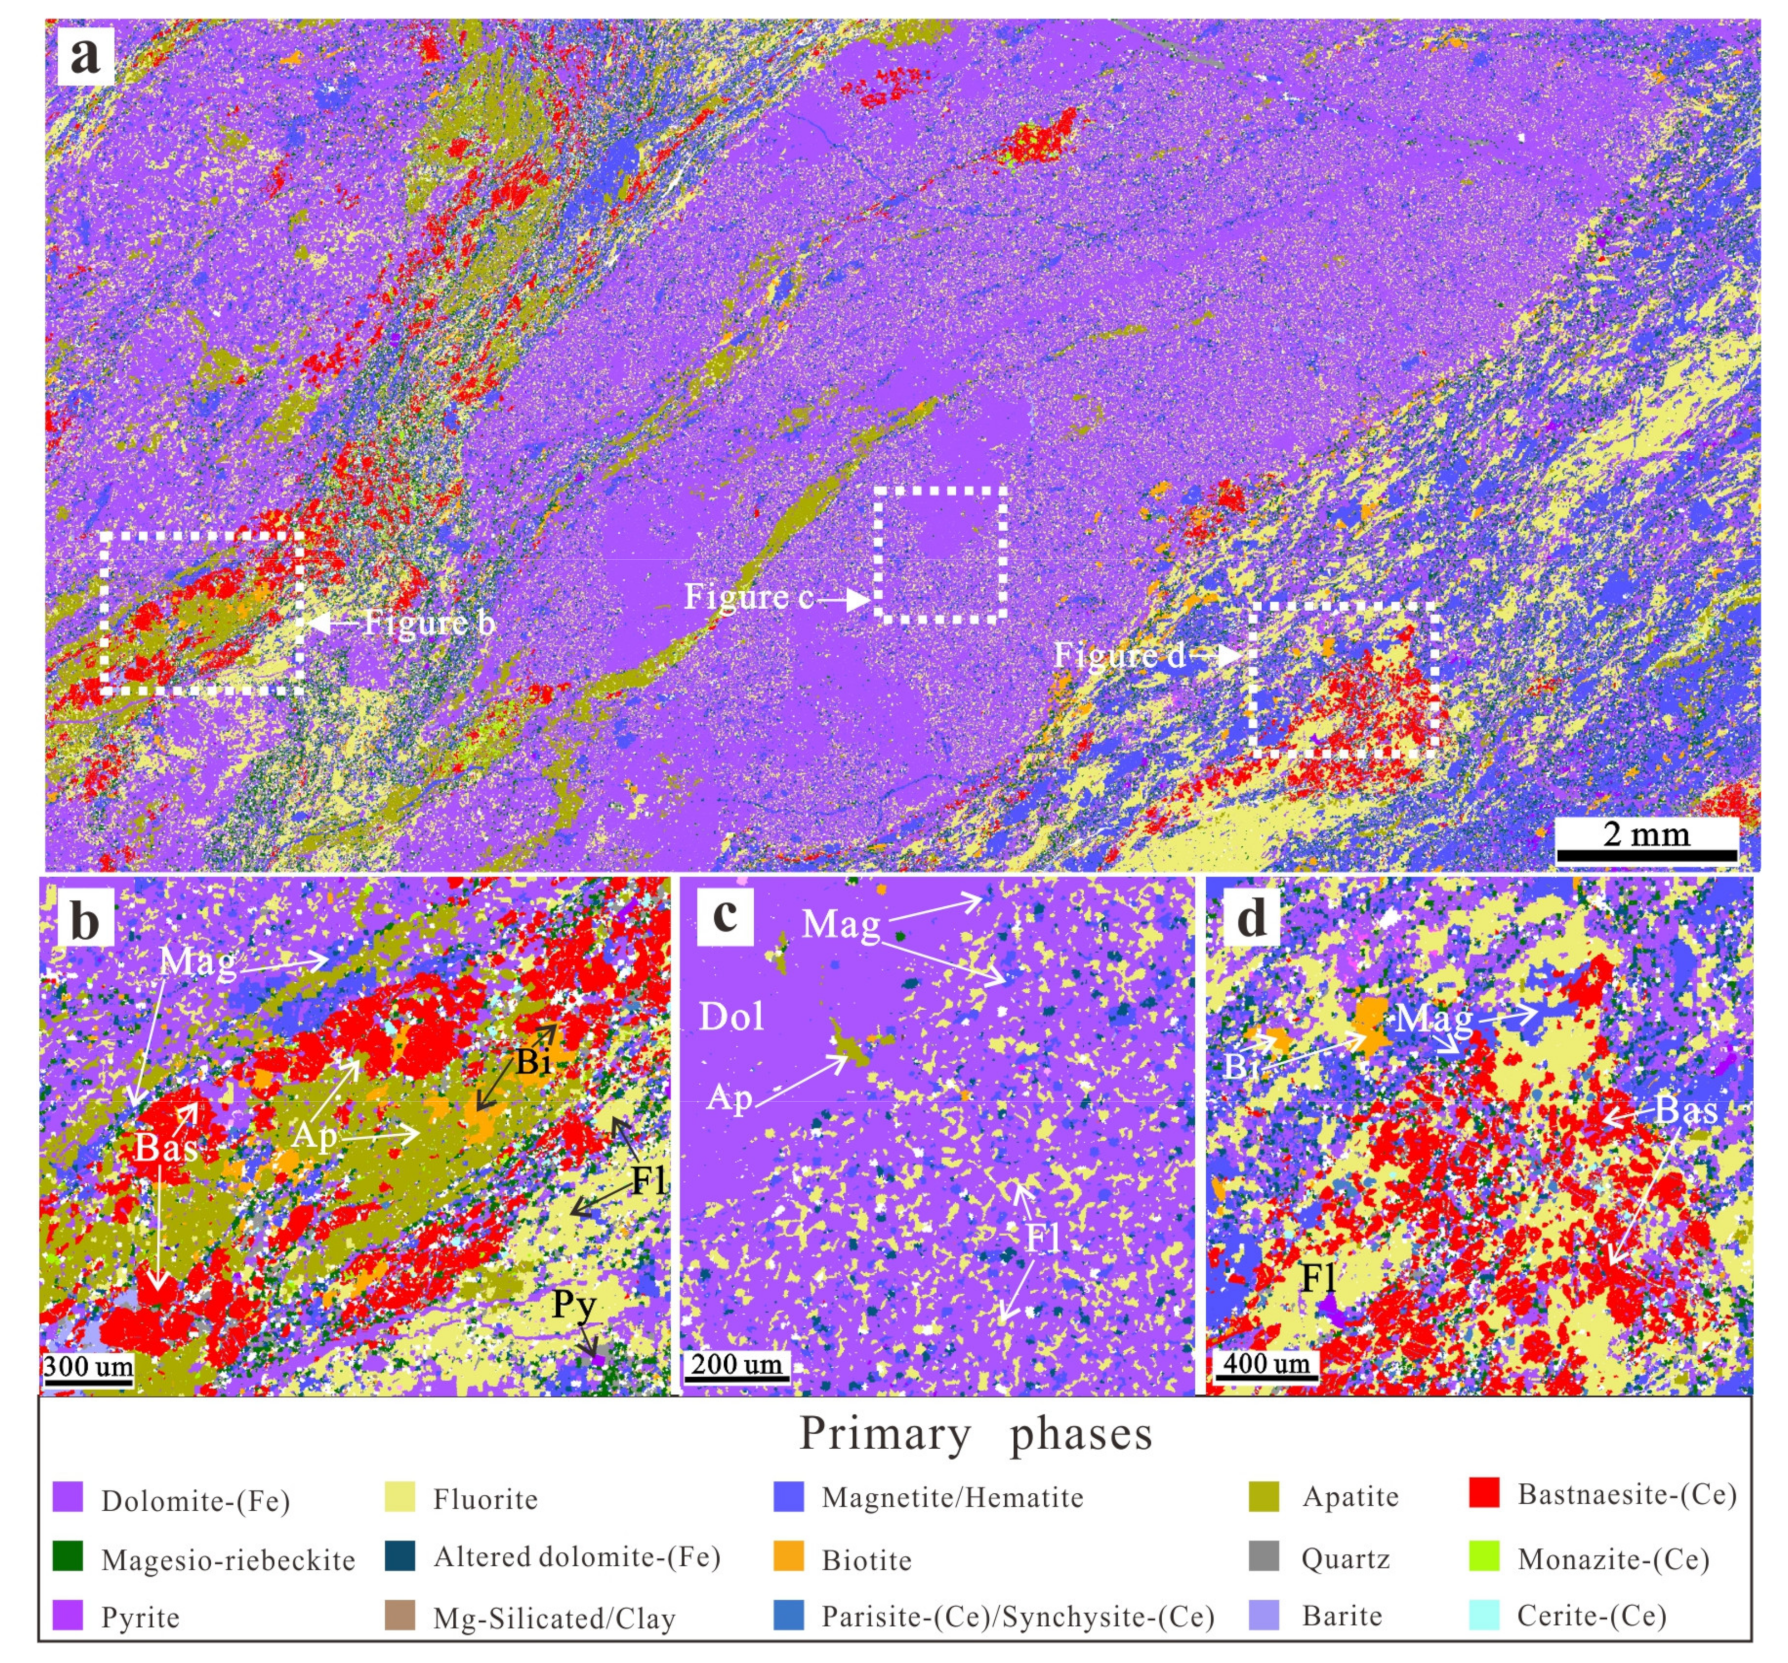
4.2.3. Sample 1406 m

The 1406 m sample is a predominantly banded REE-Fe ore but with apparent deformation and complex mineralogy (Figure 7a) compared to the above ores. The composition is as follows (Table 1 and Figure 3c): dolomite-(Fe) accounting for 51.42%, fluorite (16.03%), Fe-rich minerals (i.e., magnetite, hematite, pyrite, and ilmenite) with a total percentage of 12.26%, rare earth minerals (bastnäsite-(Ce), monazite-(Ce), parisite-(Ce), cerite-(Ce), and huanghoite-(Ce), 4.56%), apatite (4.07%), magnesio-riebeckite (3.18%), biotite (2.51%), and the others (e.g., 1.53% quartz). Contrary to the first two rare earth-iron ores mentioned above, the most abundant rare earth mineral here is granular bastnäsite-(Ce) (3.66%). The amount of monazite-(Ce) is less (0.44%) and occurs as relatively large crystals or small aggregates randomly distributed within the ore. Note that apatite has become ubiquitous in this sample. The dolomite matrix has experienced intense alteration, overprinted by tiny and disseminated mineral aggregates composed of magnetite and fluorite, as well as rare earth minerals (Figure 7c). The ore veins on the left side (Figure 7b) mainly contain intergrowth apatite, magnetite, bastnäsite-(Ce), monazite-(Ce), and fluorite. In contrast, on the right side, the veins are composed of magnetite, fluorite, and bastnäsite-(Ce), without apatite (Figure 7d).
The elemental deportment result (Table 2 and Figure 3h) shows that 76.82% of total Ce occurs in the bastnäsite-(Ce). In addition, the rest of Ce are concentrated in monazite-(Ce) (8.86%), cerite-(Ce) (7.75%), and parisite-(Ce) (6.42%). Tiny quantities are also present in huanghoite-(Ce)/cebaite-(Ce). The paragenesis relationship demonstrates that the bastnäsite-(Ce) tends to coexist with fluorite (18.99%), parisite-(Ce)/synchysite-(Ce) (8.1%), magnetite (8.02%), cerite-(Ce) (7.65%), and monazite-(Ce) (5%) (Figure 4c). The monazite-(Ce) is less and primarily associated with the bastnäsite-(Ce) (19.67%) and apatite (19.17%).

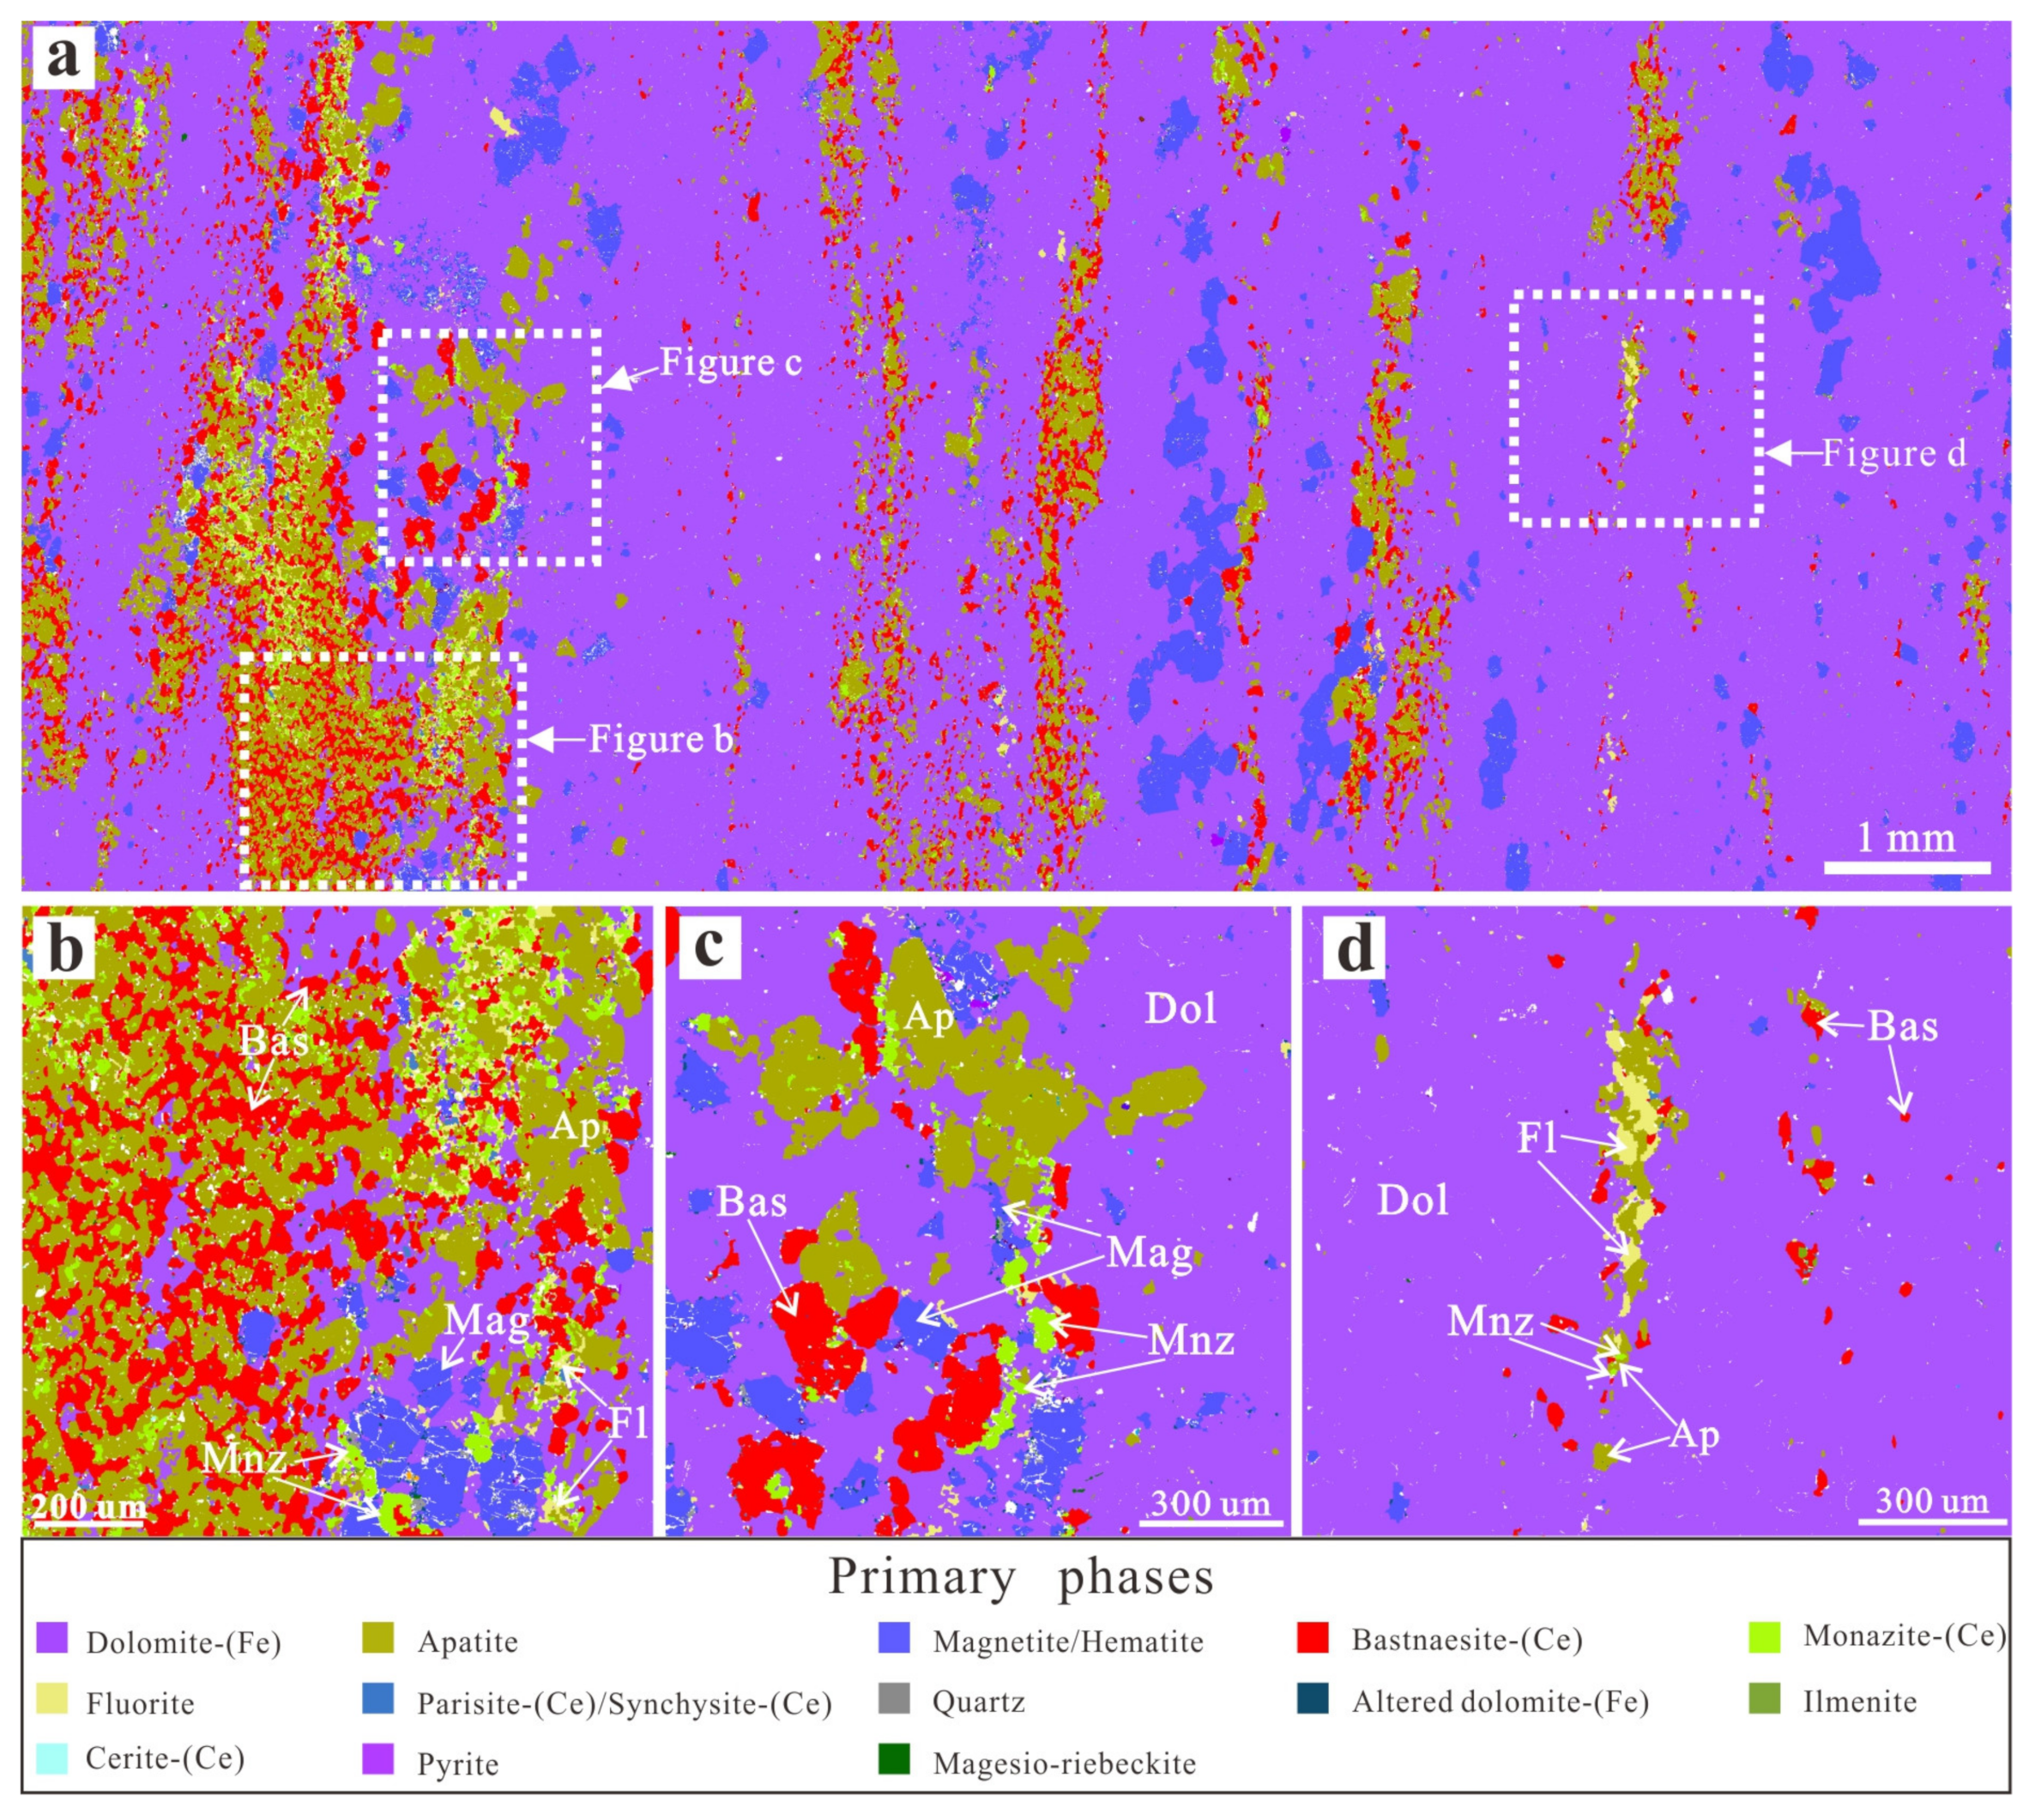
4.2.4. Sample 1546 m

The mineralogy of the 1546 m drill ore sample is relatively simple and characterized by banded rare earth mineralization (Figure 8a). The rare earth minerals, intergrown with apatite, less fluorite, and magnetite, form relatively thick or thin parallel veins that penetrate the dolomite-(Fe) matrix (Figure 8b–d). In addition, the pure and large-grain magnetite aggregates show a similar parallel but discontinuously vein-like distribution associated with rare earth mineralization. The magnetites are euhedral to subhedral grains with sizes of 5–180 mm and exhibit fractured textures (Figure 8a,b). Besides dolomite-(Fe) (83.35%), the main minerals are apatite (5.96%), rare earth minerals (bastnäsite-(Ce), monazite-(Ce), parisite-(Ce)/synchysite-(Ce), and cerite-(Ce), 5.31%), Fe-bearing minerals (such as magnetite, hematite, and pyrite, 4.6%), and the others (such as quartz, rutile-Nb) with a small quantity of 0.78% (Table 1 and Figure 3d). In contrast to the ore types mentioned earlier, only a tiny amount of fluorite was observed in the 1546 m sample. The identified mineral phase is relatively simple, indicating that the composition of the ore-forming fluid here has changed significantly.
Bastnäsite-(Ce) is the dominant REE mineral in this sample, and most Ce is endowed in the veined bastnäsite-(Ce) with a quantity of up to 82.11% (Table 2 and Figure 3i). In addition, the rest of the Ce was distributed within monazite-(Ce) (12.72%) and parisite-(Ce)/synchysite-(Ce) (4.32%). The paragenetic relationship shows that both the bastnäsite-(Ce) and monazite-(Ce) are closely associated with apatite and fluorite (Figure 4d).

4.2.5. Sample 1682 m

The overall TIMA phase map shows that this sample is principally present as veined rare earth ores (Figure 9). The mineralogy is relatively simple, and the primary mineral phases are composed mainly of dolomite-(Fe) (90.4%), monazite-(Ce) (3.18%), biotite (1.88%), bastnäsite-(Ce) (0.48%), calcite (1.26%), and magnesio-riebeckite (1.08%) (Table 1 and Figure 3e). The rare earth minerals appear as pure, thin, parallel veinlet aggregates with a preferred orientation. The veinlet mineralization occurs either as relatively euhedral to subhedral monazite-(Ce)- or bastnäsite-(Ce)-dominated aggregates. The silicate minerals, such as biotite and magnesio-riebeckite, occur as discontinuous veinlets and are associated with rare earth mineralization. Note that very tiny iron minerals were found in this sample, different from the ores above.
Monazite-(Ce) is the most abundant rare earth mineral in this sample. Therefore, most Ce elements are monazite-(Ce) (83.55%). The rest are in bastnäsite-(Ce) (13.18%), huanghoite-(Ce)/cebaite-(Ce) (2.07%), cerite-(Ce) (0.72%), and parisite-(Ce)/synchysite-(Ce) (0.48%) (Table 2 and Figure 3g). The paragenetic association relationship shows that most monazite-(Ce) and bastnäsite-(Ce) occur as independent mineral aggregate veinlets (Figure 4e) and are rarely associated with other minerals.

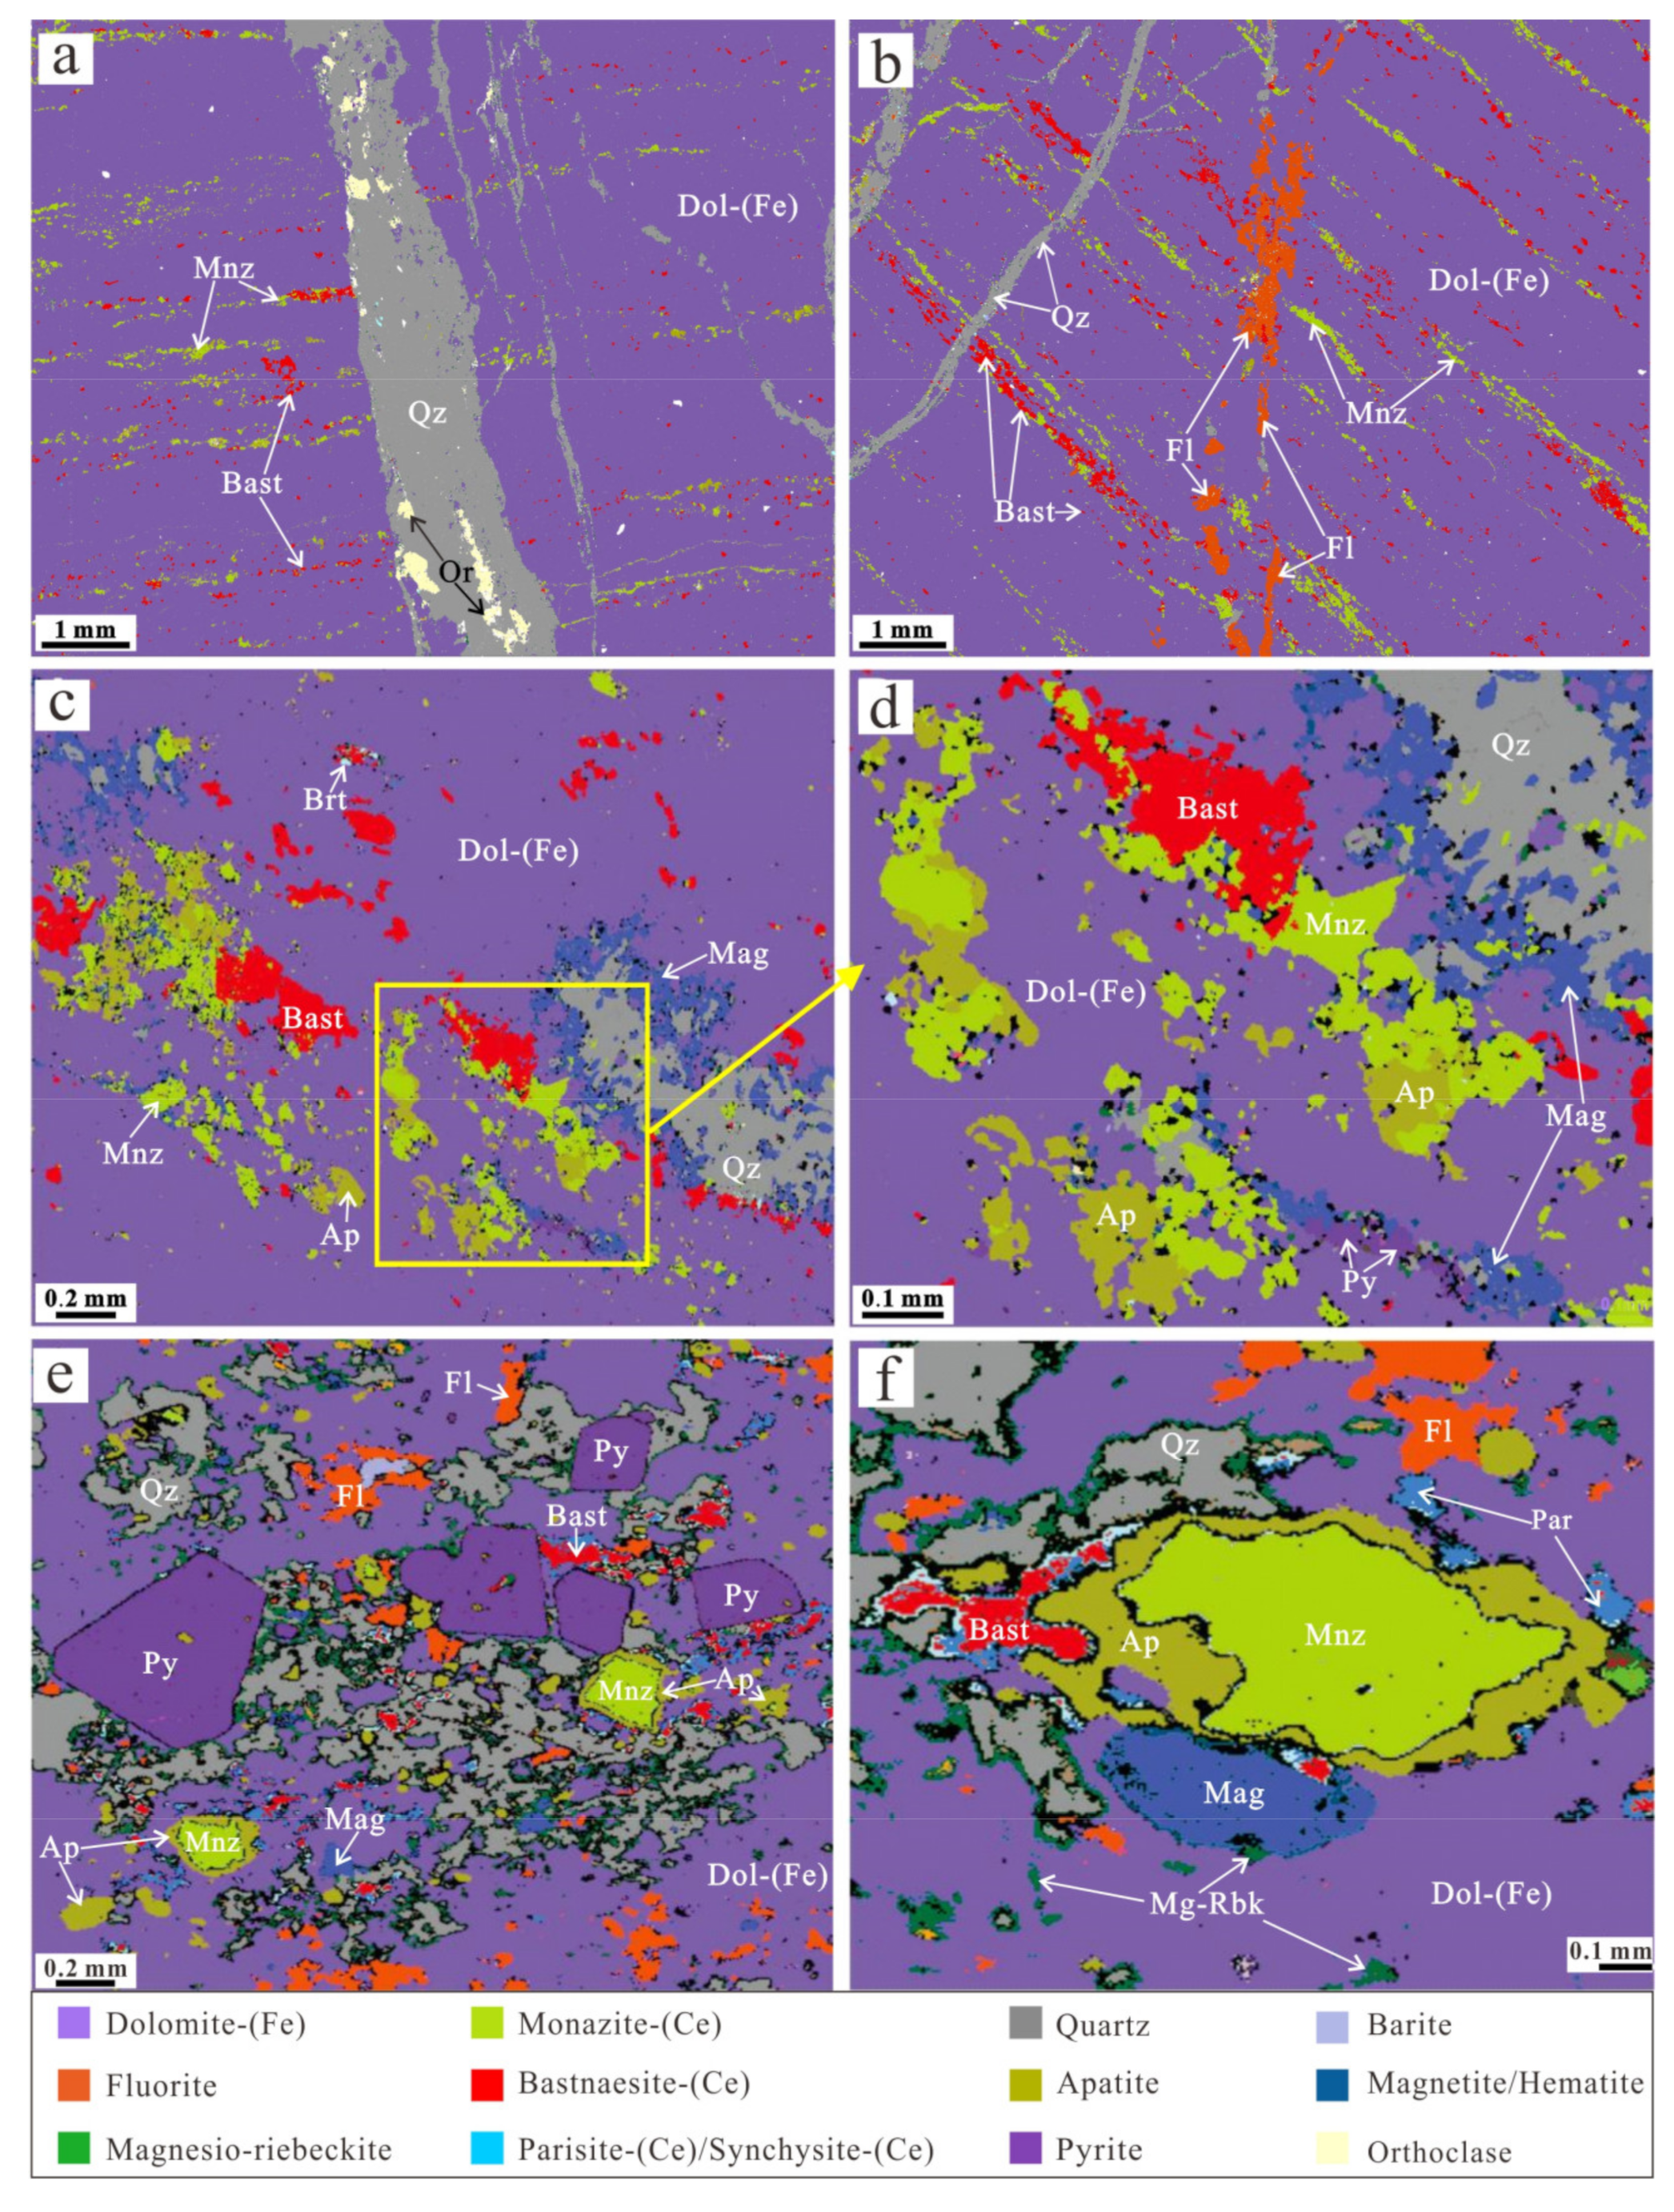
4.2.6. Other Types of Mineralization

Besides the REE mineralization types mentioned above, there are still more ore textures in the drilling samples. For example, in the 1482 m ore sample, the parallel monominerallic monazite-(Ce) and bastnäsite-(Ce) veinlets were cut by the late-stage quartz or fluorite veins (Figure 10a,b). These later veins are composed of pure quartz or fluorite aggregates without REE mineralization. On the other hand, the 1509 m sample is a disseminated REE ore with monazite-(Ce) and bastnäsite-(Ce) as the primary REE phases. The REE minerals, intergrowing with apatite and barite, overprint the dolomite-(Fe) matrix (Figure 10c). The monazite-(Ce) could occur as overgrowth along with the rim of the apatite. At the same time, the magnetite overgrew the boundary of quartz (Figure 10d). In addition, monazite-(Ce) is present as individual crystals (Figure 10e), and it was usually partially replaced and overgrown by apatite and bastnäsite-(Ce), showing an replacement texture (Figure 10f). The above metasomatic texture demonstrates the dissolution–reprecipitation processes induced by the hydrothermal fluids in the studied ores.

5. Discussion

Initial studies of the ore deposit date back to the 1920s and 1930s [33] and have attracted overwhelming attention from geologists worldwide over the past 90 years (e.g., [18,35]). The Bayan Obo is unusually geologically and mineralogically complicated, similar to other giant deposits. For example, the number of mineral species hosted in the deposit is up to 190 species [28,33], and the mineralization stage and ore type have been divided into at least eleven main stages [36,37] and nine categories [28], respectively. According to previous studies [21,33], the REE ore and gangue minerals are heterogeneously distributed from millimeter to kilometer scales. Due to the above complexity, the genesis of this deposit has been a subject of debate until now. Varying ages (from 1300 to 400 Ma [38,39]), and diverse ore genesis models, including sedimentary deposition [40], marble metasomatized by carbonatitic (e.g., [41,42]), or subduction-derived fluids (e.g., [2]), have been proposed for the origin of the deposit.
As mentioned above, previous work mainly focused on surface samples from the Bayan Obo deposit and rare reports regarding the ore samples that were collected from the deep part of the ore body, particularly beyond 1000 m. In this study, drilling samples from different depths (i.e., 1107 m, 1246 m, 1406 m, 1546 m, and 1682 m) of the Eastern Orebody borehole were investigated using TIMA automated quantitative mineralogy analysis technology. Our observation shows that the lithology of the borehole mainly consists of fine- to coarse-grained dolomite, and a small number of mafic dykes, quartzite, and carbonaceous slate are sandwiched in the layers (Figure 2). The whole-rock chemical analysis shows that these drill ores show significant (two orders of magnitude) variations in total REO concentrations, which locally reach up to 5.8 wt.% [18], indicating that there are more REE resources in the deep part of the H8 orebody. Ore rocks are composed predominantly of fine- to coarse-grained dolomite [18,21,34,43]. Furthermore, several different types of mineralization (mainly banded REE-Fe ores, banded REE ores, disseminated and banded REE-Fe ores, and veined REE ores) are identified using TIMA mineral mapping. The earliest formed mineral within the deposit is the H8 dolomite-(Fe), as well as small amounts of calcite, quartz, albite, and Sr-bearing carbonates [21]. The TIMA results show that hydrothermal REE mineralization strongly overprinted the H8 dolomite-(Fe) of the studied ores. Therefore, the REE mineralization at Bayan Obo is mostly of hydrothermal origin and is dominated by vein- and veinlet-like ore mineral patches or aggregates.
The mineral paragenetic evolution of the deposit is extremely complex. Chao et al. [36] proposed at least 11 stages, including the earliest syngenetic sedimentary deposition, metamorphism, deformation, and the latest Paleozoic granite magma activities. However, Fan et al. [33] proposed three main mineralization stages. The first stage is characterized by disseminated REE ores, with monazite as the main REE mineral and magnetite as an accessory. The main stage is banded and/or massive mineralization, showing alteration to aegirine, fluorite, and minor amphibole. Late fluorite, albite, calcite, biotite and/or pyrite aggregate veins cut the banded and massive ores, forming the third stage [33]. The paragenetic sequence was consistent with the mineralogy results obtained in our study. For the disseminated REE ores, the metasomatic reaction was well developed. The apatite was also partially replaced and overgrown by a rim of monazite-(Ce) (Figure 10c,d). The early-formed euhedral to subhedral monazite-(Ce) has been partially replaced by apatite and bastnäsite-(Ce) at its grain boundaries (Figure 10e,f). Martin et al. [44] also suggested that the earliest REE mineralization is the formation of monazite, which was then subsequently overprinted by the bastnäsite. The replacement texture has been described in many hydrothermal settings [41]. In the banded and veined mineralization ores, the REE mineral always occur as monominerallic aggregates or are associated with fluorite, apatite, magnetite, and biotite, forming nearly parallel veins or veinlets (Figure 5 and Figure 7, Figure 8 and Figure 9). These veins are sometimes cut by late-stage but REE-poor quartz and fluorite veins (Figure 10a,b). The above texture observations indicate that late-stage fluids induce dissolution, remobilization, and reprecipitation of relatively early-formed REE minerals. A similar texture was also reported in the Palabora carbonatite complex with plenty of REE resources, South Africa, which experienced multistage fluid-assisted modification after forming early-stage REE minerals [45].
Based on previous ore mineralogy studies on surface samples and TIMA drill ore mineral investigation in this work, the H8 orebody is remarkably heterogeneous in REE mineralization. The REE and gangue minerals vary significantly in abundance and occurrence between the drill ores from different depths (Table 1 and Figure 3), even for similar vein types of mineralization. In addition, the paragenetic relationships of REE minerals with other minerals (Figure 4) also vary with depth. These diversities may be related to changes in the fluid composition or source, as well as temperature and Ph conditions. In the case of the Bayan Obo deposit, the age of the mineralization (with dating results ranging from ~1300 to ~400 Ma) is remarkably protracted [2,18,38]. In addition, the C-O-Sr-Pb-Mg isotopic compositions of the different ores also vary significantly [2,18,34,43]. For example, recent in situ, high-spatial-resolution Sr-Pb isotopic investigation of the dolomite from the ores defines an extensive range of initial 87Sr/86Sr (0.703–0.714) and 208Pb/204Pb (35–40) ratios, suggesting that the ore-forming fluids come from both mantle and surrounding host rocks [43].These results indicate that the REE mineralization is multistage with complex fluids from different sources.
Smith and Henderson [46] identified aqueous-carbonic fluid inclusions with salinities from 1–5 wt. % NaCl equiv and temperatures ranging from 280 to 330 °C in the early-formed disseminated monazite-(Ce). Fluid inclusions in apatite and bastnäsite-(Ce) from the later main-stage banded ores show CO2-rich and salinities ranging from 6–10 wt. % NaCl equiv. and relatively high temperature from 300 to up to >400 °C. More importantly, Fan et al. [47] found identical fluid compositions and, particularly, REE daughter minerals (e.g., cebaite and bastnäsite) trapped in the fluid inclusions, confirming that these fluids transported the REE. Moreover, our study shows that REE minerals also occur with many typical hydrothermal minerals found in carbonatites, such as fluorite, barite, celestite, and quartz. Therefore, it has been suggested that these fluids are similar to carbonatite-related magmatic-hydrothermal systems [48,49].
The multistage REE mineralization at Bayan Obo was also represented by geochronological studies. Campbell et al. [38] reported zircons from the East orebody with magmatic cores and skeletal altered rims under CL images. The core and rims of the zircons showed Th-Pb ages of ca. 1.3 Ga and 450–460 Ma, respectively, suggesting two stages of magmatic to hydrothermal evolution. Combined with the in situ monazite Th-Pb ages (361–913 Ma) and corresponding Sm-Nd isotopes, Song et al. [18] proposed that the REE ores are formed initially as products of ~1.3 Ga carbonatitic magmatism. Subsequently, protracted thermal perturbations were induced by Sr-rich but REE-poor metamorphic fluids derived from nearby sedimentary rocks. The Sm-Nd isochron age of the apatite within the H8 orebody is consistent with the Th-Pb age of the monazite from the calcite carbonatite dykes in the ore field [30]. By dating metamorphic monazite from the Bayan Obo Group, Zhang et al. [50] suggested that the formation of the REE-rich veins was triggered by the interaction of metamorphic fluids with the pre-existed REE ores during 410–380 Ma. Recent deep-drilling structure exploration shows that the East orebody has a steep dip angle (up to 80°) and continuously extends to depth without reduction of angle, indicating that the so-called Bayan syncline is probably nonexistent and that the orebody is a carbonatitic igneous conduit rather than being of sedimentary origin [4]. In addition, recent Sr-Nd-Mg-B in situ and high-precision geochemical studies also support an igneous origin for the H8 orebody (e.g., [18,30,43,51]).
In general, combining the mineralogy, geochemical, and geochronological evidence, the REE ores at Bayan Obo are interpreted to have originally formed as products of mid-Mesoproterozoic (~1.3 Ga) carbonatitic magmatism. Then, the hydrothermal fluids remobilized and redistributed the REE and formed a high variable ore mineral assemblage during early Paleozoic. In addition, the automated mineralogy method like TIMA quantifies both the ores’ complex rare metal and gangue minerals. Therefore, it will be an essential tool to better document and interpret REE deposits in the future.

6. Conclusions

In this work, we applied TIMA automated mineralogy to characterize the REE ore mineralogy of deep drilling samples from the Eastern Orebody of the giant Bayan Obo REE deposit. Based on the TIMA mineral phase mapping, the banded REE-Fe ores, banded REE ores, disseminated REE-Fe ores, and veined REE ores were identified in the studied samples. The REE distribution from the shallowest to the deepest is a function of the abundance of REE mineral species occurring at each level, among which monazite-(Ce) and bastnäsite-(Ce) contribute the most REE budget. Less REEs are also found in parisite-(Ce)/synchysite-(Ce), cerite-(Ce), huanghoite-(Ce)/cebaite-(Ce), and aeschynite-(Ce). The REE minerals, associated with many accessory minerals (e.g., fluorite, apatite, barite, magnetite, and quartz), form veined or disseminated overprints, metasomatic replacement, and overgrowth REE mineralization textures, indicating a multistage and complicated hydrothermal ore-forming process. Combined with the newly published in-situ chronological and isotopic geochemical and our detailed mineralogical results, we conclude that the later hydrothermal fluids remobilized and redistributed the early-formed REE ores are critical for the genesis of the giant REE deposit.

Supplementary Materials

The following are available online at https://www.mdpi.com/article/10.3390/min12040426/s1, Figure S1. The TESCAN TIMA3 X GMH system of the State Key Laboratory of Continental Dynamics at Northwestern University, China (a) and the system are equipped with nine detectors (b). Detectors include four high-throughput silicon drift detectors; In-beam SE, BSE detectors; ultra-fast YAG scintillator BSE detector; SE Everhart-Thornley type detector and color cathodoluminescence (350~850 nm) detector.

Author Contributions

Formal analysis, J.K., J.Y., Q.C. and H.T.; project administration, W.S.; writing—original draft, T.L. and W.S. All authors have read and agreed to the published version of the manuscript.

Funding

This work was financially supported by the Chinese National Natural Science Foundation (No. 41973036 and 92162219). Jindrich Kynicky thanks the EXPRO project of the Czech Science Foundation (No.19-29124X).

Data Availability Statement

The data is presented directly in the present study.

Acknowledgments

We are very grateful to four anonymous reviewers for their constructive comments, which have greatly improved the quality of the manuscript. We also thank TESCAN Company for TIMA analysis technical guidance.

Conflicts of Interest

The authors declare no conflict of interest.

References

  1. USGS. Rare Earths. In Mineral Commodity Summaries; US Geological Survey: Reston, VA, USA, 2021; pp. 132–133. [Google Scholar]
  2. Ling, M.X.; Liu, Y.L.; Williams, I.S.; Teng, F.Z.; Yang, X.Y.; Ding, X.; Wei, G.J.; Xie, L.H.; Deng, W.F.; Sun, W.D. Formation of the world’s largest REE deposit through protracted fluxing of carbonatite by subduction-derived fluids. Sci. Rep. 2013, 3, srep01776-8. [Google Scholar]
  3. Huang, X.W.; Zhou, M.F.; Qiu, Y.Z.; Qi, L. In-situ LA-ICP-MS trace elemental analyses of magnetite: The Bayan Obo Fe-REE-Nb deposit, North China. Ore Geol. Rev. 2015, 65, 884–899. [Google Scholar] [CrossRef]
  4. Tang, H.Y.; Liu, Y.; Song, W.L. Igneous genesis of the Bayan Obo REE–Nb–Fe deposit: New petrographical and structural evidence from the H1–H9 cross-section and deep-drilling exploration. Ore Geol. Rev. 2021, 138, 104397. [Google Scholar] [CrossRef]
  5. Drew, L.J.; Meng, Q.R.; Sun, W.J. The Bayan Obo iron-rare-earth-niobium deposits, Inner Mongolia, China. Lithos 1990, 26, 43–65. [Google Scholar] [CrossRef]
  6. Ren, Y.S.; Yang, X.X.; Wang, S.S.; Öztürk, H.Y. Mineralogical and geochemical study of apatite and dolomite from the Bayan Obo giant Fe-REE-Nb deposit in Inner Mongolia: New evidences for genesis. Ore Geol. Rev. 2019, 109, 381–406. [Google Scholar] [CrossRef]
  7. Yang, X.Y.; Lai, X.D.; Ren, Y.S.; Ling, M.X.; Liu, Y.L.; Liu, J.Y. Geological characteristics and their scientific problems of the Bayan Obo Fe-REE-Nb deposit: Discussion on the origin of Bayan Obo super-large deposit. Acta Geol. Sin. 2015, 89, 2323–2350. (In Chinese) [Google Scholar]
  8. Ye, L.; Cook, N.J.; Ciobanu, L.C.; Liu, Y.P.; Zhang, Q.; Liu, T.G.; Gao, W.; Yang, Y.L.; Danyushevskiy, L. Trace and minor elements in sphalerite from base metal deposits in South China: A LA–ICPMS study. Ore Geol. Rev. 2011, 39, 188–217. [Google Scholar]
  9. Ward, I.; Merigot, K.; Mcinnes, B.I.A. Application of quantitative mineralogical analysis in archaeological micromorphology: A case study from Barrow Is., Western Australia. J. Archaeol. Method Theory 2018, 25, 45–68. [Google Scholar] [CrossRef]
  10. Hrstka, T.; Gottlieb, P.; Skála, R.; Breiter, K.; Motl, D. Automated mineralogy and petrology-applications of TESCAN Integrated Mineral Analyzer (TIMA). J. Geosci. 2018, 63, 47–63. [Google Scholar] [CrossRef] [Green Version]
  11. Chen, Q.; Song, W.L.; Yang, J.K.; Hu, Y.; Huang, J.; Zhang, T.; Zheng, G.S. Principle of automated mineral quantitative analysis system and its application in petrology and mineralogy: An example from TESCAN TIMA. Miner. Depos. 2021, 40, 345–368. (In Chinese) [Google Scholar]
  12. Sindern, S.; Meyer, F.M. Automated quantitative rare earth elements mineralogy by scanning electron microscopy. Phys. Sci. Rev. 2016, 1, 20160063. [Google Scholar] [CrossRef]
  13. Breiter, K.; Durisova, J.; Hrstka, T.; Korbelova, Z.; Vankova, M.H.; Galiovaa, M.V.; Kanicky, V.; Rambousek, P.; Knesl, I.; Dobes, P.; et al. Assessment of magmatic vs. metasomatic processes in rare-metal granites: A case study of the Cinovec/Zinnwald Sn-W-Li deposit, Central Europe. Lithos 2017, 292, 198–217. [Google Scholar] [CrossRef]
  14. Xu, C.; Kynicky, J.; Song, W.L.; Tao, R.B.; Lu, Z.; Li, Y.X.; Yang, Y.C.; Pohanka, M.; Galiova, M.V.; Zhang, L.F.; et al. Cold deep subduction recorded by remnants of a Paleoproterozoic carbonated slab. Nat. Commun. 2018, 9, 2790. [Google Scholar] [CrossRef] [PubMed] [Green Version]
  15. Aylmore, M.G.; Merigot, K.; Quadir, Z.; Rickard, W.D.A.; Evans, N.J.; McDonald, B.J.; Catovic, E.; Spitalny, P. Applications of advanced analytical and mass spectrometry techniques to the characterisation of micaceous lithium-bearing ores. Miner. Eng. 2018, 116, 182–195. [Google Scholar] [CrossRef]
  16. Beinlich, A.; John, T.; Vrijmoed, J.C.; Tominaga, M.; Magna, T.; Podladchikov, Y.Y. Instantaneous rock transformations in the deep crust driven by reactive fluid flow. Nat. Geosci. 2020, 13, 307–311. [Google Scholar] [CrossRef]
  17. Keulen, N.; Malkki, S.N.; Graham, S. Automated quantitative mineralogy applied to metamorphic rocks. Minerals 2020, 10, 47. [Google Scholar] [CrossRef] [Green Version]
  18. Song, W.L.; Xu, C.; Smith, M.P.; Chakhmouradian, A.R.; Brenna, M.; Kynický, J.; Chen, W.; Yang, Y.H.; Deng, M.; Tang, H.Y. Genesis of the world’s largest rare earth element deposit, Bayan Obo, China: Protracted mineralization evolution over ~1 b.y. Geology 2018, 46, 323–326. [Google Scholar] [CrossRef]
  19. Chao, E.T.C.; Minkin, J.A.; BACK, J.M.; Okita, P.M.; Mckee, E.H.; Tosdal, R.M.; Tatsumoto, M.; Wang, J.; Edwards, C.A.; Ren, Y.; et al. The H8 dolomite host rock of the Bayan Obo iron-niobium-rare earth-element ore deposit of Inner Mongolia, China-origin, episodic mineralization, and implications. USGS Circ. 1989, 1035, 8–10. [Google Scholar]
  20. Yuan, Z.X.; Bai, G.; Wu, C.X.; Zhang, Z.Q.; Ye, X.J. Geological features and genesis of the Bayan Obo REE ore deposit, Inner Mongolia, China. Appl. Geochem. 1992, 7, 429–442. [Google Scholar]
  21. Smith, M.P.; Campbell, L.S.; Kynicky, J. A review of the genesis of the world class Bayan Obo Fe-REE-Nb deposits, Inner Mongolia, China: Multistage processes and outstanding questions. Ore Geol. Rev. 2015, 64, 459–476. [Google Scholar] [CrossRef]
  22. She, H.D.; Fan, H.R.; Yang, K.F.; Li, X.; Yang, Z.F.; Wang, Q.W.; Zhang, L.F.; Wang, Z.J. Complex, multistage mineralization processes in the giant Bayan Obo REE-Nb-Fe deposit, China. Ore Geol. Rev. 2021, 139, 104461. [Google Scholar] [CrossRef]
  23. Wang, K.Y.; Fan, H.R.; Xie, Y.H.; Li, H.M. U-Pb dating of zircons in basement complex of Bayan Obo giant REE-Nb-Fe deposit. Chin. Sci. Bull. 2001, 46, 1390–1393. (In Chinese) [Google Scholar]
  24. Fan, H.R.; Yang, K.F.; Hu, F.F.; Wang, K.Y.; Zhai, M.G. Zircon geochronology of basement rocks from the Bayan Obo area, Inner Mongolia, and tectonic implications. Acta Geosci. Sin. 2010, 26, 1342–1350. (In Chinese) [Google Scholar]
  25. Zhong, Y.; Zhai, M.G.; Peng, P.; Santosh, M.; Ma, X.D. Detrital zircon U-Pb dating and whole-rock geochemistry from the clastic rocks in the northern marginal basin of the North China Craton: Constraints on depositional age and provenance of the Bayan Obo Group. Precambrian Res. 2015, 258, 133–145. [Google Scholar]
  26. Lai, X.D.; Yang, X.Y.; Liu, Y.L.; Yan, Z.Q. Genesis of the Bayan Obo Fe–REE–Nb deposit: Evidences from Pb–Pb age and microanalysis of the H8 formation in Inner Mongolia, North China Craton. J. Asian Earth Sci. 2016, 120, 87–99. [Google Scholar] [CrossRef]
  27. Liu, C.H.; Zhao, G.C.; Liu, F.L.; Shi, J.R. Detrital zircon U-Pb and Hf isotopic and whole-rock geochemical study of the Bayan Obo Group, northern margin of the North China Craton: Implications for Rodinia reconstruction. Precambrian Res. 2017, 303, 372–391. [Google Scholar] [CrossRef]
  28. IGCAS. Geochemistry of Bayan Obo Deposit; Science Press: Beijing, China, 1988. (In Chinese) [Google Scholar]
  29. Liu, S.; Fan, H.R.; Yang, K.F.; Hu, F.F.; Rusk, B.; Liu, X.; Li, X.C.; Yang, Z.F.; Wang, Q.W.; Wang, K.Y. Fenitization in the giant Bayan Obo REE-Nb-Fe deposit: Implication for REE mineralization. Ore Geol. Rev. 2018, 94, 290–309. [Google Scholar] [CrossRef]
  30. Yang, K.F.; Fan, H.Y.; Pirajno, F.; Li, X.C. The Bayan Obo (China) giant REE accumulation conundrum elucidated by intense magmatic differentiation of carbonatite. Geology 2019, 47, 1198–1202. [Google Scholar] [CrossRef] [Green Version]
  31. Yang, X.M.; Yang, X.Y.; Zheng, Y.F.; Le Bas, M.J. A rare earth element-richcarbonatite dyke at Bayan Obo, Inner Mongolia, North China. Mineral. Petrol. 2003, 78, 93–110. [Google Scholar] [CrossRef]
  32. Ni, P.; Zhou, J.; Chi, Z.; Pan, J.Y.; Li, S.N.; Ding, J.Y.; Han, L. Carbonatite dyke and related REE mineralization in the Bayan Obo REE ore field, North China: Evidence from geochemistry, C-O isotopes and Rb-Sr dating. J. Geochem. Explor. 2020, 215, 106560. [Google Scholar] [CrossRef]
  33. Fan, H.R.; Yang, K.F.; Hu, F.F.; Liu, S.; Wang, K.Y. The giant Bayan Obo REE-Nb-Fe deposit, China: Controversy and ore genesis. Geosci. Front. 2016, 7, 41–50. [Google Scholar] [CrossRef]
  34. Yang, X.Y.; Lai, X.D.; Pirajno, F.; Liu, Y.L.; Ling, M.X.; Sun, W.D. Genesis of the Bayan Obo Fe-REE-Nb formation in Inner Mongolia, North China Craton: A perspective review. Precambrian Res. 2017, 288, 39–71. [Google Scholar] [CrossRef]
  35. Zhang, S.H.; Zhao, Y.; Liu, Y.S. A precise zircon Th-Pb age of carbonatite sills from the world’s largest Bayan Obo deposit: Implications for timing and genesis of REE-Nb mineralizations. Precambrian Res. 2017, 291, 202–219. [Google Scholar] [CrossRef]
  36. Chao, E.C.T.; Back, J.M.; Minkin, J.A.; Ren, Y.C. Host-rock controlled epigenetic, hydrothermal metasomatic origin of the Bayan Obo REE-Fe-Nb ore deposit, Inner Mongolia, PRC. Appl. Geochem. 1992, 7, 443–458. [Google Scholar] [CrossRef]
  37. Fan, H.R.; Hu, F.F.; Yang, K.F.; Wang, K.Y. Fluid unmixing/immiscibility as an ore-forming process in the giant REE–Nb–Fe deposit, Inner Mongolian, China: Evidence from fluid inclusions. J. Geochem. Explor. 2006, 89, 104–107. [Google Scholar] [CrossRef]
  38. Campbell, L.S.; Compston, W.; Sircombe, K.N.; Wilkinson, C.C. Zircon from the East Orebody of the Bayan Obo Fe–Nb–REE deposit, China, and SHRIMP ages for carbonatite-related magmatism and REE mineralization events. Contrib. Mineral. Petrol. 2014, 168, 1041. [Google Scholar] [CrossRef] [Green Version]
  39. Zhu, X.K.; Sun, J.; Pan, C.X. Sm-Nd isotopic constraints on rare-earth mineralization in the Bayan Obo ore deposit, Inner Mongolia, China. Ore Geol. Rev. 2015, 64, 543–553. [Google Scholar] [CrossRef]
  40. Chao, E.C.T.; Back, J.M.; Minkin, J.A.; Tatsumoto, M.; Wang, J.; Conrad, J.E.; MaKee, E.H.; Hou, Z.; Meng, Q.S. The sedimentary carbonate-hosted giant Bayan Obo REE-Fe-Nb ore deposit of Inner Mongolia, China: A cornerstone example for giant polymetallic ore deposits of hydrothermal original. USGS Bull. 1997, 2143, 1–65. [Google Scholar]
  41. Smith, M.P.; Henderson, P.; Campbell, L.S. Fractionation of the REE during hydrothermal processes: Constraints from the Bayan Obo Fe-REE-Nb deposit, Inner Mongolia, China. Geochim. Cosmochim. Acta 2000, 64, 3141–3160. [Google Scholar] [CrossRef]
  42. Yang, X.Y.; Sun, W.D.; Zhang, Y.X.; Zheng, Y.F. Geochemical constraints on the genesis of the Bayan Obo Fe-Nb-REE deposit in Inner Mongolia, China. Geochim. Cosmochim. Acta 2009, 73, 1417–1435. [Google Scholar] [CrossRef]
  43. Chen, W.; Liu, H.Y.; Lu, J.; Jiang, S.Y.; Simonetti, A.; Xu, C.; Zhang, W. The formation of the ore-bearing dolomite marble from the giant Bayan Obo REE-Nb-Fe deposit, Inner Mongolia: Insights from micron-scale geochemical data. Miner. Depos. 2020, 55, 131–146. [Google Scholar] [CrossRef]
  44. Smith, M.P.; Henderson, P.; Zhang, P. Reaction relationship in the Bayan Obo Fe-REE-Nb deposit, Inner Mongolia, China: Implications for the relative stability of rare-earth element phosphates and fluorocarbonates. Contrib. Mineral. Petrol 1999, 134, 294–310. [Google Scholar] [CrossRef]
  45. Giebel, R.J.; Gauert, C.D.; Marks, M.A.; Costin, G.; Markl, G. Multistage formation of REE minerals in the Palabora Carbonatite Complex, South Africa. Am. Mineral. 2017, 102, 1218–1233. [Google Scholar] [CrossRef]
  46. Smith, M.P.; Henderson, P. Preliminary fluid inclusion constraints on fluid evolution in the Bayan Obo Fe-REE-Nb deposit, Inner Mongolia, China. Econ. Geol. 2000, 95, 1371–1388. [Google Scholar] [CrossRef] [Green Version]
  47. Fan, H.R.; Xie, Y.H.; Wang, K.Y.; Tao, K.J.; Wilde, S.A. REE daughter minerals trapped in fluid inclusions in the giant Bayan Obo REE-Nb-Fe deposit, Inner Mongolia, China. Int. Geol. Rev. 2004, 46, 638–645. [Google Scholar] [CrossRef]
  48. Walter, B.F.; Giebel, R.J.; Steele-MacInnis, M.; Marks, M.A.; Kolb, J.; Markl, G. Fluids associated with carbonatitic magmatism: A critical review and implications for carbonatite magma ascent. Earth-Sci. Rev. 2021, 215, 103509. [Google Scholar] [CrossRef]
  49. Bühn, B.; Rankin, A.H. Composition of natural, volatile-rich Na-Ca-REE-Sr carbonatitic fluids trapped in fluid inclusions. Geochim. Cosmochim. Acta 1999, 63, 3781–3797. [Google Scholar] [CrossRef]
  50. Zhang, H.D.; Zhai, M.G.; Wang, D.Q.; Fayek, M.; Liu, J.C. Dating of monazite-apatite-allanite-epidote corona from the Bayan Obo Group in the northern margin of the North China Craton: Implications for the time of regional Au and REE mineralization. Sci. Bull. 2022, 67, 236–239. [Google Scholar] [CrossRef]
  51. Kuebler, C.; Simonetti, A.; Chen, W.; Simonetti, S.S. Boron isotopic investigation of the Bayan Obo carbonatite complex: Insights into the source of mantle carbon and hydrothermal alteration. Chem. Geol. 2020, 557, 119859. [Google Scholar]
Figure 1. (a) Geotectonic sketch and (b) geological map of the Bayan Obo REE-Nb-Fe deposit (modified from [2]).
Minerals 12 00426 g001
Figure 2. Lithological column and identified mineralization of the borehole (up to 1776 m) of the Eastern Orebody in the Bayan Obo deposit. Note that “REO” is the total rare earth oxides and “· · · ·” represent the repeated lithology (dolomite) without obvious change between depth of 450 and 1000 m.
Minerals 12 00426 g002
Figure 3. Mineral species and composition (left, in vol. %) and Ce elemental deportment (right, in wt. %) of different drill ore samples in the Eastern Orebody of Bayan Obo deposit. (a) mineral species and composition of sample 1107 m; (b) mineral species and composition of sample 1246 m; (c) mineral species and composition of sample 1406 m; (d) mineral species and composition of sample 1546 m; (e) mineral species and composition of sample 1682 m; (f) Ce elemental deportment at sample 1107 m; (g) Ce elemental deportment at sample 1246 m; (h) Ce elemental deportment at sample 1406 m; (i) Ce elemental deportment at sample 1546 m; (j) Ce elemental deportment at sample 1682 m.
Minerals 12 00426 g003
Figure 4. The TIMA calculated the mineral association percentage of monazite-(Ce) and bastnäsite-(Ce) in the studied drill ores from the Bayan Obo deposit. (a) mineral association percentage of monazite-(Ce) and bastnäsite-(Ce) of sample 1107 m; (b)mineral association percentage of monazite-(Ce) and bastnäsite-(Ce) of sample 1246 m; (c) mineral association percentage of monazite-(Ce) and bastnäsite-(Ce) of sample 1406 m; (d) mineral association percentage of monazite-(Ce) and bastnäsite-(Ce) of sample 1546 m; (e) mineral association percentage of monazite-(Ce) and bastnäsite-(Ce) of sample 1682 m.
Minerals 12 00426 g004
Figure 5. The TIMA false-colored mineral phase map of the 1107 m drill core sample. (a) the whole image of the polished thin section shows banded ore texture; (b) subhedral to anhedral monazite-(Ce) associated with fluorite, magnetite, and ilmenite with a granular size larger than 200 μm in diameter, overprinted on dolomite-(Fe); (c) fine-grained monazite-(Ce) aggregates within the dolomite-(Fe) matrix, associated with biotite and fluorite; (d) scattered monazite-(Ce), associated with magnetite, ilmenite, and fluorite, overprinted on the dolomite-(Fe) matrix. Abbreviations: Dol, dolomite-(Fe); Mnz, monazite-(Ce); Fl, fluorite; Ap, apatite; Mag, magnetite; Py, pyrite; Bi, biotite; Fsm, fersmite; Ilm, ilmenite; Asn, aeschynite-(Ce).
Minerals 12 00426 g005
Figure 6. The TIMA false-colored mineral phase map of the 1246 m drill core sample. (a) the whole image of the polished thin section shows disseminated ore texture; (b) subhedral to anhedral monazite-(Ce) associated with fluorite, magnetite, biotite, and pyrite, overprinted on dolomite-(Fe). Abbreviations: Dol, dolomite-(Fe); Mnz, monazite-(Ce); Fl, fluorite; Mag, magnetite; Py, pyrite; Bi, biotite; Sp, sphalerite; Ilm, ilmenite; Asn, aeschynite-(Ce).
Minerals 12 00426 g006
Figure 7. The TIMA false-colored mineral phase map of the 1406 m drill ore sample. (a) the whole image of the thin section shows deformed banded ore texture; (b) the bastnäsite-(Ce) intergrowth with apatite, fluorite, magnetite, and biotite, forming complex veins overprinted on the dolomite-(Fe); (c) the dolomite-(Fe) matrix has been altered and overprinted by tiny and disseminated mineral aggregates composed of magnetite and fluorite; (d) the bastnäsite-(Ce) intergrowth with fluorite, magnetite, and biotite but without apatite. Abbreviations: Dol, dolomite-(Fe); Bas, bastnäsite-(Ce); Fl, fluorite; Mag, magnetite; Ap, apatite; Py, pyrite; Bi, biotite.
Minerals 12 00426 g007
Figure 8. The TIMA false-colored mineral phase map of the 1546 m drill ore sample. (a) the whole image of the thin section shows banded deformation ore texture; (b) intergrowth of bastnäsite-(Ce), apatite, fluorite, and monazite-(Ce), as well as large-grain magnetite, in the form of parallel vein aggregates intruded into the dolomite-(Fe) matrix; (c,d) the association of the REE minerals (bastnäsite-(Ce) and monazite-(Ce) with apatite, forming scattered vein-like aggregates overprinted on the dolomite-(Fe). Abbreviations: Dol, dolomite-(Fe); Bas, bastnäsite-(Ce); Mnz, monazite-(Ce); Fl, fluorite; Mag, magnetite; Ap, apatite.
Minerals 12 00426 g008
Figure 9. The TIMA false-colored mineral phase map of the 1682 m drill ore sample. (a) the whole image of the thin section shows banded ore texture; (bd) close-up photos showing the mineralogy assemblage of the hydrothermal REE veins. Abbreviations: Dol, dolomite-(Fe); Bas, bastnäsite-(Ce); Mnz, monazite-(Ce); Mag, magnetite; Py, pyrite; Bi, biotite; Cal, calcite; Ht, huanghoite.
Minerals 12 00426 g009
Figure 10. The TIMA mineral phase map showing the vein cut relationship and metasomatic alteration texture from the drill ore samples. (a) the later relatively thick quartz veins cut the near parallel monazite-(Ce), and bastnäsite-(Ce) aggregate veinlets; (b) REE veinlets were also cut by REE-poor and late-stage fluorite and quartz veinlets; (c) monazite-(Ce) and bastnäsite-(Ce) commonly intergrown with apatite and barite, associated with magnetite and quartz, overprinting on the dolomite-(Fe) matrix; (d) the close-up image of the yellow square from the figure (c), show monazite-(Ce) intergrowth or overgrowth along with the apatite; and magnetite overgrowth around the grain boundaries of quartz; (e) the disseminated dolomite-(Fe) REE ores showing the presence of pyrite, quartz, magnetite, fluorite, as well as individual monazite-(Ce) with apatite overgrowth along its rim; (f) the individual monazite-(Ce) was usually partially replaced and overgrown by apatite and bastnäsite-(Ce), showing a alteration texture, in the disseminated dolomite-(Fe) REE ores. Abbreviations: Dol-(Fe), dolomite-(Fe); Mnz, monazite-(Ce); Bast, bastnaesite-(Ce); Fl, fluorite; Ap, apatite; Mag, magnetite; Qz, quartz; Py, pyrite; Par, parisite-(Ce); Brt, barite; Mg-Rbk, magnesio-riebeckite; Or, orthoclase.
Minerals 12 00426 g010
Table 1. Summary of the mineral abundance and EDS elemental spectral lines used for the Bayan Obo drill core samples from different depths given by TIMA analysis (in Vol. %).
Mineral NameEDS Elemental Spectral LinesDepth and Mineral Abundance
1107 m1246 m1406 m1546 m1682 m
Dolomite-(Fe)Ca-K, Mg-K, Fe-K68.4149.6151.4283.3590.40
Magnetite/HematiteFe-K, O-K8.8422.7811.854.500.09
FluoriteCa-K, F-K14.9910.9516.030.350.01
Monazite-(Ce)P-K, O-K, La-L, Ce-L, Nd-L2.553.430.440.723.18
ApatiteCa-K, P-K, O-K, F-K0.180.054.075.960.00
QuartzSi-K, O-K0.010.021.530.020.50
BiotiteK-K, Al-K, Si-K, Mg-K, Fe-K2.511.992.510.011.88
Bastnäsite-(Ce)Ca-K, La-L, Ce-L, F-K, P-K0.100.043.664.370.48
Mg-silicate/clayMg-K, Si-K, Al-K, K-K, Ca-K, Fe-K0.062.590.330.000.11
Magnesio-riebeckiteNa-K, Mg-K, Ca-K, Fe-K, Al-K, Si-K0.420.053.180.021.08
PyriteFe-K, S-K0.183.080.360.020.09
SellaiteMg-K, F-K0.003.360.000.000.00
Altered dolomite-(Fe)Mg-K, Ca-K, F-K, Fe-K0.070.132.810.100.01
CalciteCa-K, Mg-K, Fe-K, 0.010.020.020.001.26
IlmeniteTi-K, Fe-K, O-K, Mn-K0.780.660.050.080.01
Parisite-(Ce)/Synchysite-(Ce)Ca-K, La-L, Ce-L, F-K, S-K0.010.000.260.200.01
BariteBa-L, S-K0.000.020.240.000.12
Dolomite-(Mn)Ca-K, Mg-K, Fe-K, Mn-K0.010.360.000.000.00
PyrrhotiteFe-K, S-K0.020.250.000.000.00
Huanghoite-(Ce)/Cebaite-(Ce)Ce-L, Ba-L, F-K0.180.000.010.000.08
Cerite-(Ce)Si-K, La-L, Ce-L, Nd-L0.010.010.190.020.01
Columbite-(Fe)O-K, Ti-K, Mn-K, Fe-K, Ta-M0.030.020.010.010.00
SphaleriteZn-K, Zn-L, S-K0.020.080.010.000.00
FersmiteCa-K, Nb-L, Ce-L, Ti-K, Ta-M, Fe-K0.050.040.000.000.00
Aeschynite-(Ce)Nd-L, Th-L, Fe-K, Ti-K, Nb-L0.020.050.000.000.00
GalenaPb-L, Pb-M, S-K0.000.020.030.000.00
Rutile-NbNb-L, Ti-K, Fe-K, Si-K0.000.000.000.010.00
The rest *-0.540.390.990.260.68
Note: Where “*” represents other accessory mineral phases with abundance less than 0.01%, such as biotite and molybdenite.
Table 2. Summary of Ce deportment of the Bayan Obo drill core samples from different depths given by TIMA analysis (wt. %).
Mineral Name1107 m1246 m1406 m1546 m1682 m
Monazite-(Ce)88.1896.858.8612.7283.55
Bastnäsite-(Ce)3.491.0576.8682.1113.18
Parisite-(Ce)/Synchysite-(Ce)0.32-6.424.320.48
Cerite-(Ce)0.670.407.750.850.72
Huanghoite-(Ce)/Cebaite-(Ce)6.26-0.11-2.07
Aeschynite-(Ce)0.661.47---
Fersmite-(Ce)0.420.23---
Publisher’s Note: MDPI stays neutral with regard to jurisdictional claims in published maps and institutional affiliations.

