
Microscopic-Scale Examination of the Black and Orange–Yellow Colours of Architectural Glazes from Aššur, Khorsabad and Babylon in Ancient Mesopotamia

 , ,
, ,
Abstract
:1. Introduction
2. Materials and Methods
2.1. Short Description of the Studied Bricks
2.2. Sampling and Preparation of Cross-Sections
2.3. Instrumental Analysis
2.3.1. Microstructural Studies
2.3.2. Chemical Composition Studies
X-ray Fluorescence Spectroscopy (XRF)
Scanning Electron Microscopy—Energy Dispersive X-ray Spectroscopy (SEM-EDX)
Micro-Raman
2.4. Synthesis of Two Lead Antimonate Reference Compounds
3. Results
3.1. The Black Colour
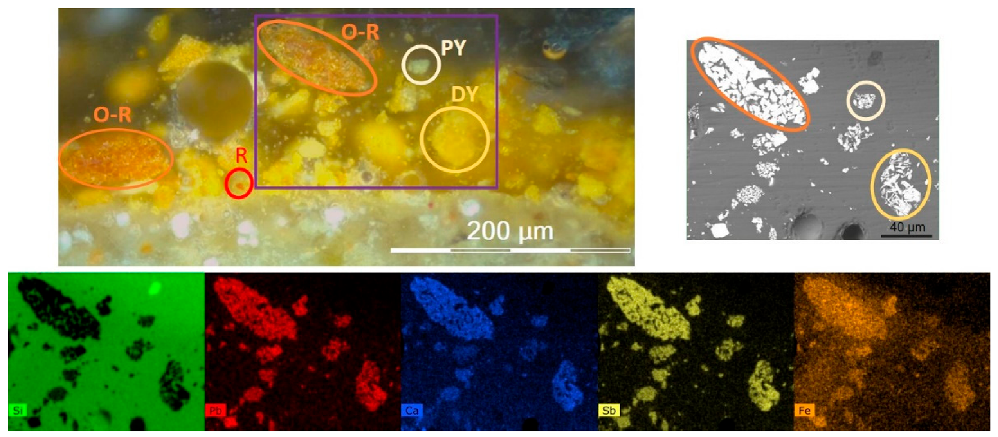
3.2. The Orange–Yellow Colour
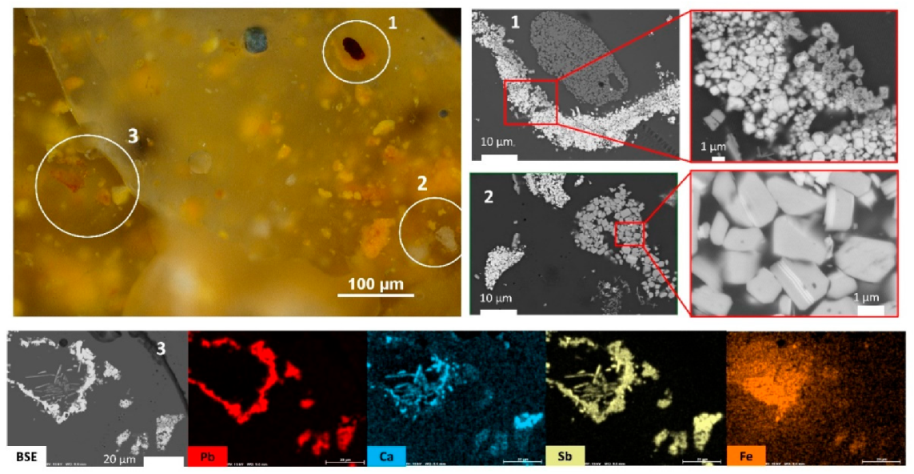
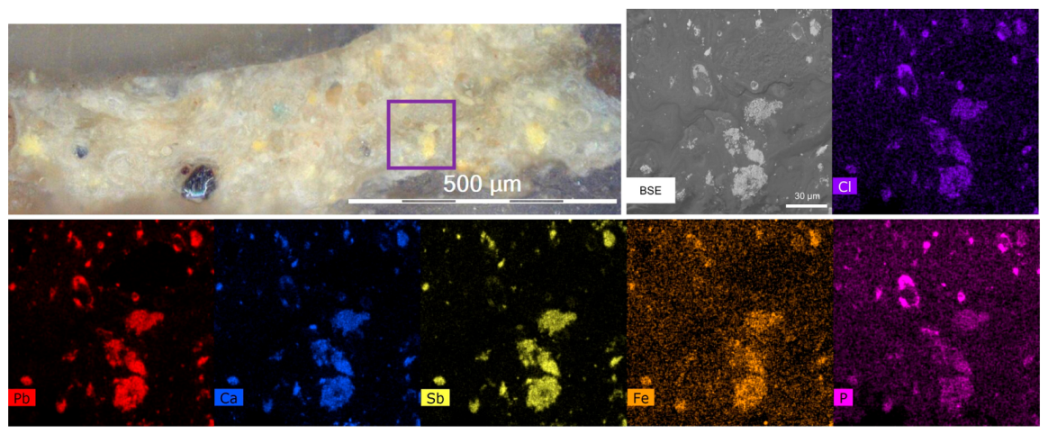
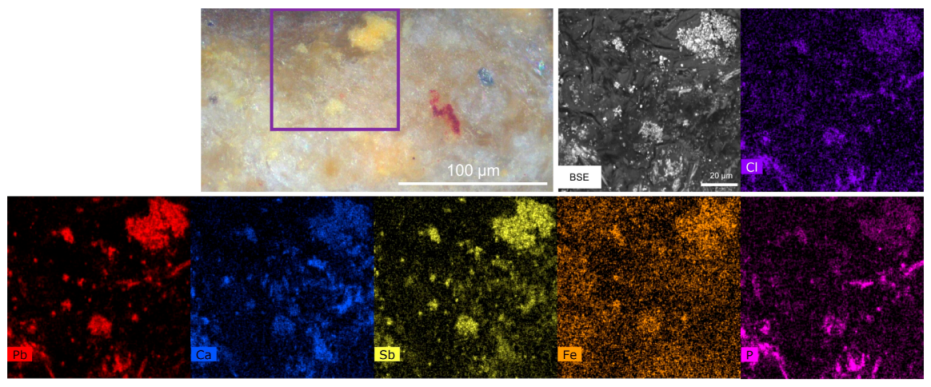
3.2.1. The Orange–Yellow Colour of Khorsabad and Babylon
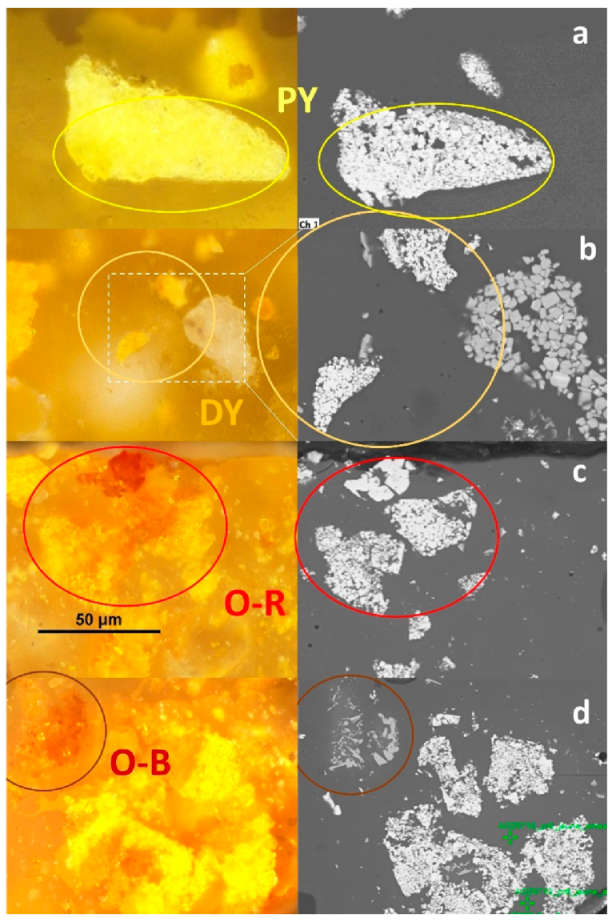
- (1)
- Zone (1) contains a hematite inclusion surrounded by a lead antimonate inclusion shaped as a croissant. In the magnified BSE image of the lead antimonate crystals, a chemical contrast can be observed with greyer crystals on the side of hematite. From EDX mapping of this area (not shown), this bright/grey contrast is due to lead/calcium substitution within the crystals;
- (2)
- Zone (2) corresponds to a large inclusion of calcium antimonate (grey “bunch of grapes” shaped inclusion, already shown in Figure 8b) laid next to two smaller inclusions of lead antimonates (white on the BSE image). The magnified BSE image of these Ca-antimonates show that some crystals are crossed from side to side by white Pb-rich lines;
- (3)
- Zone (3) is very complex with iron enrichment in the left-centre of the zone, although no hematite crystal can be discerned. On this left-centre zone, a bow of lead antimonates surrounds long needle-shaped crystals of Ca-antimonates, the morphology of the latter suggesting that they have formed by precipitation and growth. The internal antimonate crystals of the bow are strongly Ca-enriched. On the right-centre zone, four small inclusions of lead antimonate are visible, displaying different shades of yellow on the optical microscopy image. Two inclusions at the bottom are dark yellow and Fe-enriched, while the larger inclusion on the right is pale yellow and Ca-enriched. This latter inclusion even bears white Ca-antimonate crystals on the top of it.
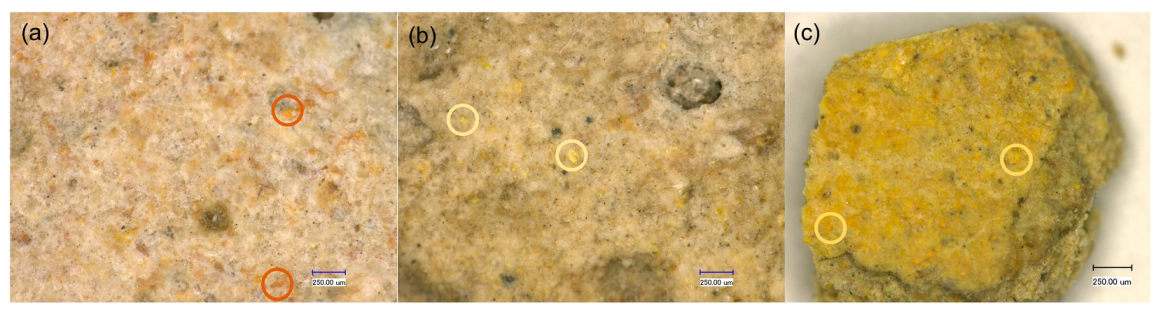
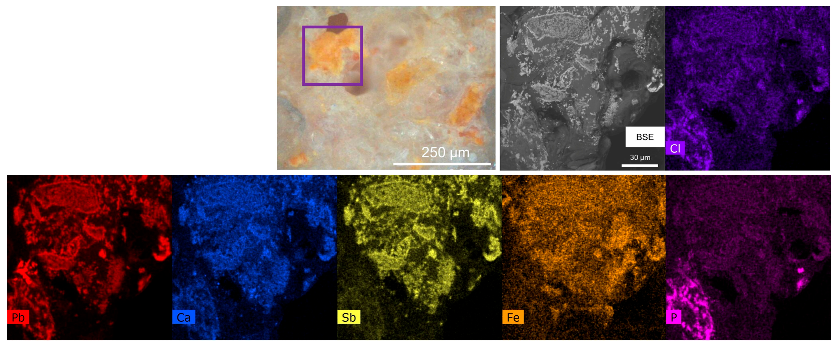
3.2.2. The Orange–Yellow Colour of Aššur
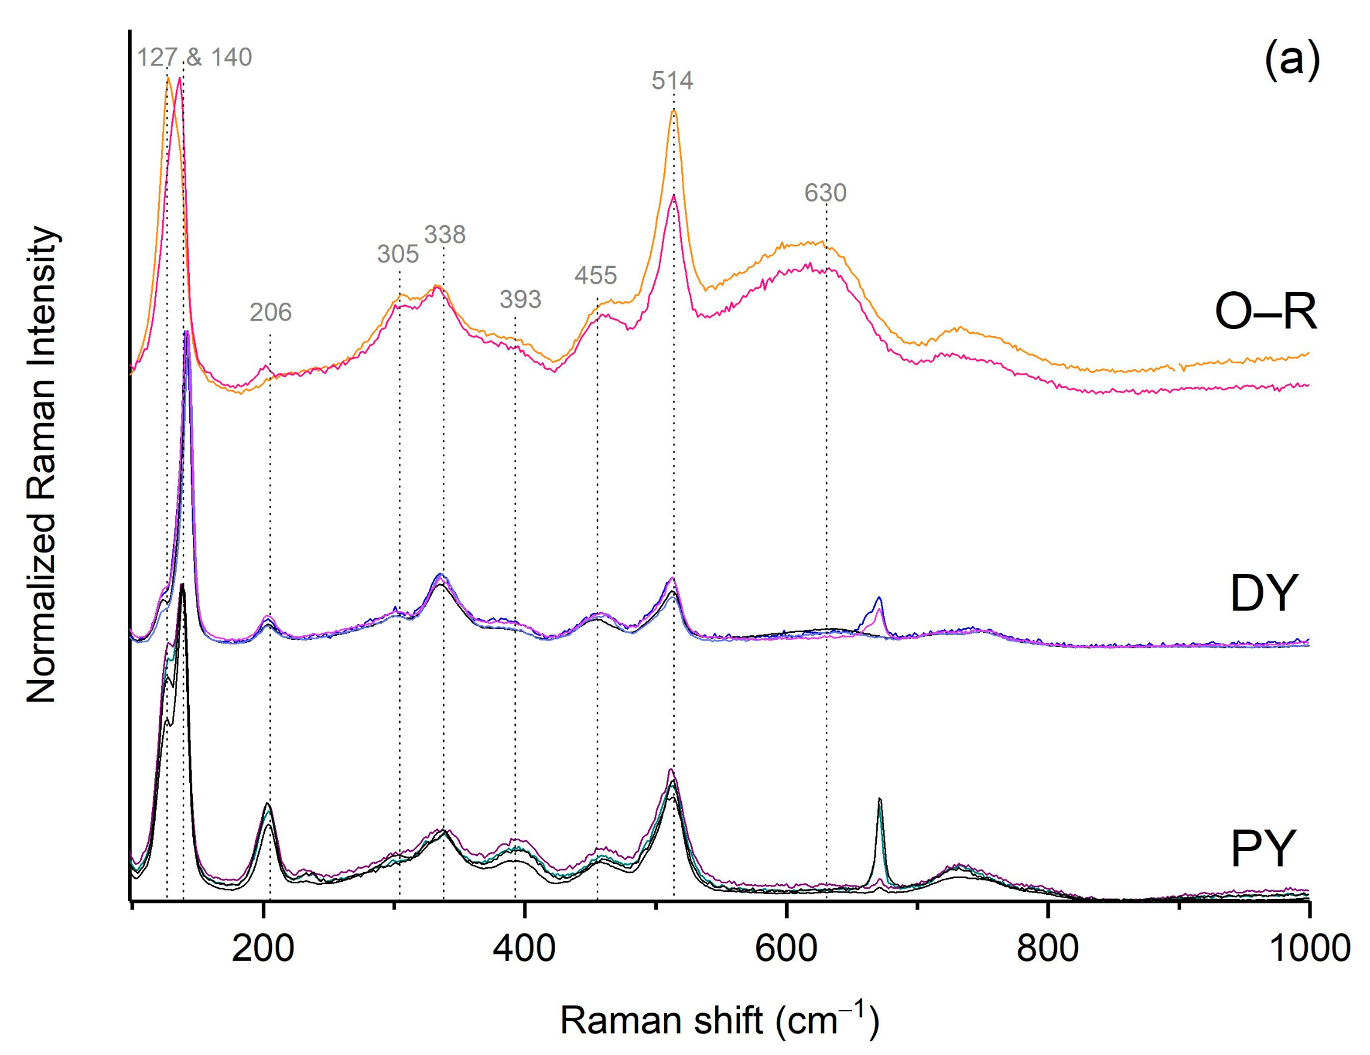
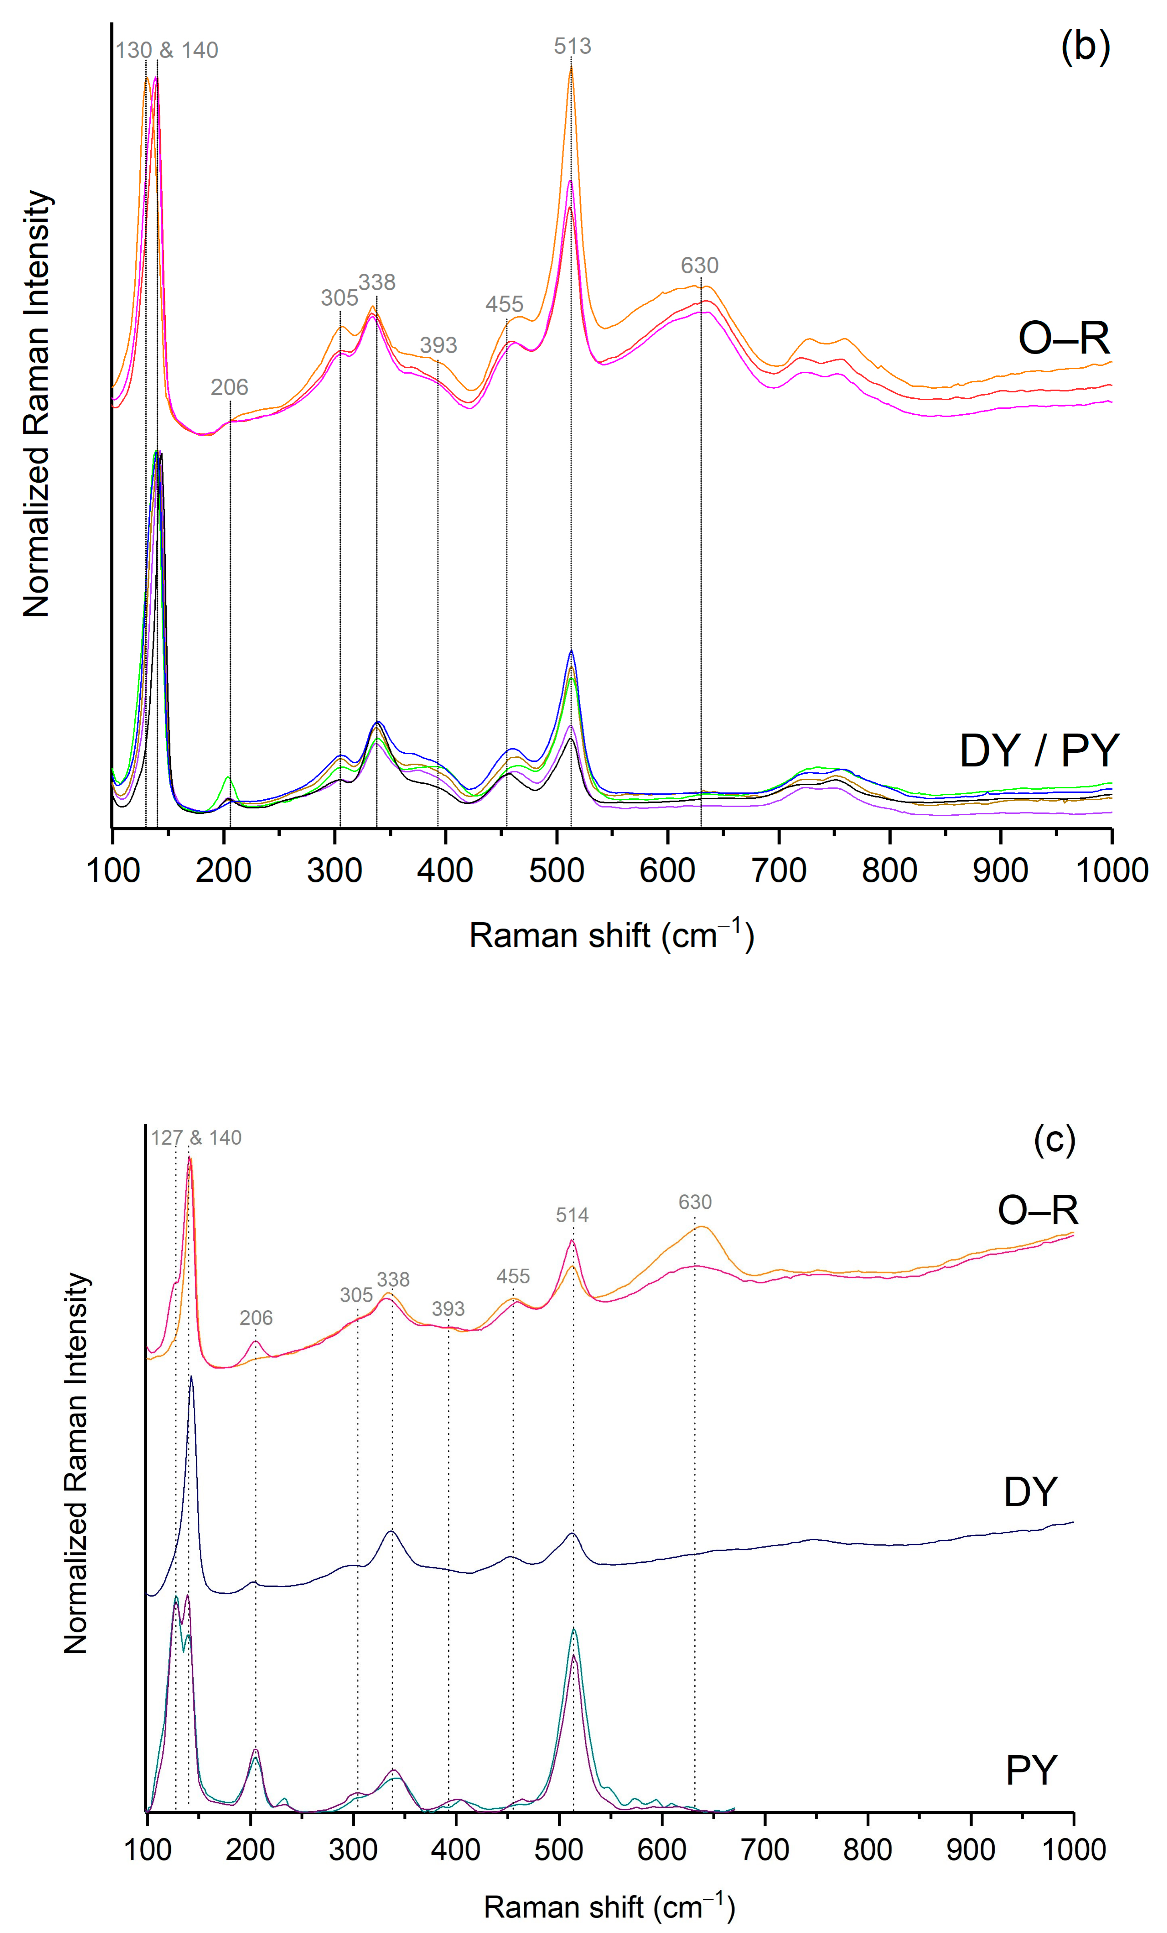
3.2.3. Compositional Analysis of the Lead Antimonate by EDX and Raman
3.3. The Glass Matrix of the Black and Orange–Yellow-Coloured Glazes
4. Discussion
5. Conclusions
Supplementary Materials
Author Contributions
Funding
Data Availability Statement
Acknowledgments
Conflicts of Interest
References
- Fügert, A.; Gries, H. Chapter 1: ‘I had baked bricks glazed in lapis lazuli color’—A brief history of glazed bricks in the Ancient Near East. In Glazed Brick Decoration in the Ancient Near East, Proceedings of a Workshop at the 11th International Congress of the Archaeology of the Ancient Near East (Munich) in April 2018, Munich, Germany, 3–7 April 2018; Fügert, A., Gries, H., Eds.; Archaeopress Publishing Ltd.: Oxford, UK, 2020; pp. 1–15. [Google Scholar]
- McCarthy, B.; Paynter, S. Chapter 9: Production of glazed pottery and brickwork in the Near East. In Production Technology of Faience and Related Early Vitreous Materials; Tite, M.S., Shortland, A.J., Eds.; Oxford University School of Archaeology: Oxford, UK, 2008; pp. 187–198. [Google Scholar]
- Paynter, S.; Tite, M.S. The evolution of glazing technologies in the Ancient Near East and Egypt. In The Social Context of Technological Change. Egypt and the Near East, 1650–1550 BC; Shortland, A.J., Ed.; Oxbow Books: Oxford, UK, 2001; pp. 239–254. [Google Scholar]
- Gries, H.; Schmidt, K. The core-formed glass vessels from Middle Assyrian Aššur. Z. Assyriol. Vorderasiat. Archäologie 2020, 110, 242–275. [Google Scholar] [CrossRef]
- Freestone, I. Technical examination of Neo-Assyrian glazed wall plaques. Iraq 1991, 53, 55–58. [Google Scholar] [CrossRef]
- Holakooei, P. A multi-spectroscopic approach to the characterization of early glaze opacifiers: Studies on an Achaemenid glazed brick found at Susa, south-western Iran (mid-first millennium BC). Spectrochim. Acta A Mol. Biomol. Spectrosc. 2013, 116, 49–56. [Google Scholar] [CrossRef]
- Holakooei, P.; Ahmadi, M.; Volpe, L.; Vaccaro, C. Early opacifiers in the glaze industry of first millenium BC Persia: Persepolis and Tepe Rabat. Archaeometry 2017, 59, 239–254. [Google Scholar] [CrossRef]
- Holakooei, P.; Soldi, S.; De Lapérouse, J.F.; Caro, F. Glaze composition of the Iron Age glazed ceramics from Nimrud, Hasanlu and Borsippa. J. Archaeol. Sci. Rep. 2017, 16, 224–232. [Google Scholar]
- Hedges, R. Pre-Islamic glazes in Mesopotamia-Nippur. Archaeometry 1976, 18, 209–238. [Google Scholar] [CrossRef]
- Hedges, R.; Moorey, P. Pre-Islamic ceramic glazes at Kish and Nineveh in Iraq. Archaeometry 1975, 17, 25–43. [Google Scholar] [CrossRef]
- Tite, M.S.; Shortland, A.J. Report on the scientific examination of a glazed brick from Susa: Glazes. In Persiens Antike Pracht-Band 2; Stöllner, T., Slotta, R., Vatandoust, A., Eds.; University of Pennsylvania Press: Philadelphia, PA, USA, 2004; pp. 338–390. [Google Scholar]
- Stapleton, C. Glass and glaze analysis and technology from Hasanlu, period IVB. In Peoples and Crafts in Period IVB at Hasanlu, Iran; De Schauensee, M., Ed.; University of Pennsylvania Press: Philadelphia, PA, USA, 2011; pp. 87–102. [Google Scholar]
- Bouquillon, A.; Kaczmarczyk, A.; Vandiver, P. Chapter 5: Faience production in the Near East and the Indus Valley. In Production Technology of Faience and Related Early Vitreous Materials; Tite, M.S., Shortland, A.J., Eds.; Oxford University School of Archaeology: Oxford, UK, 2008; pp. 93–109. [Google Scholar]
- Holakooei, P. Chapter 2: Scientific research on the Iron Age glazes from Iran and Iraq: Past and future. In Glazed Brick Decoration in the Ancient Near East, Proceedings of a Workshop at the 11th International Congress of the Archaeology of the Ancient Near East (Munich) in April 2018, Munich, Germany, 3–7 April 2018; Fügert, A., Gries, H., Eds.; Archaeopress Publishing Ltd.: Oxford, UK, 2020; pp. 16–27. [Google Scholar]
- Fügert, A.; Gries, H. Chapter 3: The reconstruction of the glazed brick facades from Ashur in the Vorderasiatisches Museum, Berlin (GlAssur Project). In Glazed Brick Decoration in the Ancient Near East, Proceedings of a Workshop at the 11th International Congress of the Archaeology of the Ancient Near East (Munich) in April 2018, Munich, Germany, 3–7 April 2018; Fügert, A., Gries, H., Eds.; Archaeopress Publishing Ltd.: Oxford, UK, 2020; pp. 28–46. [Google Scholar]
- Gries, H.; Fügert, A. Neues Altes aus Assur-Das GlAssur-Projekt-Die Rekonstruktion der Glasurziegelfassaden aus Assur im Vorderasiatischem Museum. Alter Orient Aktuell 2019, 16, 11–17. [Google Scholar]
- Gries, H.; Fügert, A. The glazed brick façades from Ashur in the Vorderasiatisches Museum Berlin in context of the North-Western Iranian glazed bricks. In Proceedings of Iron Age in Western Iran and the Neighboring Regions: Problems and Priorities; Hassanzadeh, Y., Vahdati, A.A., Karimi, Z., Eds.; Research Institute of Cultural Heritage and Tourism: Tehran, Iran; National Museum of Iran: Tehran, Iran; Kurdistan Province ICHHTO: Sanandaj, Iran, 2019; pp. 258–272. [Google Scholar]
- Thomas, A. Chapter 4: Glazed bricks by the dozens: A Khorsabad jigsaw reassembled at the Louvre. In Glazed Brick Decoration in the Ancient Near East, Proceedings of a Workshop at the 11th International Congress of the Archaeology of the Ancient Near East (Munich) in April 2018, Munich, Germany, 3–7 April 2018; Fügert, A., Gries, H., Eds.; Archaeopress Publishing Ltd.: Oxford, UK, 2020; pp. 48–84. [Google Scholar]
- Thomas, A. Un puzzle en briques émaillées de Khorsabad. Rev. Assyriol. Archeol. Orient. 2020, 114, 103–158. [Google Scholar] [CrossRef]
- Pedersén, O. Chapter 6: The glazed bricks that ornamented Babylon—A short overview. In Glazed Brick Decoration in the Ancient Near East, Proceedings of a Workshop at the 11th International Congress of the Archaeology of the Ancient Near East (Munich) in April 2018, Munich, Germany, 3–7 April 2018; Fügert, A., Gries, H., Eds.; Archaeopress Publishing Ltd.: Oxford, UK, 2020; pp. 96–122. [Google Scholar]
- Schmidt, K. Glass and Glass Production in the Near East during the Iron Age. Evidence from Objects, Texts and Chemical Analysis; Archaeopress Publishing Ltd.: Oxford, UK, 2019. [Google Scholar]
- Kaczmarczyk, A. Méthodes d’analyse. Caractérisations des compositions en fonction des époques et des régions—Historical and regional variations in compositions. In Faïences et Matières Vitreuses de l’Orient Ancien; Bouquillon, A., Caubet, A., Kaczmarczyk, A., Matoían, V., Eds.; Snoeck–Musée du Louvre: Ghent, Belgium; Paris, France, 2007; pp. 17–27. [Google Scholar]
- Kaczmarczyk, A.; Hedges, R. Chap. 2—The elemental composition of faience glazes. In Ancient Egyptian Faience—An Analytical Survey of Egyptian Faience from Predynastic to Roman Times; Kaczmarczyk, A., Hedges, R., Eds.; Aris & Phillips Ltd.: Warminster, UK, 1983; pp. 20–139. [Google Scholar]
- Lahlil, S.; Cotte, M.; Biron, I.; Szlachetko, J.; Menguy, N.; Susini, J. Synthesizing lead antimonate in ancient and modern opaque glass. J. Anal. At. Spectrom. 2011, 26, 1040–1050. [Google Scholar] [CrossRef]
- Salinas, E.; Pradella, T.; Matin, M.; Tite, M. From tin- to antimony-based yellow opacifiers in the early Islamic Egyptian glazes: Regional influences and ruling dynasties. J. Archaeol. Sci. Rep. 2019, 26, 101923. [Google Scholar] [CrossRef]
- Caubet, A.; Pierrat-Bonnefois, G. Catalogue d’exposition: Faïences de l’Antiquité. De l’Égypte à l’Iran; Musée du Louvre: Paris, France, 2005. [Google Scholar]
- Rosi, F.; Manuali, V.; Miliani, C.; Brunetti, B.G.; Sgamellotti, A.; Grygar, T.; Hradil, D. Raman scattering features of lead pyroantimonate compounds: Part I: XRD and Raman characterization of Pb2Sb2O7 doped with tin and zinc. J. Raman Spectrosc. 2009, 40, 107–111. [Google Scholar] [CrossRef]
- Rosi, F.; Manuali, V.; Grygar, T.; Bezdicka, P.; Brunetti, B.G.; Sgamellotti, A.; Burgio, L.; Seccaroni, C.; Miliani, C. Raman scattering features of lead pyroantimonate compounds: Implication for the non-invasive identification of yellow pigments on ancient ceramics. Part II. In situ characterisation of Renaissance plates by portable micro-Raman and XRF studies. J Raman Spectrosc. 2011, 42, 407–414. [Google Scholar] [CrossRef]
- Molina, G.; Odin, G.; Pradell, T.; Shortland, A.J.; Tite, M.S. Production technology and replication of lead antimonate yellow glass from New Kingdom Egypt and the Roman Empire. J. Archaeol. Sci. 2014, 41, 171–184. [Google Scholar] [CrossRef]
- Holakooei, P. A technological study of the elamite polychrome glazed bricks at Susa, south-western Iran. Archaeometry 2014, 56, 764–783. [Google Scholar] [CrossRef]
- Caubet, A.; Kaczmarczyk, A. Les briques glaçurées du palais de Darius: La frise des archers. Techné 1998, 7, 23–26. [Google Scholar]
- Jung, M.; Hauptmann, A. Katalog der Ausstellung des Deutschen Bergbau-Museums Bochum, Band 2. In Persiens Antike Pracht: Bergbau, Handwerk, Archäologie; Stöllner, T., Slotta, R., Vatandoust, A., Eds.; Deutschen Bergbau-Museums Bochum: Bochum, Germany, 2004; pp. 390–392. [Google Scholar]
- Schlick-Nolte, B.; Werthmann, R. Glass vessels from the burial of Nesikhons. J. Glass Stud. 2003, 45, 11–34. [Google Scholar]
- Schreurs, J.; Brill, R. Iron and sulfur related colors in ancient glasses. Archaeometry 1984, 26, 199–209. [Google Scholar] [CrossRef]
- Hradil, D.; Grygar, T.; Hradilova, J.; Bezdicka, P.; Grunwaldova, V.; Fogas, I.; Miliani, C. Microanalytical identification of Pb-Sb-Sn yellow pigment in historical European paintings and its differentiation from lead tin and Naples yellows. J. Cult. Herit. 2007, 8, 377–386. [Google Scholar] [CrossRef]
- Ceglia, A.; Nuyts, G.; Cagno, S.; Meulebroeck, W.; Baert, K.; Cosyns, P.; Nys, K.; Thienpont, H.; Janssens, K.; Terryn, H. A XANES study of chromophores: The case of black glass. Anal. Methods 2014, 6, 2662–2671. [Google Scholar] [CrossRef]
- Prinsloo, L.; Colomban, P. A Raman spectroscopic study of the Mapungubwe oblates: Glass trade beads excavated at an Iron Age archaeological site in South Africa. J. Raman Spectrosc. 2008, 39, 79–90. [Google Scholar] [CrossRef]
- Lenoir, M.; Grandjean, A.; Poissonet, S.; Neuville, D. Quantitation of sulfate solubility in borosilicate glasses using Raman spectroscopy. J. Non-Cryst. Solids 2009, 355, 1468–1473. [Google Scholar] [CrossRef]
- Cartechini, L.; Rosi, F.; Miliani, C.; D’Acapito, F.; Brunetti, B.; Sgamellotti, A. Modified Naples yellow in Renaissance majolica: Study of Pb-Sb-Zn and Pb-Sb-Fe ternary pyroantimonates by X-ray absorption spectroscopy. J. Anal. At. Spectrom. 2011, 26, 2500–2507. [Google Scholar] [CrossRef]
- Sayre, E.; Smith, R. Compositional categories of ancient glass. Science 1961, 133, 1824–1826. [Google Scholar] [CrossRef] [PubMed]
- Henderson, J. The early materials of early glass production. Oxf. J. Archeol. 1985, 4, 267–291. [Google Scholar] [CrossRef]
- Freestone, I. Glass production in Late Antiquity and the Early Islamic period: A geochemical perspective. Geol. Soc. Spec. Publ. 2006, 257, 201–216. [Google Scholar] [CrossRef]
- Shortland, A.J. The use and origin of antimonate colorants in early egyptian glass. Archaeometry 2002, 44, 517–530. [Google Scholar] [CrossRef]
- Bouquillon, A.; Caubet, A.; Kaczmarczyk, A.; Matoían, V. Faïences et Matières Vitreuses de l’Orient Ancien; Bouquillon, A., Caubet, A., Kaczmarczyk, A., Matoían, V., Eds.; Snoeck–Musée du Louvre: Ghent, Belgium; Paris, France, 2007. [Google Scholar]
- Fitz, S. Die Farbglasuren spätbabylonischer Wandverkleidungen—The colored glazes of Neo-Babylonian wall facings. Ceram. Forum Int. Ber. Der Dtsch. Keram. Ges. 1982, 59, 179–185. [Google Scholar]
- Kirk, S. The Vitreous Materials from the 2nd Millennium BC City of Nuzi: Their Preservation, Technology and Distribution. Ph.D. Thesis, Cranfield University, Cranfield, UK, 2009. [Google Scholar]
- Stapleton, C.; Swanson, S. Batch material processing and glassmaking technology of 9th century B.C. Artifacts excavated from the site of Hasanlu, northwest Iran. Mat. Res. Soc. Symp. Proc. 2002, 712, II7.4.1–II7.4.7. [Google Scholar] [CrossRef]
- Ting, C.; Lichtenberger, A.; Raja, R. The technology and production of glazed ceramics from Middle Islamic Jerash, Jordan. Archaeometry 2019, 61, 1296–1312. [Google Scholar] [CrossRef]
- Arshad, M.; Wang, Z.; Nasir, J.A.; Amador, E.; Jin, M.; Li, H.; Chen, Z.; Rehman, Z.; Chen, W. Single source precursor synthesized CuS nanoparticles for NIR phototherapy of cancer and photodegradation of organic carcinogen. J. Photochem. Photobiol. B 2020, 214, 112084. [Google Scholar] [CrossRef]
- Coughlan, C.; Ibanez, M.; Dobrozhan, O.; Singh, A.; Cabot, A.; Ryan, K.M. Compound copper chalcogenide nanocrystals. Chem. Rev. 2017, 117, 5865–6109. [Google Scholar] [CrossRef]
- Gargioni, C.; Borzenkov, M.; D’Alfonso, L.; Sperandeo, P.; Polissi, A.; Cucca, L.; Dacarro, G.; Grisoli, P.; Pallavicini, P.; D’Agostino, A.; et al. Self-assembled monolayers of copper sulfide nanoparticles on glass as antibacterial coatings. Nanomaterials 2020, 10, 352. [Google Scholar] [CrossRef] [Green Version]
- De Ryck, I.; Adriaens, A.; Adams, F. An overview of Mesopotamian bronze metallurgy during the 3rd millennium BC. J. Cult. Herit. 2005, 6, 261–268. [Google Scholar] [CrossRef] [Green Version]
- Freestone, I.; Stapleton, C. Composition, technology, and production of coloured glasses from mosaic vessels of the Early Roman Empire. In Glass of the Roman Empire; Bayley, J., Freestone, I., Jackson, C., Eds.; Oxbow Books: Oxford, UK, 2015; pp. 61–76. [Google Scholar]
- Verita, M.; Magetti, M.; Sagui, L.; Santopadre, P. Colors of Roman glass: An investigation of the yellow sectilia in the Gorga collection. J. Glass Stud. 2013, 55, 21–34. [Google Scholar]
- Moretti, C.; Hreglich, S. Opacification and colouring of glass by the use of «anime». Glass Technol. 1984, 25, 277–282. [Google Scholar]


| Sample | Si | S | Cu | Fe | Pb | Sb | (Cu + Pb + Sb + Fe)/S |
|---|---|---|---|---|---|---|---|
| K-N8098 | 21.16 | 5.04 | 1.95 | 0.82 | 0.57 | 0.67 | 0.8 |
| Sigma | 1.38 | 1.65 | 0.94 | 0.32 | 0.32 | 0.52 | |
| K-N8098 Glass Matrix | 26.69 | 0.22 | <loq | 0.22 | <loq | <loq | |
| Sigma | 0.46 | 0.05 | 0.03 |
| Archeological Site | Pigment Colour | O | Si | Na | Mg | K | Al | Cl | Ca | Fe | Pb | Sb | |
|---|---|---|---|---|---|---|---|---|---|---|---|---|---|
| Khorsabad | O–R | Mean | 55.53 | <loq | 0.59 | <loq | <loq | 0.55 | 0.49 | 4.03 | 5.13 | 15.64 | 17.41 |
| Sigma | 0.09 | 0.31 | 0.00 | 0.06 | 0.64 | 0.87 | 0.62 | 0.26 | |||||
| DY | Mean | 55.28 | 2.00 | 2.13 | 0.77 | <loq | 0.61 | 0.30 | 2.43 | 3.56 | 17.15 | 15.73 | |
| Sigma | 0.25 | 2.25 | 1.25 | 1.10 | 0.22 | 0.01 | 0.57 | 2.25 | 2.61 | 0.37 | |||
| PY | Mean | 54.99 | 2.34 | 3.35 | 0.88 | <loq | 0.83 | 0.28 | 3.73 | 2.45 | 15.25 | 15.90 | |
| Sigma | 0.49 | 1.24 | 0.69 | 0.16 | 0.18 | 0.11 | 0.79 | 0.52 | 2.04 | 0.83 | |||
| O–B | Mean | 59.41 | 2.31 | 1.40 | 0.22 | <loq | 0.22 | <loq | 1.75 | 17.70 | 0.10 | 16.74 | |
| Sigma | 0.10 | 1.66 | 0.63 | 0.03 | 0.09 | 0.14 | 0.87 | 0.05 | 1.56 | ||||
| Glass Matrix 2% at Si | Mean | - | 2.00 | 0.76 | 0.10 | 0.11 | 0.04 | 0.03 | 0.11 | 0.07 | 0.05 | 0.02 | |
| Babylon | O–R | Mean | 54.99 | <loq | 1.02 | 0.93 | <loq | 0.80 | 0.31 | 3.52 | 3.76 | 17.68 | 16.92 |
| Sigma | 0.29 | 0.50 | 0.33 | 0.38 | 0.03 | 0.88 | 1.05 | 1.06 | 0.56 | ||||
| DY | Mean | 54.83 | <loq | 1.02 | 0.63 | <loq | 0.36 | 0.39 | 2.45 | 3.44 | 19.61 | 17.22 | |
| Sigma | 0.17 | 0.33 | 0.22 | 0.11 | 0.21 | 1.03 | 1.05 | 1.44 | 0.98 | ||||
| PY | Mean | 54.89 | 2.24 | 3.43 | 1.53 | <loq | 1.12 | 0.27 | 2.87 | 1.79 | 15.67 | 16.15 | |
| Sigma | 0.09 | 0.72 | 1.04 | 0.20 | 0.05 | 0.17 | 0.32 | 1.15 | 1.18 | 0.42 | |||
| Glass Matrix 2.24% at Si | Mean | - | 2.24 | 0.91 | 0.22 | 0.15 | 0.07 | 0.03 | 0.16 | 0.03 | 0.07 | 0.02 | |
| Aššur * | O–R | Mean | 57.19 | 6.98 | 1.41 | 0.73 | 0.17 | 0.65 | 0.26 | 1.51 | 4.45 | 14.82 | 11.81 |
| Sigma | 0.21 | 0.86 | 0.78 | 0.26 | 0.12 | 0.14 | 0.07 | 0.18 | 0.27 | 1.23 | 1.33 | ||
| DY | Mean | 55.76 | 4.81 | 2.38 | 1.24 | 0.28 | 1.63 | 0.67 | 3.20 | 3.11 | 14.23 | 12.69 | |
| Sigma | 0.17 | 0.55 | 0.56 | 0.26 | 0.07 | 0.08 | 0.27 | 0.83 | 0.20 | 1.52 | 0.37 | ||
| PY | Mean | 57.48 | 9.33 | 2.94 | 1.20 | 0.19 | 1.45 | 0.45 | 4.20 | 1.42 | 8.94 | 12.42 | |
| Sigma | 0.23 | 0.38 | 0.42 | 0.36 | 0.09 | 1.12 | 0.14 | 1.55 | 0.48 | 1.71 | 0.99 |
| Archeological Site | Pigment Colour | Pb | Ca | Sb | Fe | (Pb + Ca)/(Sb + Fe) | Pb/Sb | |
|---|---|---|---|---|---|---|---|---|
| Khorsabad | O-R | Mean | 1.48 | 0.38 | 1.65 | 0.49 | 0.87 | 0.90 |
| Sigma | 0.04 | 0.07 | 0.05 | 0.08 | ||||
| DY | Mean | 1.76 | 0.25 | 1.62 | 0.37 | 1.01 | 1.11 | |
| Sigma | 0.10 | 0.07 | 0.12 | 0.09 | ||||
| PY | Mean | 1.63 | 0.40 | 1.71 | 0.26 | 1.03 | 0.95 | |
| Sigma | 0.16 | 0.11 | 0.09 | 0.06 | ||||
| Fe/Sb | ||||||||
| O–B | Mean | 0.01 | 0.19 | 1.84 | 1.95 | 1.06 | ||
| Sigma | 0.01 | 0.01 | 0.05 | 0.05 | ||||
| (Pb + Ca)/(Sb + Fe) | ||||||||
| DY corrected | Mean | 1.77 | 0.24 | 1.63 | 0.36 | 1.01 | 1.11 | |
| Babylon | O–R | Mean | 1.69 | 0.33 | 1.62 | 0.36 | 1.02 | 1.04 |
| Sigma | 0.14 | 0.08 | 0.04 | 0.10 | ||||
| DY | Mean | 1.84 | 0.23 | 1.61 | 0.32 | 1.07 | 1.14 | |
| Sigma | 0.11 | 0.08 | 0.09 | 0.08 | ||||
| PY | Mean | 1.72 | 0.32 | 1.78 | 0.19 | 1.03 | 0.97 | |
| Sigma | 0.05 | 0.05 | 0.12 | 0.12 | ||||
| PY corrected | Mean | 1.72 | 0.30 | 1.78 | 0.19 | 1.02 | 0.97 | |
| Aššur * | O–R | Mean | 1.82 | 0.19 | 1.45 | 0.55 | 1.00 | 1.26 |
| Sigma | 0.09 | 0.05 | 0.03 | 0.08 | ||||
| DY | Mean | 1.71 | 0.39 | 1.53 | 0.37 | 1.10 | 1.12 | |
| Sigma | 0.13 | 0.12 | 0.02 | 0.03 | ||||
| PY | Mean | 1.33 | 0.62 | 1.84 | 0.21 | 0.95 | 0.72 | |
| Sigma | 0.27 | 0.22 | 0.09 | 0.07 |
| Pigment Colour | Pb | Na | Ca | Sb | Fe | (Pb + Ca + Na)/(Sb + Fe) | Pb/Sb |
|---|---|---|---|---|---|---|---|
| PY | 1.57 | 0.34 | 0.29 | 1.62 | 0.18 | 1.22 | 0.97 |
| PY corrected | 1.61 | 0.26 | 0.28 | 1.67 | 0.18 | 1.16 | 0.97 |
| Glaze | Sample | SiO2 | Na2O | MgO | K2O | CaO | Al2O3 | Cl | Fe2O3 | PbO | Sb2O3 | CuO | SO3 | |
|---|---|---|---|---|---|---|---|---|---|---|---|---|---|---|
| BLACK Khorsabad | K-N8098 | Mean | 68.98 | 17.00 | 2.83 | 2.93 | 5.63 | 1.18 | 0.44 | 0.34 | <loq | <loq | 0.07 | 0.60 |
| (decor) | Sigma | 0.65 | 0.30 | 0.17 | 0.05 | 0.09 | 0.21 | 0.11 | 0.04 | 0.04 | 0.13 | |||
| K-N8080 | Mean | 70.83 | 14.34 | 2.64 | 3.81 | 5.46 | 1.22 | 0.39 | 0.31 | <loq | 0.16 | 0.09 | 0.74 | |
| (decor) | Sigma | 0.79 | 0.29 | 0.16 | 0.05 | 0.35 | 0.14 | 0.11 | 0.09 | 0.11 | 0.06 | 0.24 | ||
| K-N8099 | Mean | 68.87 | 12.35 | 2.63 | 4.19 | 6.33 | 1.9 | 0.73 | 0.75 | <loq | 1.01 | 0.28 | 0.92 | |
| (line) | Sigma | 1.61 | 2.17 | 0.08 | 0.02 | 0.23 | 0.37 | 0.15 | 0.13 | 0.08 | 0.03 | 0.13 | ||
| Mean black samples | 69.56 | 14.56 | 2.70 | 3.64 | 5.81 | 1.43 | 0.52 | 0.47 | <loq | 0.39 | 0.15 | 0.75 | ||
| BLACK Babylon | B-LPS | Mean | 71.82 | 10.84 | 3.43 | 3.96 | 4.06 | 1.61 | 0.43 | 1.05 | 2.35 * | 0.9 * | <loq | <loq ** |
| (line) | Sigma | 0.85 | 0.20 | 0.08 | 0.09 | 0.10 | 0.17 | 0.01 | 0.08 | 0.25 | 0.18 | |||
| B-VA17274 | Mean | 72.34 | 10.83 | 3.56 | 3.81 | 4.88 | 1.81 | 0.37 | 1.19 | <loq | 0.15* | 0.65* | 0.36 | |
| (line) | Sigma | 1.02 | 0.08 | 0.18 | 0.06 | 0.32 | 0.17 | 0.04 | 0.05 | 0.15 | 0.06 | 0.02 | ||
| B-VA17282 | Mean | 74.30 | 11.64 | 3.35 | 3.19 | 3.57 | 1.49 | 0.43 | 1.13 | <loq | 0.31* | <loq | 0.44 | |
| (line) | Sigma | 0.08 | 0.11 | 0.02 | 0.05 | 0.04 | 0.04 | 0.03 | 0.18 | 0.01 | 0.01 | |||
| B-VA17270 | Mean | 71.07 | 13.02 | 3.52 | 4.09 | 4.35 | 1.57 | 0.43 | 0.94 | 0.22 | 0.15* | 0.22* | 0.42 | |
| (line) | Sigma | 0.40 | 0.06 | 0.04 | 0.18 | 0.07 | 0.17 | 0.00 | 0.26 | 0.01 | 0.08 | 0.18 | 0.01 | |
| Mean black samples (lines) | 72.38 | 11.58 | 3.46 | 3.76 | 4.22 | 1.62 | 0.42 | 1.08 | 0.64* | 0.38* | 0.22* | 0.31 | ||
| B-VA17275 | Mean | 63.78 | 16.26 | 4.82 | 4.21 | 6.52 | 2.24 | 0.55 | 1.05 | <loq | <loq | <loq | 0.56 | |
| (decor) | Sigma | 0.25 | 0.01 | 0.01 | 0.04 | 0.15 | 0.10 | 0.01 | 0.07 | 0.00 | ||||
| ORANGE Khorsabad | K-AO29710 | Mean | 68.46 | 10.72 | 0.96 | 1.87 | 2.63 | 1.03 | 0.66 | 5.16 | 6.94 | 1.58 | ||
| Sigma | 5.67 | 4.31 | 0.30 | 0.31 | 0.57 | 0.32 | 0.18 | 3.78 | 0.58 | 0.62 | ||||
| K-N8080 | Mean | 64.90 | 15.50 | 2.50 | 2.97 | 3.30 | 0.97 | 0.62 | 2.45 | 5.80 | 0.99 | |||
| Sigma | 0.23 | 0.16 | 0.09 | 0.03 | 0.23 | 0.10 | 0.15 | 0.51 | 0.27 | 0.16 | ||||
| K-N8098 | Mean | 67.95 | 13.55 | 2.67 | 3.04 | 3.62 | 0.92 | 0.74 | 1.80 | 4.88 | 0.85 | |||
| Sigma | 1.65 | 1.67 | 0.21 | 0.01 | 0.21 | 0.07 | 0.03 | 0.20 | 0.17 | 0.06 | ||||
| K-N8105 | Mean | 64.89 | 10.97 | 2.49 | 3.09 | 3.90 | 1.19 | 0.38 | 3.67 | 7.65 | 1.77 | |||
| Sigma | 1.81 | 0.73 | 0.17 | 0.04 | 0.30 | 0.13 | 0.12 | 0.55 | 0.71 | 0.45 | ||||
| K-N8123 | Mean | 66.32 | 14.66 | 2.58 | 3.48 | 3.67 | 0.98 | 0.87 | 2.22 | 4.32 | 0.89 | |||
| Sigma | 0.73 | 0.36 | 0.11 | 0.07 | 0.45 | 0.13 | 0.08 | 0.81 | 0.22 | 0.10 | ||||
| Mean orange samples | 66.50 | 13.08 | 2.24 | 2.89 | 3.42 | 1.02 | 0.65 | 3.06 | 5.92 | 1.22 | ||||
| Mean orange samples with substraction of PbO and Sb2O3 | 71.61 | 14.09 | 2.41 | 3.11 | 3.68 | 1.10 | 0.70 | 3.30 | 0.00 | 0.00 | ||||
| YELLOW Babylon | B-LPS | Mean | 62.93 | 13.61 | 4.62 | 3.40 | 4.61 | 1.80 | 0.49 | 1.06 | 6.26 | 1.23 | ||
| Sigma | 0.52 | 0.21 | 0.09 | 0.05 | 0.10 | 0.08 | 0.02 | 0.01 | 0.68 | 0.29 | ||||
| B-VA17268 | Mean | 62.95 | 12.78 | 3.74 | 3.39 | 4.00 | 1.40 | 0.50 | 0.99 | 8.58 | 1.67 | |||
| Sigma | 1.41 | 0.10 | 0.08 | 0.12 | 0.05 | 0.12 | 0.06 | 0.44 | 0.53 | 0.31 | ||||
| Mean yellow samples | 62.94 | 13.19 | 4.18 | 3.39 | 4.30 | 1.60 | 0.50 | 1.02 | 7.42 | 1.45 | ||||
| Mean yellow samples with substraction of PbO and Sb2O3 | 69.07 | 14.48 | 4.59 | 3.73 | 4.72 | 1.75 | 0.55 | 1.12 | 0.00 | 0.00 | ||||
| Glaze | Na2O/K2O | Na2O/CaO | Na2O/MgO |
|---|---|---|---|
| Khorsabad black | 4.0 | 2.5 | 5.4 |
| Khorsabad orange | 4.5 | 3.8 | 5.8 |
| Babylon black (lines) | 3.1 | 2.7 | 3.3 |
| Babylon black (flat décor) | 3.9 | 2.5 | 3.4 |
| Babylon yellow | 3.9 | 3.1 | 3.2 |
| Nimrud (plaque, various, Neo-Assyrian) | 2.0–4.7 | 2.0–2.5 | 3.1–5.3 |
| Babylon (brick, Neo-Babylonian) | 3.6–4.6 | 2.2–3.1 | 3.6–5.2 |
Publisher’s Note: MDPI stays neutral with regard to jurisdictional claims in published maps and institutional affiliations. |
© 2022 by the authors. Licensee MDPI, Basel, Switzerland. This article is an open access article distributed under the terms and conditions of the Creative Commons Attribution (CC BY) license (https://creativecommons.org/licenses/by/4.0/).
Share and Cite
Alloteau, F.; Majérus, O.; Gerony, F.; Bouquillon, A.; Doublet, C.; Gries, H.; Fügert, A.; Thomas, A.; Wallez, G. Microscopic-Scale Examination of the Black and Orange–Yellow Colours of Architectural Glazes from Aššur, Khorsabad and Babylon in Ancient Mesopotamia. Minerals 2022, 12, 311. https://doi.org/10.3390/min12030311
Alloteau F, Majérus O, Gerony F, Bouquillon A, Doublet C, Gries H, Fügert A, Thomas A, Wallez G. Microscopic-Scale Examination of the Black and Orange–Yellow Colours of Architectural Glazes from Aššur, Khorsabad and Babylon in Ancient Mesopotamia. Minerals. 2022; 12(3):311. https://doi.org/10.3390/min12030311
Chicago/Turabian StyleAlloteau, Fanny, Odile Majérus, Floriane Gerony, Anne Bouquillon, Christel Doublet, Helen Gries, Anja Fügert, Ariane Thomas, and Gilles Wallez. 2022. "Microscopic-Scale Examination of the Black and Orange–Yellow Colours of Architectural Glazes from Aššur, Khorsabad and Babylon in Ancient Mesopotamia" Minerals 12, no. 3: 311. https://doi.org/10.3390/min12030311
APA StyleAlloteau, F., Majérus, O., Gerony, F., Bouquillon, A., Doublet, C., Gries, H., Fügert, A., Thomas, A., & Wallez, G. (2022). Microscopic-Scale Examination of the Black and Orange–Yellow Colours of Architectural Glazes from Aššur, Khorsabad and Babylon in Ancient Mesopotamia. Minerals, 12(3), 311. https://doi.org/10.3390/min12030311