Article

Association Study on the Pore Structure and Mechanical Characteristics of Coarse-Grained Soil under Freeze–Thaw Cycles

School of Resources and Safety Engineering, Central South University, Changsha 410083, China
*
Author to whom correspondence should be addressed.
Minerals 2022, 12(3), 314; https://doi.org/10.3390/min12030314
Submission received: 18 January 2022 / Revised: 23 February 2022 / Accepted: 26 February 2022 / Published: 28 February 2022

Abstract

:
In this study, the relationship between the pore structure and macroscopic mechanical characteristics of coarse-grained soils from mine dumps is explored under various freeze–thaw cycles. A series of experiments were conducted on the mine dump materials using a standard cube sample of 7 cm × 7 cm × 7 cm, a moisture content of 7.5%, and a density of 2.34 g/cm3. The pore structure test and uniaxial compressive strength test were carried out on the coarse-grained soil samples under different freeze–thaw cycles by using a nuclear magnetic resonance (NMR) instrument and a universal servo material testing machine. The study explores the change law of the strength and pore structure of coarse-grained soil, and establishes the correlation model between the pore structure and mechanical characteristics. The results showed that: (1) With the increase in the number of freeze–thaw cycles, the porosity of the coarse-grained soil gradually increased, and the bonding ability between the internal soil particles weakened, resulting in a decrease in strength. (2) With the increase in freeze–thaw cycles, the proportion of pore volume of the main peak and secondary peak 2 of T-2 spectrum curve increases gradually, and the internal pore structure of coarse-grained soil gradually develops towards medium and large pores. (3) There is an exponential function between the variation of pore volume proportion of each peak of coarse-grained soil and the relative strength value, and there is a good fitting coefficient between the two, indicating that the change of pore structure can well reflect the evolution law of strength.

1. Introduction

With the gradual increase in the mining scale of mineral resources, the number of mine dumps is increasing, and the mechanical properties of the soil in dumps are also being given more and more attention [1,2,3]. In the seasonal freeze–thaw area, the soil body of the dump site is affected by the changes of water, heat, and force during the freeze–thaw process, and its mechanical properties change, which makes the dump site unstable [4,5]. The dump is mainly composed of waste rock and soil particles stripped during mining, and its mechanical properties are closely related to the stability of the dump, which is the basis for the study of the stability and disaster mechanism of the dump [6,7,8,9]; therefore, understanding the mechanical properties of the soil in the dump under the action of freeze–thaw cycles will be helpful to store the dump materials scientifically, optimize the dump process, and then analyze the stability of the dump slope, as well as the disaster risk prediction to ensure the safety of life and property of the surrounding people [10,11,12,13,14].
In the study of soil mechanics characteristics, Chen Tao et al. [15] showed that under the influence of freeze–thaw cycles, the uniaxial compressive strength of coarse-grained soil decreased exponentially with the increase in the number of freeze– thaw cycles; the uniaxial compressive strength of freezing–thawing clay is about 33–50% of that of undisturbed soil [16]; Hotineanu, A et al. [17] took clay as the research object and found that after freeze–thaw cycles, the cohesion of the soil decreased, while the internal friction angle increased as a whole. It was believed that the effect of freeze–thaw cycles on shear strength was the main one, which was reflected in the cohesion; the difference in the gravel content will also make the shear index of the coarse-grained soil different. Under the same particle size gradation, the internal friction angle of the coarse-grained soil has an increasing relationship with the gravel content in the shear zone of the sample. As the gravel content increases, the internal friction angle may decrease [18]; Baghdadi Z A et al. [19], Yarbasi N et al. [20], and Fard, AR et al. [21] pointed out that under freezing–thawing cycle, the durability of soil gradually decreases, and the mass loss rate of freezing–thawing durability test was strongly correlated with freezing–thawing strength; Ishikawa, T et al. [22] pointed out that the particle breakage rate of soil increases with the increase in the number of freeze–thaw cycles, while the strength and stiffness gradually decrease; with reference to the experimental results of water content and freezing–thawing cycles on the compacted expansive soil, Zhibin Tu [23] constructed a three-dimensional strength prediction model when taking the interaction of freezing–thawing cycle and water content into consideration; Ling, XZ et al. [24] studied the effect of freeze–thaw cycles on the mechanical properties of coarse-grained soil materials, proposed a stress–strain prediction model for residual strength based on a continuous damage mechanics framework, and verified it.
With the deepening of research, it has been found that the nature of the decrease in mechanical properties of freezing–thawing porous materials is that the freezing–thawing action changes their internal microstructure [25,26,27,28,29,30,31,32,33,34]. Tang, LY [35] used nuclear magnetic resonance (NMR) to analyze the effect of freeze–thaw cycles on the internal pore structure of the soil–rock mixture. It was believed that the pores of the soil–rock mixture had fractal characteristics; Chen Yong [36] used image processing software to analyze scanning electron microscopy (SEM) images of expansive soil under different freezing–thawing cycles, and found that surface porosity of soil samples (the proportion of pores in a certain plane of soil) gradually increased with the increase in freezing–thawing cycles; The freezing–thawing cycle can not only change the porosity of soil, but also the size and shape of soil particles, thus affecting the cementation ability of soil particles [37], which leads to the formation of penetrating cracks in the soil and the gradual decrease in soil strength [38,39]; Ahmadi, S [40] used the Brunauer–Emmett–Teller (BET) and SEM to analyze the microstructural changes and interfacial interactions of fiber–clay particles, and found that the total pore volume and average pore size of the clay samples increased 30 and 42%, respectively, under freeze–thaw cycles; the change of pore structure is manifested as the change of mechanical properties on the macroscopic level, which can be used to reflect the change law of strength to a certain extent [41]; Xu, L [42] pointed out that there was a negative correlation among the porosity, pore orientation and mechanical parameters of expansive soil samples, and the change of the microstructure of expansive soil would directly affect the mechanical properties; Li [43] established the relationship between the ratio change rate of each peak and the mechanical characteristics based on the spectral area ratio of each peak in the NMR T-2 time curve, and studied the effect of different pore sizes on the strength.
In summary, scholars have studied the change characteristics of soil mechanical parameters and microstructure under the action of freeze–thaw cycles through microscopic detection technology, and discussed the relationship between pore structure characteristics and strength, but few scholars have studied the pore structure from the pore structure itself. Based on the above research, the NMR test and uniaxial strength test were carried out on coarse-grained soil under different freezing–thawing cycles, and the strength, porosity, T-2 spectrum curve characteristics, and the evolution characteristics of T-2 peak porosity ratio of coarse-grained soil under different freezing–thawing cycles were analyzed. The correlation model between pore structure and strength was established based on the variation of the proportion of pore volume in each peak (ΔS) of T-2 time curve.

2. Test Scheme

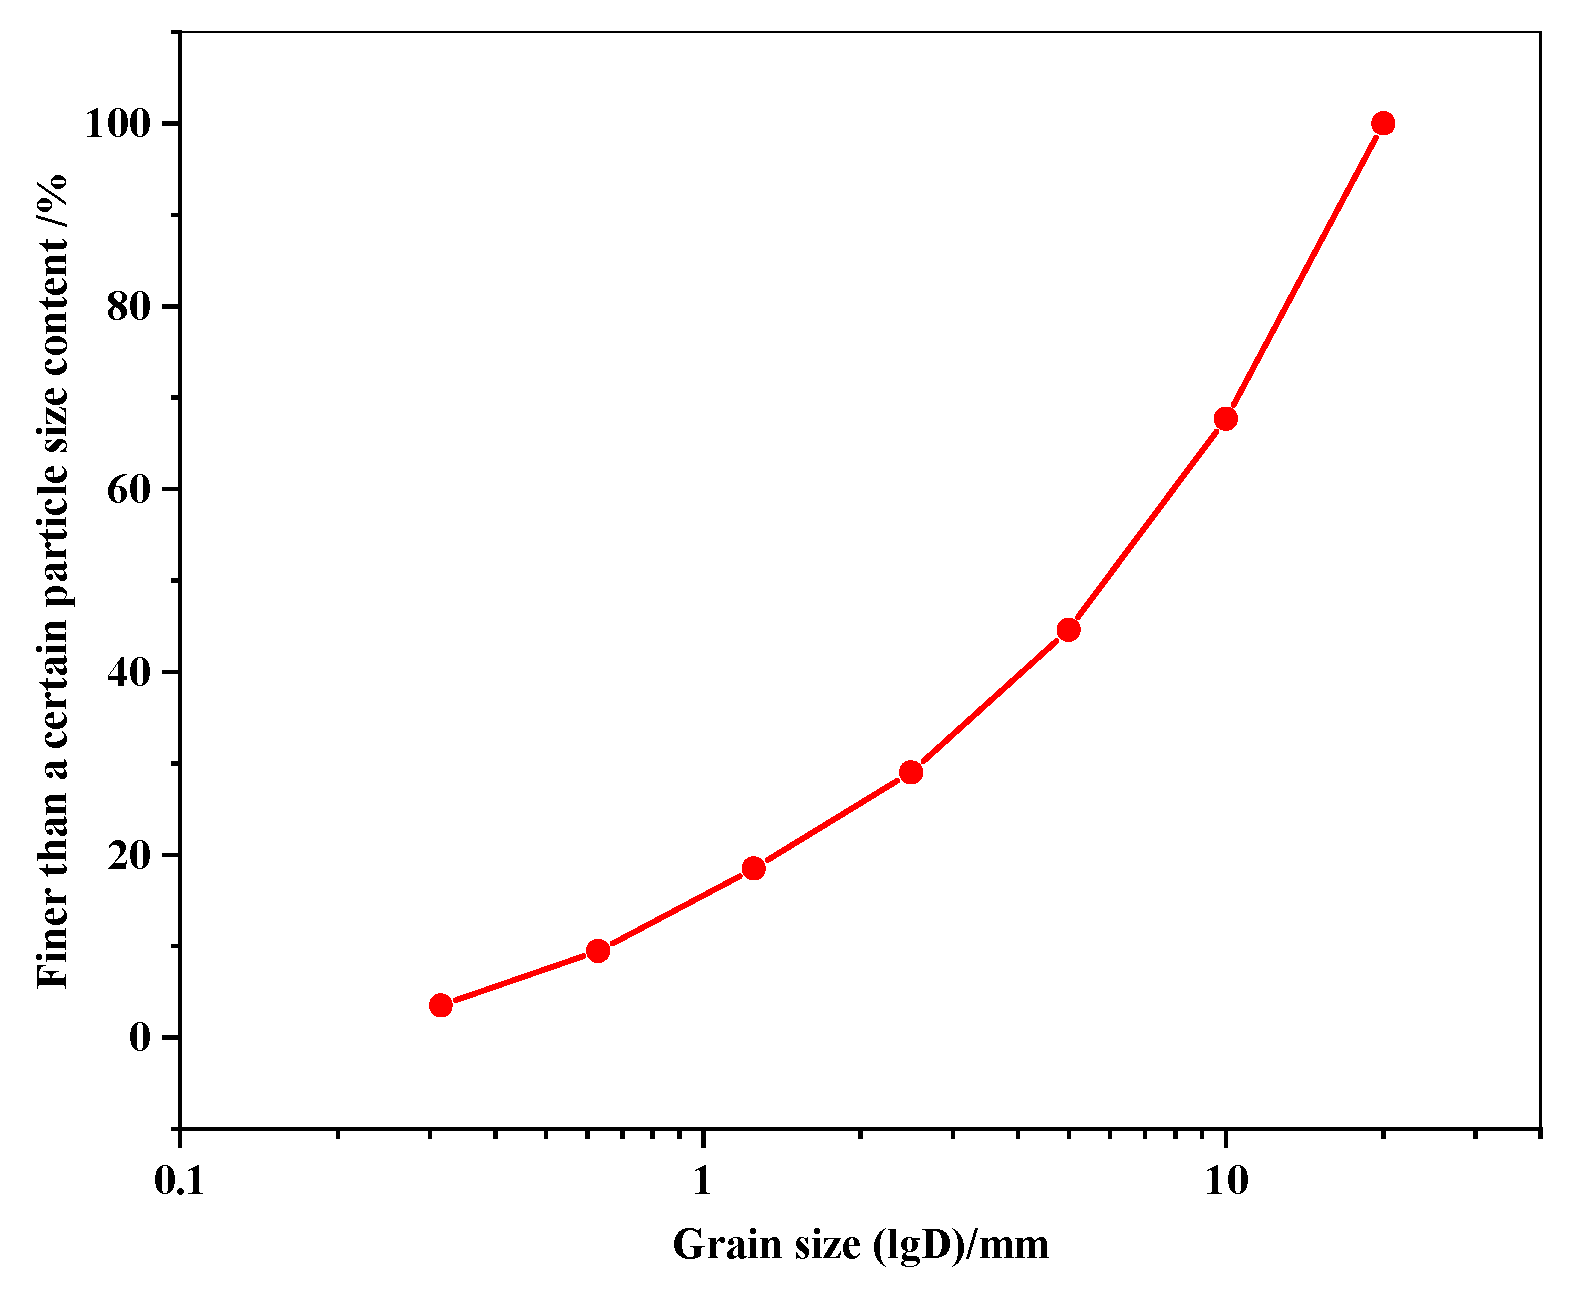
2.1. Main Components and Particle Size Distribution of Coarse-Grained Soil

The test soil is taken from a mine dump in Heilongjiang Province; the dump is arranged by a single step, with a height of about 25 m and a natural repose angle of 34.5–35°. According to the mine geological data, the freezing depth of the dump is about 4m; the sampling depth is about 1 m. Its main components and physical parameters are shown in Table 1. The average bulk density of gravel particles is 2.41 kg/cm3, the loose coefficient is 1.385, and the compressive strength is 40 MPa. The soil is mainly stripped topsoil, the average natural weight is 1.67 kg/cm3, the liquid limit is 35%, the plastic limit is 21%, and the cohesion and internal friction angle are 7.0 KPa and 6.2°, respectively. The particle size distribution of samples is determined according to the slope surface sampling and screening results of the dump. Since the maximum particle size of the dump is close to 100 mm, the particle size needs to be reduced. According to the geotechnical test specification [44], the maximum particle size after reduction is set to 20 mm by using the equal-mass substitution method, and the particle size distribution is shown in Table 2. Figure 1 is the cumulative curve of sample particle size gradation. It can be seen from the figure that the particle size greater than 5 mm accounts for more than 50% of the mass, which is called coarse-grained soil in engineering.

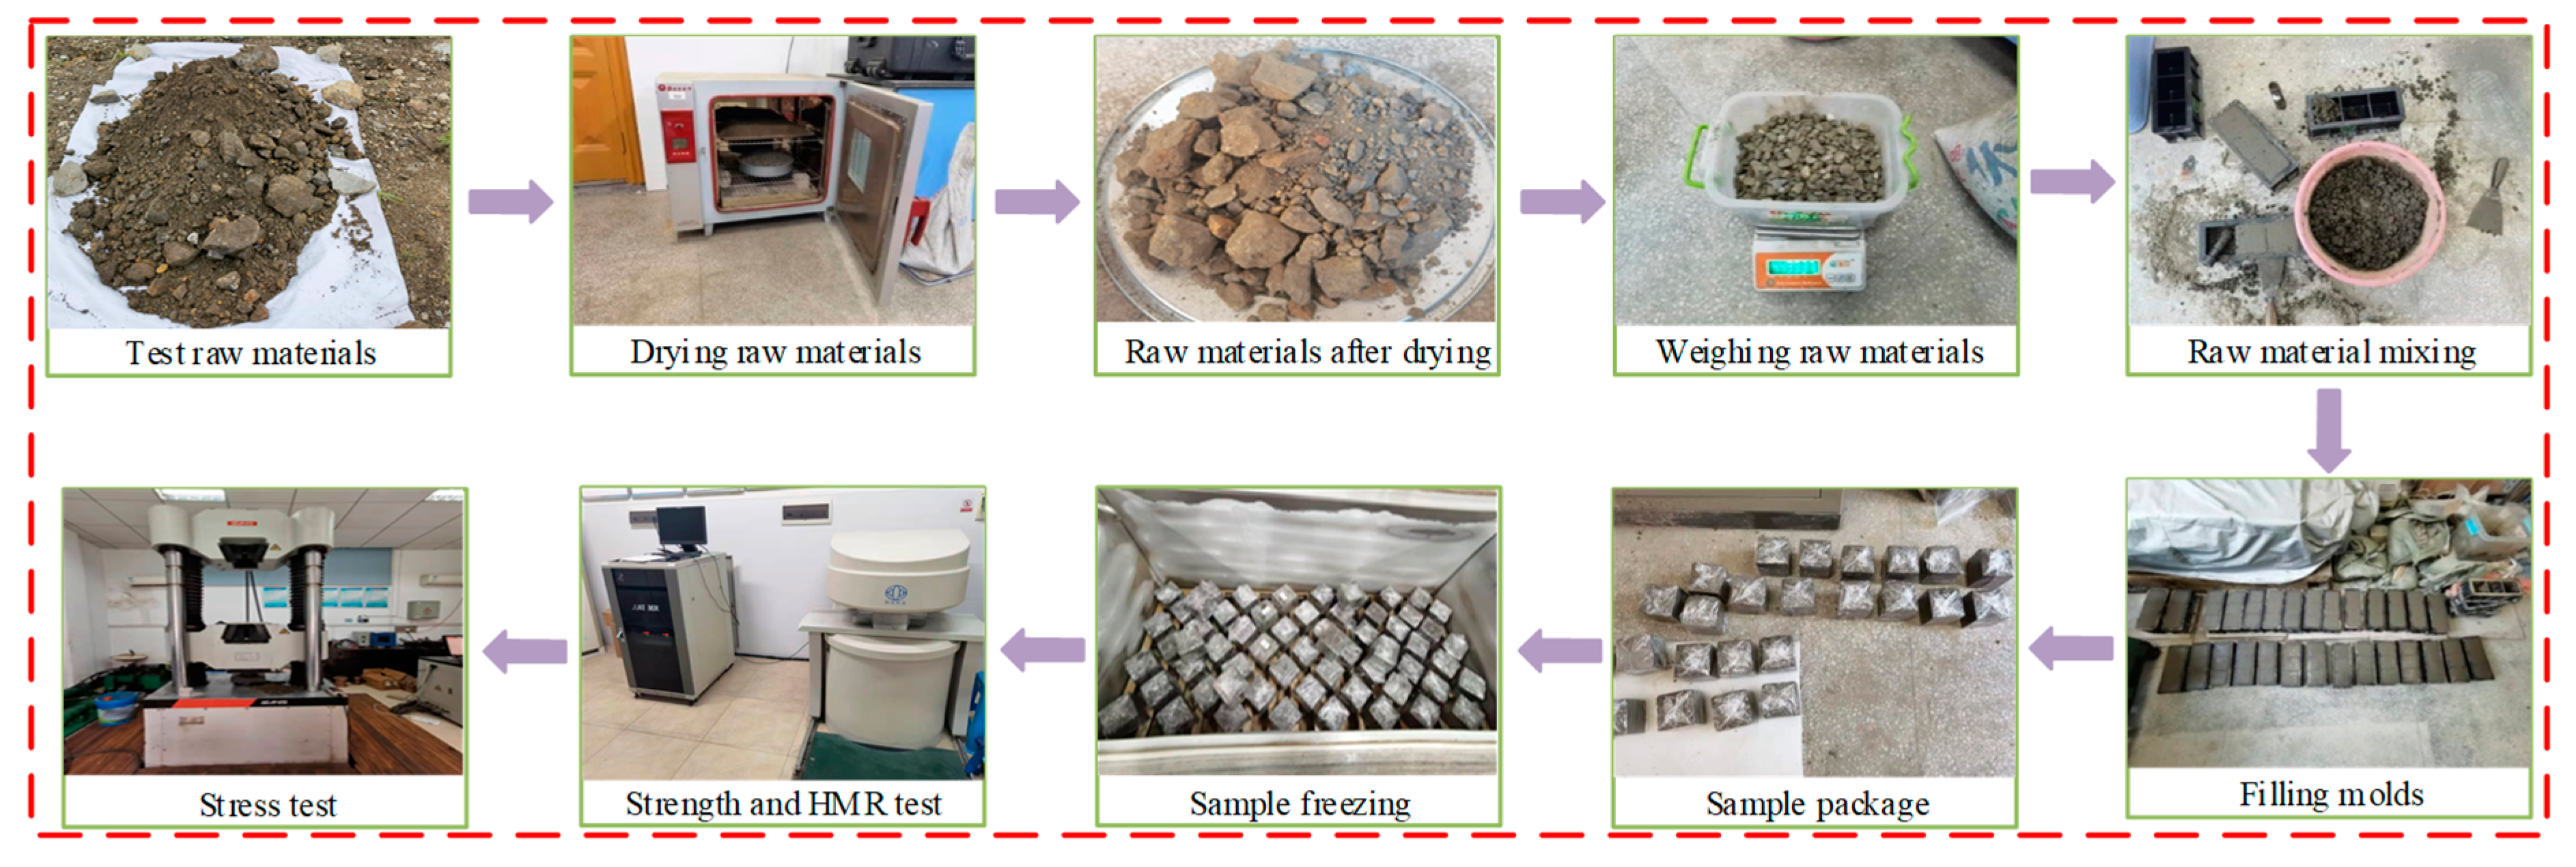
2.2. Sample Preparation

According to the particle size grading after scaling and the geotechnical test specifications, the sample was made into 7 cm × 7 cm × 7 cm cube sample with a moisture content of 7.5% and a density of 2.34 g/cm3 (all measured by field tests, that is, the natural moisture content and density). The specific steps are as follows:
(1)
According to the particle size materials required by the test, a drying box is used for drying. The setting temperature of the drying box is 105 °C, the drying time is 24 h, and the drying is carried out several times.
(2)
After the test mold is cleaned and dried, a layer of lubricating oil is brushed on the inner side of the mold to facilitate demolding in the later stage.
(3)
The dried bulk materials in the drying box are weighed according to the proportion of particle size and poured into the basin; the amount of water required is weighed and stirred together fully. After being stirred evenly, the materials will be evenly filled into the mold in three layers to make it stick together in the natural state.
(4)
The mold is wrapped with plastic wrap and left for 24 h to make the moisture content in the sample evenly distributed. Then, demolding samples are also wrapped with the plastic film to prevent moisture loss.

2.3. Experimental Test

The dump site is located in the middle temperate zone of the mining area and belongs to the continental monsoon climate zone. The annual average temperature is 3.9 °C, the highest monthly average temperature is 21.9 °C, and the lowest monthly average temperature is −19.1 °C; therefore, the freeze–thaw temperature range is set as −20 °C~20 °C. Considering that the area where the dump is located is below 0 °C for nearly half a year, to ensure that the sample can be fully frozen and thawed, the freezing and thawing time is set to 12 h, forming a cycle. The freezing process of the sample is to put the prepared sample into the refrigerator, and the thawing process is carried out at room temperature. The freezing–thawing cycles of the sample are 0, 5, 10, 15, and 20 times, respectively, as shown in the Figure 2.
Samples that have reached the number of freezing–thawing cycles were taken out from the freezing–thawing box in batches, and the strength test and porosity test were performed, respectively. The number of samples in each group of strength test is 3, and the number of samples is 15. The porosity was tested with the same sample, and the number of samples is 3.
The uniaxial compressive strength test on coarse-grained soil samples was conducted by using universal servo testing machine (SNA420, Shanghai Xinsanyi Measuring Instrument Manufacturing Co., LTD, Shanghai, China). Because the strength of coarse-grained soil is low, the method of force control is used for pressing, the loading speed of the force is selected as 10 N/S, and the pressure is gradually applied until the sample is destroyed.
AiniMR-150 nuclear magnetic resonance imaging analysis system (AiniMR-150, Suzhou Niumag Analytical Instrument Corporation, Suzhou, Jiangsu, China) was used for the porosity test. Its magnetic field intensity range is 0.3 T ± 0.05 T, RF pulse frequency range is 2 MHz~49.9 MHZ, and the accuracy is 0.1 MHZ. Table 3 shows the main Carr-Purcell-Meiboom-Gill (CPMG) sequence parameters of the coarse-grained soil porosity test. The specific test process is shown in Figure 3.

2.4. NMR Pore Radius Transformation

NMR is a nondestructive microscopic detection technology. According to its technical principle, its surface relaxation mechanism can be expressed as follows:
1 T 2 = ρ 2 ( S V )
Since the hole radius is proportional to the hole throat radius, Equation (1) can be expressed as:
1 T 2 = ρ 2 F S R
where ρ2 is the surface relaxation intensity, and FS is the value of pore shape factor (for spherical pores, FS = 3; For cylindrical holes, FS = 2), R is the hole radius; ρ2 = 3 μm/ms, Fs = 2, then C = ρ2 × Fs = 6 μm/ms [45,46]; therefore, Equation (2) can be expressed as:
R = 6 T 2
According to Equation (3), the pore radius of coarse-grained soil is proportional to T-2 value, so the T-2 spectrum can be converted into the pore size distribution curve of coarse-grained soil. For the convenience of analysis, the pore size of coarse-grained soil can be divided into four types: micro-pore (r < 0.4 μm); fine pores (0.4 μm < r < 2.5 μm); medium pore (2.5 < r < 10 μm); large pores (r > 10 μm) [47].

3. Analysis of Test Results

3.1. Analysis of Strength and Porosity of Coarse-Grained Soil

According to the uniaxial strength test and NMR test results of coarse-grained soil samples under different freezing–thawing cycles, the changes in the bearing strength and porosity of the coarse-grained soil under different freezing–thawing cycles can be obtained. Table 4 shows the test results of the uniaxial compressive strength and porosity of coarse-grained soil samples, and variation rules of sample strength and porosity under different freezing–thawing cycles are shown in Figure 4.
It can be seen from Figure 4 that the uniaxial compressive strength of coarse-grained soil decreases gradually with the increase in the number of freezing–thawing cycles, and the rate of strength reduction also decreases gradually, and the porosity gradually increases with the increase in the number of freeze–thaw cycles. The results show that the freeze–thaw cycle effect increases the number of pores in the coarse-grained soil, destroys the cementation ability between soil particles, and reduces the strength of the coarse-grained soil. After 20 cycles, the change in strength and porosity reached 45% and 28.2%, respectively. When the number of freeze–thaw cycles is from 0 to 10, the strength loss rate and porosity increase rate of coarse-grained soil are 30.5% and 17.9%, respectively. When the number of freeze–thaw cycles is from 10 to 20, they are 20.9% and 8.7%, respectively. It can be seen that the strength and porosity of coarse-grained soil in the first 10 freeze–thaw cycles change more obviously in freeze–thaw cycles.

3.2. T-2 Spectrum Analysis of Coarse-Grained Soil

Figure 5 shows the T-2 time distribution curve of coarse-grained soil in the dump site. It can be seen from Figure 5a that the T-2 curve is in the state of three peaks, but the shape of the third peak is not obvious. The main peak of the T-2 spectrum distribution is between 0.05 ms and 10 ms, and the secondary peak is between 10 ms and 100 ms. Under this water content, the area of the main peak interval of the T-2 spectrum of the NMR test accounts for more than half of the total area, and the number of pores accounts for a large proportion and is mainly small-sized pores. With the increase in relaxation time, the three peaks in the T-2 spectrum were defined as the main peak, secondary peak 1, and secondary peak 2, successively, and the signal amplitude of the main peak was significantly higher than that of the secondary peak. Among them, the main peak contains micro-pores, fine pores, medium pores, and some large pores, while the secondary peak 1 and secondary peak 2 correspond to the large pores.
It can be seen from Figure 5b, with the increase in freeze–thaw cycles, the porosity component of the coarse-grained soil increases gradually, the T-2 curve moves to the right, the peak point rises, and the area of the peak is also increasing. The pore structure of coarse-grained soil gradually develops towards medium and large pores, indicating that damage occurs in the freezing–thawing environment, and the amount of damage increases with the increase in the number of freezing–thawing cycles, which also indicates that freezing–thawing damage is a cumulative process. In the freezing environment, the water contained in the pores and fissures of the coarse-grained soil changes from liquid water to solid water, and the volume of water increases, resulting in frost heaving force acting on the inner wall of the pores, and changes in the internal pore structure. The cracks expand to both ends, the ice in the pores turns to water as it melts, and the frost heave in the pores disappears. Some easily soluble minerals and soil particles in the coarse-grained soil are dissolved in water, and the internal pores and fissures increase further, resulting in the loose soil structure. Under the alternation of freeze–thaw cycles, soil pores continue to develop, the number of pores increases, and the strength decreases.

3.3. Evolution Characteristics of Pore Structure of Coarse-Grained Soil

The water in the pores is capable of destroying the original pore characteristics in the coarse-grained soil due to the water–ice phase transformation under freezing and thawing. The most intuitive reflection is the change of porosity, which changes its internal pore structure characteristics from the microscopic point of view. The change of pore structure of coarse-grained soil will lead to the change of the number of pores of different sizes. At present, the NMR T-2 time distribution curve can be used to calculate the pore volume fraction in different pore ranges with high accuracy. In this study, the pore size distribution of coarse-grained soils under different freezing–thawing cycles (as shown in Table 5) and the proportion of three-peak pore volume in the T-2 spectrum of samples under different freezing–thawing cycles (as shown in Table 6) were calculated.
As can be seen from Table 5, with the increase in freeze–thaw cycles, the large, medium, fine, and micro-pores in coarse-grained soil are affected to a certain extent. The ratio of the pore volume of micro-pores, small pores, and medium pores in coarse-grained soil decreases gradually, while that of large pores increases gradually, indicating that the pores in coarse-grained soil are gradually transformed into large pores under freeze–thaw cycles. Among them, the ratio of the pore volume of micro-pores and small pores is relatively small, while the ratio of the pore volume of medium pores and large pores is relatively large, indicating that the medium pores and large pores are mainly in the coarse-grained soil, which is related to the content of coarse particles in the coarse-grained soil. At the same time, the change of medium pore and macro-pore is also the main reason for the strength change of coarse-grained soil.
As can be seen from Table 6 and Figure 6, with the increase in freeze–thaw cycles, the T-2 spectral area also increases, indicating that freezing–thawing cycles lead to an increase in the number of pores in coarse-grained soil. The pore volume ratio of the main peak is always greater than 50%, which is much higher than that of secondary peak 2. The pore volume proportion of the main peak and secondary peak 2 gradually increases with the increase in the number of freeze–thaw cycles, while the pore volume proportion of secondary peak 1 gradually decreases. The proportion of the main peak increases by 6.9%, the secondary peak 1 and the secondary peak 2 decreases and increases by 12.9% and 6.1%, respectively.

4. Correlation between Mechanical Properties and Pore Structure of Coarse-Grained Soils

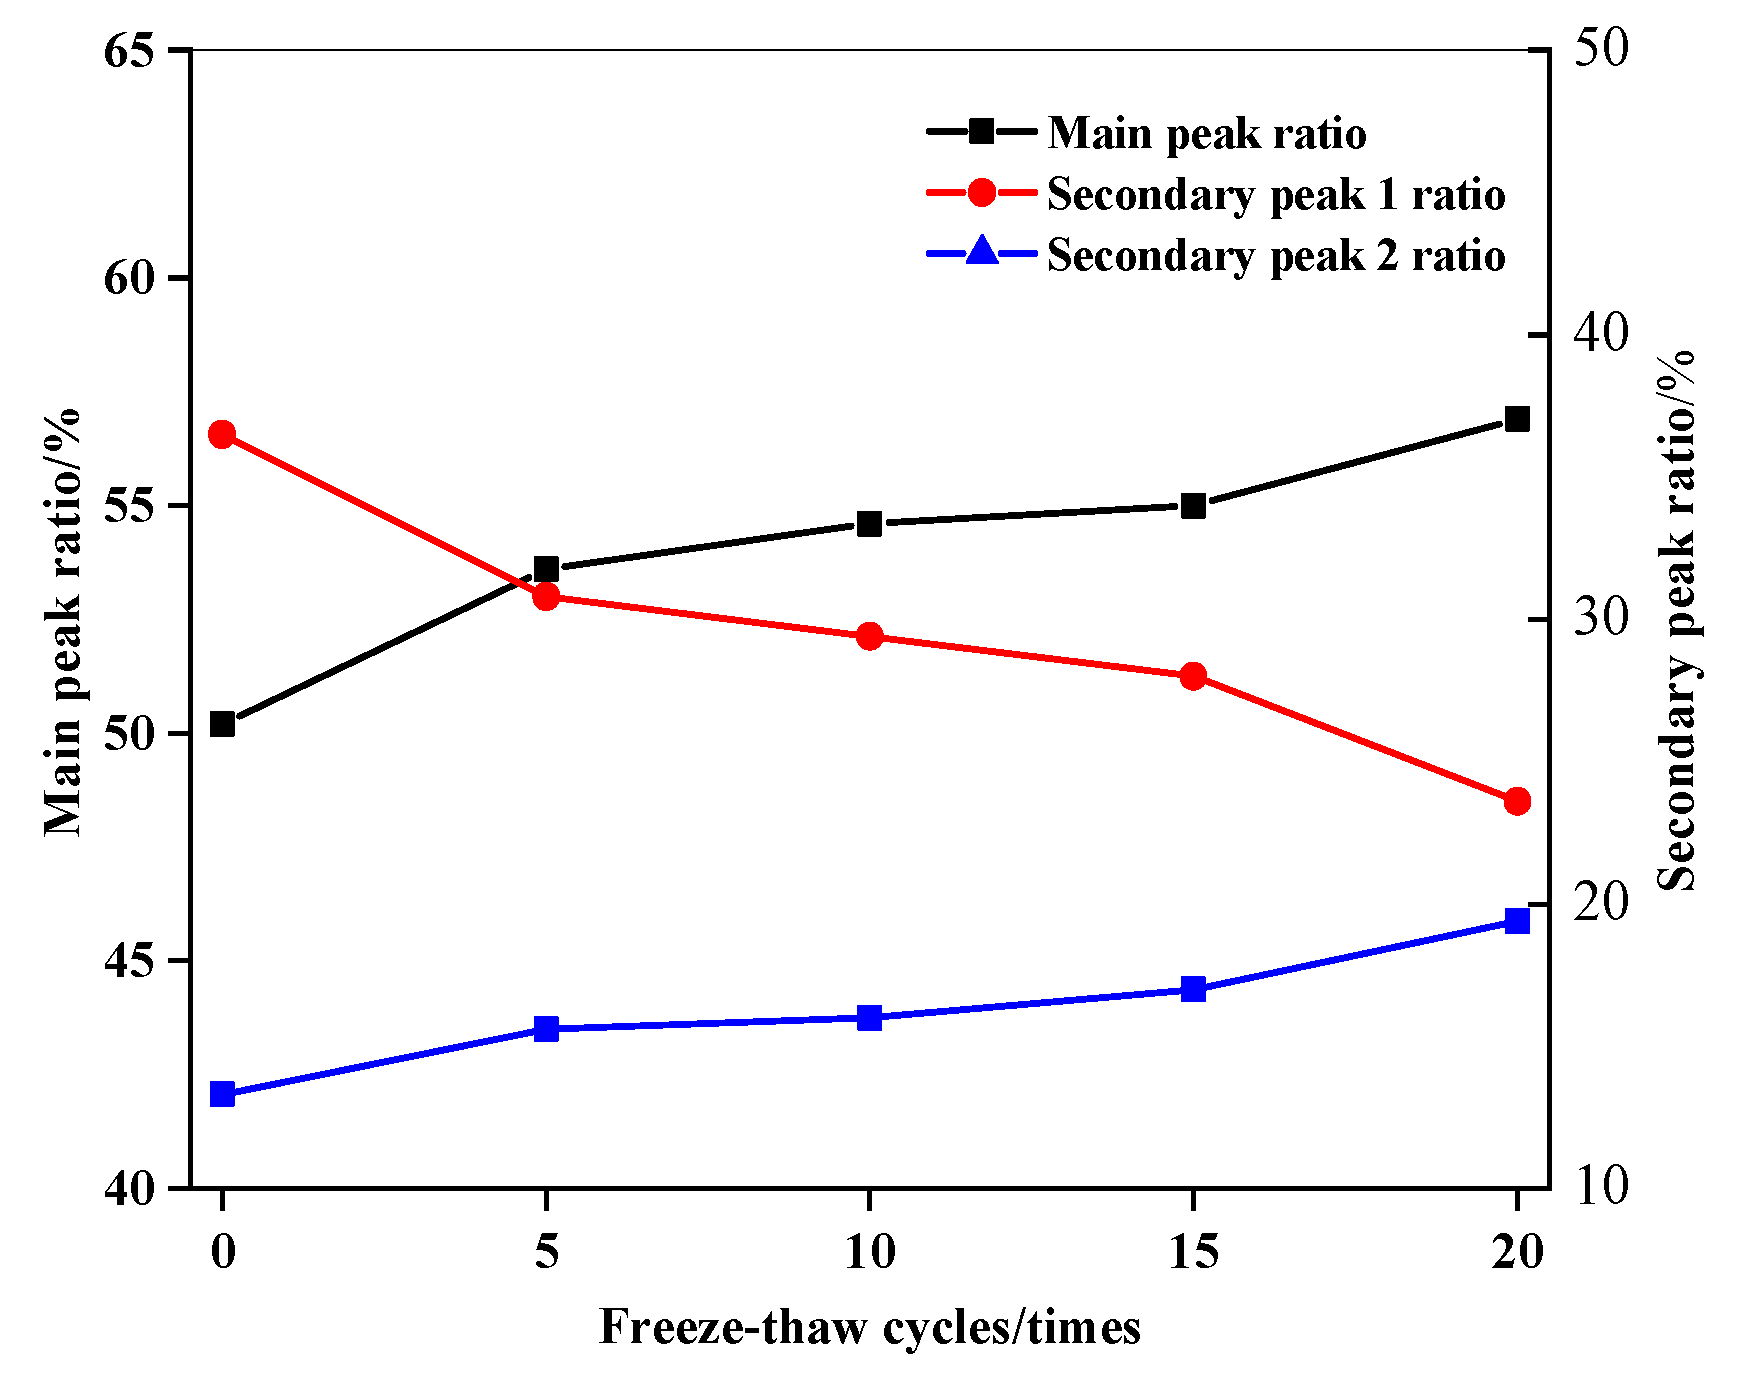
4.1. Changes in the Proportion of Pore Volume at Each Peak of T-2 Spectrum Curve

In terms of mechanical characteristics, the change law of pore structure is manifested as the change of soil strength, which can well reflect characteristics of soil strength and deformation. Due to the complex composition of the pore structure, this study intends to characterize the influence of freezing–thawing cycles on pore structure by testing the ratio of the pore volume of each peak, and then characterize the relationship between the strength and microstructure change. Table 7 shows the ratio variation of each peak spectral area in the T-2 spectrum curve of the coarse-grained soil. ΔS is defined as the variation of the ratio of pore volume in each peak after n cycles of freezing and thawing. ΔS is:
Δ S = | S ( n ) S ( 0 ) | × 100 %    ( n 0 )
where S(n) and S(0) are the proportions of peaks of n and 0 cycles of freezing–thawing, respectively.
Figure 7 shows the relationship between the strength loss rate and the ratio of pore volume to each peak and the number of freeze–thaw cycles. It can be seen from Figure (a) that the strength loss rate of coarse-grained soil increases gradually with the increase in the number of freezing–thawing cycles. In Figure (b), the variation of pore volume ratio of the primary peak, secondary peak 1, and secondary peak 2 also increases gradually with the increase in the number of freezing–thawing cycles. Secondary peak 1 has the largest variation of 12.9%, and secondary peak 2 has the smallest variation of 6.1%. With the increase in the number of freezing–thawing cycles, the variation of pore volume ratio of each peak always shows secondary peak 1 > main peak > secondary peak 2.

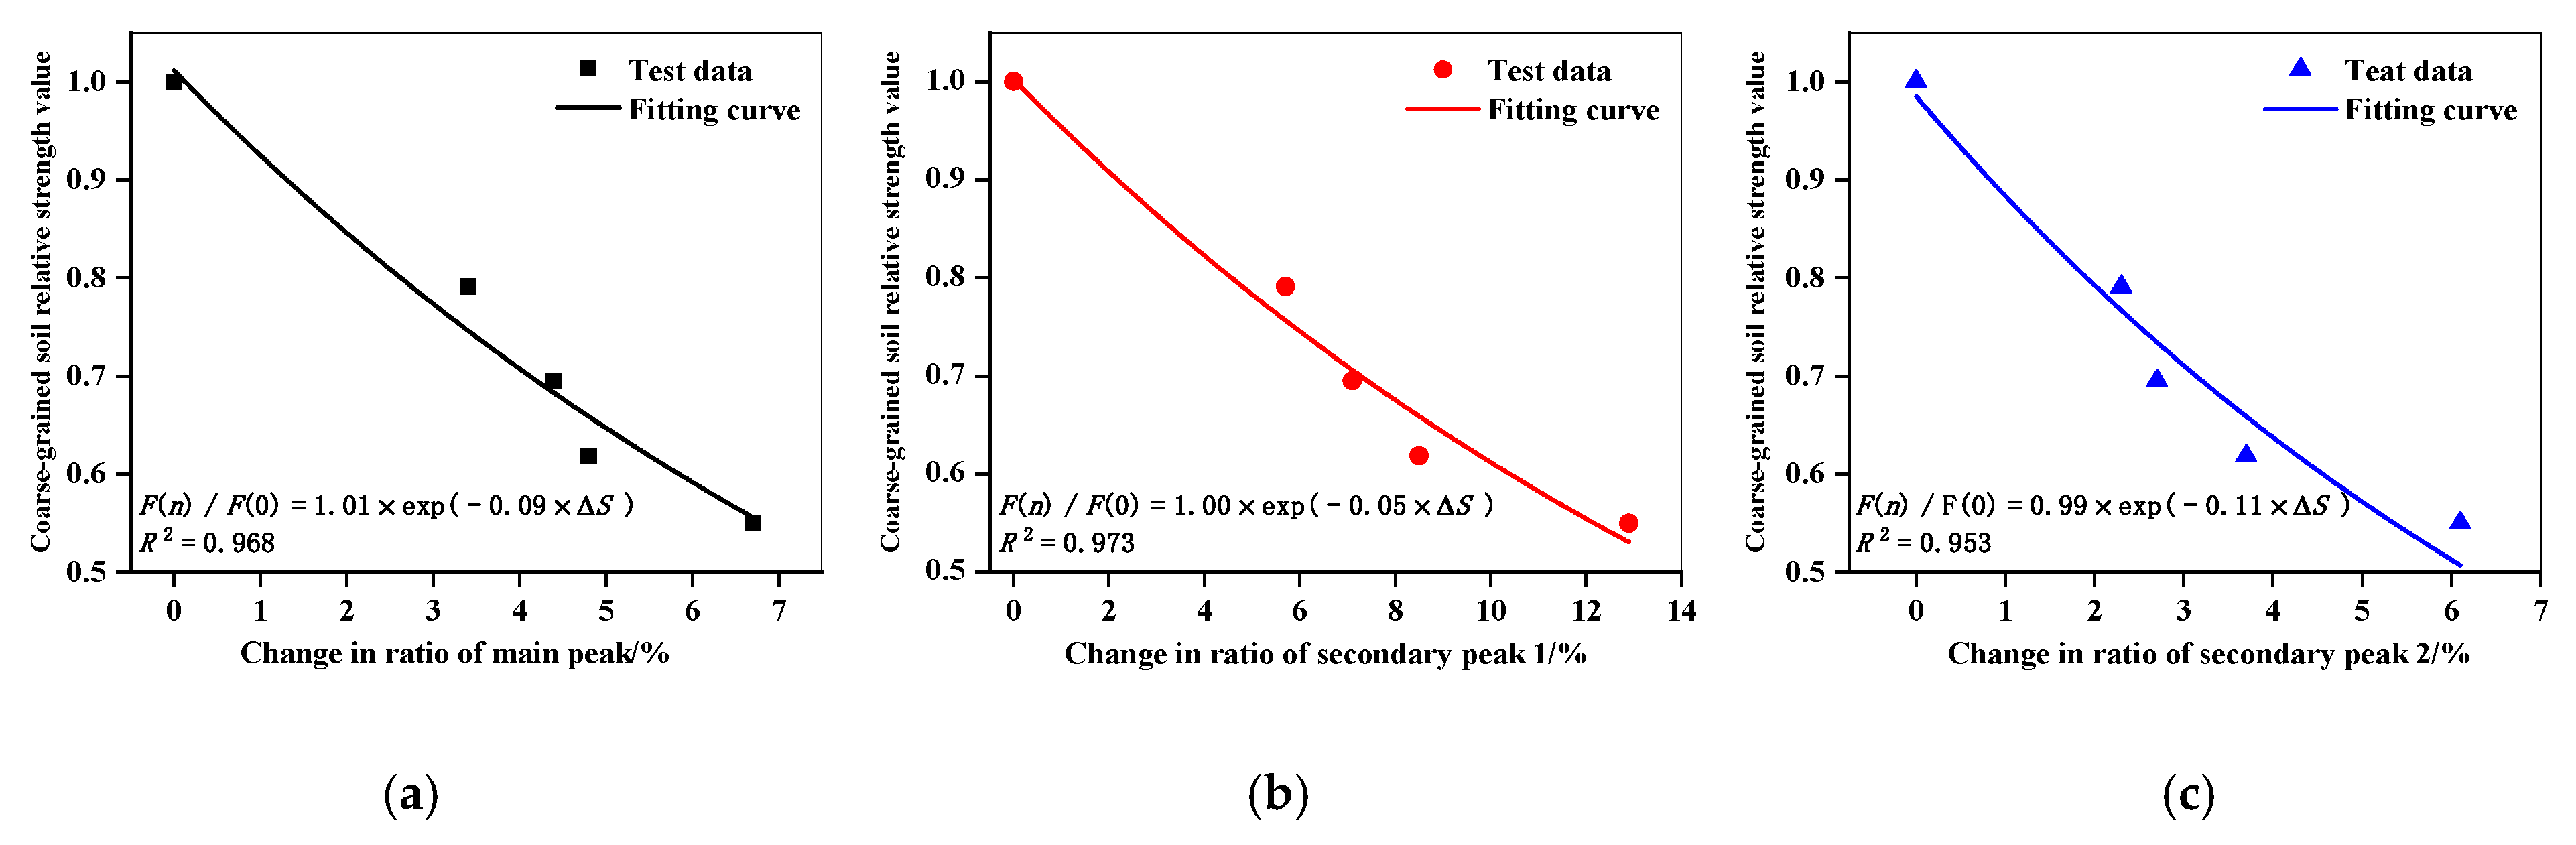
4.2. Correlation between Mechanical Properties and Pore Structure of Coarse-Grained Soils

It can be seen from the above analysis that the freeze–thaw cycle has a significant effect on the pore structure characteristics and the strength of coarse-grained soils. Under the influence of freezing–thawing cycle, the strength of coarse-grained soil gradually decreases, and the pore structure gradually develops towards medium and large pores. The strength loss rate of coarse-grained soil per unit the change in the area ratio of each peak spectrum is approximately as a constant, and F(0) is the strength when the number of freezing–thawing cycles is 0 times.
F ( n ) F ( n + Δ n ) F ( n ) = k 1 Δ n    ( k 1 > 0 , n 0 )
where k1 is the strength loss rate of coarse-grained soil per unit number of freezing-thawing cycles
Transform to
F ( n + Δ n ) F ( n ) Δ n = k 1 F ( n )
Which is
d F ( n ) d ( n ) = k 1 F ( n )  
By integrating Equation (7), we obtain
F ( n ) F 0 = exp ( k 1 n )
The change of the ratio of the porosity to each peak of the T-2 spectrum increases with the increase in freezing–thawing cycles. The change rate of each peak pore volume ratio of coarse-grained soil per unit freeze–thaw cycle number is approximately a constant, and S(0) is the pore volume proportion when the number of freezing–thawing cycles is 0. Then, the change of porosity ratio of the coarse-grained soil from n to (n + ∆n) times of freezing–thawing cycles is:
S ( n + Δ n ) S ( n ) = k 2 Δ n ( k 2 > 0 , n 0 )
where k2 is the change rate of pore volume proportion of each peak in coarse-grained soil per unit number of freezing–thawing cycles
Transform to
S ( n + Δ n ) S ( n ) Δ n = k 2
Which is
d S ( n ) d ( n ) = k 2
By integrating Equation (11), we obtain
S ( n ) S ( 0 ) = k 2 n
Transform to
n = S ( n ) S ( 0 ) k 2
Substitute Equation (13) into Equation (8), and obtain
F ( n ) F ( 0 ) = exp { k 1 k 2 [ S ( n ) S ( 0 ) ] }
Let ΔS = S(n) − S(0), λ = k1/k2 is defined as the freezing–thawing strength deterioration factor of the coarse-grained soil, and F(n)/F(0) is the relative strength value of the coarse-grained soil. Since the strength loss rate and the rate of change in the proportion of pore volume of the coarse-grained soil are approximately constant under per unit freezing–thawing cycle number, the above model needs to be fitted and modified by fitting experimental data. Considering that the dispersion difference of coarse-grained soil strength is caused by the inhomogeneity of particle arrangement in coarse-grained soil, the correction coefficient β is introduced in Equation (11) to correct the dispersion. Since there is no parameter n in the model (n is the number of freezing–thawing cycles), the model is also applicable to coarse-grained soils with different gradations. The model that introduces the correction coefficient is as follows:
F ( n ) F ( 0 ) = β exp [ λ ( Δ S ) ]

4.3. Model Fitting Validation

To verify the rationality of the model, the model was fitted using the above analysis data. The fitting results are shown in Figure 8. The specific values of the fitting parameters β, λ, and R2 of the correlation model between the mechanical properties of the coarse-grained soil and the pore structure are shown in Table 8.
As can be seen from Figure 8, with the increase in the number of freezing–thawing cycles, The variation of the ratio of pore volume to each peak in coarse-grained soil has a good correlation with the relative strength value. The results show that the model can well reflect the relationship between the pore structure and the strength of the coarse-grained soil, which reflects the correctness and applicability of the correlation model.

5. Conclusions

A series of tests are conducted on soil materials from a mine dump in Heilongjiang Province. The particle size distribution of samples is determined according to the results of slope sampling and screening in the dump site. A standard cube sample was used with dimensions of 7 cm × 7 cm × 7 cm, with a water content of 7.5%, and a density of 2.34 g/cm3. Nuclear magnetic resonance technology and universal servo material testing machine were used to test the pore structure and uniaxial compressive strength of coarse-grained soil samples under different cycles, respectively, and the correlation model between mechanical properties of the coarse-grained soil and the pore structure was established. The experimental conclusions are as follows:
(1)
With the increase in the number of freeze–thaw cycles, the uniaxial compressive strength of the coarse-grained soil gradually decreases, while the porosity gradually increases, and the change rate gradually decreases. Freeze–thaw cycles transform the fine and medium pores of coarse-grained soil into large pores, and the ratio of the pore volume of large pores increases gradually, which destroys the cementation ability between soil particles in coarse-grained soil and reduces the strength of coarse-grained soil.
(2)
The T-2 NMR spectra of coarse-grained soils under different freezing–thawing cycles show three peaks. With the increase in freezing–thawing cycles, the porosity component of the coarse-grained soil gradually increases, and the pore structure of the coarse-grained soil gradually develops towards the trend of medium and large pores, and the damage amount gradually increases.
(3)
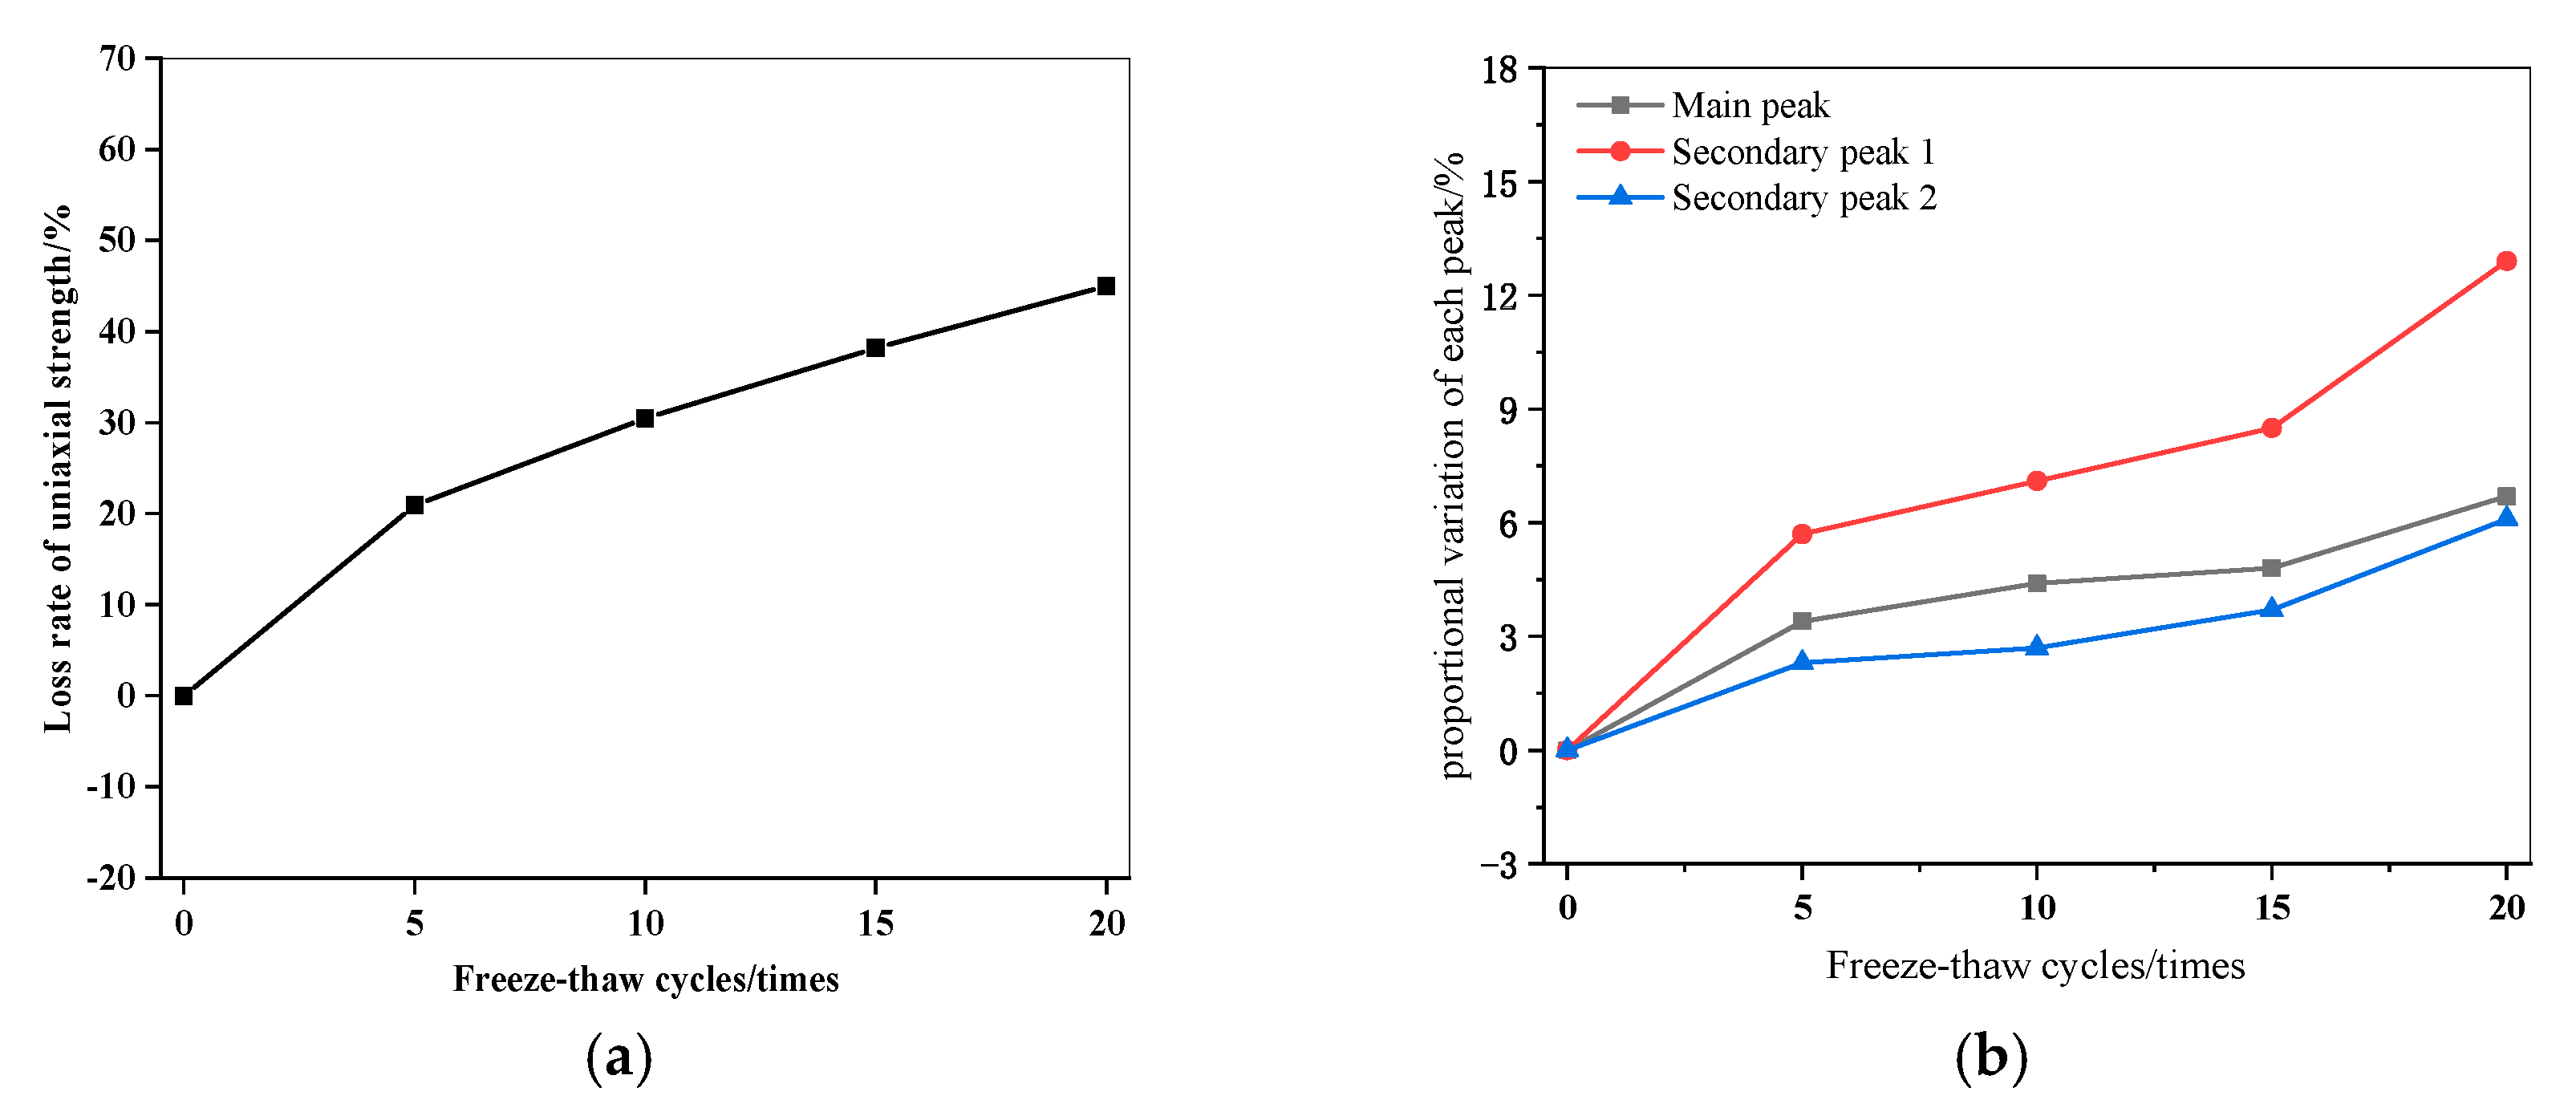
With the increase in the number of freezing–thawing cycles, the pore volume proportion of the main peak and secondary peak 2 of the T-2 spectrum curve gradually increases with the increase in the number of freezing–thawing cycles, while the pore volume proportion of secondary peak 1 gradually decreases. The strength loss rate of coarse-grained soil and the ratio of pore volume to each peak increase with the increase in freezing–thawing cycles.
(4)
In the correlation model between mechanical properties of the coarse-grained soil and the pore structure, there is an exponential function between the proportional change of the ratio of pore volume to each peak and the relative strength value, and the fitting results show that there is a good correlation coefficient between the two, indicating that the proportional change of the pore structure of the coarse-grained soil can well reflect the change law of coarse-grained soil strength.

Author Contributions

H.D. and Y.L. conceived and designed the experiments; G.T., Y.L., J.D. and J.X. performed the experiments; G.T., Y.L. contributed materials and theoretical foundations; Y.L. wrote the paper. All authors have read and agreed to the published version of the manuscript.

Funding

This work was financially supported by the National Natural Science Foundation of China under Grant number 51874352; Supported by the Fundamental Research Funds for the Central Universities of Central South University under Grant number 2021zzts0860; Postgraduate Scientific Research Innovation Project of Hunan Provience under Grant number CX20210107.

Data Availability Statement

The source data can be obtained in the article.

Conflicts of Interest

The authors declare no conflict of interest.

References

  1. Lemiale, V.; Huston, C.; Mead, S.; Alexander, D.L.J.; Cleary, P.W.; Adhikary, D.; Delaney, G.W. Combining statistical design with deterministic modelling to assess the effect of site-specific factors on the extent of landslides. Rock Mech. Rock Eng. 2021, 55, 259–273. [Google Scholar] [CrossRef]
  2. Wang, G. Study on the Mechanical Characteristics of Granular Media and Slope Stability with Super-High Bench Dumping Site. Ph.D. Thesis, Chongqing University, Chongqing, China, 2011. [Google Scholar]
  3. Akulov, N.I.; Akulova, V.V.; Shtel’Makh, S.I.; Rubtsova, M.N.; Sholokhov, P.A. Structure and composition of debris flows in the Eastern Sayan. Lithol. Miner. Resour. 2018, 53, 36–52. [Google Scholar] [CrossRef]
  4. Chen, G.; Niu, F.; Mu, Y.; Chen, T.; Li, G.; Yang, H. Shear tests on freeze-thaw interface of coarse-grained soils from a mine dump in seasonal frozen regions. Met. Mine 2018, 47, 150–156. [Google Scholar]
  5. Liu, C. Attention should be paid to the collapse and landslide caused by freezing-thawing. Hydrogeol. Eng. Geol. 2014, 41, 3. [Google Scholar]
  6. Koner, R.; Chakravarty, D. Characterisation of overburden dump materials: A case study from the Wardha valley coal field. Bull. Eng. Geol. Environ. 2016, 75, 1311–1323. [Google Scholar] [CrossRef]
  7. Zhan, L.; Guo, X.; Sun, Q.; Chen, Y.; Chen, Z. The 2015 Shenzhen catastrophic landslide in a construction waste dump: Analyses of undrained strength and slope stability. Acta Geotech. 2021, 16, 1247–1263. [Google Scholar] [CrossRef]
  8. Miyamoto, S.; Yasufuku, N.; Ishikura, R.; Omine, K.; Kawai, S.; Yamawaki, A. In-situ shearing response and shear strength of various solid waste ground focused on fibrous materials composition. In Proceedings of the 3rd International Symposium on Geomechanics from Micro to Macro, Cambridge, UK, 1–3 September 2015; pp. 1357–1362. [Google Scholar]
  9. Blijenberg, H.M.; van Asch, T.W.J.; de Mulder, E.F.J. Application of physical modelling of debris flow triggering to field conditions; limitations posed by boundary conditions. Eng. Geol. 2007, 91, 25–33. [Google Scholar] [CrossRef]
  10. Gül, Y.; Hastaoğlu, K.Ö.; Poyraz, F. Using the GNSS method assisted with UAV photogrammetry to monitor and determine deformations of a dump site of three open-pit marble mines in Eliktekke region, Amasya province, Turkey. Environ. Earth Sci. 2020, 79, 1–20. [Google Scholar] [CrossRef]
  11. Gao, S.; Zhou, W.; Shi, X.; Cai, Q.; Crusoe, G.E.; Shu, J.; Huang, Y. Mechanical properties of material in a mine dump at the Shengli #1 Surface Coal Mine, China. Int. J. Min. Sci. Technol. 2017, 27, 545–550. [Google Scholar]
  12. Koner, R.; Chakravarty, D. Numerical analysis of rainfall effects in external overburden dump. Int. J. Min. Sci. Technol. 2016, 26, 825–831. [Google Scholar] [CrossRef]
  13. Ali, D.; Frimpong, S. Impulse force reductions and their effects on WBV exposures in high impact shovel loading operations. Int. J. Min. Sci. Technol. 2018, 28, 423–435. [Google Scholar] [CrossRef]
  14. Oggeri, C.; Fenoglio, T.M.; Godio, A.; Vinai, R. Overburden management in open pits: Options and limits in large limestone quarries. Int. J. Min. Sci. Technol. 2019, 29, 217–228. [Google Scholar] [CrossRef]
  15. Chen, T. Impacts of Cyclic Freeze-Thaw on Strength Properties of Coarse-Grained Soils and Slope Stability of Mine Dump. Master’s Thesis, Lanzhou University of Technology, Lanzhou, China, 2019. [Google Scholar]
  16. Yang, P.; Zhang, T. Physical and mechanical properties of artificial freezing-thawing soil. J. Glaciol. Geocryol. 2002, 24, 665–667. [Google Scholar]
  17. Hotineanu, A.; Bouasker, M.; Aldaood, A.; Al-Mukhtar, M. Effect of freeze-thaw cycling on the mechanical properties of lime-stabilized expansive clays. Cold Reg. Sci. Technol. 2015, 119, 151–157. [Google Scholar] [CrossRef]
  18. Wang, G.; Kong, X.; Gu, Y.; Yang, C. Numerical simulation of triaxial tests for coarse-grained soil considering the initial fabric of samples grain. In Proceedings of the International Conference on Smart Materials and Intelligent Systems, Chongqing, China, 23–25 December 2011; pp. 873–878. [Google Scholar] [CrossRef]
  19. Baghdadi, Z.A.; Shihata, S.A. Simplified method to assess freeze-thaw durability of soil cement. J. Mater. Civ. Eng. 2001, 13, 243–247. [Google Scholar]
  20. Yarbasi, N.; Kalkan, E.; Akbulut, S. Modification of the geotechnical properties, as influenced by freeze-thaw, of granular soils with waste additives. Cold Reg. Sci. Technol. 2007, 48, 44–54. [Google Scholar] [CrossRef]
  21. Fard, A.; Moradi, G.; Ghalehjough, B.; Abbasnejad, A. Freezing-thawing resistance evaluation of sandy soil, improved by polyvinyl acetate and ethylene glycol monobutyl ether mixture. Geomech. Eng. 2020, 23, 179–187. [Google Scholar]
  22. Ishikawa, T.; Miura, S. Influence of freeze-thaw action on deformation-strength characteristics and particle particle crushability of volcanic coarse-grained soils. Soils Found. 2011, 51, 785–799. [Google Scholar] [CrossRef] [Green Version]
  23. Tu, Z. Study on the Mechanical Properties Test and Strength Prediction Model of Unsaturated Expansive Soil under Freezing-Thawing Cycle; Qingdao University of Technology: Qingdao, China, 2019. [Google Scholar]
  24. Ling, X.; Tian, S.; Tang, L.; Li, S. A damage-softening and dilatancy prediction model of coarse-grained materials considering freeze–thaw effects. Transp. Geotech. 2020, 22, 100307. [Google Scholar] [CrossRef]
  25. Deng, H.; Liu, Y.; Zhang, W.; Yu, S.; Tian, G. Study on the strength evolution characteristics of cemented tailings backfill from the perspective of porosity. Minerals 2021, 11, 82. [Google Scholar] [CrossRef]
  26. Oyewole, E.; Saneifar, M.; Heidari, Z. Multiscale characterization of pore structure in carbonate formations; application to the Scurry Area Canyon Reef Operators Committee Unit. Interpretation 2016, 4, T157–T169. [Google Scholar] [CrossRef]
  27. Deng, H.; Tian, G.; Yu, S.; Jiang, Z.; Zhong, Z.; Zhang, Y. Research on strength prediction model of sand-like material based on nuclear magnetic resonance and fractal theory. Appl. Sci. 2020, 10, 6601. [Google Scholar] [CrossRef]
  28. Dymaczewski, Z.; Falkowska, J.; Frąckowiak, A.; Jeż-Walkowiak, J.; Nawrot, J.; Dudek, L.; Topór, T. The impact of microstructure of filtration materials on its auto-activation for manganese removal from groundwater. Minerals 2020, 10, 502. [Google Scholar] [CrossRef]
  29. Deng, H.; Duan, T.; Tian, G.; Liu, Y.; Zhang, W. Research on strength prediction model and microscopic analysis of mechanical characteristics of cemented tailings backfill under fractal theory. Minerals 2021, 11, 886. [Google Scholar] [CrossRef]
  30. Keil, A.; Orlowsky, J.; Raupach, M. Application of a mobile NMR sensor as a non-destructive measurement system in the field of maintenance. Bautechnik 2011, 88, 741–748. [Google Scholar] [CrossRef]
  31. Wei, C.; Apel, D.B.; Zhang, Y. Shear behavior of ultrafine magnetite tailings subjected to freeze-thaw cycles. Int. J. Min. Sci. Technol. 2019, 29, 609–616. [Google Scholar] [CrossRef]
  32. Chen, Q.; Tao, Y.; Zhang, Q.; Qi, C. The Rheological, Mechanical and Heavy Metal Leaching Properties of Cemented Paste Backfill Under the Influence of Anionic Polyacrylamide. Chemosphere 2022, 286, 131630. [Google Scholar] [CrossRef]
  33. Chen, Q.; Luo, K.; Wang, Y.; Li, X.; Zhang, Q.; Liu, Y. In-situ stabilization/solidification of lead/zinc mine tailings by cemented paste backfill modified with low-carbon bentonite alternative. J. Mater. Res. Technol. 2022, 17, 1200–1210. [Google Scholar] [CrossRef]
  34. Zhang, Q.; Li, Y.; Chen, Q.; Liu, Y.; Feng, Y.; Wang, D. Effects of temperatures and pH values on rheological properties of cemented paste backfill. J. Cent. South Univ. 2021, 28, 1707–1723. [Google Scholar] [CrossRef]
  35. Tang, L.; Li, G.; Li, Z.; Jin, L.; Yang, G. Shear properties and pore structure characteristics of soil–rock mixture under freeze–thaw cycles. Bull. Eng. Geol. Environ. 2021, 80, 3233–3249. [Google Scholar] [CrossRef]
  36. Chen, Y.; Huang, Y.; Zhu, X.; Wu, M.; Wang, S.; Zhu, R. Study on the influence of free-thaw cycles on the deformation and mechanical properties of expansive soil. Hydro-Sci. Eng. 2021, 112–119. [Google Scholar] [CrossRef]
  37. Zhai, J.; Zhang, Z.; Melnikov, A.; Zhang, M.; Yang, L.; Jin, D. Experimental study on the effect of freeze-thaw cycles on the mineral particle fragmentation and aggregation with different soil types. Minerals 2021, 11, 913. [Google Scholar] [CrossRef]
  38. Bozbey, I.; Kelesoglu, M.K.; Demir, B.; Komut, M.; Comez, S.; Ozturk, T.; Mert, A.; Ocal, K.; Oztoprak, S. Effects of soil pulverization level on resilient modulus and freeze and thaw resistance of a lime stabilized clay. Cold Reg. Sci. Technol. 2018, 151, 323–334. [Google Scholar] [CrossRef]
  39. Uzer, A.U. Evaluation of freezing-thawing cycles for foundation soil stabilization. Soil Mech. Found. Eng. 2016, 53, 202–209. [Google Scholar] [CrossRef]
  40. Ahmadi, S.; Ghasemzadeh, H.; Changizi, F. Effects of A low-carbon emission additive on mechanical properties of fine-grained soil under freeze-thaw cycles. J. Clean. Prod. 2021, 304, 127157. [Google Scholar] [CrossRef]
  41. Li, Z.; Yang, G.; Liu, H. The influence of regional freeze–thaw cycles on loess landslides: Analysis of strength deterioration of loess with changes in pore structure. Water 2020, 12, 3047. [Google Scholar] [CrossRef]
  42. Xu, L.; Liu, S.; Lu, Y.; Song, Y.; Yang, Q. Physico-mechanical properties of expansive soil under freeze-thaw cycles. Rock Soil Mech. 2016, 37, 167–174. [Google Scholar]
  43. Li, T.; Kong, L.; Wang, J.; Wang, F. Trimodal pore structure evolution characteristics and mechanical effects of expansive soil in seasonally frozen areas based on NMR test. Rock Soil Mech. 2018, 42, 2741–2754. [Google Scholar]
  44. GB/T 50123-2019; Standard for Geotechnical Test Method. Available online: www.mohurd.gov.cn (accessed on 1 October 2019).
  45. Liu, Y.; Li, Z.; Guo, L.; Kang, W.; Zhou, Y. Pore characteristics of soft soil under triaxial shearing measured with NMR. J. Rock Mech. Eng. 2018, 18, 1–8. [Google Scholar]
  46. Liao, X. Fractal Characteristics of Pores in Rock and Soil Based on NMR; Guilin University of Technology: Guilin, China, 2020. [Google Scholar]
  47. Zhou, H. Study on Soft Soil Microstructure and Mechanism of Seepage and Consolidation in Pearl River Delta (PRD); South China University of Technology: Guangzhou, China, 2013. [Google Scholar]
Figure 1. Cumulative curve of particle size gradation of samples.
Minerals 12 00314 g001
Figure 2. Flow chart of freeze-thaw cycle.
Minerals 12 00314 g002
Figure 3. Test flow chart.
Minerals 12 00314 g003
Figure 4. Variation pattern of strength and porosity of samples: (a) Strength; (b) Porosity.
Minerals 12 00314 g004
Figure 5. T-2 spectrum distribution curve of coarse-grained soil. (a) Division of peak regions; (b) T-2 time distribution curve.
Minerals 12 00314 g005
Figure 6. The variation curve of the proportion of pore volume in each peak with the number of freeze–thaw cycles.
Minerals 12 00314 g006
Figure 7. Relationship between intensity loss rate and variation of spectral area ratio of each peak and number of freezing–thawing cycles: (a) strength loss rate; (b) changes in spectral area ratio of each peak.
Minerals 12 00314 g007
Figure 8. Fitting results of correlation model between mechanical properties of coarse-grained soil and pore structure. (a) main peak; (b)secondary peak 1 (c) secondary peak 2.
Minerals 12 00314 g008
Table 1. Main components of soil particles.
Soil GrainCompositionSiO2CaOK2OAl2O3Fe2O3MgO/
Content39.6%18.2%2.0%5.0%3.3%7.0%/
Table 2. Particle size gradation and physical indexes of samples.
Particle Size Mass RatioDry
Density
(g·cm−3)
Density (g·cm−3)Natural Moisture Content (%)
10–20
mm
5–10
mm
2.5–5
mm
1.25–2.5
mm
0.63–1.25
mm
0.315–0.625
mm
<0.315
mm
32.3%23.1%15.6%10.5%9.0%6.0%3.5%2.182.347.5
Table 3. CPMG sequence parameters of coarse-grained soil porosity test.
CPMG Sequence Parameters of NMR
TDPRGTWSWRG1RFDDRG1SFO1
87,538151000 ms250 KHz20 db0.08 ms312 MHz530,928.73 Hz
TD, PRG, TW, SW, RG1, RFD, DRG1, SF, O1 represent time data, pre-amp regulate gain, time wait, sampling bandwidth, regulate analog gain 1, regulate first data, regulate digital gain1, spectrometer frequency, offset 1, respectively.
Table 4. Test results of coarse-grained soil strength and porosity.
Cycles (Times)Uniaxial Strength (KPa)Porosity (%)
0155.111.7
5122.712.7
10107.813.8
1595.914.3
2085.315.0
Table 5. Pore size distribution of coarse-grained soil.
Cycles
(Times)
Micro-Pore
(%)
Fine Pore
(%)
Medium Pore
(%)
Large Pore
(%)
00.00291.5419.5878.87
50.00221.4118.9779.62
100.00171.2318.8879.89
150.00151.2318.8279.95
200.00121.1718.1780.66
Table 6. Variations in the ratio of pore volume to each peak in coarse-grained soil T-2 curve.
Cycles (Times)T-2 Spectrum
Area
Ratio of Main Peak Pore Volume (%)Ratio of Secondary Peak 1 Pore
Volume (%)
Ratio of Secondary Peak 2 Pore
Volume (%)
043,50350.236.513.3
549,94053.630.815.6
1061,25754.629.416.0
1562,72655.028.017.0
2067,68956.923.619.4
Table 7. Changes in the ratio of pore volume to each peak in coarse-grained soil T-2 curve.
Cycles (Times)Strength Loss Rate (%)The Variation of the Proportion of Pore Volume in Each Peak (%)
Main PeakSecondary Peak 1Secondary Peak 2
520.93.45.72.3
1030.54.47.12.7
1538.24.88.53.7
2045.06.712.96.1
Table 8. Parameter values of correlation model fitting between mechanical properties of coarse-grained soil and pore structure.
Pore StructureFitting Parameters
βλR2
Main peak1.010.090.968
Secondary peak 11.000.050.973
Secondary peak 20.990.110.953
Publisher’s Note: MDPI stays neutral with regard to jurisdictional claims in published maps and institutional affiliations.

