Abstract
Accurate estimation of thermal conductivity of rocks is of paramount importance for projects such as the development of hot dry rock and the geological storage of nuclear waste. In this paper, 30 granite samples from the Songliao and Gonghe Basins in China were tested by X-ray diffraction, polarizing microscope, and Thermal Conductivity Scanning (TCS) measurements. Different mineral contents determine the thermal conductivity of the rock as a whole. The geometric average model and the harmonic average model have great limitations. Combined with the above two models, a new model is proposed for estimating the thermal conductivity, and results are less different from the measured values and have universal applicability. The relative estimation error on the thermal conductivity calculated by mineral composition is significantly reduced. The accuracy of thermal conductivity calculation can be improved by mineral composition.
1. Introduction
Thermal conductivity is an important thermophysical parameter of rock. Thermal conductivity plays a very important role in many research fields [1,2,3]. For example, a. oil and natural gas geology; b. Utilization of hydrothermal resources and underground thermal energy storage; c. Hydrogeological issues; d. Civil engineering issues; e. Enhanced Geothermal System (EGS) engineering. These areas require more accurate thermal conductivity. The thermal conductivity of rock is affected by many factors, including mineral composition, porosity [4,5,6,7,8,9], water content [10,11,12,13,14], temperature and pressure [15,16,17,18,19], etc. Many scholars have obtained models with different thermal conductivity of rocks by considering different influencing factors. Each model has its own limitations and is not suitable for all types of rocks. For example, some models cannot accurately predict the thermal conductivity of rocks with low porosity and low fluid–solid thermal conductivity ratios. Due to the importance of thermal conductivity, it is necessary to accurately determine the thermal conductivity of rock samples in different regions to provide relatively accurate basic theoretical data for engineering applications such as the development of heat energy.
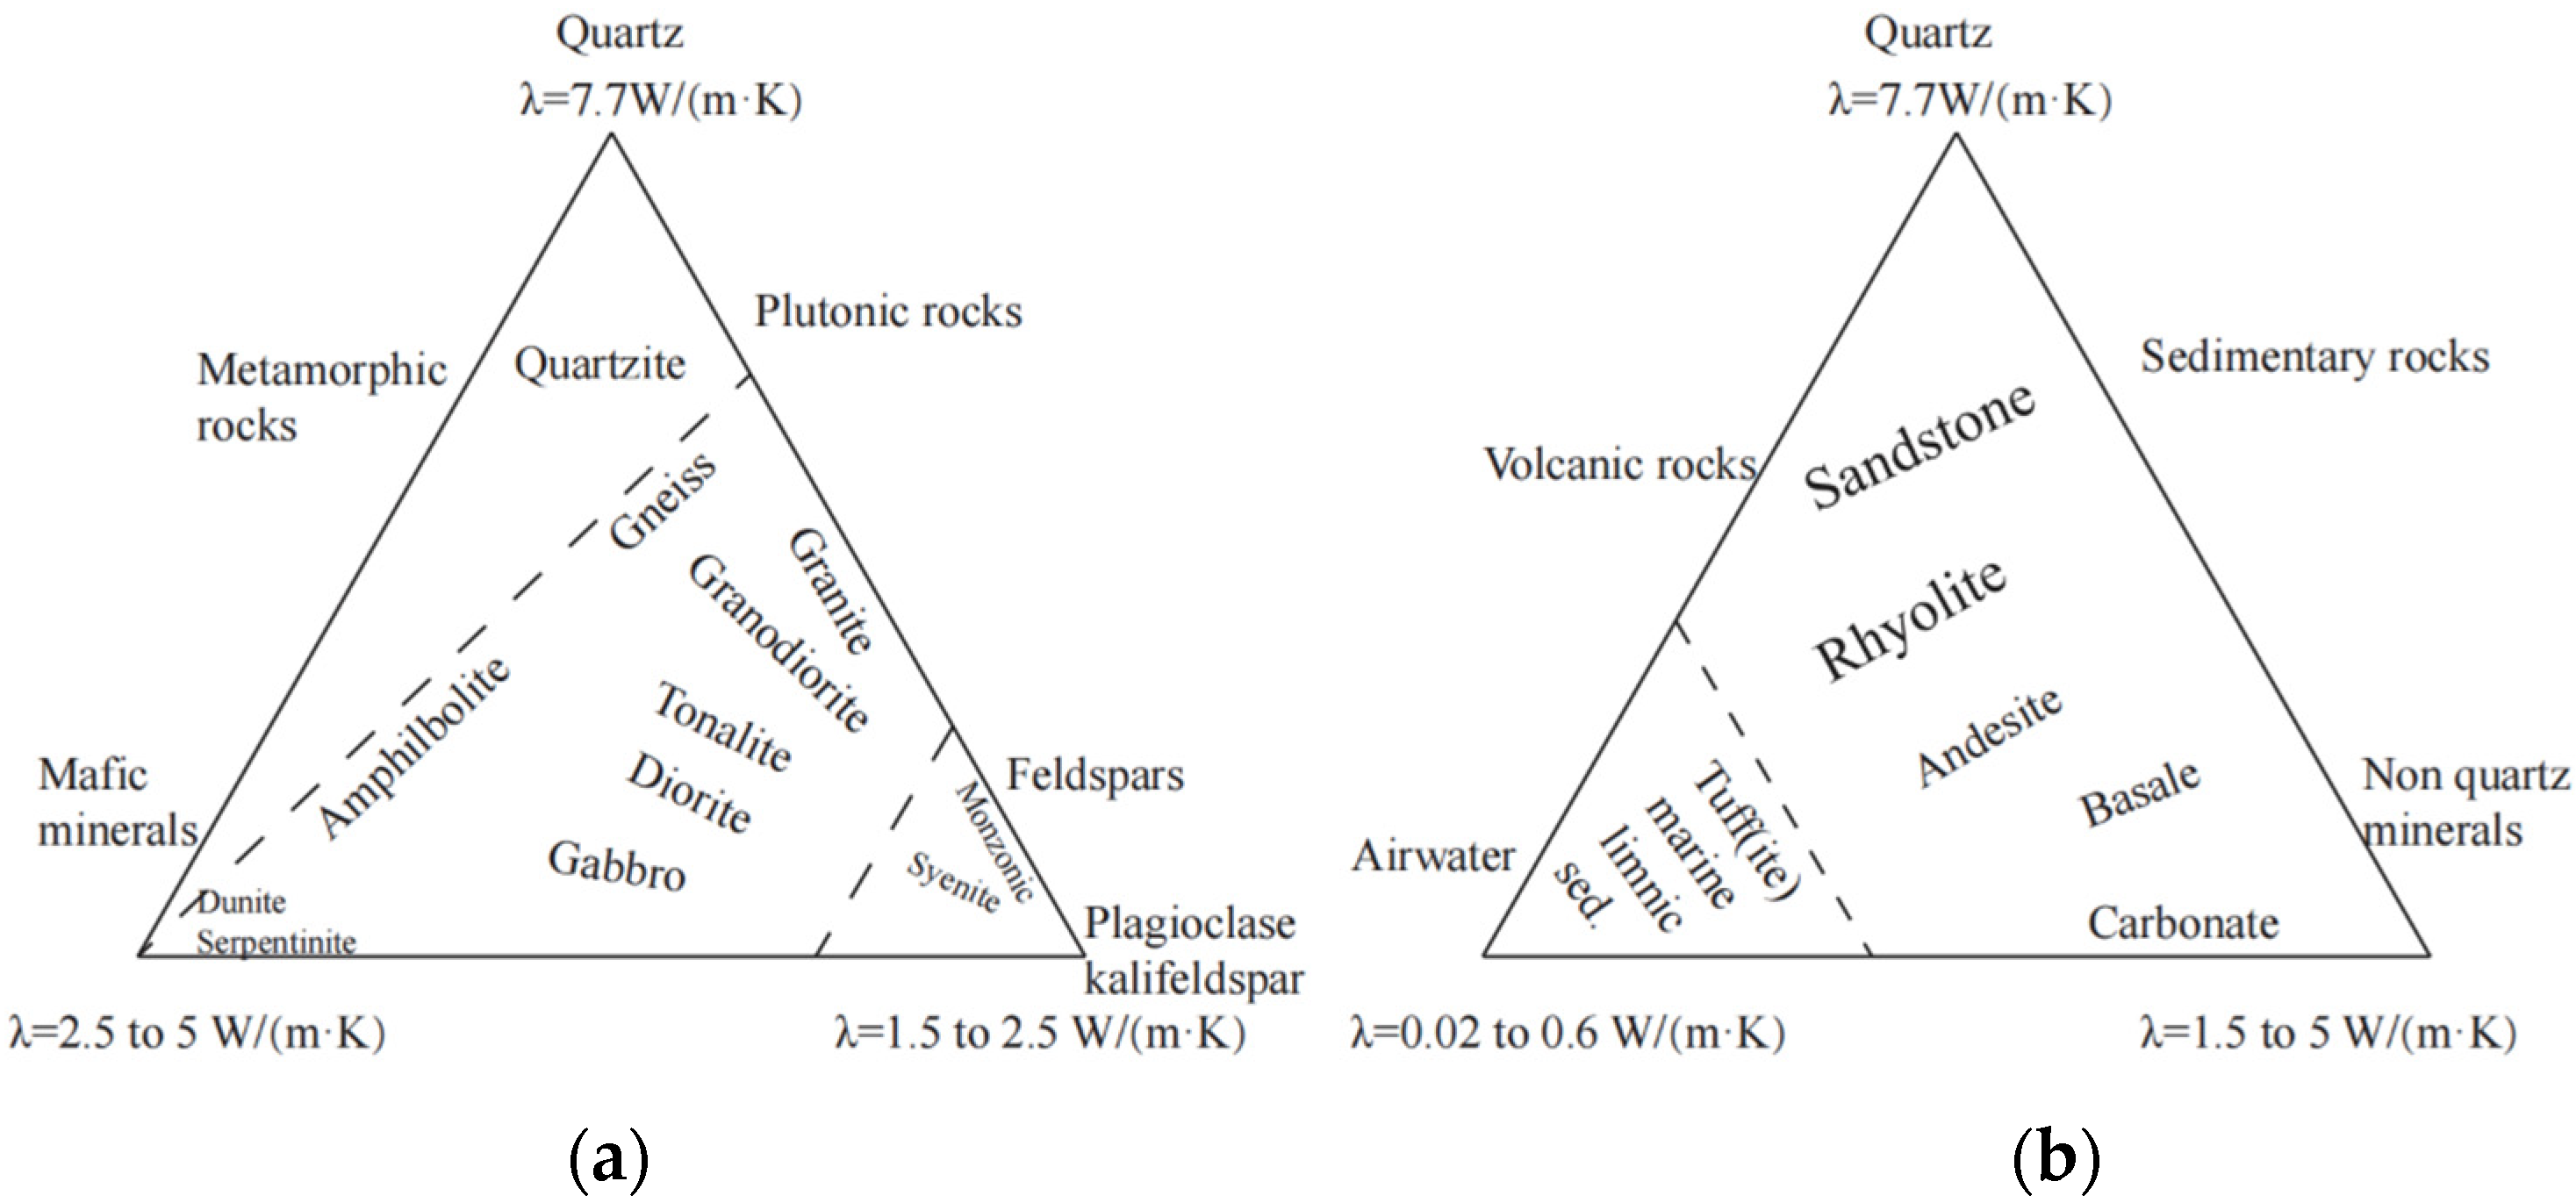
The characteristics of the rock itself are influenced by its mineral composition and mineral content. Some scholars have carried out much research on the influence of mineral composition on rock properties [20,21,22,23,24]. Among them, the research on the relationship between the thermal conductivity of rocks and minerals includes: Clauser and Huenges [19] study on the relationship between different minerals and the thermal conductivity of rocks. Figure 1a shows the relationship between metamorphic rocks, intrusive rocks, and different mineral components. Figure 1b shows the relationship between volcanic rocks, sedimentary rocks, and different mineral compositions. For different rocks, the position in Figure 1 basically represents its thermal conductivity and shows the relationship between its composition and different minerals. Intrusive rocks such as granite are mainly composed of minerals such as quartz and feldspar, and the porosity of such rocks is generally small. Therefore, the thermal conductivity of this type of rock is mainly determined by its mineral composition. Fuchs and Förster [25] calculated the thermal conductivity of rocks in the northern German basin based on the rocks’ mineral composition.
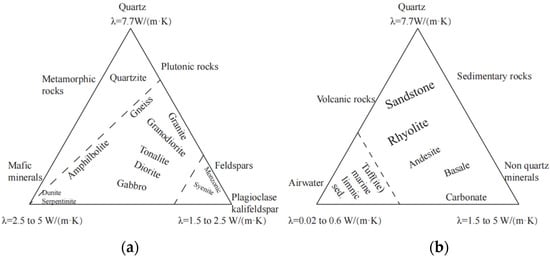
Figure 1.
The relationship between the three major rock types and different mineral components [19]; (a) Relationship between metamorphic rocks, intrusive rocks, and different mineral compositions; (b) Relationship between volcanic rocks, sedimentary rocks, and different mineral compositions.
In this paper, we take granite samples from typical sites in China to analyze the relationship between the thermal conductivity of rocks and their mineral content. An empirical formula of thermal conductivity of rock with mineral content is obtained. This paper provides a theoretical basis for the development and utilization of deep geothermal resources. In the process of hot dry rock exploitation for geothermal energy, this formula can be used for calculating the thermal conductivity of the parent rock when recharging the reservoir temperature.
2. Site, Experiment, and Rock Mineral Description
2.1. Site
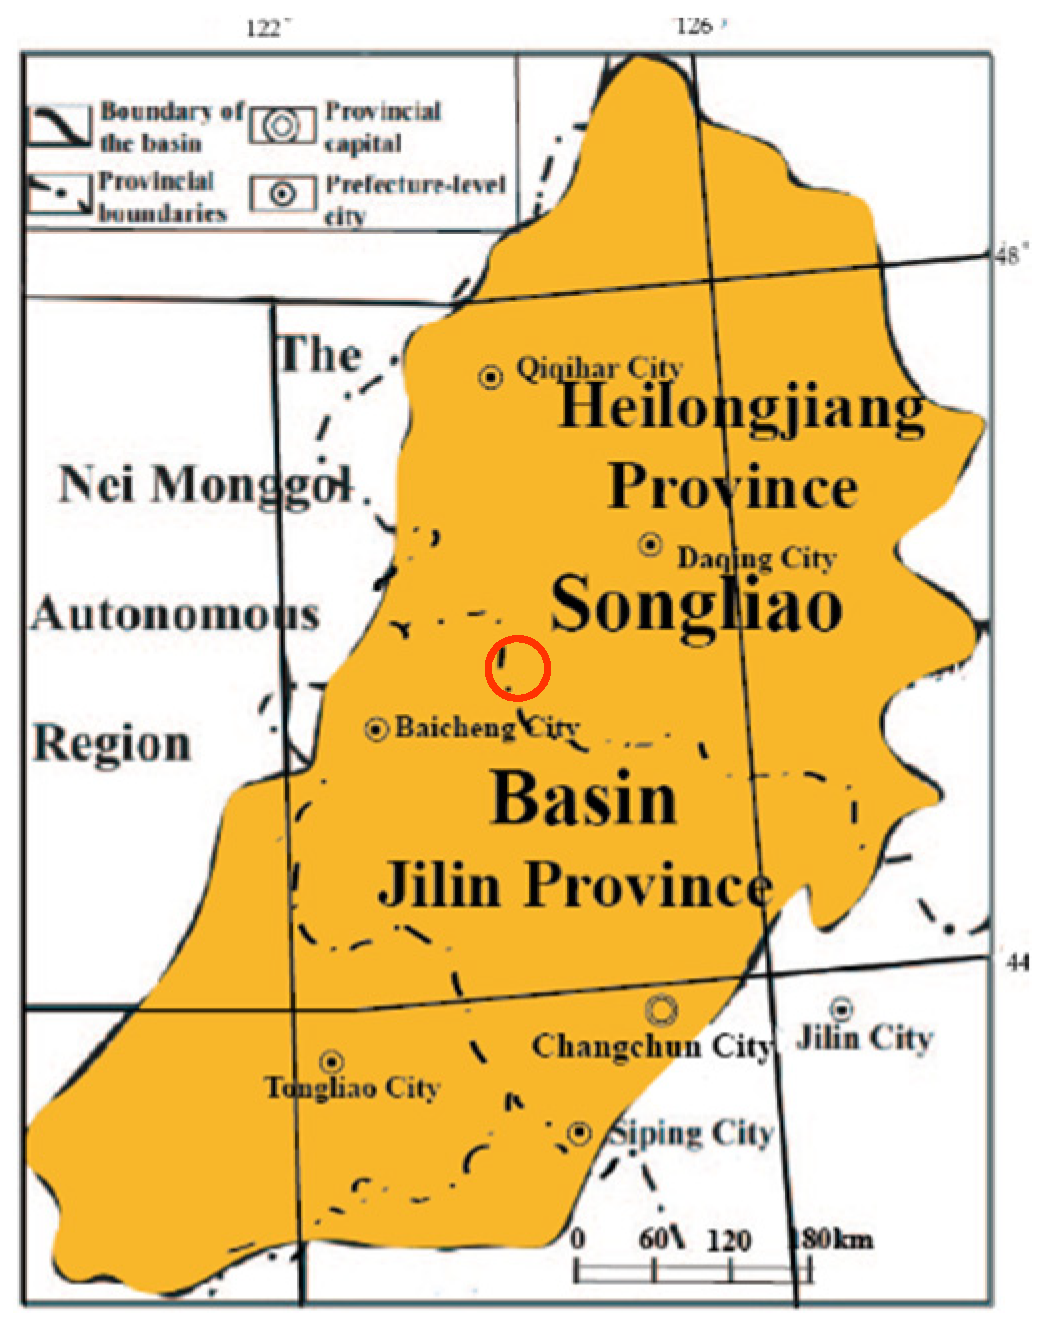
The Songliao Basin is located in the central part of Northeast China, straddling the Heilongjiang, Jilin, and Liaoning provinces, and the Inner Mongolia Autonomous Region (Figure 2). The specific location is 119°40′–128°24′ east longitude and 42°25′~49°23′ north latitude. The basin is distributed in the NNE direction, shaped like an irregular rhombus, with a length of about 750 km, a width of 330–370 km, and an area of about . Intrusive rocks such as granite and metamorphic rocks together form the base of the basin.

Figure 2.
Geographical map of Songliao Basin. The sampling site Xujiaweizi is circled in red in the figure, and sampling depth is 3000–4000 m.
The specific location of the Qinghai Gonghe Basin is between 98°46′~101°22′ east longitude and 35°27′~36°56′ north latitude, with an average elevation of about 3 km (Figure 3). The Gonghe Basin extends NW–SE, with a long axis exceeding 300 km, an average width of 50–60 km, and a total area of about . Influenced by Indosinian geological movement, the geosyncline area was strongly uplifted, causing extensive intrusion of Indosinian granite, granodiorite, and other igneous rocks. Based on the magnetotelluric results, it is known that the deep melt acts as a heat source, and its heat is transferred to the relatively shallow granite body through the buried fault. The thicker Quaternary sedimentary strata in the upper part act as the overlying strata to prevent heat escape. The Gonghe Basin has formed a relatively shallow high-grade hot dry rock resource [26].
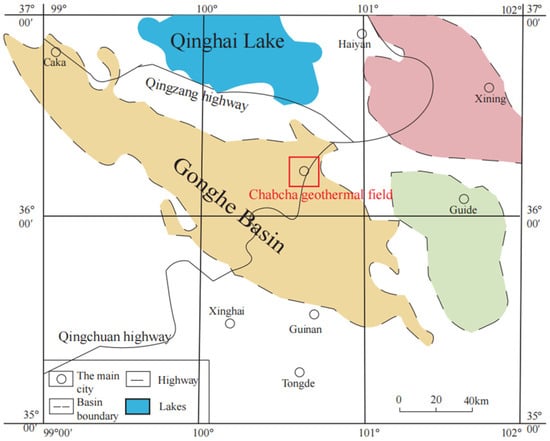
Figure 3.
The geographical location of the Gonghe Basin. The red box is the sampling point of the Gonghe Basin on the north bank of the Longyangxia Dam.
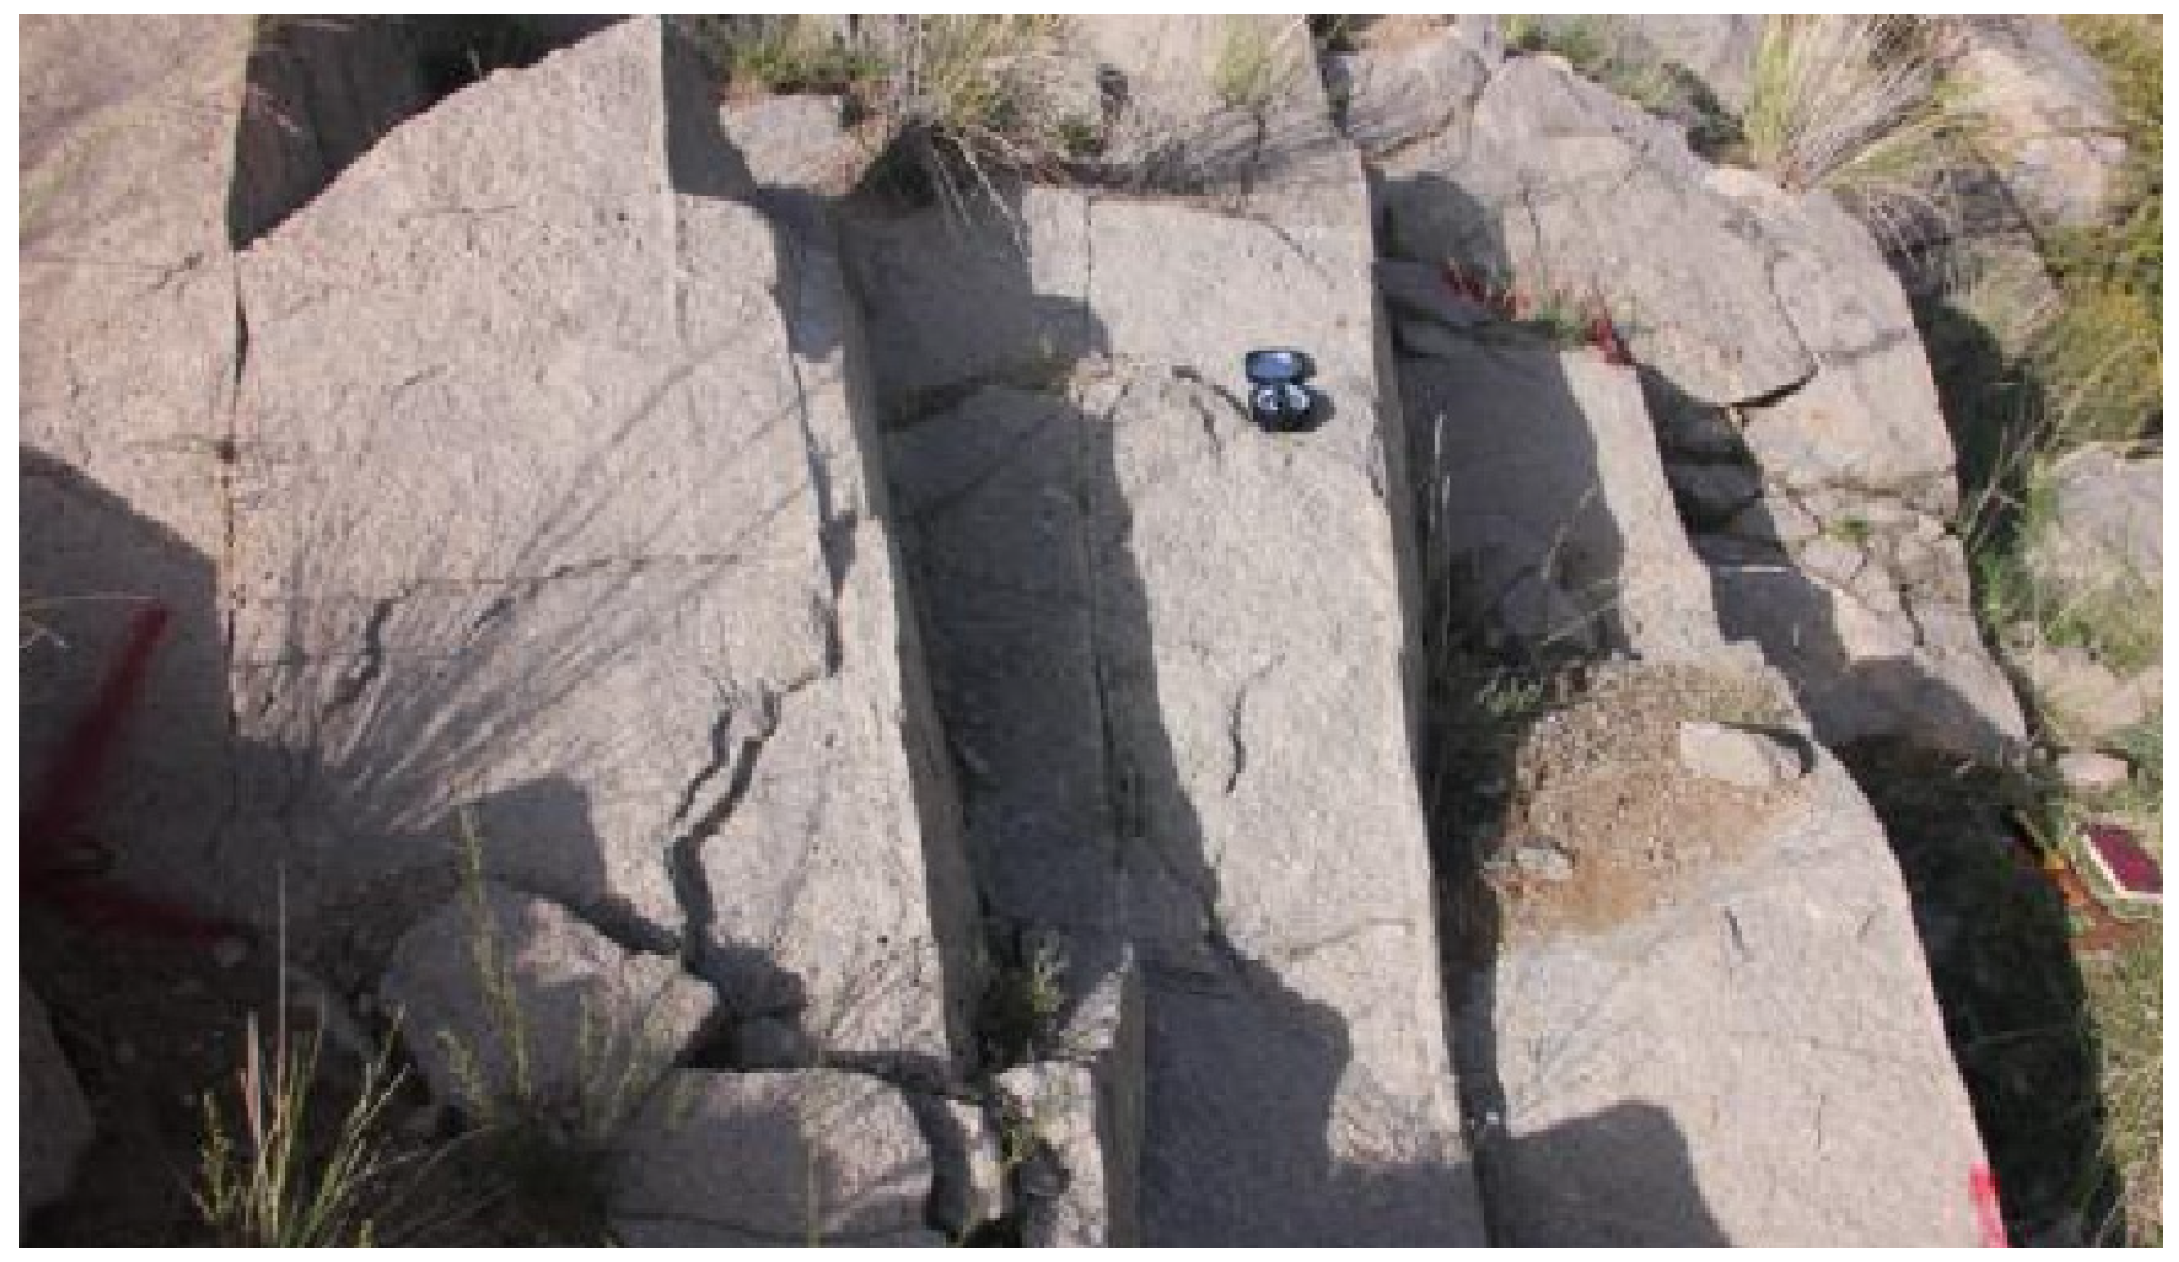
Chinese scientists have selected the Chabcha geothermal field in the eastern part of the basin based on geology, tectonic geology, and geophysical prospecting. Within the depth of 3705 m in this geothermal field, four hot dry rock wells with a temperature higher than 180 °C have been successfully drilled. This project accelerated the process of EGS engineering attempts in China. The rock samples were from the granite mass near the North Bank of Longyangxia Dam (Figure 4) and the Gouhou Reservoir-Qianbolusi area in the northwest of the county, near the first geothermal well (GR1 geothermal well).
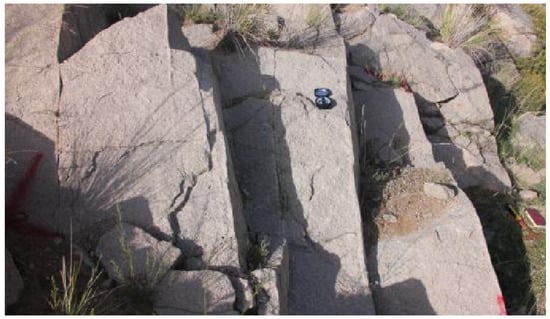
Figure 4.
Outcrop of granite on the north bank of Longyangxia Dam.
2.2. Experiment
The rock samples are Indosinian granite outcrop from the Gonghe Basin and samples from the Songliao Basin with gray, fine-grained appearance. The main mineral components include quartz, feldspar, biotite, etc. According to the procedure described by the ASTM (American Society for Testing and Materials) and ISRM (International Society for Rock Mechanics) standards, the sample was processed into a cylinder with a diameter of 25 mm and a height of 50 mm. Both ends of the sample are cut flat and polished to make the parallel error less than 0.02 mm. In order to adapt to the indoor environment and eliminate some undesirable external effects, after the preparation, the rock samples were placed at constant room temperature (25 °C) in a dry shaded place for one week for subsequent operations.
2.2.1. X-ray Diffraction
Rocks are composed of minerals and the pores they contain. The thermal conductivity of a rock is a function of the thermal conductivity of its constitutive minerals. There is an intrinsic relationship between the thermal conductivity of rock and its mineral composition. In order to study the relationship between thermal conductivity and mineral content, this paper uses X-ray diffraction (DX-2700 X-ray diffractometer, Shanghai Precision Instruments Co., Ltd., Shanghai, China) technology to analyze the mineral composition of representative rock samples from the Songliao Basin and the Gonghe Basin. All rock samples contain quartz, alkaline feldspar, and plagioclase, but the content of each rock sample is different (Table 1).

Table 1.
X-ray diffraction of major minerals’ content analysis, porosity, laboratory thermal conductivity measurements, and estimated thermal conductivity.
The results of X-ray diffraction mineral content analysis show that quartz and feldspar are the main mineral components of the rock. For different rock samples, the range of content changes is obvious. The content of quartz ranges from 22% to 53%. The content of alkaline feldspar ranges from 8% to 45%. The content of plagioclase ranges from 18% to 37%. Biotite and hornblende are also found in the samples, and the content is between 2–22%. The content of calcite and clay minerals is low. It can be seen that the microstructure inside the rock is different due to the different content of the mineral composition. Moreover, influenced by the different thermal conductivity of each mineral, the thermal conductivity of rocks varies greatly.
2.2.2. Thermal Conductivity Scanning (TCS)
The technology used in TCS was developed by Popov et al. (2016); it uses an unsteady-state measurement device as shown in Figure 5 [27,28]. The instrument is a TCS tester made in Germany (Lippmann Geophysical Instruments, Schaufling, Gemany), which is based on scanning the rock surface coated with black paint with a continuously moving point heat source. The experimental error is 2%. Each specimen was tested three times and the average value was taken.
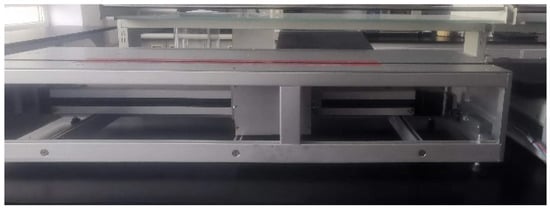
Figure 5.
Thermal conductivity scanning (TCS).
Thermal Conductivity Scanning (TCS) program as follows:
Step 1. Process the sample to ensure that the surface flatness error is within ±2 mm, and the length of the sample is not less than 20 cm in order to eliminate edge effects.
Step 2. Dry the sample at 105 °C. After every 24 h, cool the samples and weight them until the difference between two weighting values is less than 0.1%.
Step 3. Apply black paint on a relatively flat surface for TCS test. During the test, the distance between the heat source and the two infrared temperature probes is fixed, and they move relative to the rock sample at the same speed. The temperature probe continuously records the initial temperature and the temperature after heating along the heating wire, and forms a continuous temperature curve. At least three measurements are taken for each sample to eliminate instrument errors at 25 °C.
Step 4. The thermal conductivity of a rock sample is calculated using Popov’s procedure (Popov et al., 2016)
Step 5. The vacuum pumping method is used to saturate the sample. The water lever in the container which is used for pumping shall be higher than the sample, and the reading of the vacuum pressure gauge shall be the atmospheric pressure (101.325 kpa in the test), until no bubbles escape, and the pumping time shall be 5 h. The sample after vacuum pumping shall be placed in the original container and stand for 4 h under atmospheric pressure (101.325 kpa in the test) and normal temperature (25 °C). Take out the test piece and wipe the water on the surface. (According to Chinese Code for rock tests in water and hydropower projects (SL/T 264-2020).
Step 6. Step 4 is repeated. The saturated thermal conductivity of rock samples can be obtained under normal temperature and pressure (25 °C).
In this paper, a total of 30 rock samples from two regions were tested for their thermal conductivity. The variation range of all samples is 2.40–2.91 in the dry state and 2.82–3.16 in the saturated state. The variation range of thermal conductivity of granodiorite, syenite in Songliao Basin, and granodiorite in Gonghe Basin, respectively in the dry state is 2.70–2.90 , 2.40–2.60 , and 2.71–2.91 . The variation range, respectively in the saturated state is 2.85–2.95 , 3.00–3.16 , and 2.82–2.98 (Table 2). It can be seen that different types of rocks have different ranges of thermal conductivity, which is closely related to the mineral composition and structure of rocks. From the horizontal comparison, the range of thermal conductivity of granite in the same basin is relatively small. There are some samples with large variations of thermal conductivity. From the above mineral composition analysis, it can be seen that when the mineral content of the two rocks is not much different, the thermal conductivity is not much different. Conversely, the difference in thermal conductivity is large [29,30]. This is related to the mineral composition inside the rock, and it is also related to the pore size. In this paper, the thermal conductivity of main constituent minerals and the range of thermal conductivity of rock samples are collected (Figure 6).
Table 2.
Lithological description of polarized micrographs of four granites.
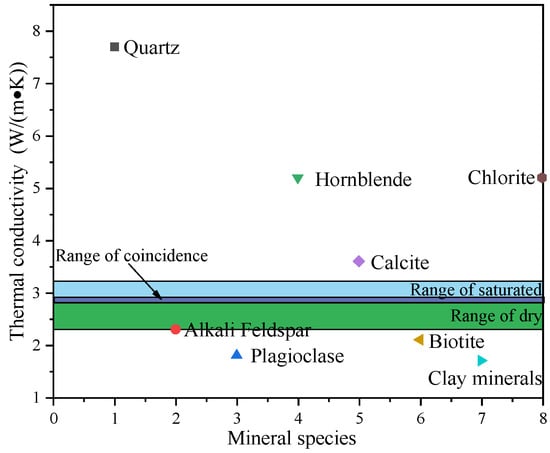
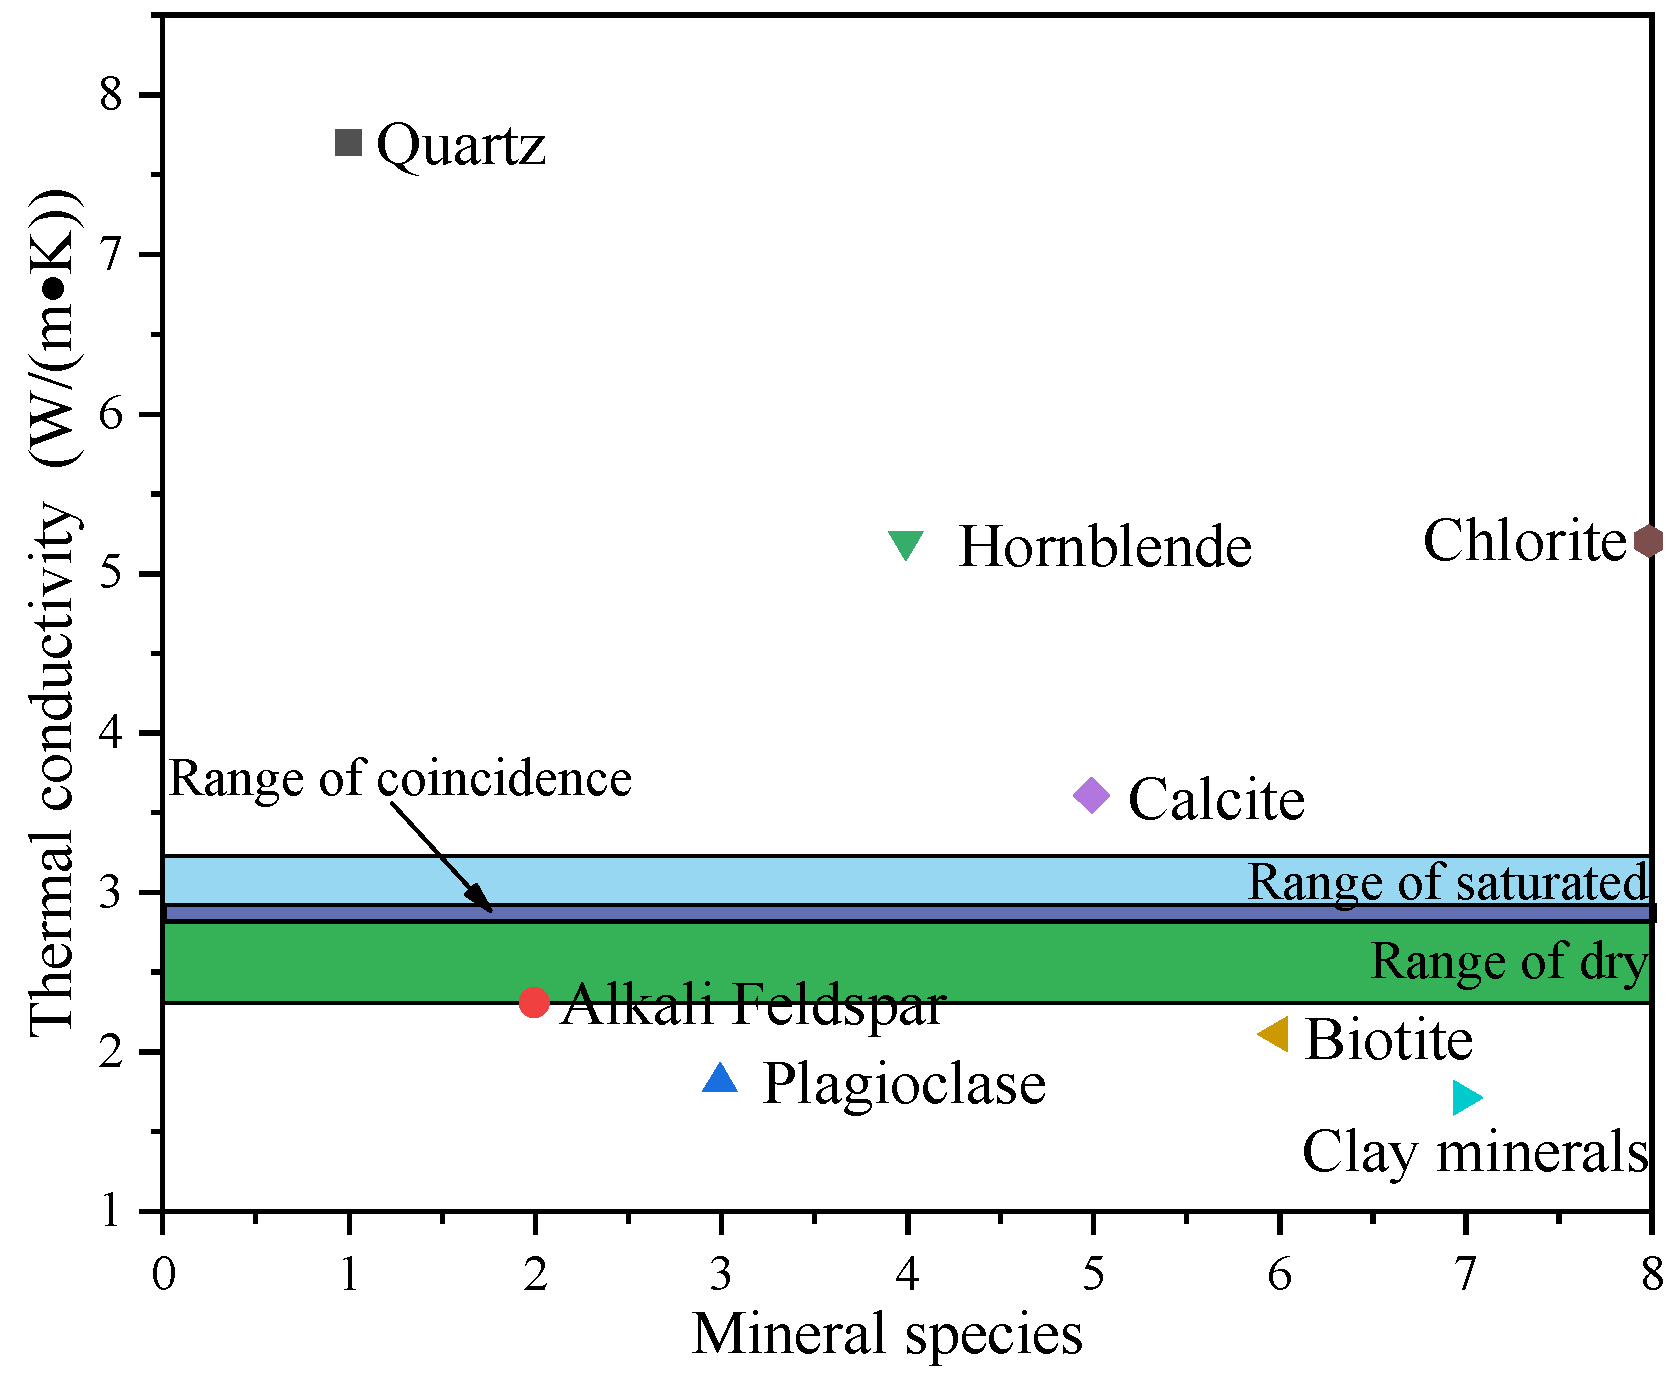
Figure 6.
The relationship between the thermal conductivity of main constituent minerals and the range of the thermal conductivity of rock samples. The thermal conductivity of different minerals: Quartz: 7.70W/(m∙K); Alkaline Feldspars: 2.30 W/(m∙K); Plagioclase: 1.80 W/(m∙K); Clay minerals: 2.6 W/(m∙K); Mica: 0.43 W/(m∙K); Calcite: 3.57 W/(m∙K); Hornblende: 5.30 W/(m∙K); Biotite: 2.13 W/(m∙K). [12,31]).
The thermal conductivity of granodiorite in the Songliao Basin basically varies around 2.60 . The thermal conductivity of granites in the Gonghe Basin basically varies around 2.80 . The thermal conductivity of some minerals is quite different from the range of thermal conductivity of the samples. For example, quartz, mica, amphibole, feldspar, and clay minerals (Figure 6). The content of these minerals with the large differences in thermal conductivity mainly determines the thermal conductivity of rock. For dry rock, the thermal conductivity of air-filled pores is lower than that of minerals ( is often taken as ). Therefore, porosity has a greater influence on the thermal conductivity of dry rock. For saturated rock, the fluid-filled pores’ thermal conductivity is higher than that of gas ( is often taken as ). To a certain extent, the influence of porosity on thermal conductivity is reduced.
2.2.3. Porosity
In this paper, the KS-1 gas porosity and permeability testers are used to measure the porosity of samples. Helium is injected in the rock sample at increasing pressures; then using the Boyle’s law, the effective pore () and sample () volumes are estimated from the recorded pressure change given the porosity:
where, is void volume; is particle volume.
Measured porosities show that, in the Songliao Basin and Gonghe Basin, the porosity of granodiorite in the Songliao Basin is below 5%. Some adamellites in the Gonghe Basin have large porosity, reaching 8% (Table 1).
2.3. Rock Mineral Description
The composition and structure of rocks are closely related to their genesis and can also indirectly reflect the external environment of rock formation. More importantly, the composition and structure of the rocks are also directly responsible for determining thermal conductivity. Therefore, the analysis of rock microstructure has important research significance. This paper selected four representative granites, which represent different formation environments, for polarizing microscopy and mineral composition analysis. In general: the particle size and structural characteristics of granite cannot be observed by the naked eye and must be observed with the help of microscopic instruments. Therefore, these four rocks were selected for microstructural studies to determine the mineralogical composition characteristics of the different rocks.
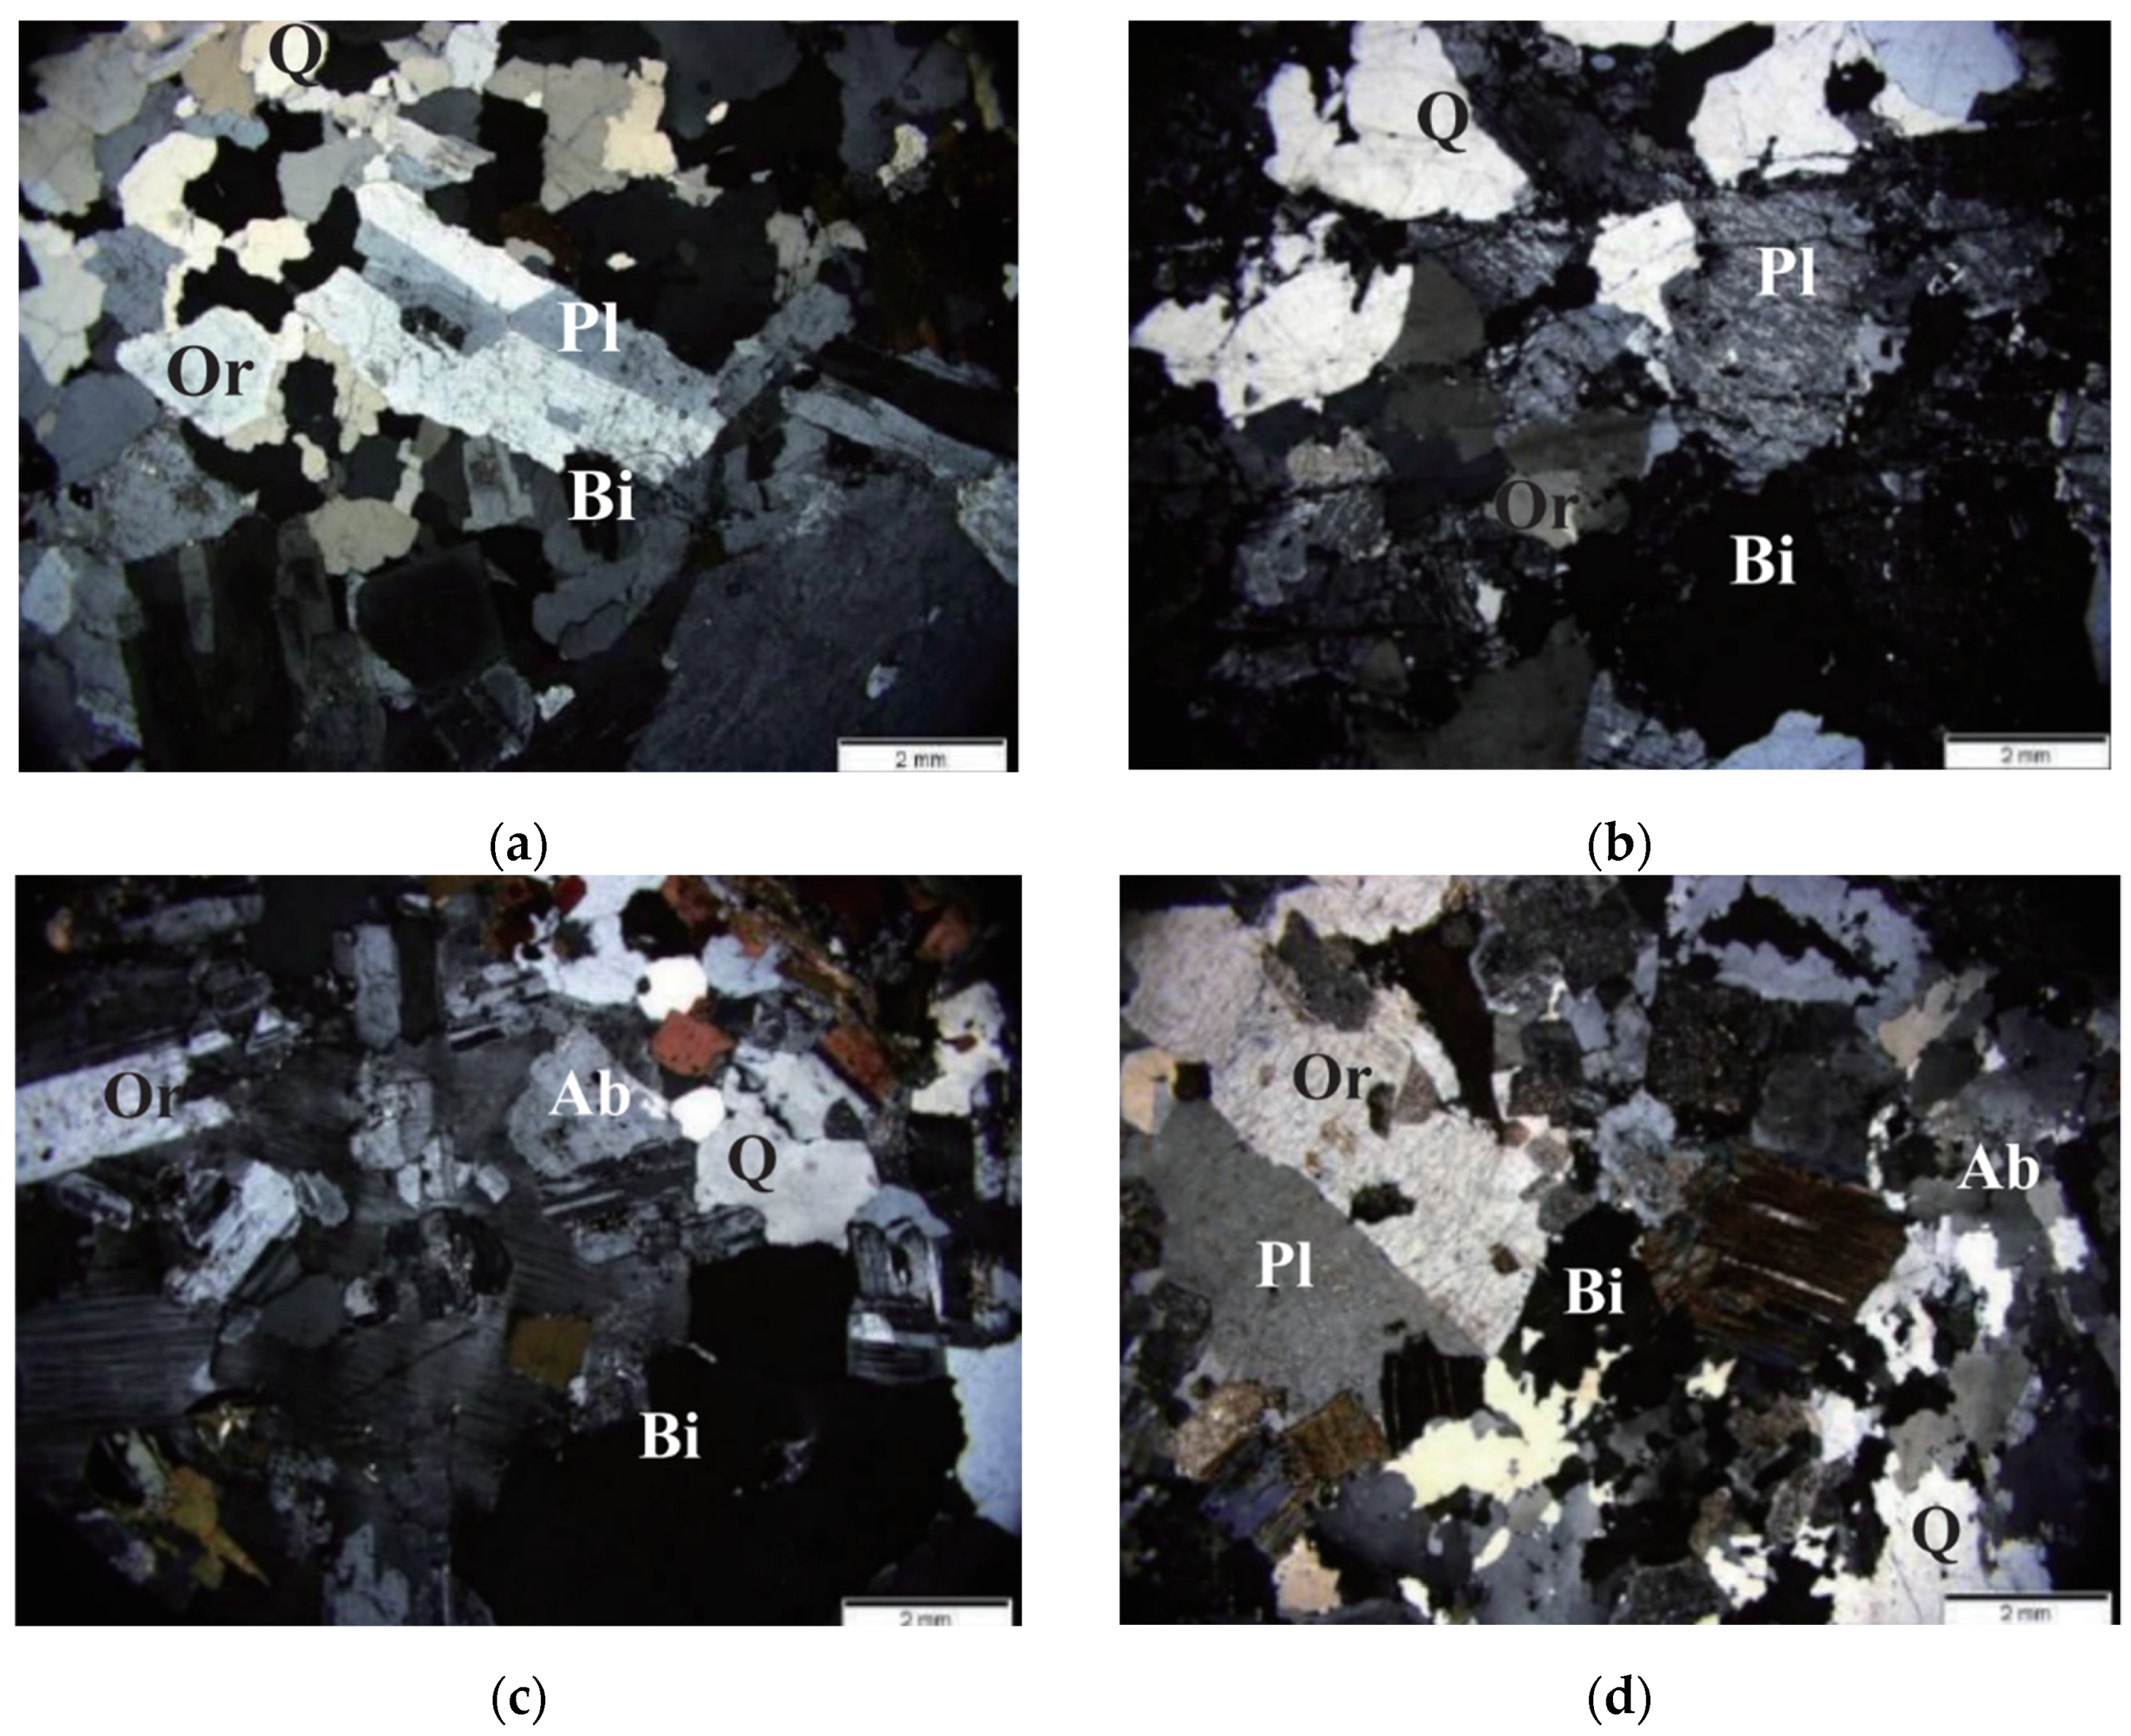
The representative rock samples from the Songliao Basin and Gonghe Basin were observed by a polarizing microscope, and the 2 mm micrographs of the rock were obtained (Figure 7).
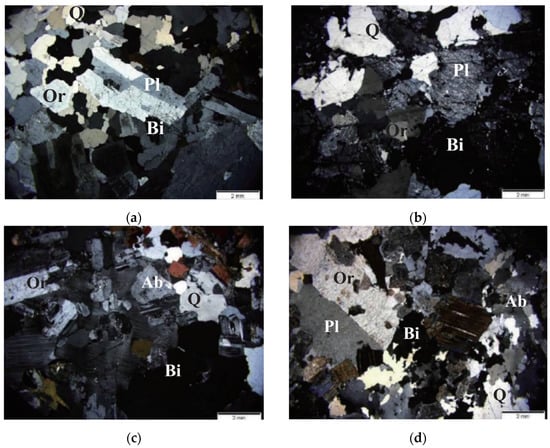
Figure 7.
Polarized microscope photo of granite [29] (where: Q is Quartz; Pl is Plagioclase; (a) Granodiorite in the Songliao Basin; (b) Syenogranite in the Songliao Basin; (c) Granodiorite in the Gonghe Basin; (d) Adamellite in the Gonghe Basin; Bi is Biotite; Ab is Alkali Feldspar).
The color of granites in Songliao Basin and Gonghe Basin are yellow with pink or grayish-white. Granite is an acidic intrusive rock whose main components are quartz, feldspar, and mica. Granite has a semi-self-propelled granular or porphyritic structure and a massive structure. It is often produced in rock plants and foundations, and can often form well-developed mineral particles (Figure 7, Table 2) [29].
3. Validate against Existing Models
3.1. Geometric Average Model Validation
Lichtenecker [25] had proposed a geometric average model, which is currently the most widely used method for calculating the thermal conductivity of rock skeletons. The thermal conductivity of the rock skeleton is the product of the thermal conductivity of the mineral components that make up the rock, as shown in the following equation [32]:
where is the thermal conductivity of rock skeleton; is the thermal conductivity of the -th mineral in the rock; is the volume fraction of the -th mineral in the rock.
According to the mineral content of different rock samples in Table 1, Equation (2) can be used to calculate the skeleton thermal conductivity of each rock sample. The geometric mean model is used to convert the thermal conductivity of the rock skeleton into that of the rock. Assume that all the pores are filled with water or air. The conversion equation is shown in the following equation:
where is the thermal conductivity of saturated rock; is the thermal conductivity of dry rock; is the thermal conductivity of rock skeleton; is the thermal conductivity of the -th mineral in the rock; is the volume fraction of the -th mineral in the rock; is the thermal conductivity of air in pores; is the thermal conductivity of water in pores; is porosity of the rock.
Table 1 shows the skeleton’s calculated thermal conductivity, the saturated rock’s thermal conductivity after the conversion calculation, and the laboratory test values. The comparison between the calculated and tested values of thermal conductivity of saturated rocks shows that the two values are similar for most of the samples. However, some samples are quite different. However, the comparative analysis of the calculated results shows intrinsic connection between the thermal conductivity of the rock and the mineral composition. The skeleton thermal conductivity is closely related to the content of quartz. Additionally, the thermal conductivity can be calculated and evaluated from the mineral content of the rock. The calculated values of and are larger than the measured values. The relative error of the calculated value of the saturated thermal conductivity is 19%; the relative error of the calculated value of the dry thermal conductivity is 21%. The relative error of calculation is large. It is unable to meet the requirements of solving the exact value of thermal conductivity in engineering.
3.2. Harmonic Average Model Validation
Chopra et al. [33] used the thermal conductivity of each mineral to calculate the thermal conductivity through the models. The considered mean models are arithmetic, geometric, harmonic, effective, Voigt–Reuss–Hill, and Hashin–Shtrikman along with their lower and upper bound. This research proposes that the thermal conductivity of low-porosity granite can be calculated through the harmonic average model. The equation is as follows:
where ; is the thermal conductivity of saturated rock; is the thermal conductivity of the -th mineral in the rock; is the volume fraction of the -th mineral in the rock; is the thermal conductivity of water in pores; is porosity of the rock.
It can be seen from Table 1 that when the porosity of the rock sample is low (<5%), the difference between the calculated value and the measured value is small, which has the reference value. When the porosity of the rock sample is large, such as the rock samples with the porosity of 7.18% in the table, the calculated value and the measured value are quite different. The relative error of calculated values of saturated thermal conductivity is 16%. Compared with the calculated geometric average, the relative error is smaller, but there are certain limitations. The calculated values are smaller than the measured values. However, it has some reference value for calculating the accurate value of thermal conductivity of rocks in the saturated condition.
4. Relationship between Mineral Composition and Thermal Conductivity
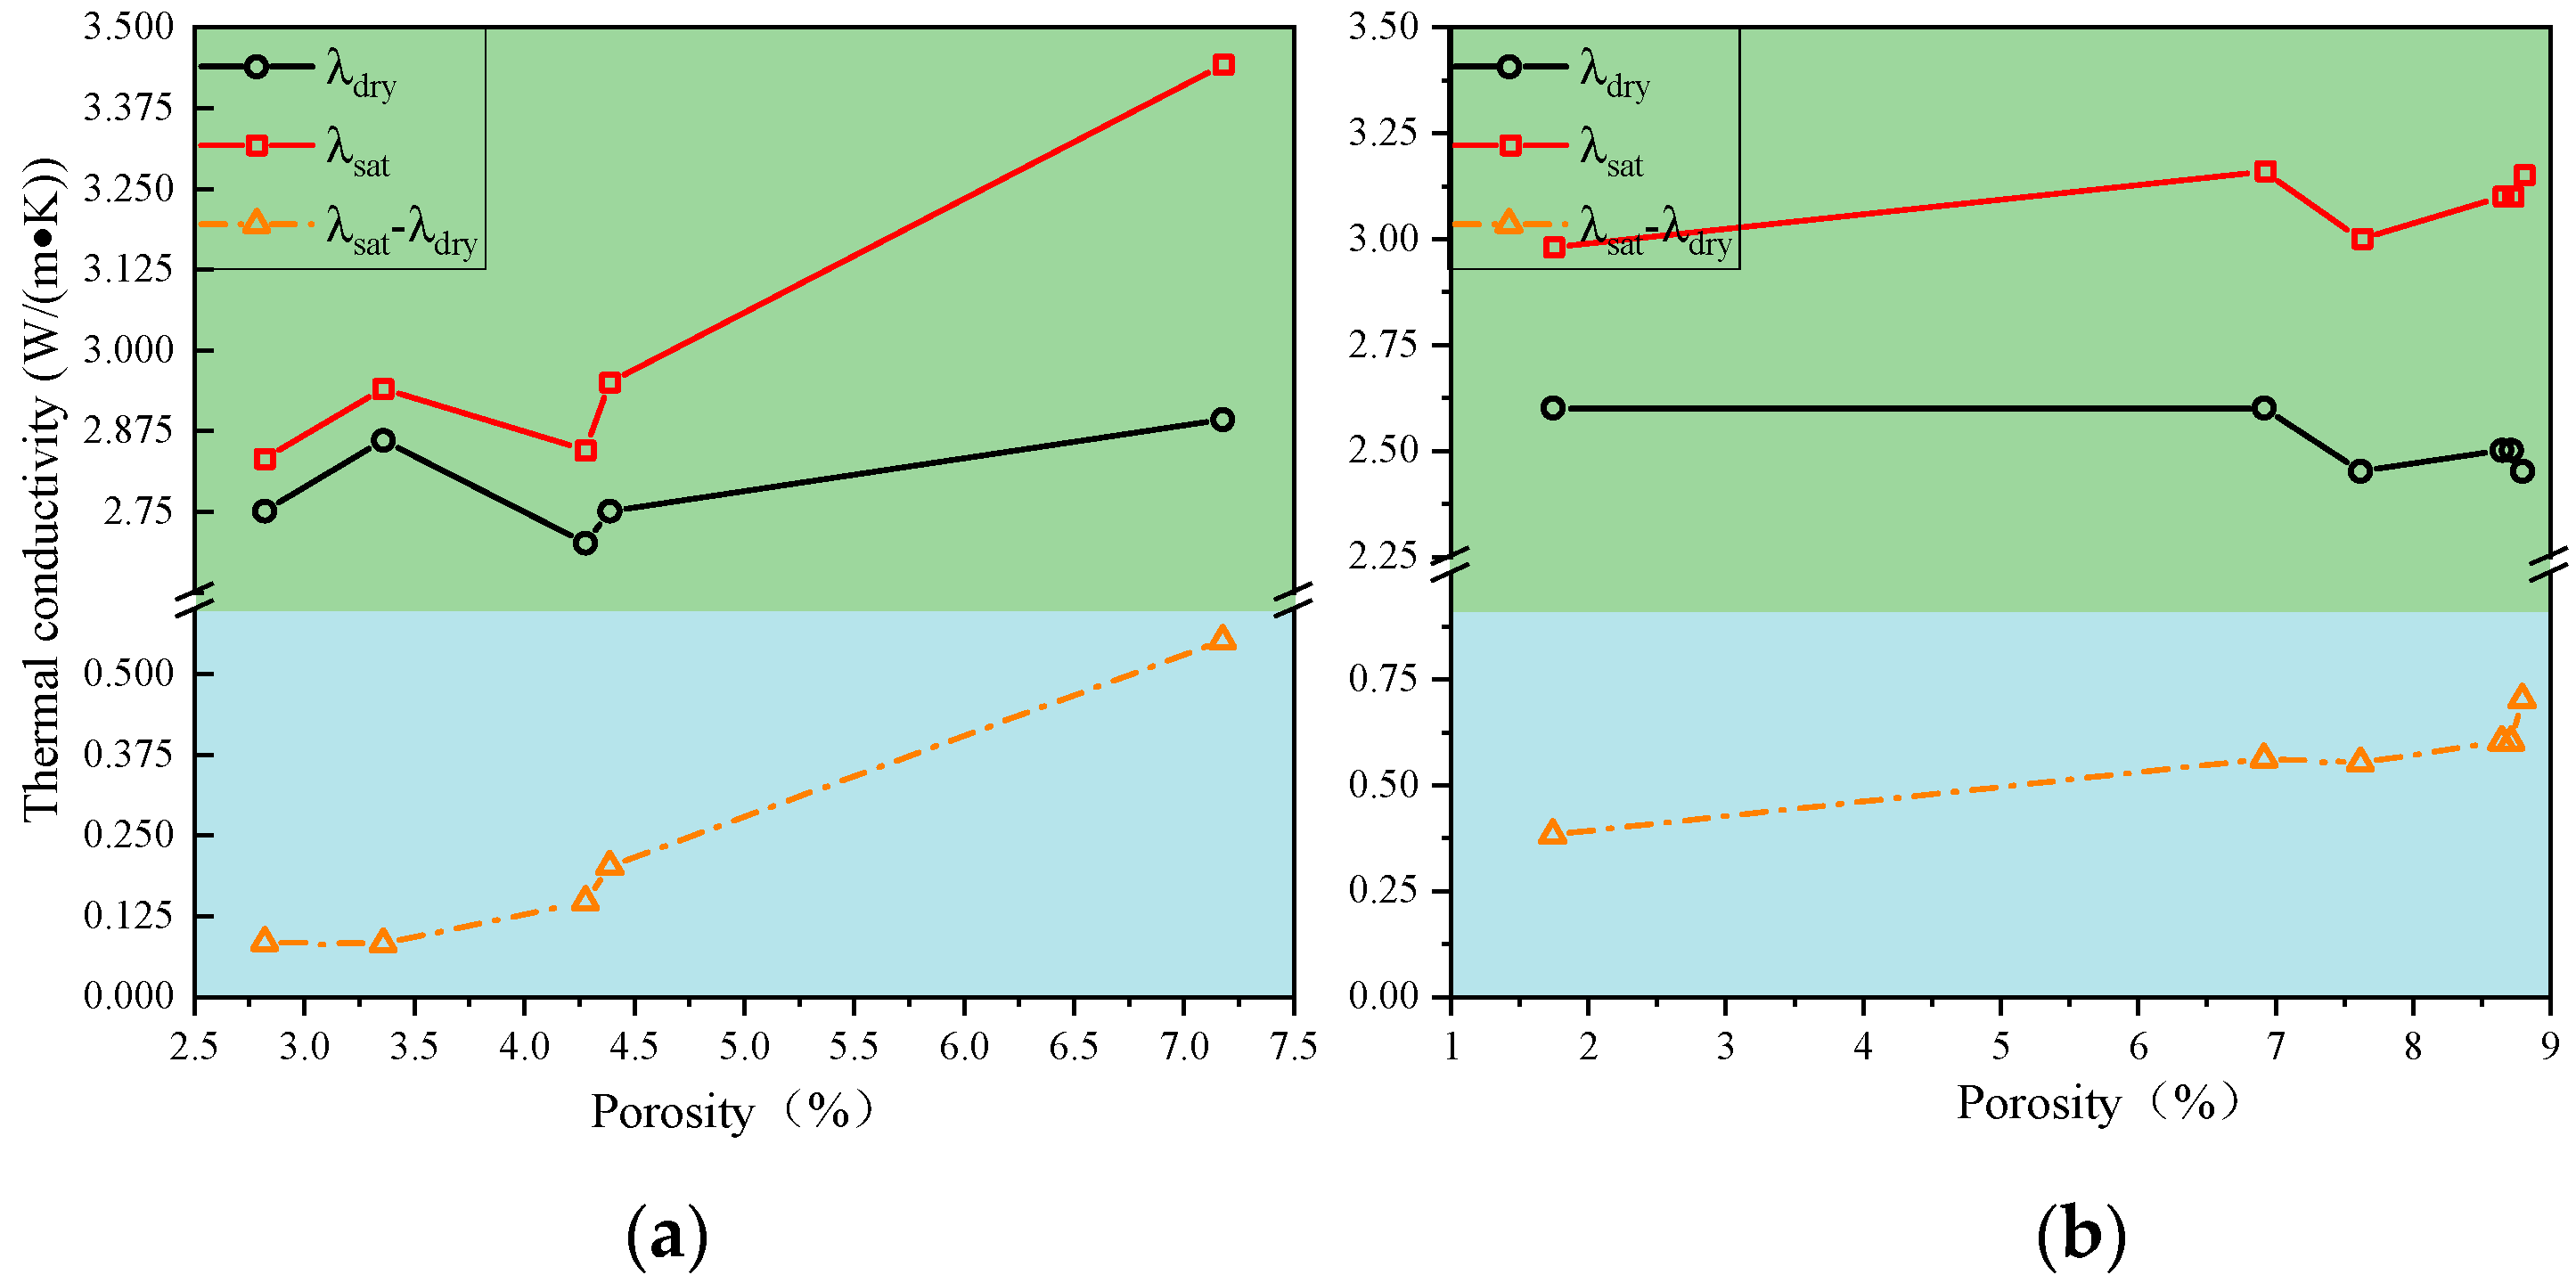
The laboratory test values of rock samples are classified according to the quartz content, and the variation of their thermal conductivity with porosity is investigated. When the quartz content is low (Figure 8a), − is between 0.068–0.515 . With the increase of porosity, the difference increases gradually. When the quartz content is high (Figure 8b), the difference is between 0.375 and 0.760 . The basically does not increase with porosity. increases with the porosity, but the range is much smaller than when the quartz content is small. It can be seen that the content of minerals such as quartz and porosity have different effects on the thermal conductivity of rocks. Therefore, in the calculation of and , the air and water in the pores cannot be calculated as a mineral-like composition with low thermal conductivity.
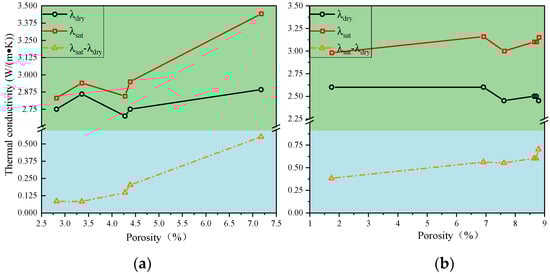
Figure 8.
Variation of thermal conductivity with porosity at the same quartz content: (a) Relationship between thermal conductivity and porosity of rock samples with 27% quartz content; (b) Relationship between thermal conductivity and porosity of rock samples with 45% quartz content.
In this paper, we propose to calculate the skeletal thermal conductivity as a harmonic average of the mineral composition and the thermal conductivity of the corresponding minerals, and then use the geometric mean to couple it with the gas or fluid in the pore space. The equation to calculate the dry and saturated thermal conductivity of the rock is as follows:
where is the thermal conductivity of saturated rock; is the thermal conductivity of dry rock; is the thermal conductivity of the -th mineral in the rock; is the volume fraction of the -th mineral in the rock; is the thermal conductivity of water in pores; is the thermal conductivity of air in pores; is porosity of the rock.
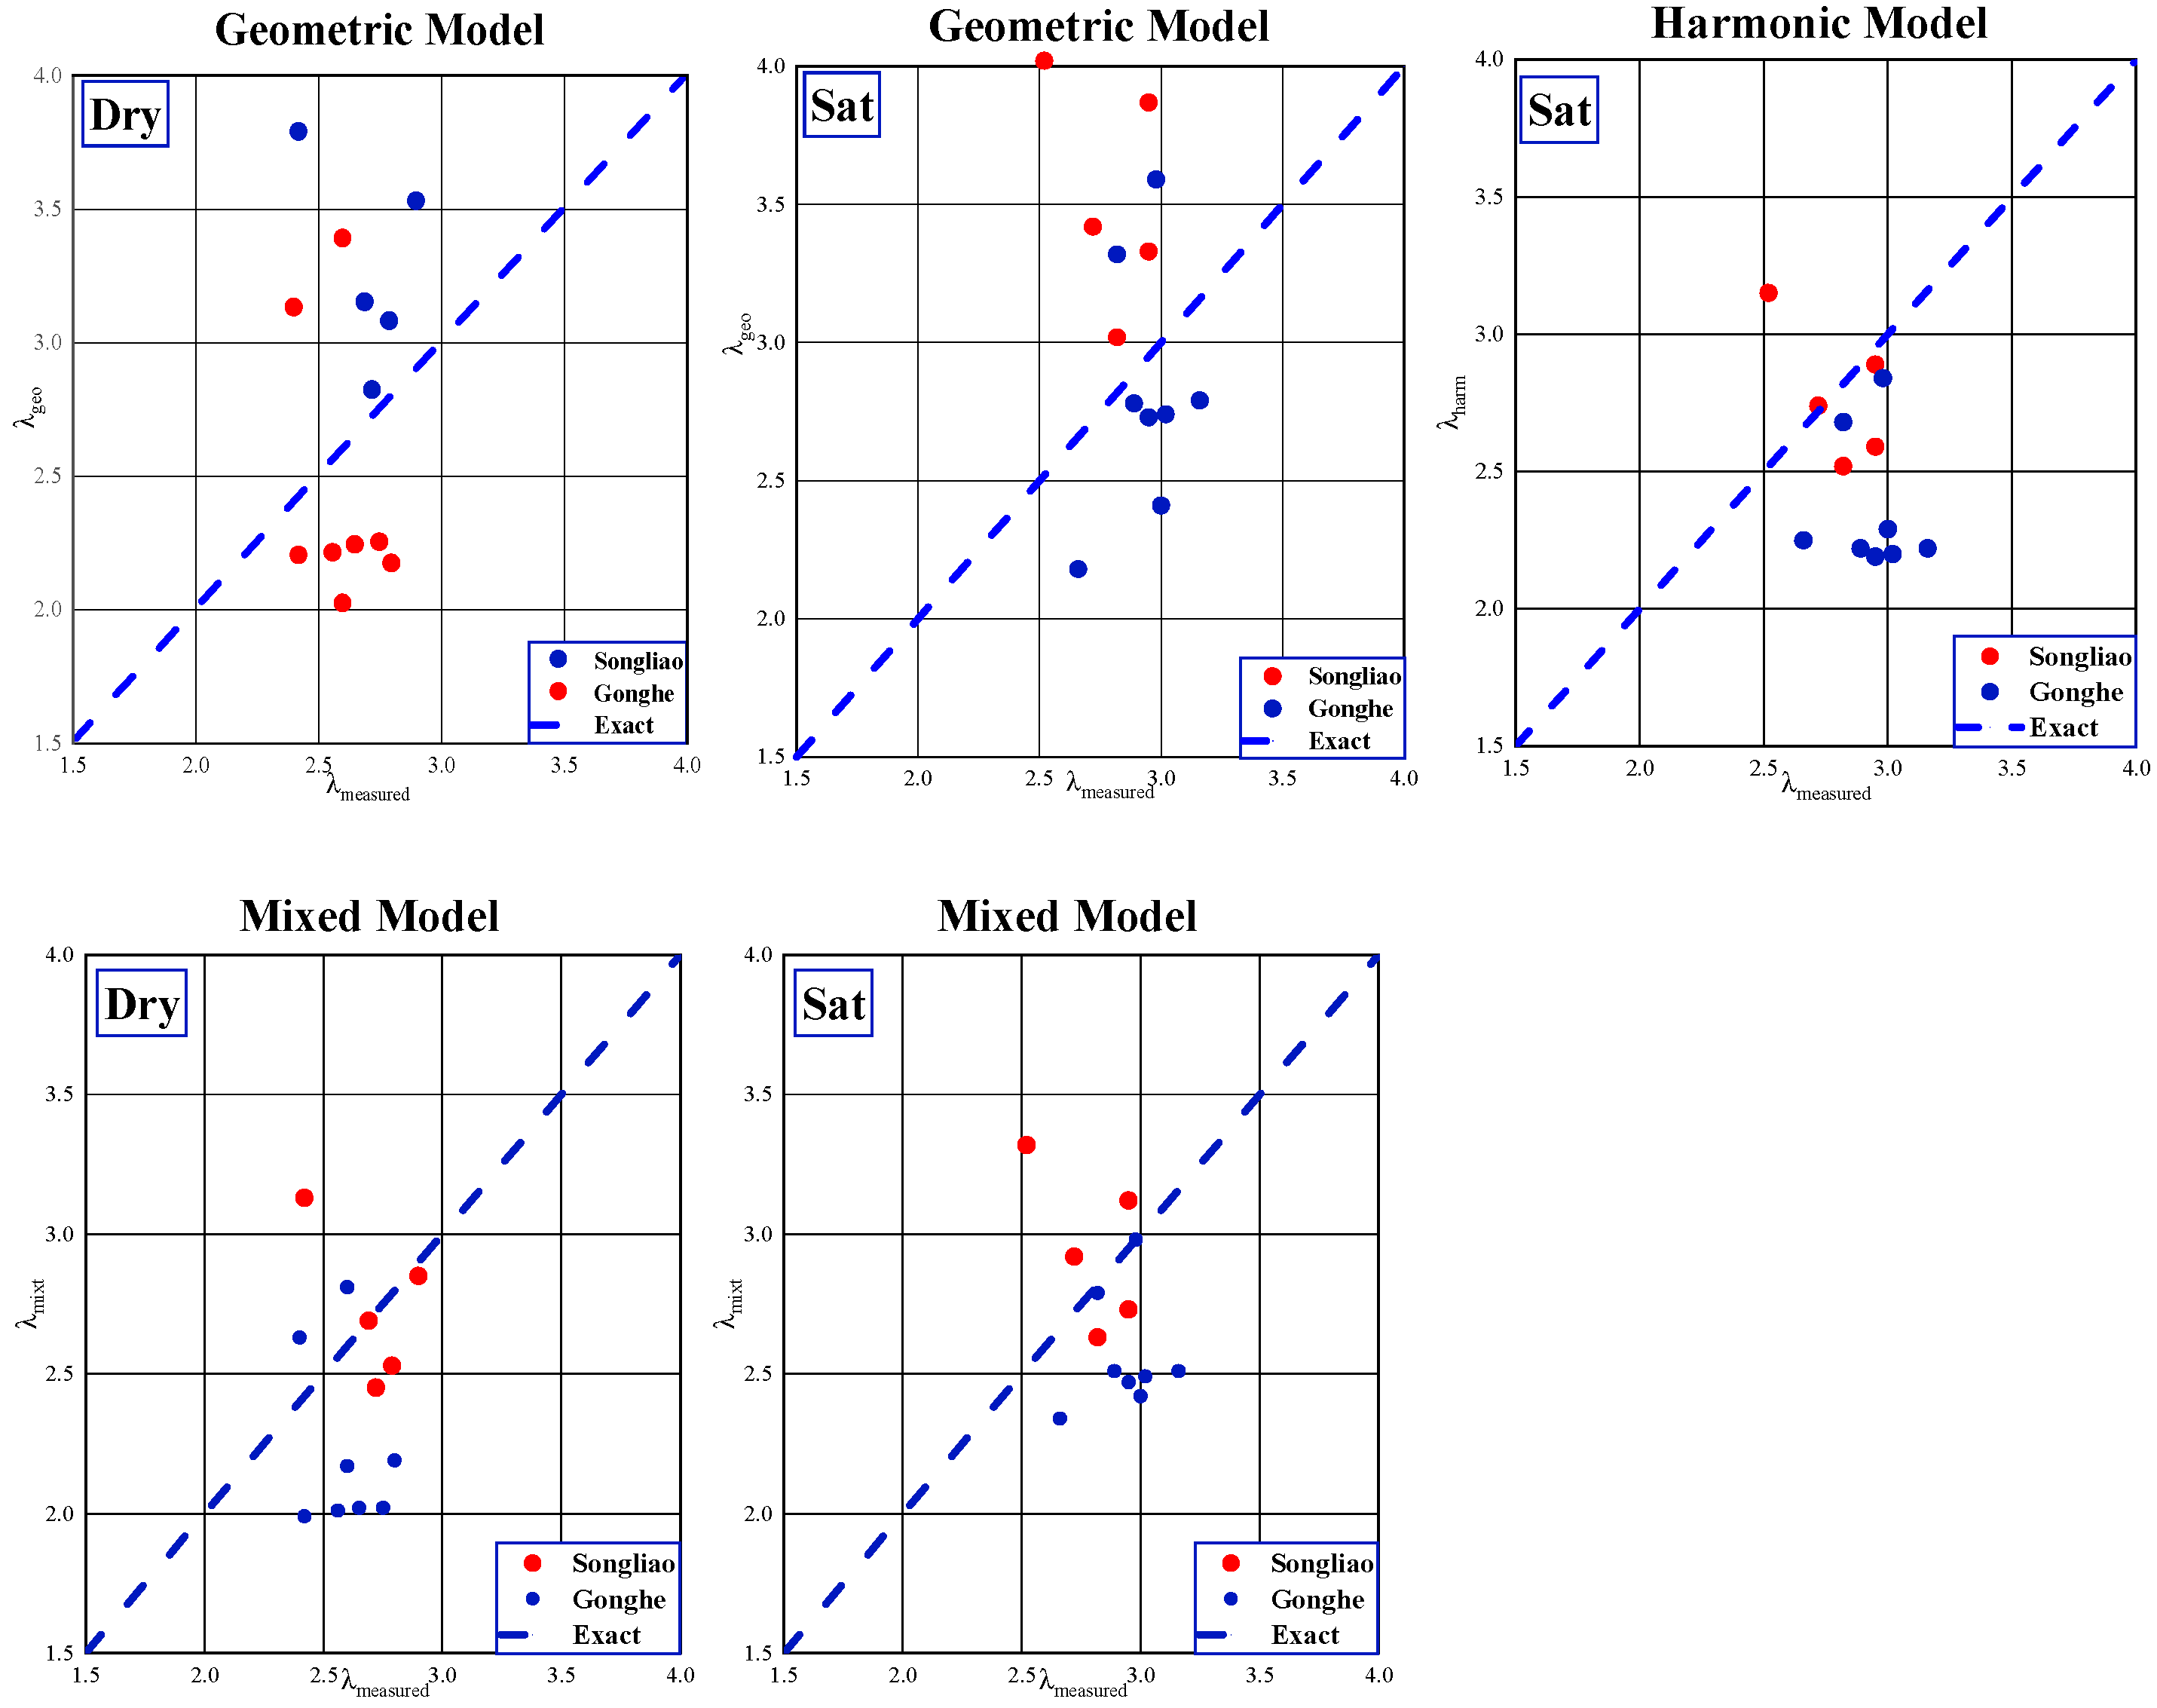
In the dry/saturated state, the comparison of Geometric Model, Harmonic Model, and Mixed Model shows that the distance between the sample points of Mixed Model and the line is more concentrated (Figure 9). The calculated value of the Mixed Model is close to the measured value. For the Mixed Model, comparing the measured and calculated thermal conductivity values, the difference between them is 0.46 on average and 0.73 on maximum. It can be seen that the calculation accuracy is significantly improved compared with the previous models (Figure 9).
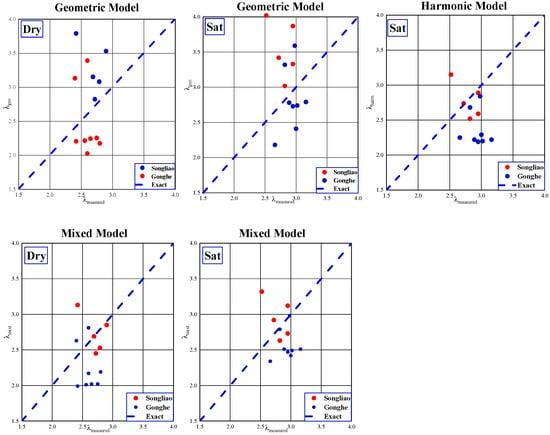
Figure 9.
Comparison of calculated and measured values of Geometric Model, Harmonic Model, and Mixed Model (in dry or saturated state).
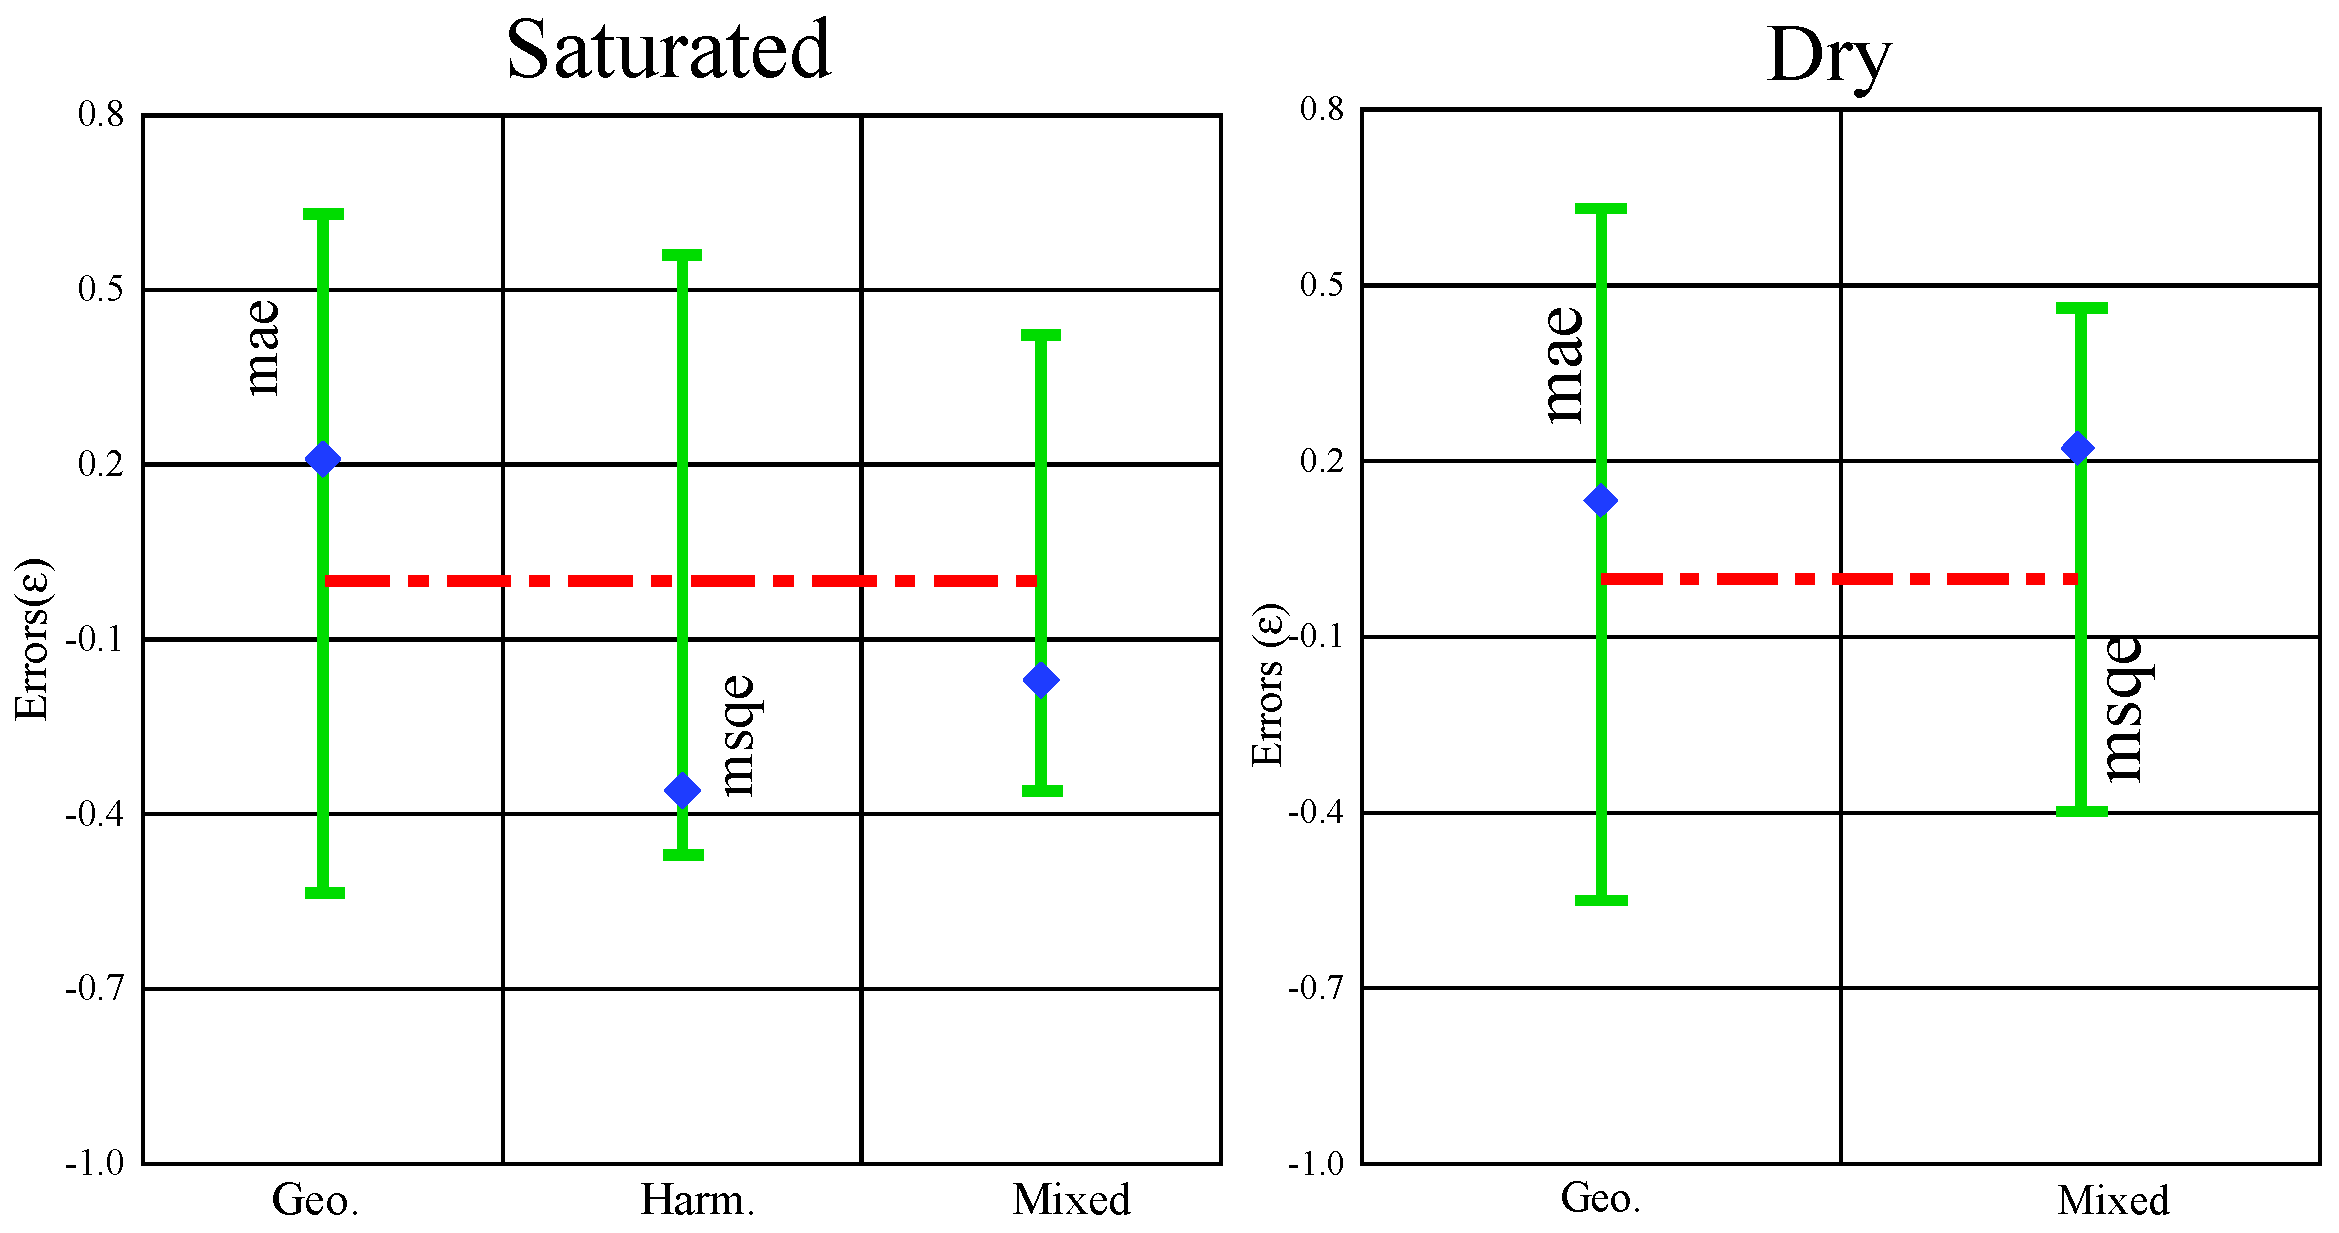
By comparing the errors of the three models in the dry/saturated state, it can be seen that the Mixed Model effectively reduces the calculation error, and the calculation of the thermal conductivity of the granite in the dry/saturated state is more accurate. Equations (6) and (7) can meet the requirements for the accuracy of calculating the thermal conductivity of rocks (Figure 10).
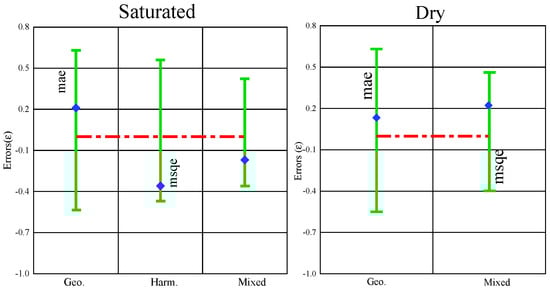
Figure 10.
Error comparison of Geometric Model, Harmonic Model, and Mixed Model (in dry or saturated state).
5. Conclusions
This article is based on the measurement and research of laboratory thermal conductivity and mineral content of granite samples from geothermal engineering in Songliao Basin and Gonghe Basin. In this paper, an empirical formula between mineral content and thermal conductivity of rocks is proposed to provide a relatively accurate model for calculating thermal conductivity for projects such as the development of thermal energy. The main conclusions are as follows:
- Minerals such as quartz and feldspar are the main components of granite. For different rock samples, the range of content variation is obvious. Affected by the different thermal conductivity of each mineral, the thermal conductivity of rocks differs greatly.
- There is a certain difference between the calculated value of the geometric mean model and the measured value, and the calculated value is large. When the porosity of the harmonic average model is small, it is relatively consistent. When the porosity is greater, the difference is greater. The calculated value is small overall.
- The harmonic average of mineral content is proposed to calculate the thermal conductivity of the framework. The dry or saturated thermal conductivity of granite uses the geometric average of the thermal conductivity of the skeleton and the thermal conductivity of the fluid or gas. By comparing the average relative errors of these three models, the calculated value of this model is the best fit with the measured value. The model satisfies the engineering accuracy requirements for thermal conductivity.
Author Contributions
Investigation: Methodology, Writing–original draft, X.Y.; Conceptualization, Supervision, Funding acquisition, Z.Y.; Supervision, Resources, Y.Z.; Validation, J.K.; Formal analysis, S.W.; Data curation, T.Y.; Writing–review and editing, P.G. All authors have read and agreed to the published version of the manuscript.
Funding
This study was supported by the Natural Science Foundation of China (grant numbers 42172274 and 41772238), the Scientific Research Project of Education Department of Jilin Province (JJKH20211109KJ), and the Engineering Research Center of Geothermal Resources Development Technology and Equipment, Ministry of Education, Jilin University.
Conflicts of Interest
The authors declare that they have no known competing financial interests or personal relationships that could have appeared to influence the work reported in this paper.
References
- Demırcı, A.; Görgülü, K.; Durutürk, Y. Thermal conductivity of rocks and its variation with uniaxial and triaxial stress. Int. J. Rock Mech. Min. Sci. 2004, 41, 1133–1138. [Google Scholar] [CrossRef]
- Cheng, W.-L.; Nian, Y.-L.; Li, T.-T.; Wang, C.-L. Estimation of oil reservoir thermal properties through temperature log data using inversion method. Energy 2013, 55, 1186–1195. [Google Scholar] [CrossRef]
- Gao, P.; Zhang, Y.; Yu, Z.; Fang, J.; Zhang, Q. Correlation study of shallow layer rock and soil thermal physical tests in laboratory and field. Geothermics 2015, 53, 508–516. [Google Scholar] [CrossRef]
- Schön, J. Physical Properties of Rocks: A Workbook; Elsevier: Amsterdam, The Netherlands, 2011; Volume 8. [Google Scholar]
- Keller, T.; Motschmann, U.; Engelhard, L. Modelling the poroelasticity of rocks and ice. Geophys. Prospect. 1999, 47, 509–526. [Google Scholar] [CrossRef]
- Aichlmayr, H.T.; Kulacki, F. The effective thermal conductivity of saturated porous media. Adv. Heat Transf. 2006, 39, 377–460. [Google Scholar]
- Tavman, I. Effective thermal conductivity of granular porous materials. Int. Commun. Heat Mass Transf. 1996, 23, 169–176. [Google Scholar] [CrossRef]
- Robertson, E.C.; Peck, D.L. Thermal conductivity of vesicular basalt from Hawaii. J. Geophys. Res. 1974, 79, 4875–4888. [Google Scholar] [CrossRef]
- El Sayed, A.M.A. Thermophysical study of sandstone reservoir rocks. J. Pet. Sci. Eng. 2011, 76, 138–147. [Google Scholar] [CrossRef]
- Walsh, J.; Decker, E. Effect of pressure and saturating fluid on the thermal conductivity of compact rock. J. Geophys. Res. 1966, 71, 3053–3061. [Google Scholar] [CrossRef]
- Schärli, U.; Rybach, L. On the thermal conductivity of low-porosity crystalline rocks. Tectonophysics 1984, 103, 307–313. [Google Scholar] [CrossRef]
- Cho, W.; Kwon, S.; Choi, J. The thermal conductivity for granite with various water contents. Eng. Geol. 2009, 107, 167–171. [Google Scholar] [CrossRef]
- Cho, W.-J.; Kwon, S. Estimation of the thermal properties for partially saturated granite. Eng. Geol. 2010, 115, 132–138. [Google Scholar] [CrossRef]
- Abid, M.; Hammerschmidt, U.; Köhler, J. Temperature and moisture dependent thermophysical properties of Sander sandstone. Int. J. Therm. Sci. 2014, 86, 88–94. [Google Scholar] [CrossRef]
- Clauser, C.; Huenges, E. Thermal conductivity of rocks and minerals. Rock Phys. Phase Relat. Handb. Phys. Constants 1995, 3, 105–126. [Google Scholar]
- Hartmann, A.; Rath, V.; Clauser, C. Thermal conductivity from core and well log data. Int. J. Rock Mech. Min. Sci. 2005, 42, 1042–1055. [Google Scholar] [CrossRef] [Green Version]
- Singh, T.; Sinha, S.; Singh, V. Prediction of thermal conductivity of rock through physico-mechanical properties. Build. Environ. 2007, 42, 146–155. [Google Scholar] [CrossRef]
- Gegenhuber, N.; Schoen, J. New approaches for the relationship between compressional wave velocity and thermal conductivity. J. Appl. Geophys. 2012, 76, 50–55. [Google Scholar] [CrossRef]
- Görgülü, K.; Durutürk, Y.; Demirci, A.; Poyraz, B. Influences of uniaxial stress and moisture content on the thermal conductivity of rocks. Int. J. Rock Mech. Min. Sci. 2008, 45, 1439–1445. [Google Scholar] [CrossRef]
- Merriam, R.; Rieke, H.H., III; Kim, Y.C. Tensile strength related to mineralogy and texture of some granitic rocks. Eng. Geol. 1970, 4, 155–160. [Google Scholar] [CrossRef]
- Ersoy, A.; Waller, M. Textural characterisation of rocks. Eng. Geol. 1995, 39, 123–136. [Google Scholar] [CrossRef]
- Zhang, W.; Sun, Q.; Hao, S.; Geng, J.; Lv, C. Experimental study on the variation of physical and mechanical properties of rock after high temperature treatment. Appl. Therm. Eng. 2016, 98, 1297–1304. [Google Scholar] [CrossRef]
- Li, H.; Li, H.; Wang, K.; Liu, C. Effect of rock composition microstructure and pore characteristics on its rock mechanics properties. Int. J. Min. Sci. Technol. 2018, 28, 303–308. [Google Scholar] [CrossRef]
- Tuğrul, A.; Zarif, I. Correlation of mineralogical and textural characteristics with engineering properties of selected granitic rocks from Turkey. Eng. Geol. 1999, 51, 303–317. [Google Scholar] [CrossRef]
- Fuchs, S.; Förster, A. Rock thermal conductivity of Mesozoic geothermal aquifers in the Northeast German Basin. Geochemistry 2010, 70, 13–22. [Google Scholar] [CrossRef] [Green Version]
- Gao, J.; Zhang, H.J.; Zhang, S.Q.; Chen, X.B.; Cheng, Z.P.; Jia, X.F.; Li, S.T.; Fu, L.; Gao, L.; Xin, H.L. Three-dimensional magnetotelluric imaging of the geothermal system beneath the Gonghe Basin, Northeast Tibetan Plateau. Geothermics 2018, 76, 15–25. [Google Scholar] [CrossRef]
- Kang, J.; Yu, Z.; Wu, S.; Zhang, Y.; Gao, P. Feasibility analysis of extreme learning machine for predicting thermal conductivity of rocks. Environ. Earth Sci. 2021, 80, 455. [Google Scholar] [CrossRef]
- Popov, Y.; Beardsmore, G.; Clauser, C.; Roy, S. Isrm suggested methods for determining thermal properties of rocks from laboratory tests at atmospheric pressure. Rock Mech. Rock Eng. 2016, 49, 4179–4207. [Google Scholar] [CrossRef]
- Wu, S.; Yu, Z.; Kang, J.; Zhang, Y.; Gao, P. Research on the anisotropy of thermal conductivity of rocks in songliao basin, china. Renew. Energy 2021, 179, 593–603. [Google Scholar] [CrossRef]
- Guo, P.; Bu, M.; He, M.; Wang, Y. Experimental investigation on thermal conductivity of clay-bearing sandstone subjected to different treatment processes: Drying, wetting and drying II. Geothermics 2020, 88, 101909. [Google Scholar] [CrossRef]
- Horai, K. Thermal conductivity of rock-forming minerals. J. Geophys. Res. 1971, 76, 1278–1308. [Google Scholar] [CrossRef]
- Fuchs, S.; Balling, N.; Förster, A. Calculation of thermal conductivity, thermal diffusivity and specific heat capacity of sedimentary rocks using petrophysical well logs. Geophys. J. Int. 2015, 203, 1977–2000. [Google Scholar] [CrossRef] [Green Version]
- Chopra, N.; Ray, L.; Satyanarayanan, M.; Elangovan, R. Evaluate best-mixing model for estimating thermal conductivity for granitoids from mineralogy: A case study for the granitoids of the Bundelkhand craton, central India. Geothermics 2018, 75, 1–14. [Google Scholar] [CrossRef]

Publisher’s Note: MDPI stays neutral with regard to jurisdictional claims in published maps and institutional affiliations. |
© 2022 by the authors. Licensee MDPI, Basel, Switzerland. This article is an open access article distributed under the terms and conditions of the Creative Commons Attribution (CC BY) license (https://creativecommons.org/licenses/by/4.0/).