Article

Recrystallisation and Trace-Element Mobility in Zircons: Implications for U-Pb Dating

1
Faculty of Geosciences, Utrecht University, 3584 CB Utrecht, The Netherlands
2
Department of Geological Sciences, University of Saskatchewan, Saskatoon, SK S7N 5E2, Canada
*
Author to whom correspondence should be addressed.
Minerals 2022, 12(12), 1489; https://doi.org/10.3390/min12121489
Submission received: 18 October 2022 / Revised: 4 November 2022 / Accepted: 8 November 2022 / Published: 23 November 2022
(This article belongs to the Section Mineral Geochemistry and Geochronology)

Abstract

:
Complex microstructures of zircon recrystallisation have been discovered in igneous and metamorphic zircons from the Jack Hills Metasedimentary Belt in Western Australia, and the granitic injection complex of Harris in north-west Scotland. Cathodoluminescence (CL), electron backscatter diffraction (EBSD) and wavelength dispersive spectroscopy (WDS) analysis reveal that recrystallisation in the studied zircons is often characterised by (1) translation, bending and fading of the oscillatory zoning; (2) structural recovery of the zircon; (3) an enrichment in Hf and depletion in Y in recrystallised zircon; and (4) the formation of a recrystallisation interface with a minor (<2°) misorientation. A new, composite recrystallisation model in which trace element and dislocation migration occurs shortly after crystallisation during magmatic cooling and pipe diffusion along dislocation arrays formed by the accumulation of dislocations allows enhanced diffusion to enrich Hf and leach U, Pb and Y. After the recrystallisation event, subsequent metamictization of primary zircon (typically with oscillatory zoning) creates zones that can structurally recover through a diffusion-reaction re-equilibration mechanism, resulting in further trace-element mobility. These mechanisms can create complex microstructures in zircons, suggesting that a detailed understanding of the crystallisation and recrystallisation history of a zircon may be required to accurately interpret its U-Pb ages.

1. Introduction

In geochronological studies, zircons (ZrSiO4) are widely used to constrain the timing of geological processes because of their ubiquitous presence in various geological settings, their ability to naturally incorporate trace quantities of rare earth elements (REE), Y, Ti, Hf and radionuclides such as U and Th, and their resistance to physical and chemical weathering. Despite their robustness under a range of geological conditions, various studies have shown that zircons can recrystallise, which is typically reflected by the replacement of zoned with unzoned zircon [1,2,3,4]. Pidgeon [2] was the first to describe this alteration of the oscillatory zoning in zircons, and characterised three different replacement microstructures: transitional replacement, transgressive replacement, and convolute zoning, all formed as the result of solid-state recrystallisation. Although trace-element solid-state diffusion rates in zircon are general very slow (e.g., [5]), it is widely recognised that trace-element compositions in zircons may be modified by a number of different processes associated with zircon recrystallisation. The effect of recrystallisation on the trace-element distribution and U-Pb ages in zircon is, however, not well known. Pidgeon [2] has shown that U, Th and Pb concentrations in recrystallised zircon are lower compared to primary zoned zircon implying a discordant age in the recrystallised domain, whereas studies have also shown that U-Pb ages of recrystallised domains can be indistinguishable from primary growth zones [6,7,8].
To understand the link between recrystallisation microstructures and trace-element redistribution in zircons, it is important to understand the possible mechanisms of recrystallisation in zircon. The complex nature of zircon recrystallisation found in numerous studies has led to many models: (1) dry thermal annealing of metamict zircon in which amorphized zircon structurally recovers via thermal heating [9]; (2) diffusion-reaction-re-equilibration associated with the infiltration of an aqueous solution in the metamict zircon which drives the growth kinetics of the reaction-recrystallisation front and facilitates the redistribution of trace elements [10,11]; (3) annealing of lattice strain in which the incorporation of trace elements causes lattice strain which is then susceptible to recrystallisation via exclusion and homogenisation of the trace elements [1,2]; (4) crystal-plastic deformation-enhanced diffusion along fast-diffusion pathways such as low-angle boundaries, dislocations, dislocation pipes, and creep cavitation-induced porosity [12,13,14,15,16,17]; and (5) interface-coupled dissolution-reprecipitation which simultaneously dissolves trace-element-rich zircons and precipitates pure zircon and additional trace-element-rich inclusions along a migrating interface [4,10]. Any (or potentially any combination) of these re-equilibration processes can be responsible for the loss and gain of trace elements in the zircon lattice as well as the commonly observed secondary microstructures in zircons [10].
Many studies have shown that the recrystallisation microstructures in zircon can be readily identified by etching and cathodoluminescence (CL) [1,2,11]. However, the relationship between microstructures, compositional variations and processes of trace-element mobility remains enigmatic, and is the focus of this study.

2. Geologic Background and Prior Sample Characterization

Zircon grains analysed in this study are from an Archean granite (W34) and a porphyritic granitic gneiss (W65) from the Jack Hills in Australia [2,18] and the Harris Granite (RC12), originating from the Laxfordian orogeny, in northwest Scotland [19].
W34 and W65 are zircons from the Jack Hills Metasedimetary Belt in the NW Yilgarn Craton of Western Australia with lithologies ranging from highly deformed gneisses to relatively undeformed granites. Recrystallisation microstructures of W34 zircons in this study have been described as irregularly distributed unetched patches forming both transitional and transgressive boundaries. Recrystallisation is either concentrated in the centres of the zircons as well as toward the margins. The anhedral form has occurred as the result of relocation of zircon during recrystallisation. Pidgeon [2] measured the U-Pb ages of both zoned and unzoned zircon from samples of W34. 207Pb/206Pb ages fall between 2.312–2.644 Ga (zoned zircon, strongly discordant) and 2.630–2.687 Ga (unzoned zircon, nearly concordant). The zoned and unzoned data points all fall on a single discordia, indicating a single-stage discordance history. The upper intersection age reflects the crystallization age, whereas for the lower intersection age of ca. 980 Ma, there is no known geological event responsible for the discordance in the zircons [2]. W65 zircons show a large variation in recrystallisation including completely recrystallised unzoned zircon, recrystallisation at the outer margins and zoned cores surrounded by unzoned rims. Similar to W34 zircons, the euhedral shape has been lost as the result of material transfer during recrystallisation. The W65 zircons differ from the W34 zircons as they do not clearly show intruding patches of unzoned zircon, but rather have unzoned cores or rims of zircons [18]. U-Pb dating of the cores and rims of the zircons yielded 207Pb/206Pb ages ranging from 2.7 to 3.7 Ga. Pidgeon and Wilde [18] suggest that the age of 3.7 Ga may reflect the age of the igneous protolith, and a grouping of zircon 207Pb/206Pb ages near 3.2 Ga may indicate a significant age in the history of the rock. However, they concluded that the U-Pb system is extremely complex and reflected multiple disturbances and formation events too complex to be resolved by a conventional multigrain zircon U-Pb study [18]
RC12 are zircons from the granitic injection complex of Harris on the Island of Harris-Lewis, Outer Hebrides, NW Scotland. The granitic complex has an igneous coarse-grained nature without significant petrological evidence for a metamorphic event. The zircons are described as rounded, zoned, and possessing outgrowths and central cores and are concluded to have almost completely crystallised during granite formation. The 207Pb/206Pb apparent ages of RC12 fall within a range of 1.715 ± 0.015 Ga. The ages are slightly discordant indicating a slightly open system with some lead loss after crystallisation [19]. Further documentation on the nature and geologic setting of the three sample sets can be found in [2,18,19].

3. Materials and Methods

3.1. Sample Preparation

Separated zircon crystals used in this study have been kindly provided by R.T. Pidgeon to J.K.W. Lee. One-inch diameter epoxy grain mounts of zircon crystals were prepared at the geotechnical lab at the Vrije Universiteit (VU) in Amsterdam. A total of 84 W34 grains, 55 W65 grains and 149 RC12 grains were placed on three different mounts. Geological Survey of Canada zircon reference standards were placed in between the zircon samples in each of the grain mounts; these included groups of 20–25 grains of standards 1242 (2674.2 & 2679.8 Ma [20]) and 9910 (441.2 ± 0.4 Ma; Davis & McNicoll, unpublished data, as cited in [21,22]) and groups of 3–4 grains of the additional reference standards Temora 2 (416.78 ± 0.33 Ma [23]) and 6266 (559.0 ± 0.2 Ma; [24]) Grain mounts were polished with successively finer diamond paste to produce a very fine polish and expose the interior cross-sections of the zircon crystals. The samples were polished with colloidal silica (Syton) for 10–20 min before CL analysis. Prior to EBSD analysis, a new Syton polish was applied for two hours, and a new carbon coat was applied to minimize drifting of the electron beam.

3.2. Electron Microscopy (CL, EBSD, FSE) & Microprobe (EMP)

All electron microscope and microprobe analyses were conducted at the Electron Microscopy Center and GeoLab at Utrecht University. The majority of the zircon grains were first characterized using panchromatic cathodoluminescence (CL) imaging, obtained with a Zeiss Gemini 450 variable pressure scanning electron microscope operated at 30 Pa, and a Delmic SPARC Compact cathodoluminescence detector. Images were obtained using a 10 kV acceleration voltage, 2–10 nA probe current, 5.1–15.3 µs dwell time and a working distance of 13.7 mm.
A selection of grains containing recrystallisation microstructures were mapped with electron backscatter diffraction (EBSD) to characterize variations in crystallographic orientations across the zircon grains and recrystallisation interfaces. EBSD data were collected with the TFS Helios Nanolab G3 UC equipped with an Oxford Instruments Nordlys EBSD detector. SEM settings varied between 15–20 kV, 6.4–12 nA, 50 ms dwell time and a 0.5–1 µm step size was used to obtain the EBSD images. EBSD data were post-processed using AZtecCrystal software (v. 2.0, Oxford instruments, Abingdon, UK) to remove wild spikes and interpolate non-indexed points using 8, 7, 6 and occasionally 5 nearest neighbours. Band Contrast (BC) maps, roughly indicating the degree of crystallinity of the sample, were also used to qualitatively assess the pattern quality. In addition, forescatter electron (FSE) images were made of selected grains.
Electron microprobe (EMP) data were collected with a JEOL JXA-8530F Hyperprobe equipped with an xCLent IV CL system operated at 20 kV, 20 nA and a beam diameter of 1 µm. Zircon major, minor and selected trace elements were acquired using Probe for EPMA software (v. 12.9.4, Probe Software, Inc., Eugene, OR, USA), after calibration with barren MAC zircon (all elements <100 ppm except for 1.27 wt% HfO2) for Zr-la and Si-ka, and further calibration with homogeneous in-house synthetic and natural standards: HfO for Hf-la, KTiPO4 for P-ka, yttrium metal for Y-la, uraninite for U-ma, and ThO2 for Th-ma. Peak and background counting times were 20 s. An exponential background fit was utilized. Standards 6266 [25] and Temora 2 [23] were used as external standards during the session. Wavelength dispersive X-ray spectroscopy (WDS) was used to obtain both qualitative elemental maps as well as quantitative spot analyses of the aforementioned trace elements. To study the trace-element variation across zoned/unzoned interfaces, EMP spot measurements along traverses perpendicular to these interfaces were also conducted.

4. Results

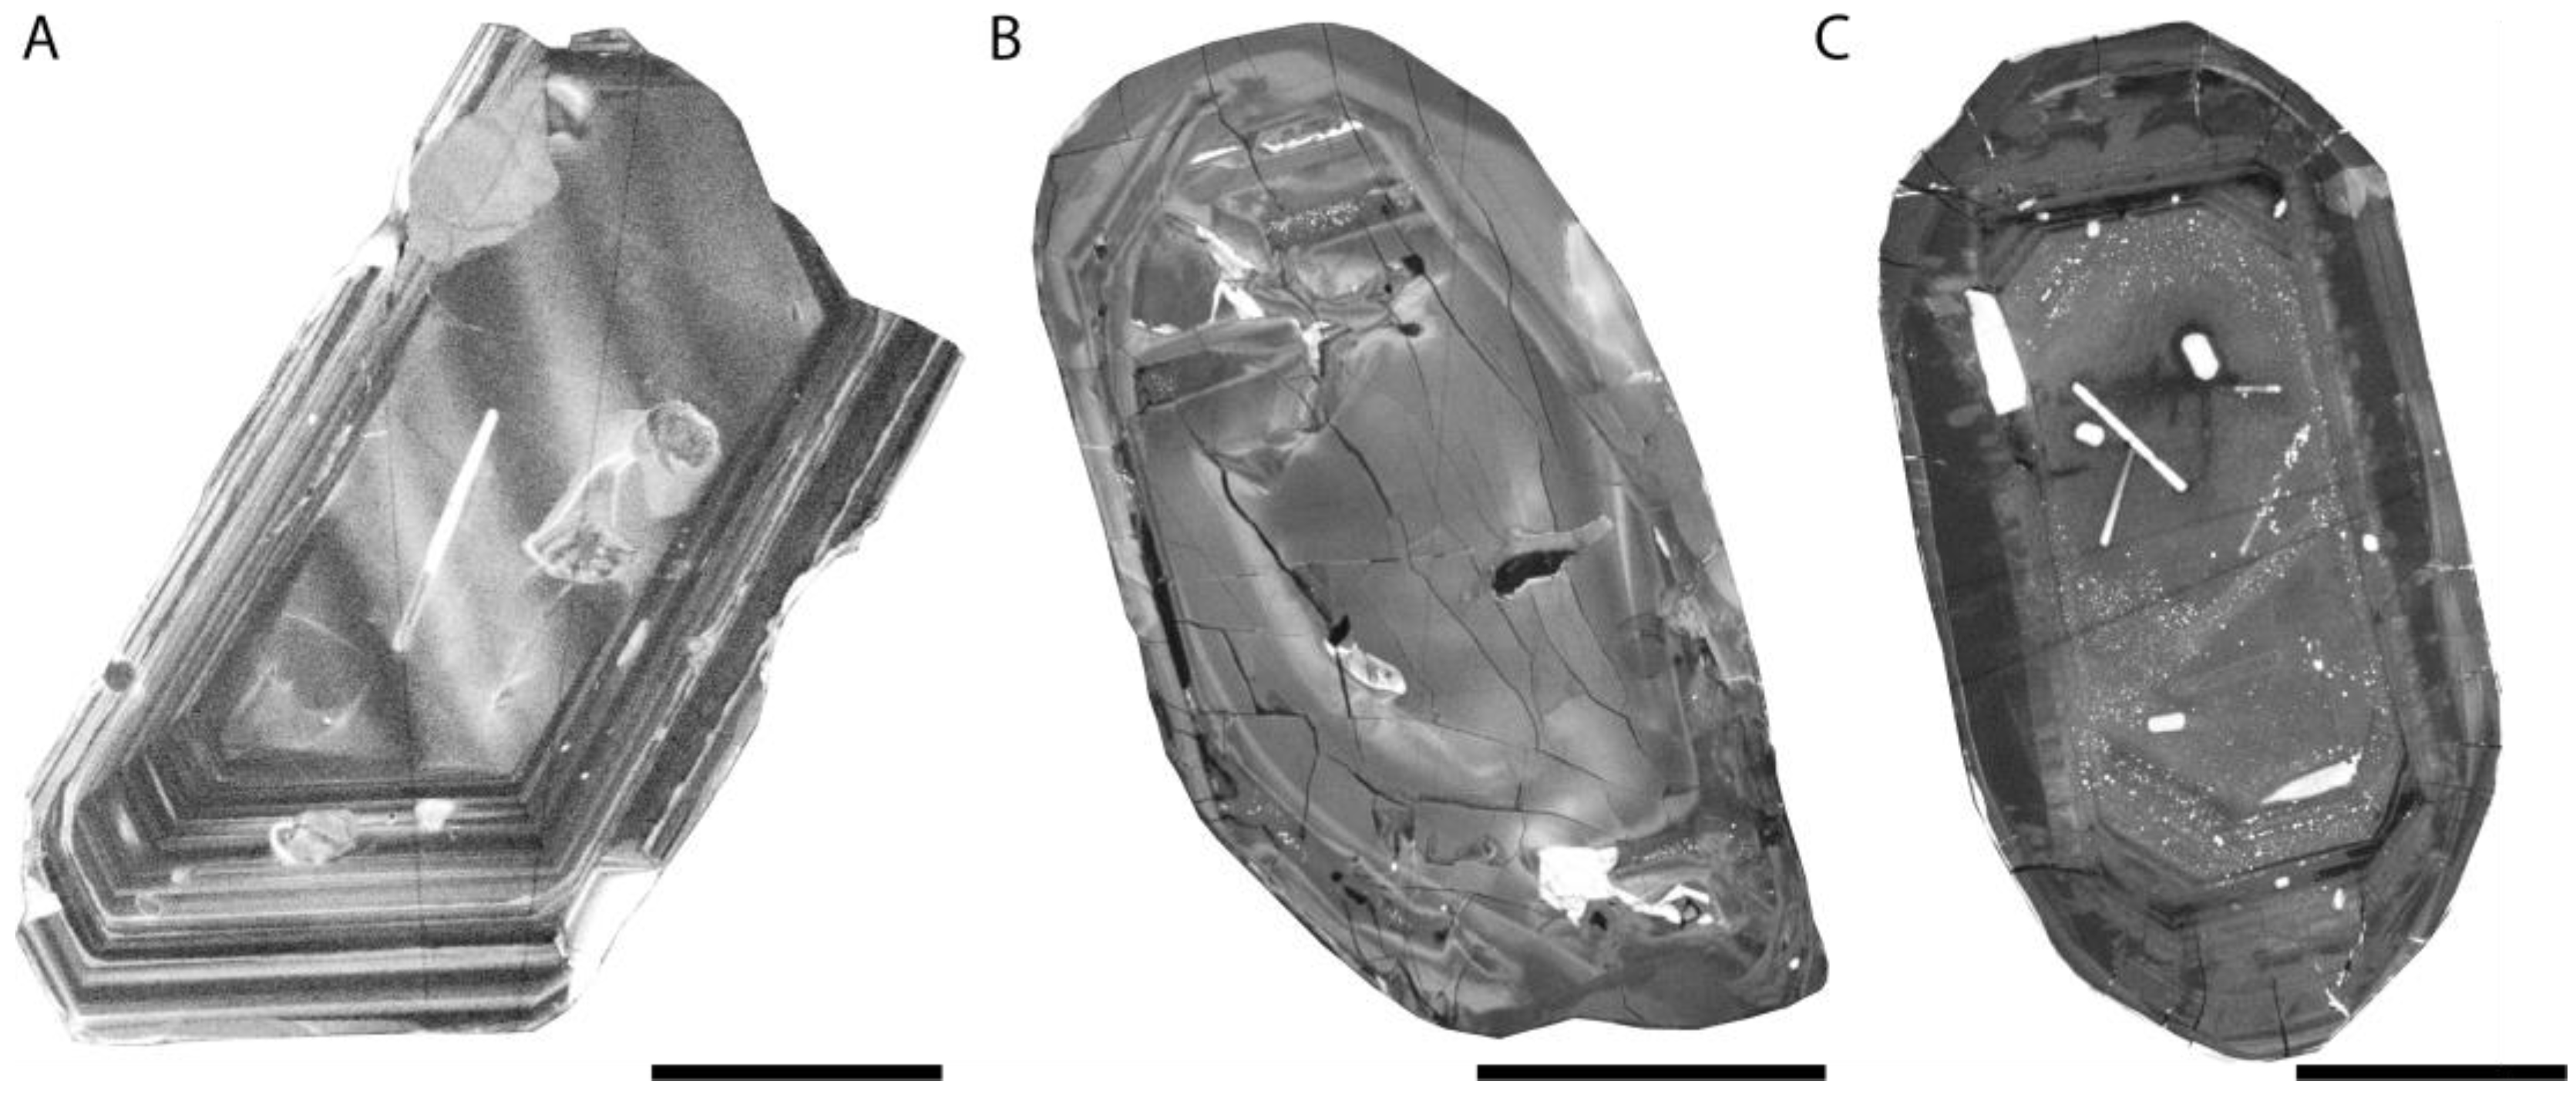
4.1. Zircon Morphology and Primary Structures

Zircons from all three localities have a light brown hue and are often broken, consisting only of fragments of the original grain. RC12 zircons are generally prismatic, with little to no rounding of the crystal shape whereas W65 consists of more and W34 of the most subhedral and anhedral grains. W65 zircons from the gneiss are generally smaller in size (150–200 µm) than the zircons from the granites (RC12: 150–360 µm, W34: 150–350 µm).
Cathodoluminescence imaging allows for a detailed characterization of the internal structures of the zircons. Both primary (oscillatory zoning) and secondary structures (convolute zoning and unzoned patches) are observed in samples from all three localities. The appearance of the primary oscillatory zoning varies between the samples: almost all RC12 zircons have a strongly developed, bimodal zoning (Figure 1A), whereas W34 and W65 zircons are generally composed of faint zoning with broader bands or no zoning at all (Figure 1B,C). Only a minority of the W34 and W65 grains show bimodal zoning. The oscillatory zoning is expressed as an alternation of CL bright and dark bands corresponding to BSE dark and bright bands respectively. Oscillatory zoning can also be recognized in the band contrast map and is therefore considered to be related to higher and lower degrees of crystallinity.
FSE images reveal several kinds of fractures in all the zircon samples. Fractures are generally radial or concentric in nature, consistent with the differential swelling of metamict zones of zircon [26]. Observed radial fractures are either confined to specific bands of oscillatory zoning or transect the entire grain, whereas concentric fractures generally form near the interface between oscillatory zoning and the (unzoned) grain core. The fractures often have a minor crystallographic misorientation as shown in EBSD maps (Figure 2). These misorientations should not be confused with similar-looking misorientations on the zoned/unzoned interface in the absence of fractures.

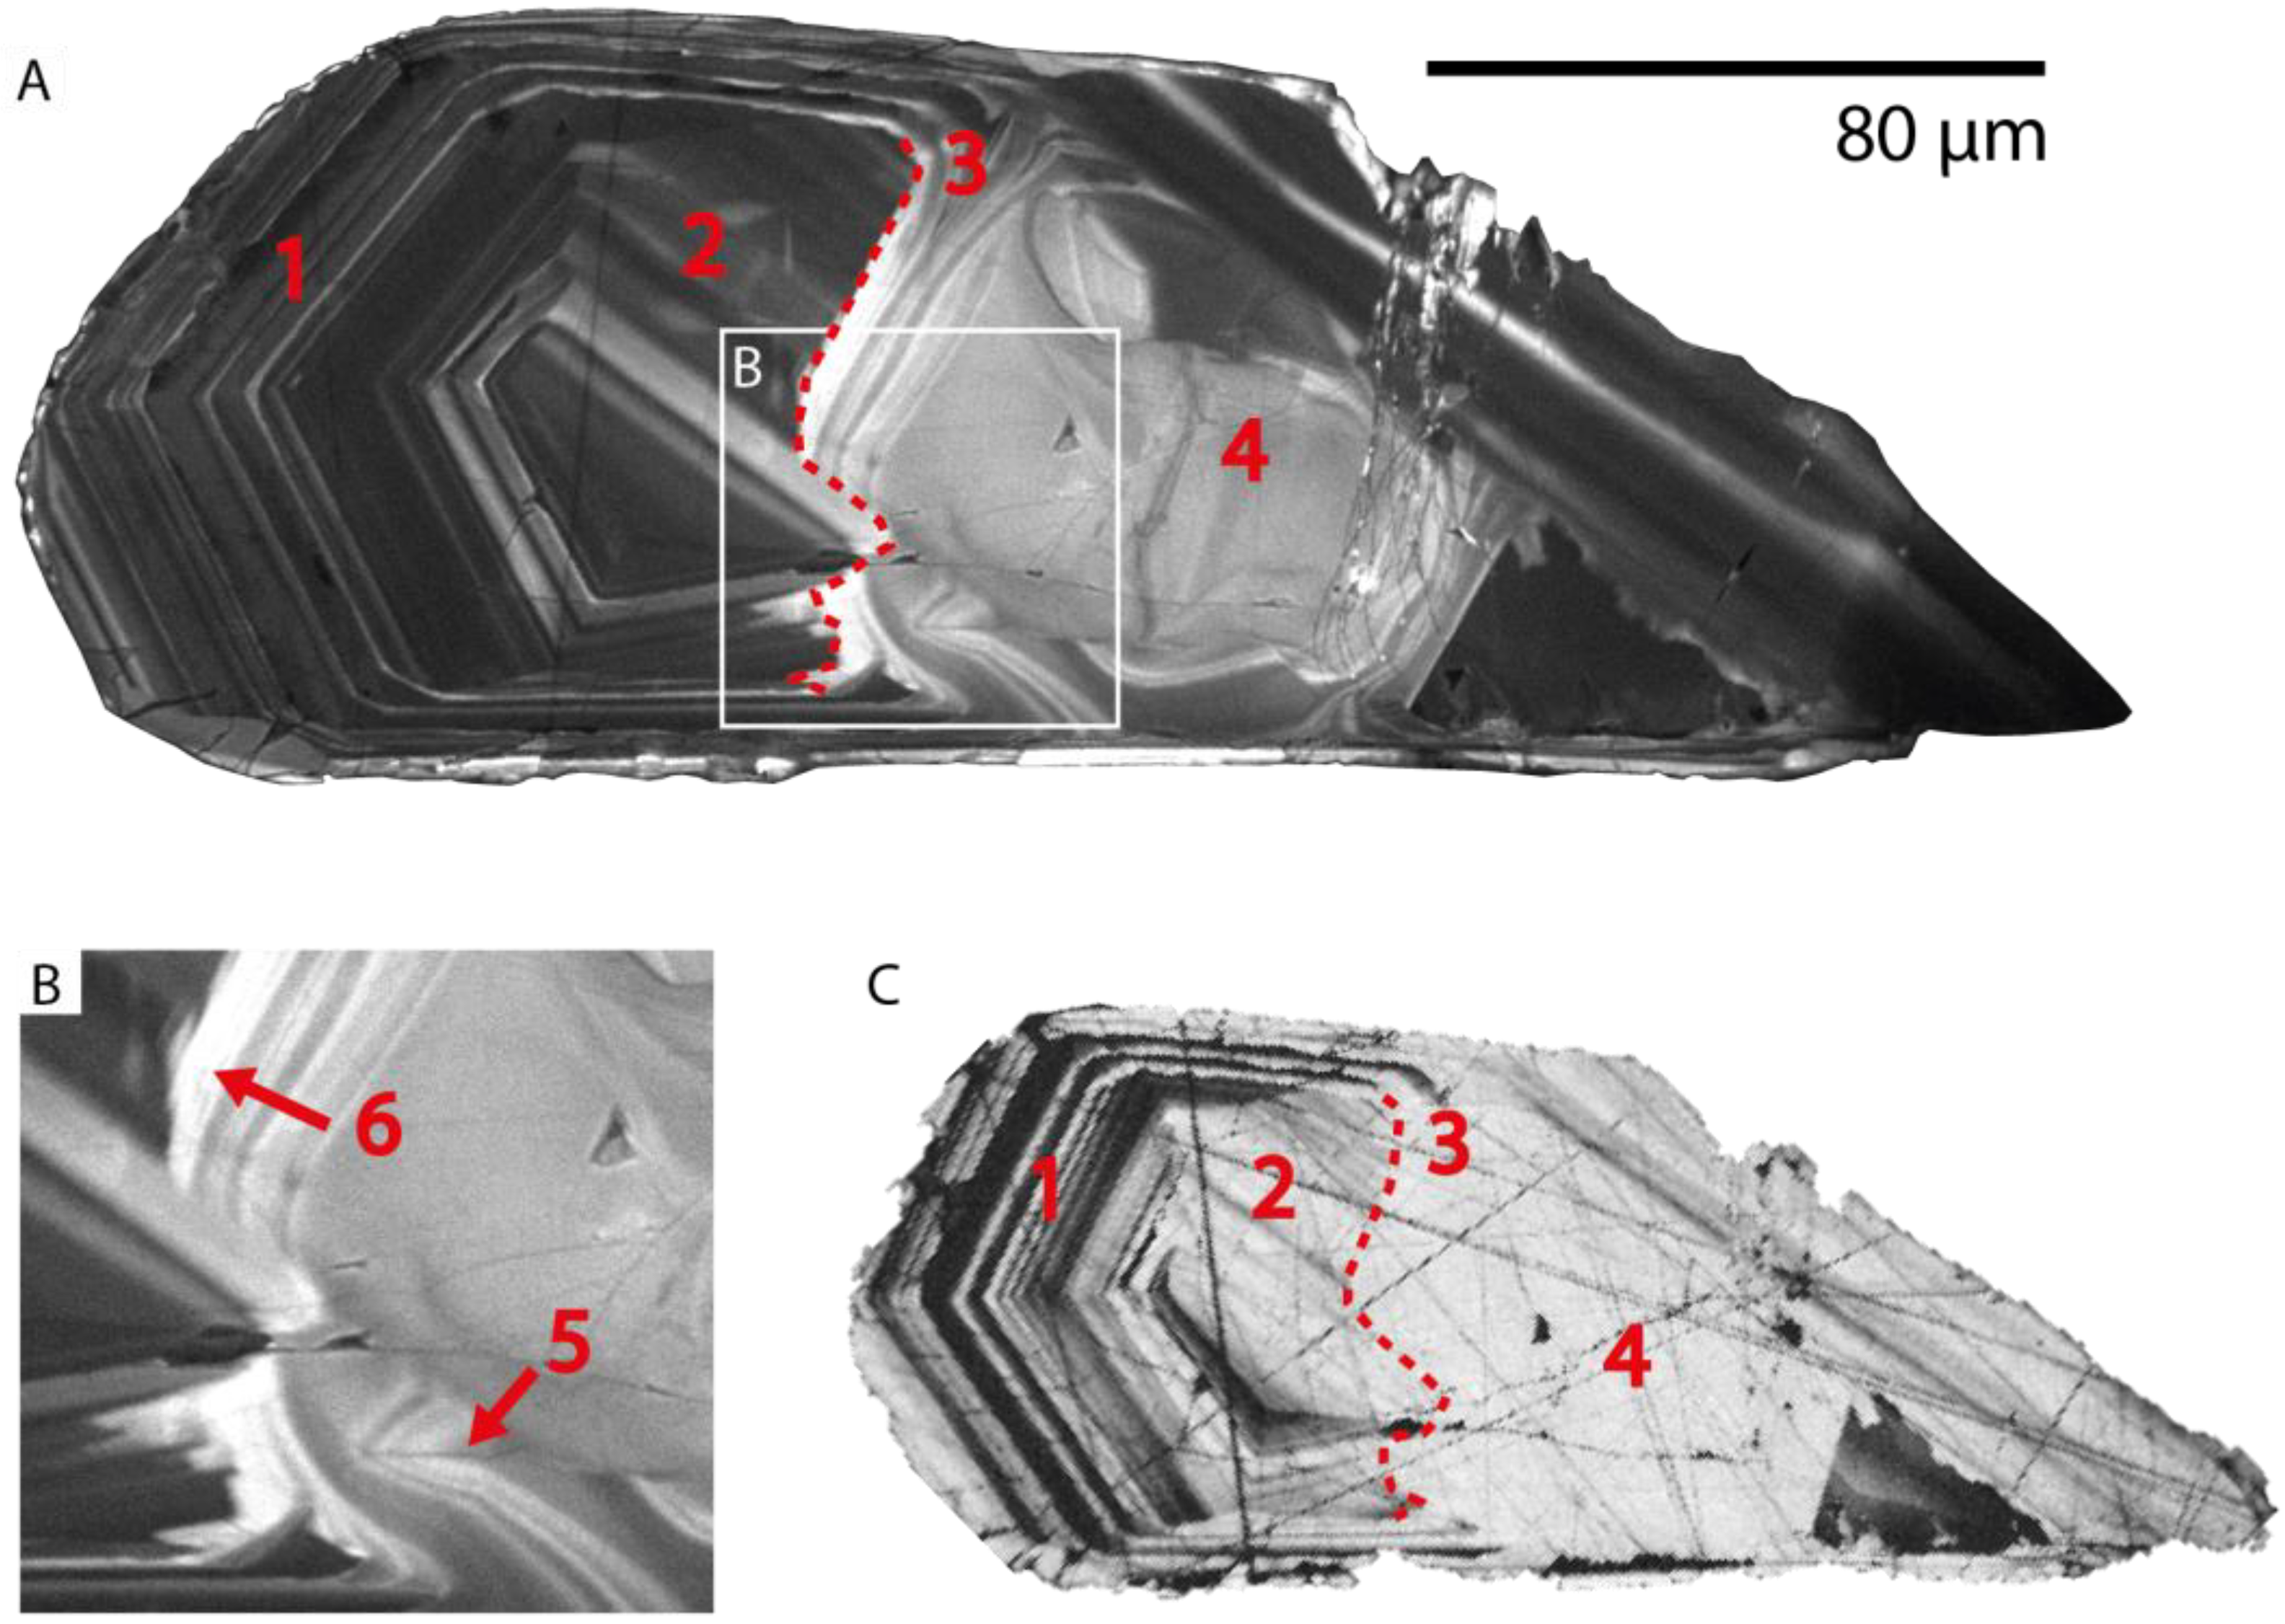
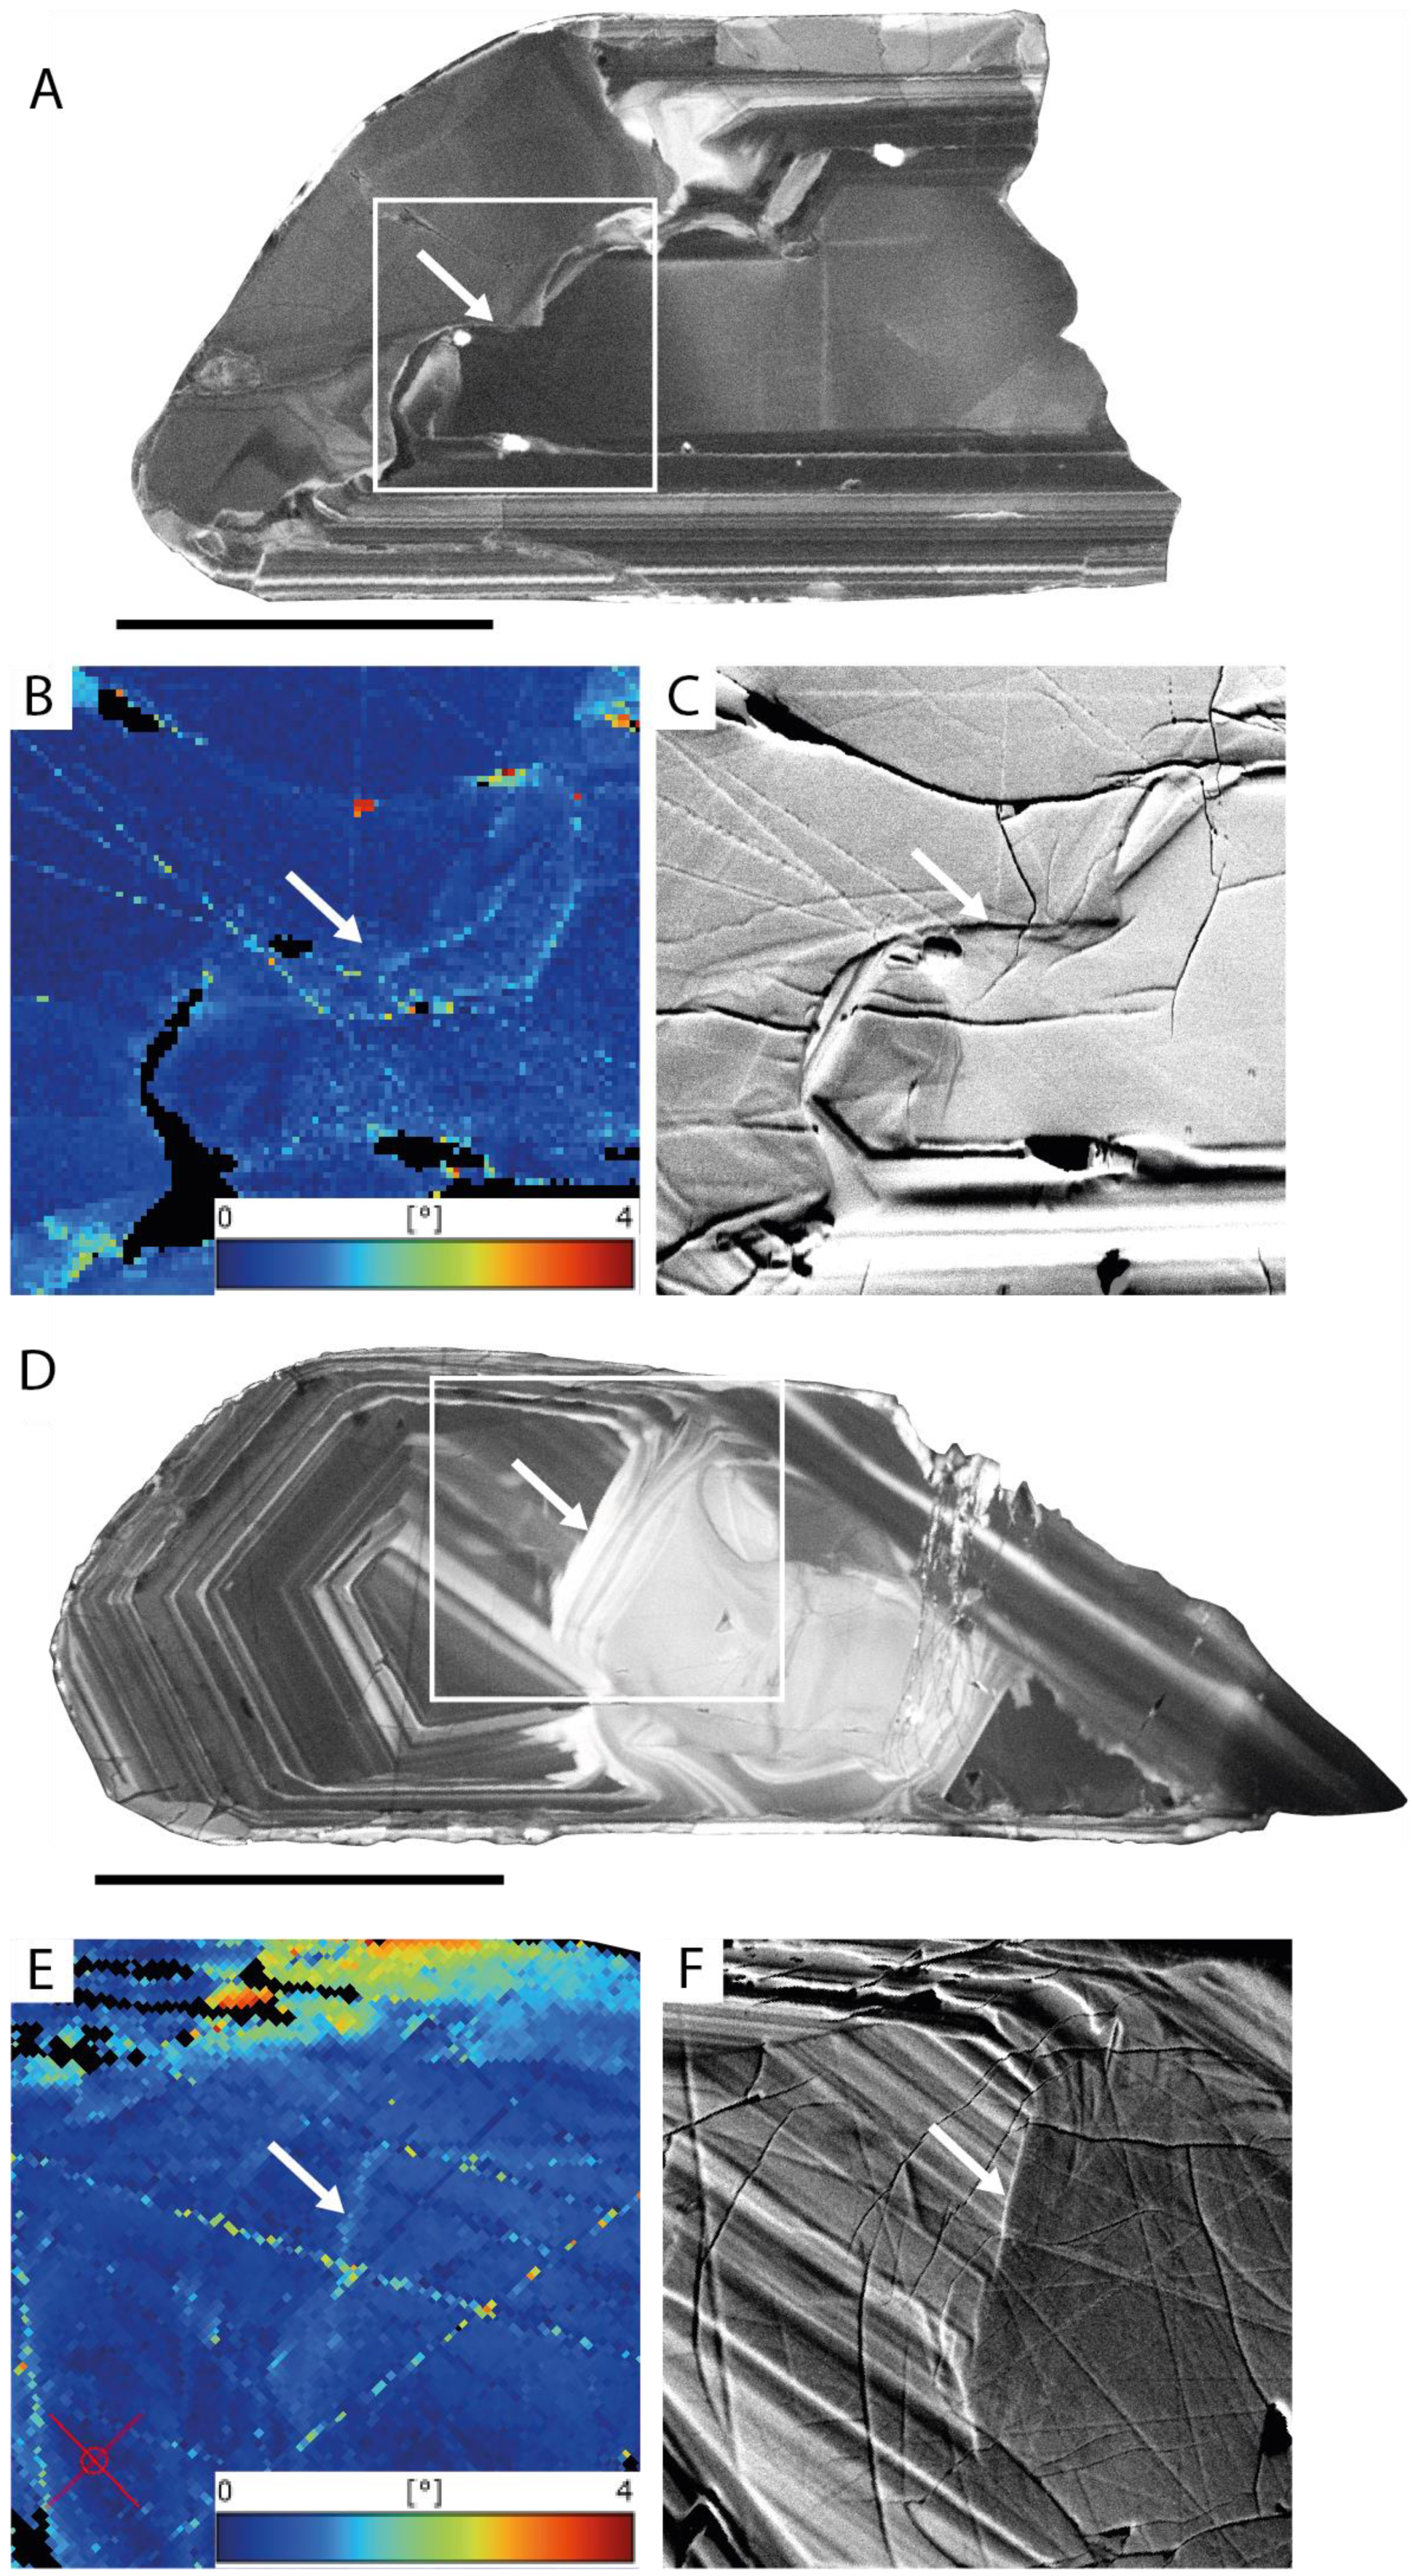
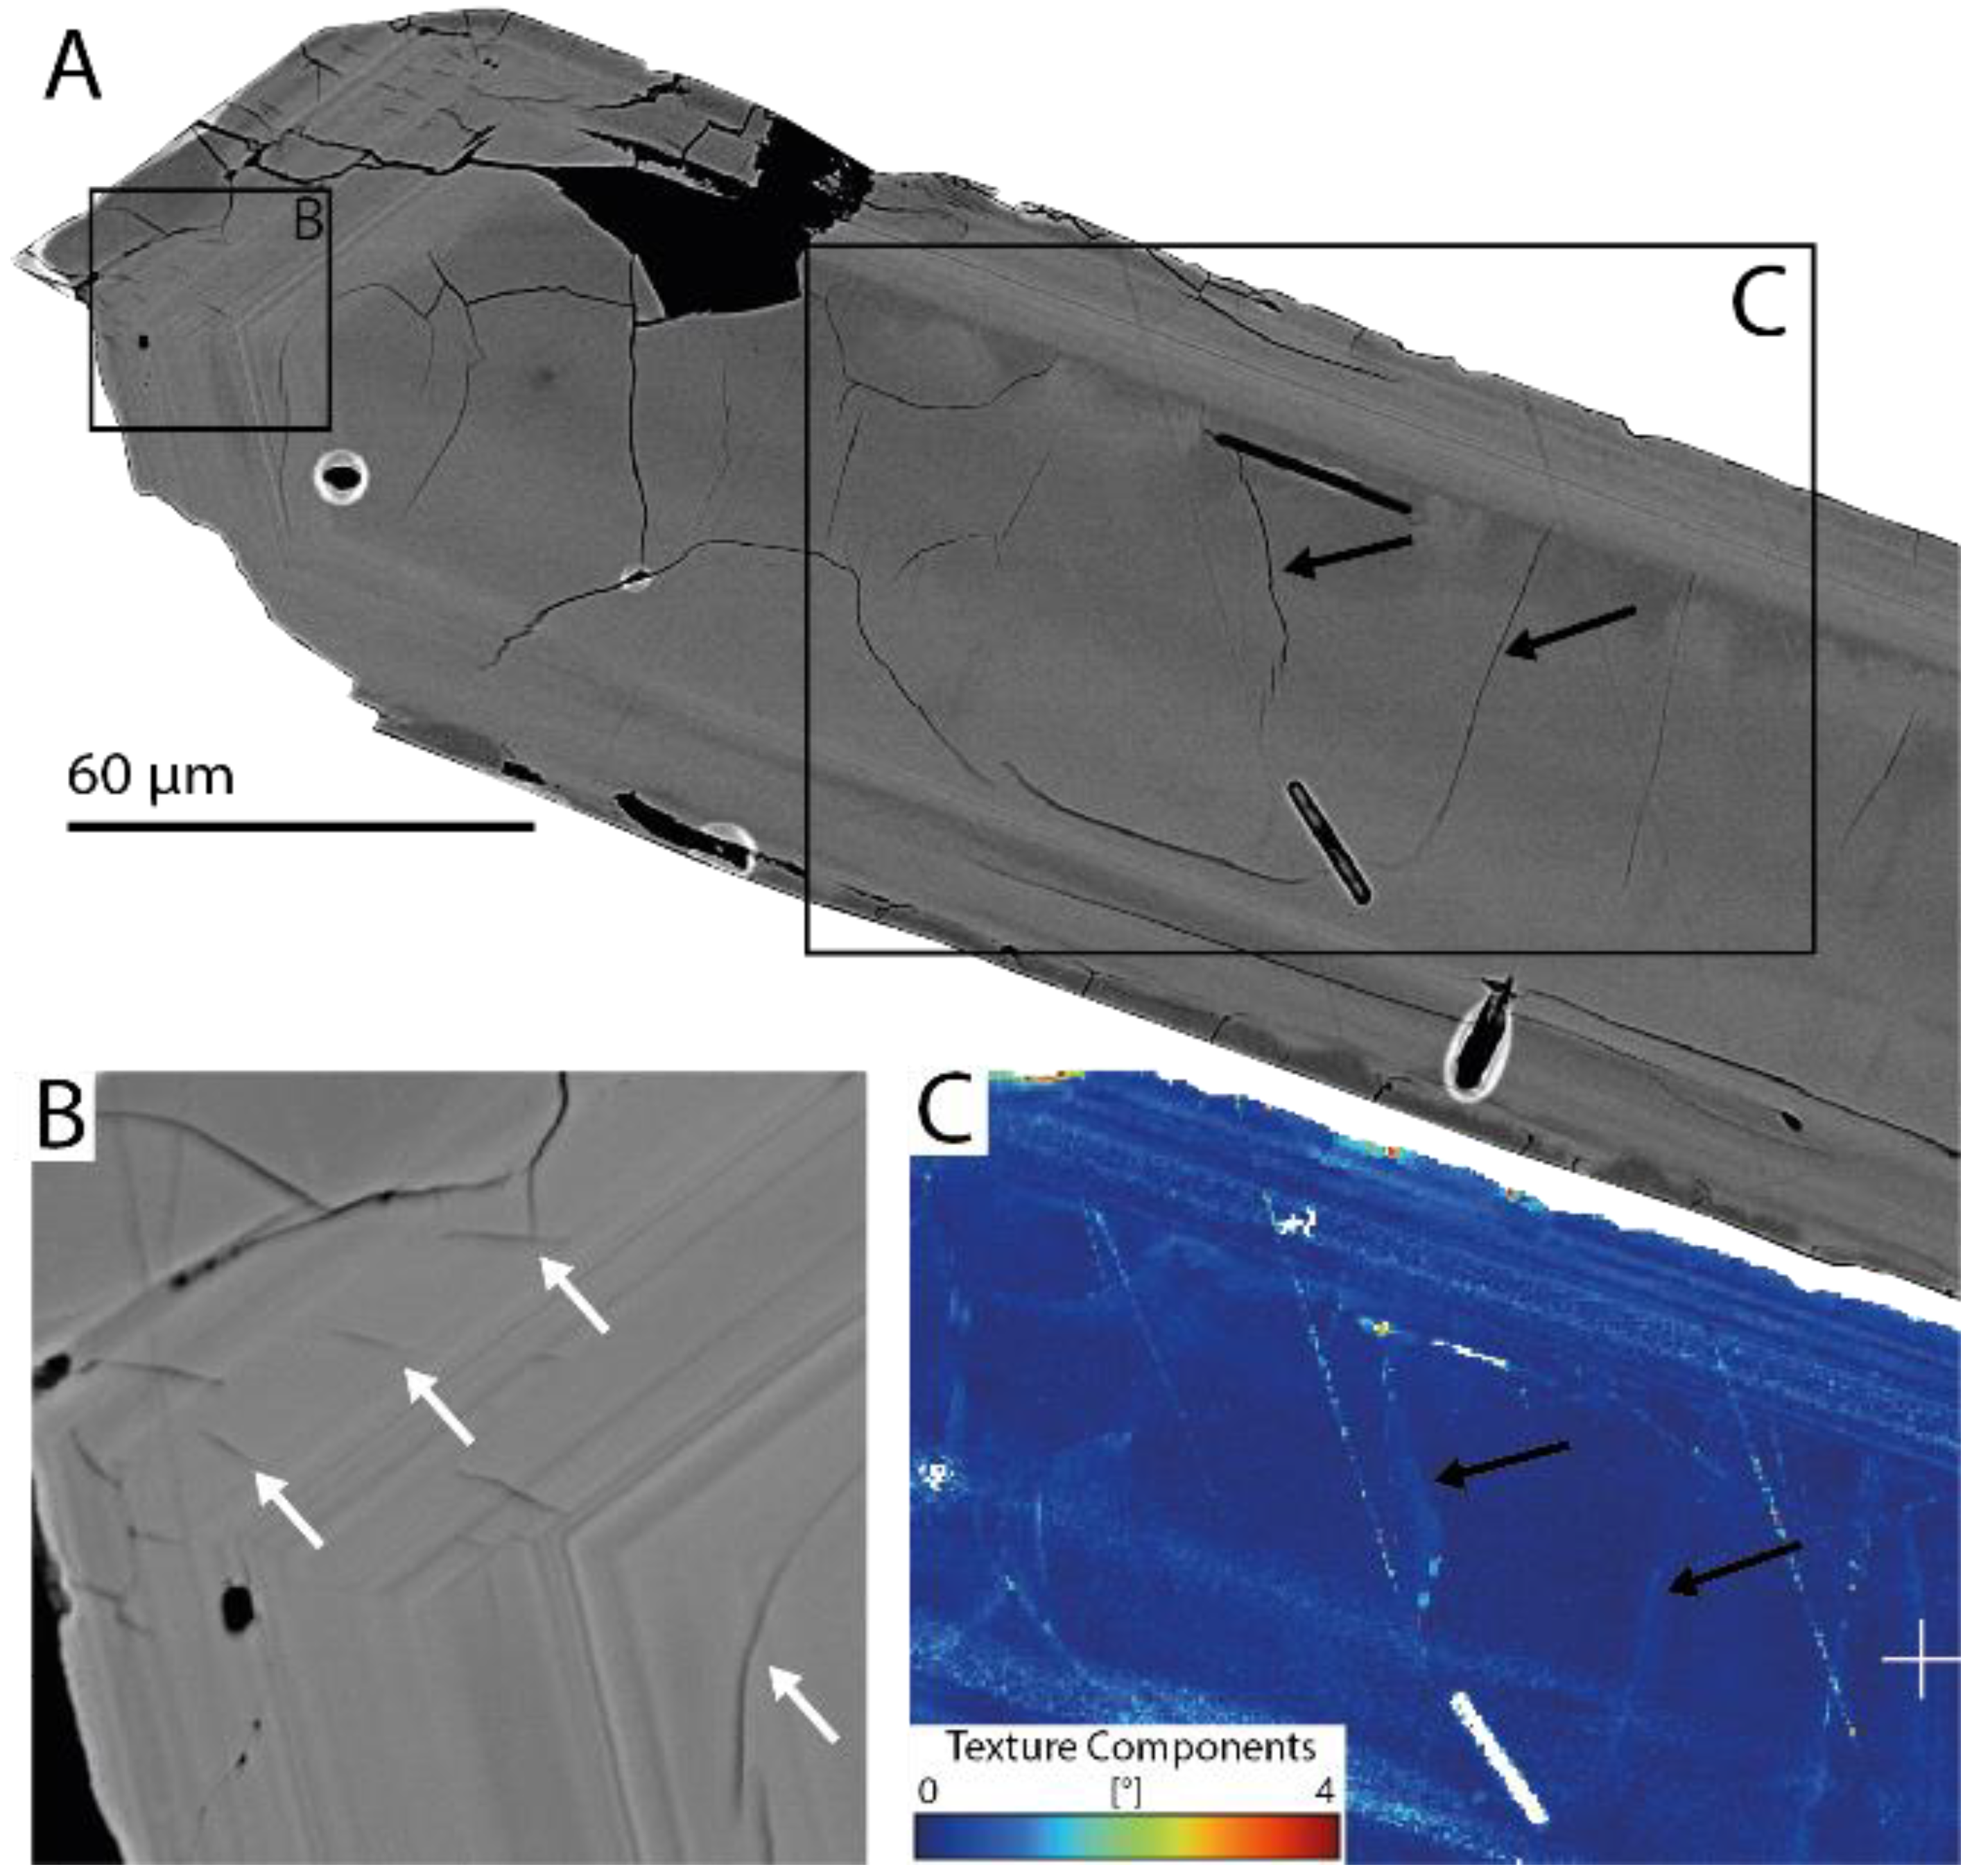
4.2. Recrystallisation Microstructures

The most significant microstructure observed in the CL microphotographs is the replacement of zoned by unzoned zircon. As previously described by Pidgeon [2], transitional boundaries are characterised by oscillatory zones that are fading into unzoned areas retaining traces of the original zoning whereas transgressive boundaries form as the result of discordant patches of unzoned zircon which interpenetrate or form a rim around zoned zircon. Pidgeon [2] argued that although both boundaries can be present in zircons, a clear distinction between the two types can often not be made. Although the result of a single recrystallisation mechanism, Pidgeon [2] described the transitional and transgressive boundaries as two separate recrystallisation microstructures. In this study, a clear linked nature between the two boundary types was observed. Recrystallisation resulting in the migration of oscillatory zoning causes a recrystallisation front and a transgressive boundary with the primary zoned zircon, but simultaneously a transitional boundary is formed by fading of the original zoning (Figure 3A). These replacement microstructures of zoned by unzoned zircon all showed higher-quality diffraction patterns compared to primary zoned zircon, indicating a more crystalline structure (Figure 3C).
Transitional replacement is often difficult to observe in CL images because the boundary between the primary zoned and recrystallised zircon is not defined by a distinct feature and the two zones do not necessarily differ significantly in appearance. Such a region as indicated with 1 & 2 in Figure 3A shows there is no observable difference between the two zones in CL, whereas in Figure 3C it can be observed that zone 2 has a higher-quality diffraction pattern, indicating a more crystalline structure and suggesting that transitional replacement may have taken place.
A higher degree of recrystallisation is often manifested as convolute zoning (Figure 3A). This recrystallisation microstructure is characterised by faded and bent oscillatory zoning and may appear as if the zoning has migrated through the crystal. As seen in Figure 3A and in detail in 3B, the zonation patterns in the zircon are bent away from their original position similar to (1) and translated to the interior of the zircon forming a recrystallisation front. The presence of fractures may enhance the bending of the zoning (Figure 3B). In the migration front of the convolute zoning the spacing between the individual oscillatory zones is narrowed or zones appear to be merged resulting in a bright CL-signal (Figure 3B). These pileups of zonings occasionally form the interface between the primary zoned and recrystallised zircon (Figure 3B) and have an appearance similar to the recrystallisation fronts as described by Hoskin and Black [1].
The highest degree of recrystallisation results in the complete homogenisation of the primary zoned zircon, and often occurs as lobes penetrating primary structures and forming transgressive boundaries (Figure 3A). No consistent pattern in the CL brightness was observed in the zones of recrystallised zircon. This recrystallisation microstructure can either be composed of a single homogenised lobe, or several unzoned lobes with slightly varying CL brightness.
The sharp interface between the primary zoned and recrystallized zircon can either be defined by a recrystallisation front as describe above, a fracture, or no interfacial structure at all. EBSD mapping of the grains shows that along the interface between zoned and recrystallised zircon a feature with a minor orientational differences (<2°) may be present (Figure 4). This feature may be associated with a fracture (Figure 4A–C) but has also been observed when no fracture defines the interface (Figure 4D–F). This feature, however, does not show up in band contrast maps indicating that it is not an artifact of topography-induced noise.

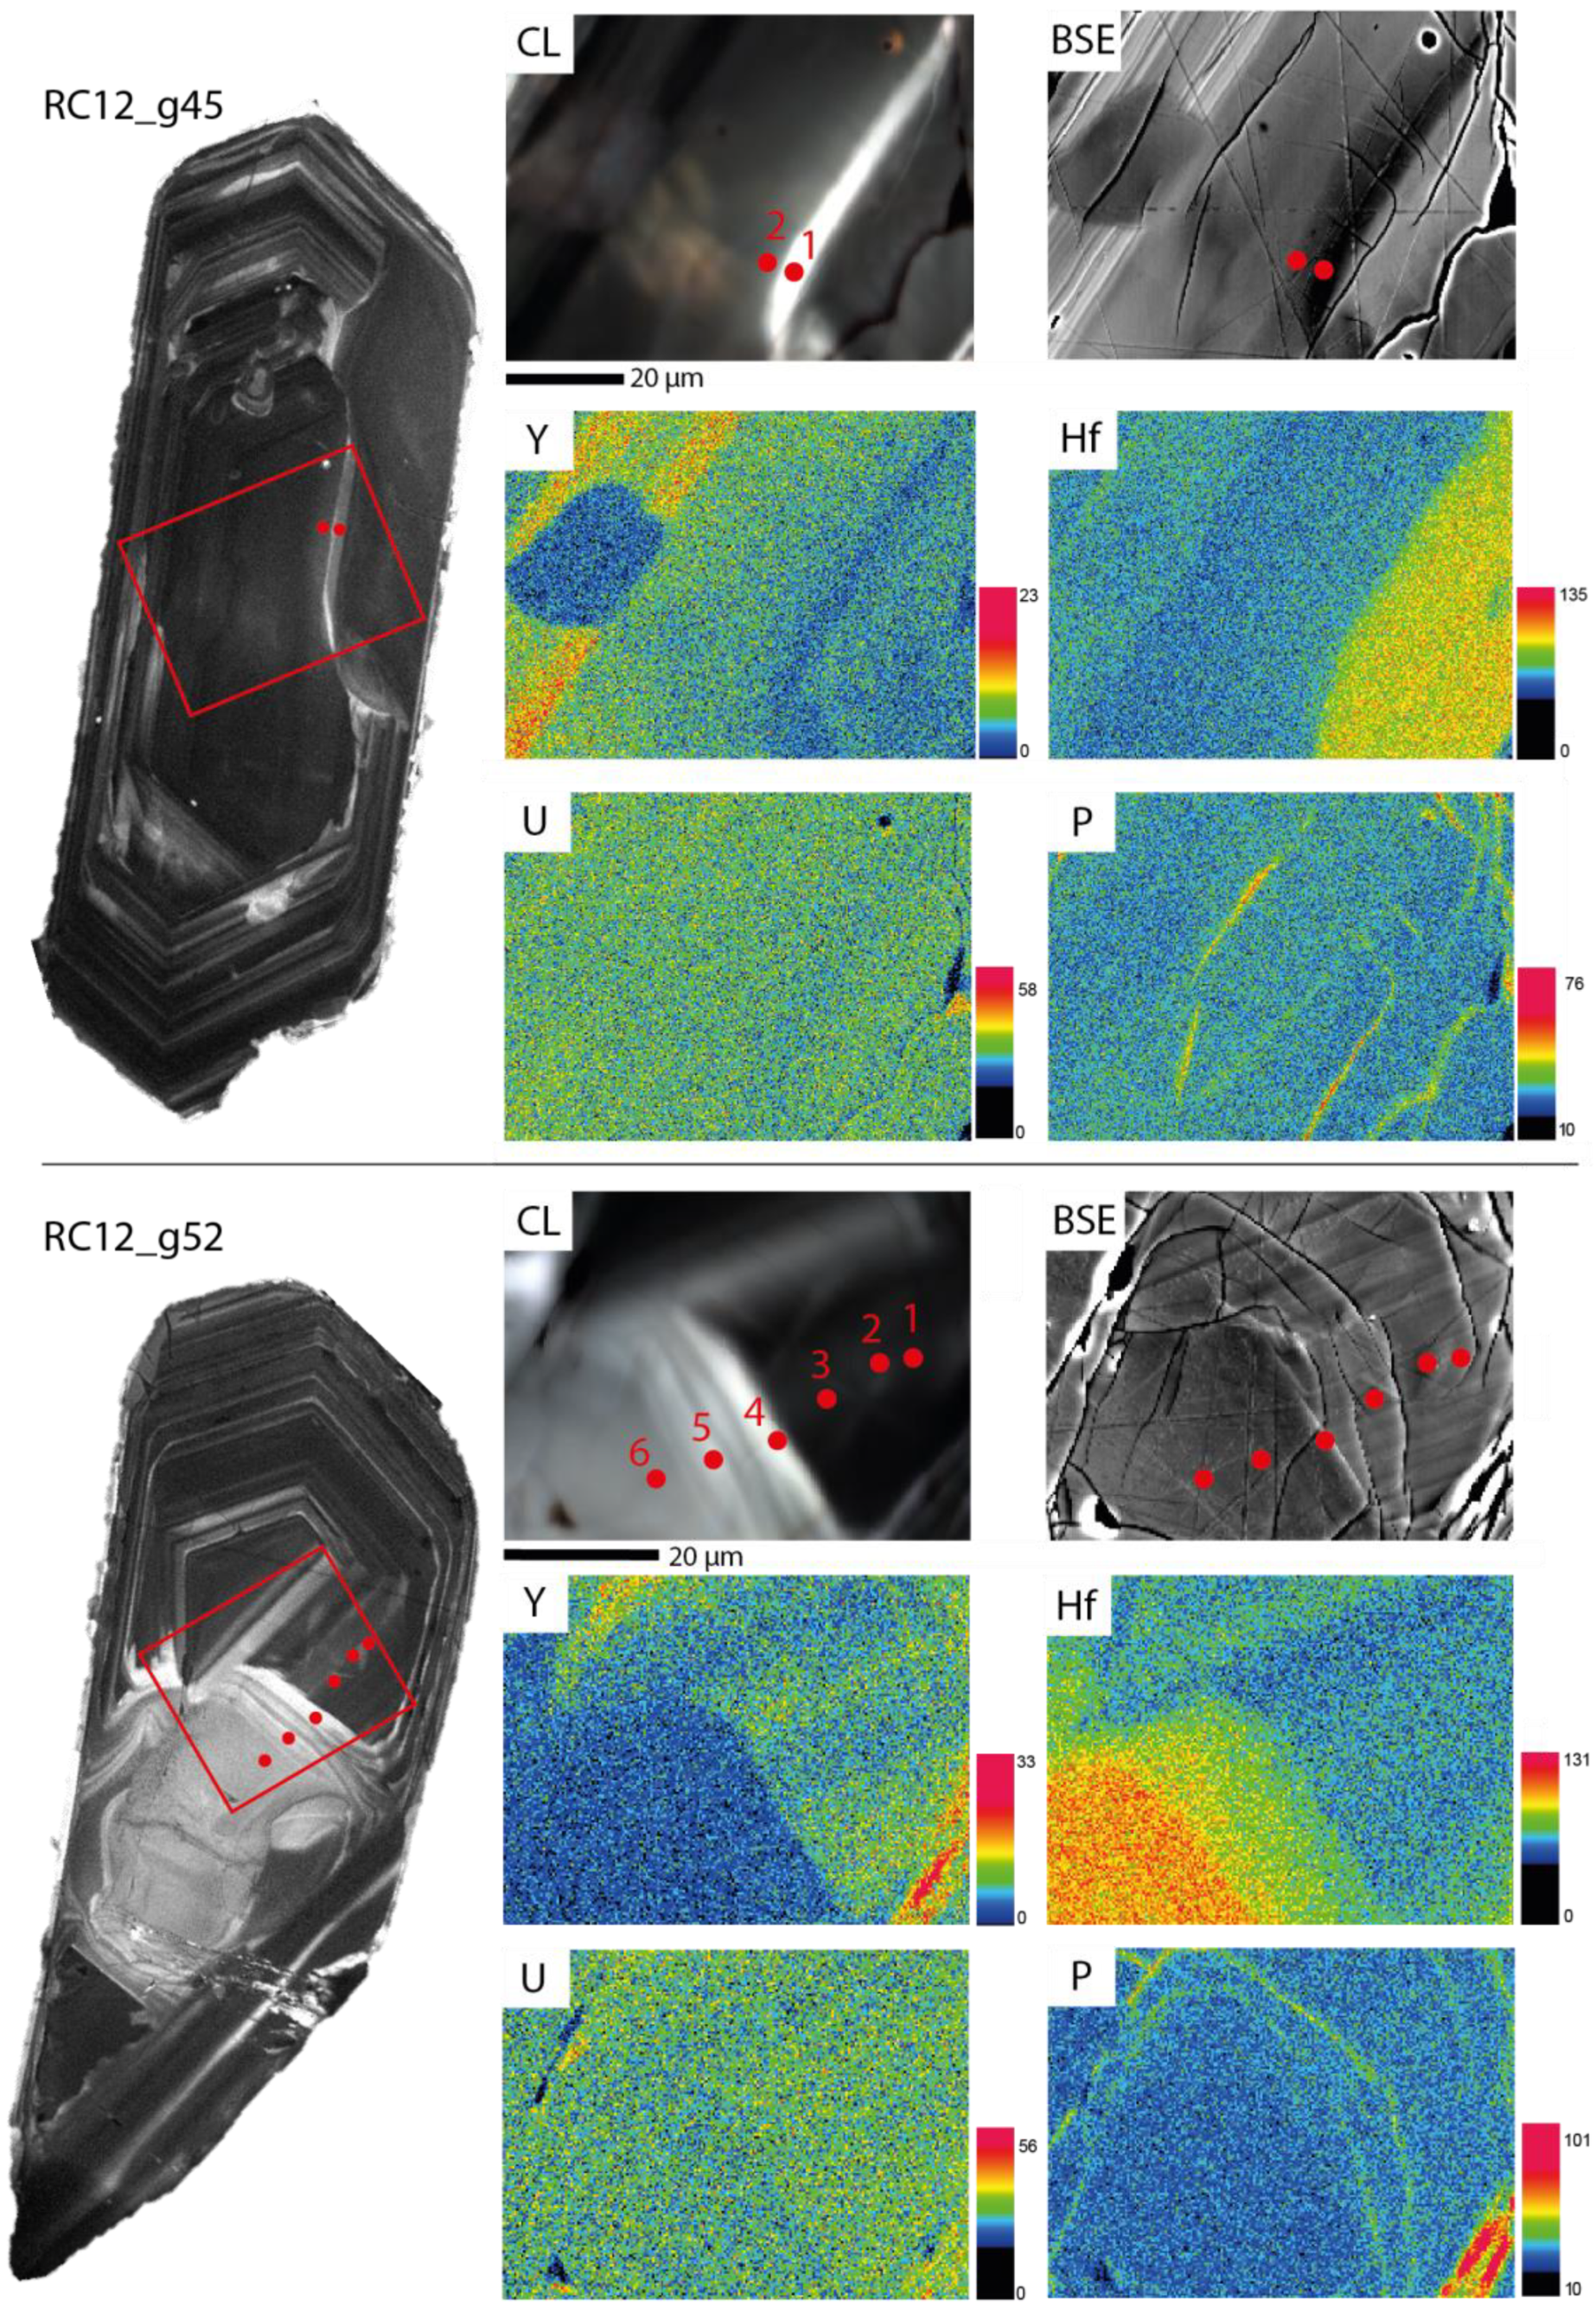
4.3. Trace-Element Distributions across Recrystallisation Interfaces

WDS trace element mapping shows that regions with recrystallisation microstructures such as lobes of unzoned zircon and convolute zoning have higher concentrations of Hf and lower concentrations of Y compared to zoned zircon (Figure 5 and Table 1). Furthermore, in grain RC12_g52 the convolute zoning contains Hf concentrations which gradually increase from values typical of the primary zoned zircon (1.04–1.12 wt%) to values measured in the convolute zoning (1.34–1.58 wt%) and recrystallised, unzoned zircon (2.13 wt%). Unlike Hf, Y concentration profiles across recrystallisation interfaces are abrupt (primary zoned avg: 1504 ppm, recrystallised avg: 218 ppm). In addition, the recrystallisation front in RC12_g45 contains an even lower concentration of Y compared to unzoned zircon (Figure 5). Trace-element concentrations of P, Ca, Al and Fe do not show significant variations across zoned/unzoned interfaces; instead, it was noted that these trace elements can all be either enriched or depleted in fractures, but this varies between different grains. The U and Th concentrations are of particular interest because of their relevance to U-Pb dating. However, trace-element maps did not clearly show a variation of U and Th concentrations across the interface and additional EMP spot measurements were not conclusive as negative concentrations were often measured. Because of this, in combination with high analytical errors, U (±332.4 ppm) and Th (±211.7 ppm), and likely because of heterogeneity in the zircon standards, these concentrations were not considered to be significant.

5. Discussion

5.1. Current Models of Recrystallisation in Zircon

Several mechanisms of zircon recrystallisation and trace-element mobility briefly described in the introduction require further consideration and discussion in light of the results presented here.
The two mechanisms, dry thermal annealing and diffusion reaction-re-equilibration, involve the recrystallisation of zones having higher degrees of metamictization. The recovery of the zircon structure via dry thermal annealing occurs during elevated temperatures when amorphous (metamict) zircon recovers in distinct stages [9]. Diffusion-reaction-re-equilibration [10,11] is characterised by the infiltration of an aqueous solution through the amorphous zircon or along metamictization-induced fractures; this is believed to drive the growth kinetics of the reaction-recrystallisation fronts and the subsequent redistribution of trace elements. This study has not investigated the degree of metamictization in the zircons, although concentric and radial fractures consistent with the swelling of metamict zircon [26] have been observed in zircons from all three sample locations (Figure 2). In addition, Nasdala et al. [27] have shown that for samples from the post-tectonic granite sheet (W34), the primary zoned regions have a high degree of metamictization whereas the recrystallised regions have intermediate to minor degrees of metamictization. In this study, the dark CL and low band contrast zones in EBSD in the primary zoned zircon support this interpretation
However, a key factor in invoking either of these recrystallisation mechanisms in our samples is that both mechanisms require time for metamictization to develop before recrystallisation can commence. In our samples, zircon recrystallisation has primarily been identified in RC12 and W34, which are igneous rocks lacking any evidence of later deformation events. These mechanisms are therefore unable to explain the observed unzoned zircon. Previous research on W34 zircons by Nasdala et al. [27] showed that concentrations of U and Th in the recrystallised (and less metamict) zones are much lower than the concentrations in primary zoned (and more metamict) zircon. They concluded that this was not due to recrystallisation of metamict zircon, but more likely because recrystallisation commenced before metamictization, causing a depletion of U and Th resulting in less amorphization in the recrystallised zircon compared to primary zoned zircon over time. Sensitive high-resolution ion microprobe (SHRIMP) analysis by Pidgeon [2] and Nasdala et al. [27] on W34 zircons yielded average concordant U/Pb ages (2655 ± 12 Ma) for the recrystallised zircon and strongly discordant ages for primary zoned areas of 2659 ± 19 and 980 ± 110 Ma, suggesting that the primary zoned and recrystallised zircon both have roughly the same late Archean age and indicating that recrystallised zircons may reflect the age of crystallisation (at ca. 2655 Ma) better than zoned zircon. Significantly, the SHRIMP data further support the notion that the recrystallisation took place shortly after primary crystallisation but prior to metamictization [27]. As a result, neither of the two mechanisms mentioned above are viable mechanisms to explain the recrystallisation structures observed in CL in our samples. However, the discordant ages in the more metamict zoned zircon indicates that an event of lead loss possibly commenced as the result of element diffusion along metamictization-induced fast-diffusion pathways [10,11] explaining the minor structural recovery observed in a band contrast map in the primary zoned zircon (Figure 3C).
Increased lattice strain generated in the zircon structure through the incorporation of trace elements may also be a driving force for recrystallisation. Hoskin and Black [1] proposed a thermally activated recrystallisation mechanism based on particle and defect volume diffusion through the crystal. Shortly after crystallisation, during the cooling of the magma body, this high lattice strain acts as a trigger for recrystallisation in which trace elements are expelled or migrate through the crystal along moving dislocations. The recrystallising zircon is gradually homogenised, and trace elements and dislocations accumulate along recrystallisation fronts. Recrystallisation fronts similar in appearance to those documented by Hoskin and Black [1] are visible in multiple grains from RC12 and W34 (Figure 4D and Figure 5). In addition, these zircons show convolute zoning (i.e., bending and fading of the oscillatory zoning) which may be an indication of trace-element and dislocation migration. The absence of these recrystallisation microstructures in W65 can be explained by only minor incorporation of trace elements (as expected from the low CL-signal) in the crystal lattice during primary crystallisation, thus reducing lattice strain. Based on electron backscattering patterns (EBSP), Hoskin and Black [1] argued that this mechanism proceeds without sub-grain rotation. EBSD mapping across zircon recrystallisation interfaces from this study also shows that there is no sub-grain rotation occurring, but the recrystallisation interface itself is associated with a local misorientation of <2° (Figure 4). Significantly, trace-element distributions in the recrystallisation interface in our samples are not entirely consistent with the distributions predicted from the Hoskin and Black model [1], who measured enriched trace element concentrations in the recrystallisation front whereas WDS maps in this study show no enrichment in the recrystallisation front. Concentrations for Y and Hf in the recrystallised unzoned zircon are again in agreement with measurements of Hoskin & Black [1], however they argue that the enrichment of HfO2 is a statistical artifact of a limited dataset, whereas we consider that Hf is enriched during the recrystallisation process.
The depletion of trace elements in the recrystallisation front may be the result of the formation of fast-diffusion pathways as proposed by Piazolo et al. [12] where dislocation glide accumulates in a dislocation array supporting pipe diffusion. Fast-diffusion pathways formation by crystal plastic deformation in zircon has previously been described by Reddy et al. [13] and Timms et al. [16,17], although they were not associated with zircon recrystallisation interfaces. Reddy et al. [13] argued that fast-diffusion pathways (e.g., crystal-plastic deformation induced low-angle subgrain boundaries) are essential to explain the depletion of trace elements in zircons. According to their model, trace element and dislocation migration as similarly proposed by Hoskin and Black [1] may cause low-angle boundaries (>2°). These interfaces can then act as fast-diffusion pathways for trace elements and could therefore explain the depletion of Y, and other non-formula elements, in recrystallised zircon. However, the model lacks both an explanation for the enrichment of Hf in recrystallised zircon, as well as the structural recovery observed in primary zoned zircon. We argue that the enrichment of Hf occurs concurrently with Y expulsion through the fast-diffusion pathways. Increased Hf concentrations in the recrystallized zircon can be explained by that recrystallisation occurs at lower temperatures than crystallisation. Although the partition coefficients for Hf and Zr are very similar (KdZr/KdHf~1.6–1.9) [28], with decreasing temperatures the exchange coefficient between Hf and Zr (DHf/DZr) increases [29]. One possible explanation is that the lower temperatures cause the crystal structure of zircon to contract, increasing the DHf/DZr because the slightly smaller Hf ion can enter the structure better than the larger Zr ion [30]. In this model, the intermediate Hf concentrations in the convolute zoning would thus reflect only partial recrystallisation.
Finally, a dissolution-reprecipitation mechanism has previously been attributed to recrystallised zircons which underwent high-grade metamorphism [31]. This recrystallisation mechanism is characterised by the dissolution of a trace-element-rich zircon and the simultaneous precipitation of a near-pure end-member zircon as well as inclusions rich in insoluble trace elements such as thorite and xenotime. Petrographic observations of the inclusions show that the majority of the inclusions are present in the primary zoned zircon whereas the recrystallised zircon is mostly devoid of inclusions. Our samples, however, contain microstructures which are inconsistent with this model of recrystallisation. For example, transitional boundaries and convolute zonings suggest that primary zoned zircon is gradually replaced with recrystallised zircon, whereas coupled dissolution-reprecipitation implies that there should be only sharp distinct interfaces between primary zoned and recrystallised domains. This mechanism could therefore only explain recrystallisation in a minority of the zircons of this study where no transitional replacement or convolute zoning is observed.

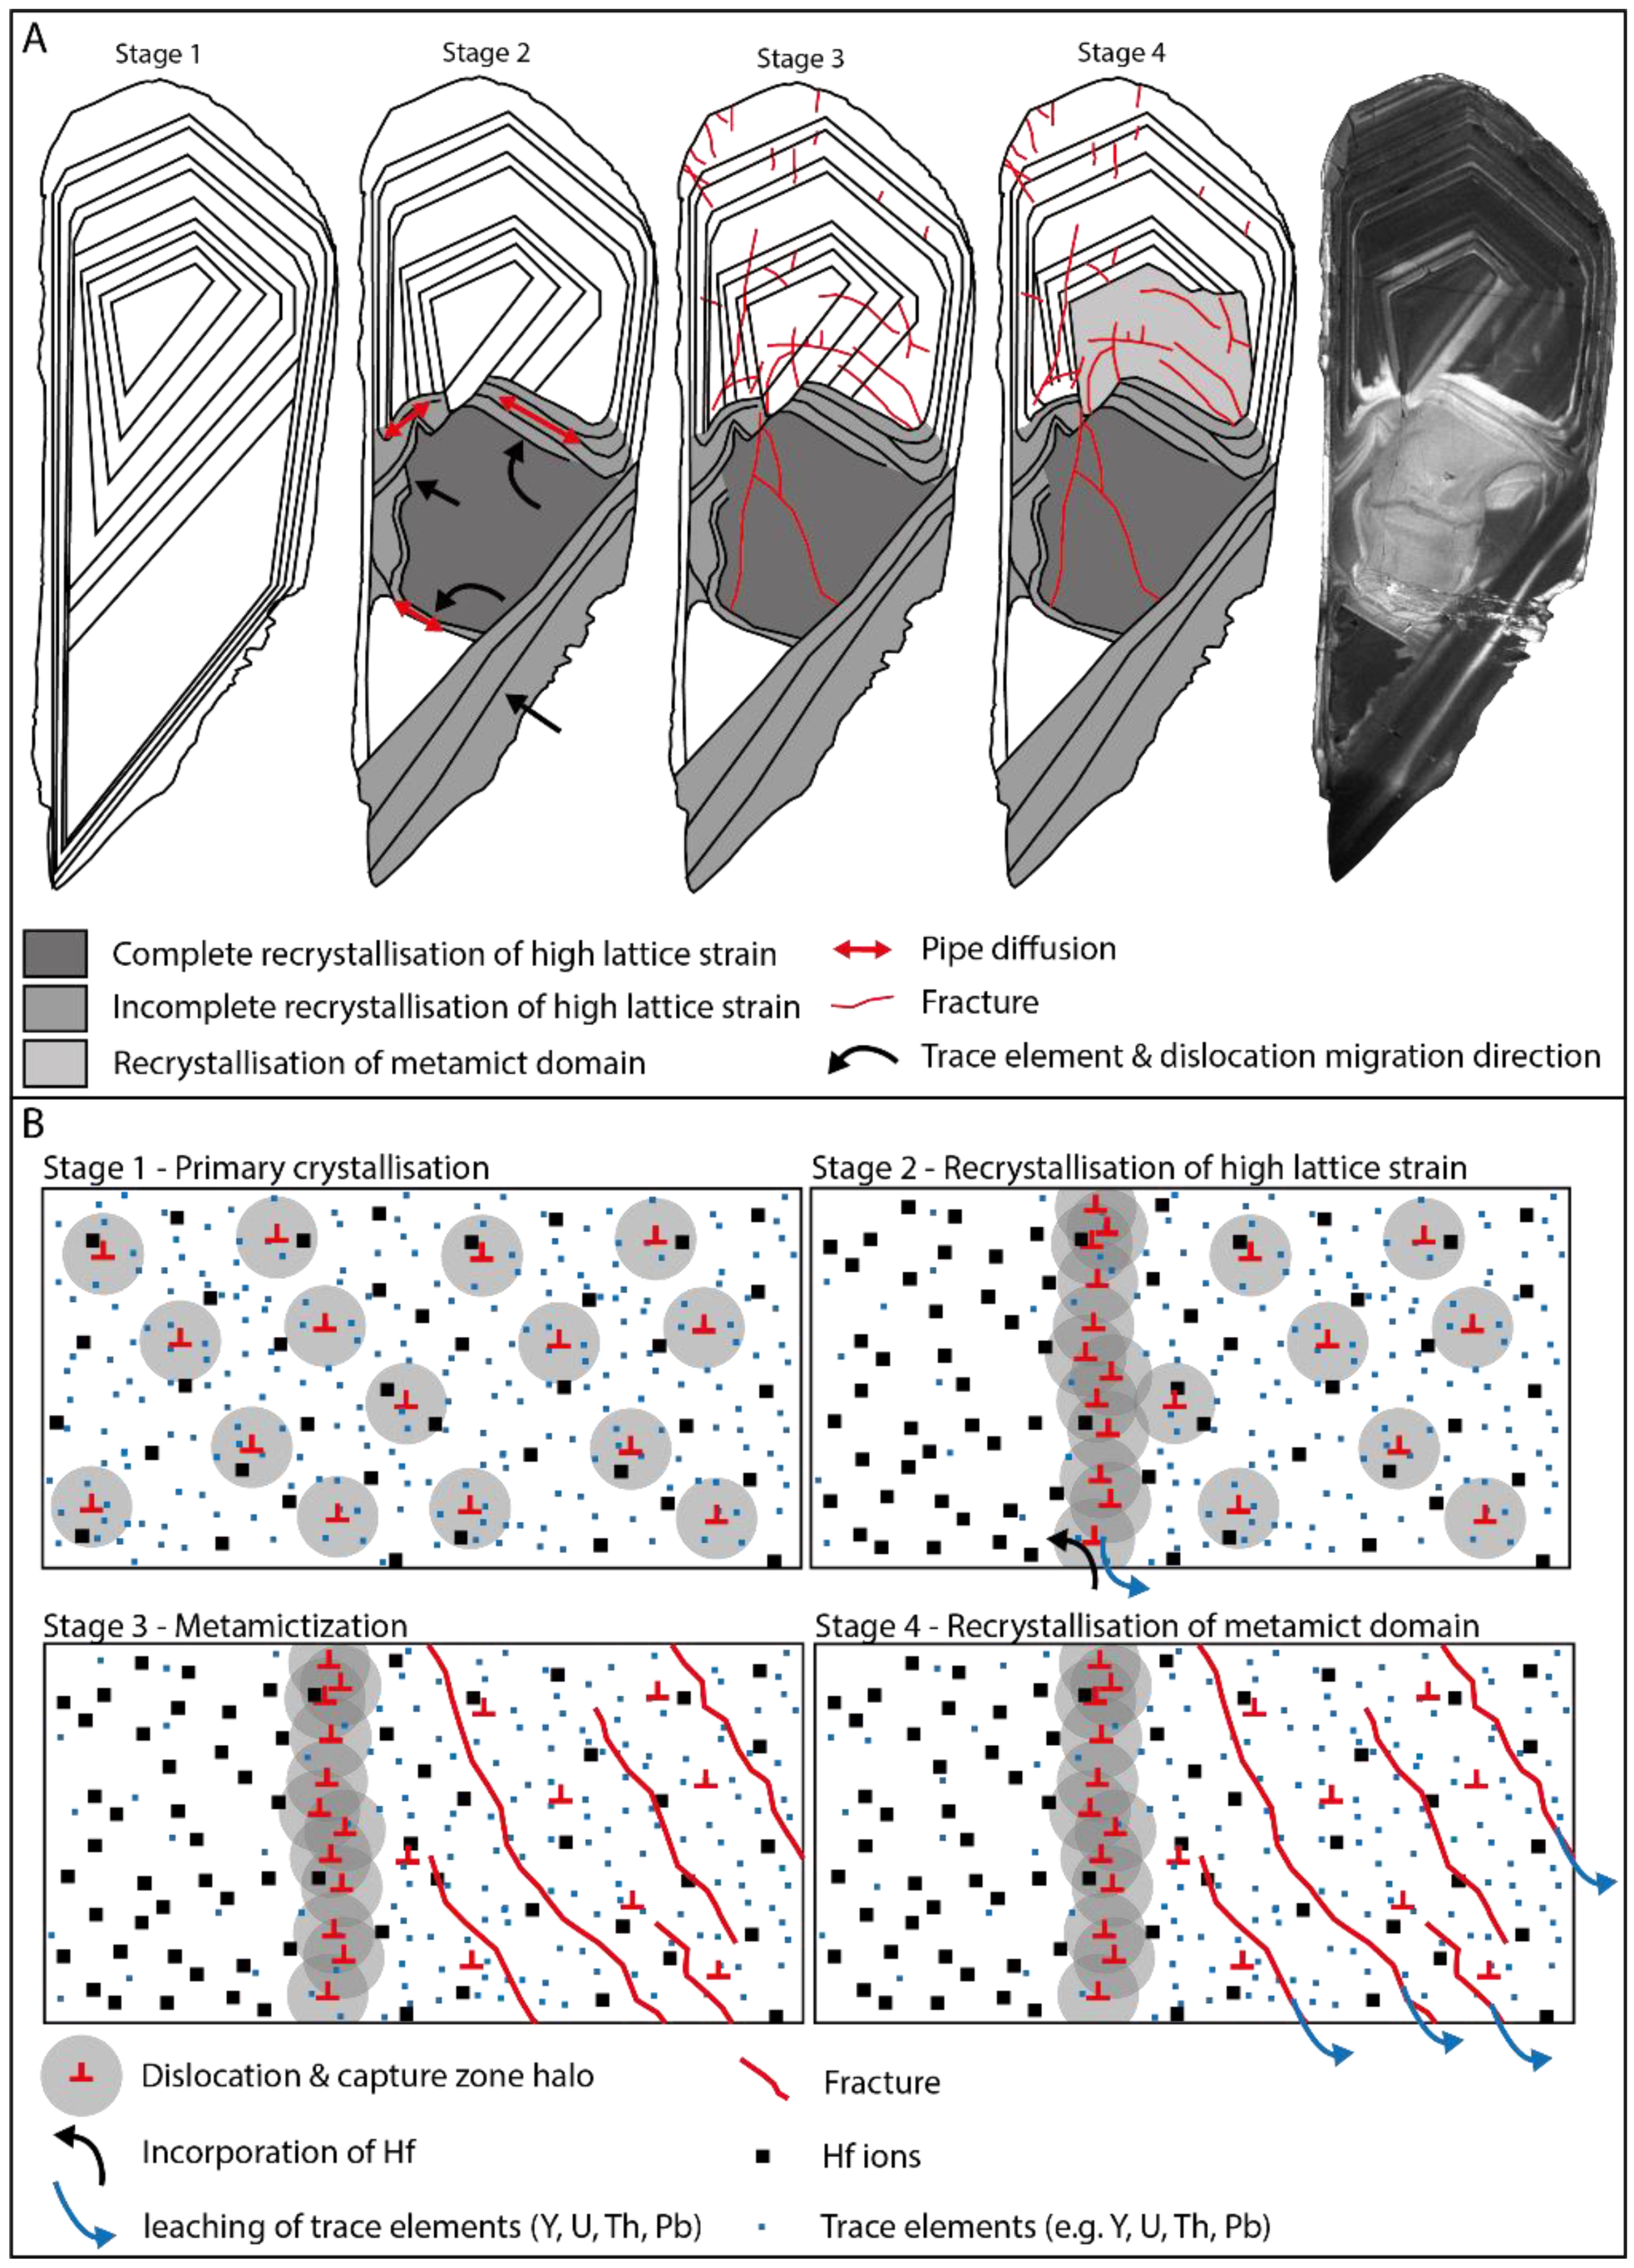
5.2. Proposed Hybrid Model

In order to explain the observed microstructures in our samples, we propose a hybrid model combining elements from the various models discussed in Section 5.1. This hybrid model can be described in more detail by considering a timeline of zircon recrystallisation and trace-element mobility for grain RC12_g52 (Figure 6).
Stage 1. The first stage is primary growth of the zircon. Here, characteristic oscillatory zoning forms due to the varying incorporation of trace elements in different zones, which results in high lattice strain on the crystal structure. This lattice strain is the trigger for recrystallisation.
Stage 2. During the cooling of the magma, dislocations and trace elements migrate through the crystal [1,12]. During this migration, trace elements are transported along the dislocations or are expelled from the lattice resulting in a depletion of Y (as observed in this study) and U and Th [27] in the recrystallised zircon. The dislocations accumulate in dislocation arrays creating pathways out of the zircon for trace elements via pipe diffusion. This stage is also associated with the enrichment of Hf in the recrystallised zircon. The same pipe diffusion mechanisms allow for Hf to enter the zircon structure due to the increased partition coefficient of Hf at lower temperatures [29].
Stage 3. After cooling of the magma, there has been enough time for metamictization to occur mainly in the primary zoned zircon forming fast-diffusivity pathways [10,26,32]. Recrystallisation of stage 2 depleted the unzoned zircon of radiogenic trace elements, limiting the effect of metamictization in the recrystallised zircon.
Stage 4. These fast-diffusivity pathways can then allow ingressing fluids in a second recrystallisation event via a diffusion-reaction re-equilibration mechanism as proposed by Geisler et al. [10]. This would explain the higher degree of crystallinity (indicated by higher band contrast) that is observed in oscillatory zoned regions of zircon (Figure 3).

5.3. Implications for U-Pb Dating

It is clear from this study that microstructures in zircons are complex and can result from a variety of crystallisation and recrystallisation mechanisms. Moreover, previous studies on zircon recrystallisation [1,2,12,18,33,34,35] show that various trace elements, including U, Th and Pb may be strongly heterogeneously distributed throughout the zircon because of these mechanisms.
For the zircons in this study, no general trend for U enrichment or depletion between primary and recrystallised zircon was found. This can be attributed to the large analytical uncertainty of measurements made with the microprobe in combination with generally low expected concentrations. Although Pb concentrations have not been analysed with the microprobe as they were expected to be below the detection limits, it is not unreasonable to expect that the distribution of Pb will, like U and Th, also be heterogeneous; as the radiogenic daughter product of U and Th, Pb is generally considered to be incompatible in the zircon lattice and more susceptible to leaching [5].
The lead-loss event in the primary (but metamict) zircon zones from W34 zircons reported by Nasdala [27] but not detected in the unzoned recrystallised zircon suggests that recrystallised zircon may have a more pristine and resilient structure. This further suggests that, for zircons that have experienced additional lead-loss events, the age of crystallisation may be better reflected by the recrystallised zircon than the zoned metamict zircon, a conclusion previously also made by Nasdala et al. [27]. Furthermore, the expulsion of trace elements from the recrystallised zircon such as Y suggests that U and Pb also are expelled from the recrystallised zircon structure. However, if recrystallisation occurs shortly after crystallisation, it is expected that only U will be expelled since enough time will not yet have passed for Pb to accumulate via radioactive decay. In this scenario, the unzoned zircon will yield concordant U-Pb ages which should reflect the age of the end of the cooling of the magma. If the zircons did not undergo a lead-loss event after crystallisation, both the zoned and unzoned zircon should yield concordant ages; however, the concentrations of U and Pb in the zoned zircon are then expected to be higher.
In summary, however, it is clear that the significance of U-Pb dates from a zircon must be carefully interpreted based on a clear understanding of its crystallisation and recrystallisation history.

6. Conclusions

(1)
Igneous zircons from the granitic injection complex of Harris on the island of Harris Lewis, Outer Hebrides, NW Scotland and the Jack Hills Metasedimetary Belt in the NW Yilgarn Craton of Western Australia show a variety of microstructures indicative of zircon recrystallisation. Recrystallisation of the zircons may range from a minor fading of the oscillatory zoning to a complete replacement of zoned by unzoned zircon;
(2)
We propose a new, hybrid model for zircon recrystallisation in these samples based on a combination of elements from previous models [1,10,12]. The fundamental mechanism responsible for recrystallisation within the studied zircons appears to be defect and trace element migration. The accumulation of dislocations in recrystallisation fronts yields a recrystallisation interface of minor misorientation (<2°). These recrystallisation interfaces may act as fast-diffusion pathways for trace-element diffusion. This mechanism results in a depletion of Y and an enrichment of Hf within the recrystallised zircon. After recrystallisation, metamictization may create fast diffusion pathways in the primary zircon due to fracturing. Recrystallisation and structural recovery of the metamict domain may also be accompanied by trace-element incorporation and leaching;
(3)
The heterogeneous distribution of trace elements has important implications for U-Pb dating. Different zones within a single zircon can yield varying U-Pb ages, suggesting that a detailed understanding of the crystallisation and recrystallisation history of the zircon is required to accurately interpret the U-Pb ages.

Author Contributions

Conceptualization, M.R.D. & J.K.W.L.; methodology, M.R.D. & J.K.W.L.; validation, J.R.H., M.H., M.R.D. & J.K.W.L.; formal analysis, J.R.H. & M.H.; investigation, J.R.H. & M.H.; resources, M.R.D. & J.K.W.L.; data curation, M.H. & J.R.H.; writing—original draft preparation, J.R.H.; writing—review and editing, M.R.D., J.K.W.L. & M.H.; visualization, J.R.H.; supervision, M.R.D., J.K.W.L. & M.H.; project administration, M.R.D.; funding acquisition, M.R.D. & J.K.W.L. All authors have read and agreed to the published version of the manuscript.

Funding

This research was funded through the Department of Earth Sciences, Utrecht University, as part of the master program for J.R. Huijsmans. This work was also supported by a research grant from the University of Saskatchewan to J.K.W. Lee.

Data Availability Statement

The data presented in this study are openly available in YODA at https://public.yoda.uu.nl/geo/UU01/769PD8.html.

Acknowledgments

The authors would like to thank R.T. Pidgeon from Curtin University for providing the zircon samples to J.K.W. Lee and E. Hellebrand for his assistance on the microprobe. The electron microscopy results were obtained with equipment funded by the EPOS-NL project (www.EPOS-NL.nl).

Conflicts of Interest

The authors declare no conflict of interest. The funders had no role in the design of the study; in the collection, analyses, or interpretation of data; in the writing of the manuscript; or in the decision to publish the results.

References

  1. Hoskin, P.W.; Black, L.P. Metamorphic zircon formation by solid-state recrystallization of protolith igneous zircon. J. Metamorph. Geol. 2000, 18, 423–439. [Google Scholar] [CrossRef]
  2. Pidgeon, R.T. Recrystallisation of oscillatory zoned zircon: Some geochronological and petrological implications. Contrib. Mineral. Petrol. 1992, 110, 463–472. [Google Scholar] [CrossRef]
  3. Pidgeon, R.T.; Nemchin, A.; Hitchen, G. Internal structures of zircons from Archaean granites from the Darling Range batholith: Implications for zircon stability and the interpretation of zircon U-Pb ages. Contrib. Mineral. Petrol. 1998, 132, 288–299. [Google Scholar] [CrossRef]
  4. Vonlanthen, P.; Fitz Gerald, J.D.; Rubatto, D.; Hermann, J. Recrystallization rims in zircon (Valle d’Arbedo, Switzerland): An integrated cathodoluminescence, LA-ICP-MS, SHRIMP, and TEM study. Am. Mineral. 2012, 97, 369–377. [Google Scholar] [CrossRef]
  5. Lee, J.K.; Williams, I.S.; Ellis, D.J. Pb, U and Th diffusion in natural zircon. Nature 1997, 390, 159–162. [Google Scholar] [CrossRef]
  6. Schaltegger, U.; Fanning, C.M.; Günther, D.; Maurin, J.C.; Schulmann, K.; Gebauer, D. Growth, annealing and recrystallization of zircon and preservation of monazite in high-grade metamorphism: Conventional and in-situ U-Pb isotope, cathodoluminescence and microchemical evidence. Contrib. Mineral. Petrol. 1999, 134, 186–201. [Google Scholar] [CrossRef]
  7. Vavra, G.; Schmid, R.; Gebauer, D. Internal morphology, habit and U-Th-Pb microanalysis of amphibolite-to-granulite facies zircons: Geochronology of the Ivrea Zone (Southern Alps). Contrib. Mineral. Petrol. 1999, 134, 380–404. [Google Scholar] [CrossRef]
  8. Soman, A.; Tomaschek, F.; Berndt, J.; Geisler, T.; Scherer, E. Hydrothermal reequilibration of zircon from an alkali pegmatite of Malawi. Beih. Eur. J. Mineral. 2006, 18, 132. [Google Scholar]
  9. Geisler, T. Isothermal annealing of partially metamict zircon: Evidence for a three-stage recovery process. Phys. Chem. Miner. 2002, 29, 420–429. [Google Scholar] [CrossRef]
  10. Geisler, T.; Schaltegger, U.; Tomaschek, F. Re-equilibration of zircon in aqueous fluids and melts. Elements 2007, 3, 43–50. [Google Scholar] [CrossRef]
  11. Geisler, T.; Pidgeon, R.T.; Kurtz, R.; Van Bronswijk, W.; Schleicher, H. Experimental hydrothermal alteration of partially metamict zircon. Am. Mineral. 2003, 88, 1496–1513. [Google Scholar] [CrossRef]
  12. Piazolo, S.; La Fontaine, A.; Trimby, P.; Harley, S.; Yang, L.; Armstrong, R.; Cairney, J.M. Deformation-induced trace element redistribution in zircon revealed using atom probe tomography. Nat. Commun. 2016, 7, 10490. [Google Scholar] [CrossRef] [PubMed] [Green Version]
  13. Reddy, S.M.; Timms, N.E.; Trimby, P.; Kinny, P.D.; Buchan, C.; Blake, K. Crystal-plastic deformation of zircon: A defect in the assumption of chemical robustness. Geology 2006, 34, 257–260. [Google Scholar] [CrossRef]
  14. Reddy, S.M.; Timms, N.E.; Hamilton, P.J.; Smyth, H.R. Deformation-related microstructures in magmatic zircon and implications for diffusion. Contrib. Mineral. Petrol. 2009, 157, 231–244. [Google Scholar] [CrossRef]
  15. Timms, N.E.; Kinny, P.D.; Reddy, S.M. Enhanced diffusion of uranium and thorium linked to crystal plasticity in zircon. Geochem. Trans. 2006, 7, 10. [Google Scholar] [CrossRef] [Green Version]
  16. Timms, N.E.; Kinny, P.D.; Reddy, S.M.; Evans, K.; Clark, C.; Healy, D. Relationship among titanium, rare earth elements, U–Pb ages and deformation microstructures in zircon: Implications for Ti-in-zircon thermometry. Chem. Geol. 2011, 280, 33–46. [Google Scholar] [CrossRef]
  17. Timms, N.E.; Reddy, S.M.; Gerald, J.D.F.; Green, L.; Muhling, J.R. Inclusion-localised crystal-plasticity, dynamic porosity, and fast-diffusion pathway generation in zircon. J. Struct. Geol. 2012, 35, 78–89. [Google Scholar] [CrossRef] [Green Version]
  18. Pidgeon, R.T.; Wilde, S.A. The interpretation of complex zircon u–pb systems in archaean granitoids and gneisses from the jack hills, narryer gneiss terrane, western australia. Precambrian Res. 1998, 91, 309–332. [Google Scholar] [CrossRef]
  19. Van Breemen, O.; Aftalion, M.; Pidgeon, R. The age of the granitic injection complex of Harris, Outer Hebrides. Scott. J. Geol. 1971, 7, 139–152. [Google Scholar] [CrossRef]
  20. Mortensen, J.K.; Card, K.D. U-Pb age constraints for the magmatic and tectonic evolution of the Pontiac Subprovince, Quebec. Can. J. Earth Sci. 1993, 30, 1970–1980. [Google Scholar] [CrossRef]
  21. Bickerton, L. Geological, Fluid-Chemical and Petrochronological Studies of the East Kemptville Sn (-Cu-Zn-Ag-In) Deposit and Its Devonian Host Batholith (Nova Scotia, Canada). Ph.D. Thesis, Laurentian University of Sudbury, Sudbury, ON, Canada, 2021. [Google Scholar]
  22. Kellett, D.A.; Muniz, P.I. Detrital U-Pb Zircon and 40Ar/39Ar Muscovite Geochronology of the Whitehorse trough, and Surrounding Rocks, Yukon and British Columbia; Geological Survey of Canada, Open File 8565; Natural Resources Canada, Geological Survey of Canada: Ottawa, ON, Canada, 2019. [Google Scholar]
  23. Black, L.P.; Kamo, S.L.; Allen, C.M.; Davis, D.W.; Aleinikoff, J.N.; Valley, J.W.; Mundil, R.; Campbell, I.H.; Korsch, R.J.; Williams, I.S.; et al. Improved 206Pb/238U microprobe geochronology by the monitoring of a trace-elementrelated matrix effect; SHRIMP, ID–TIMS, ELA–ICP–MS and oxygen isotope documentation for a series of zircon standards. Chem. Geol. 2004, 205, 115–140. [Google Scholar] [CrossRef]
  24. Stern, R.; Amelin, Y. Assessment of errors in SIMS zircon U–Pb geochronology using a natural zircon standard and NIST SRM 610 glass. Chem. Geol. 2003, 197, 111–142. [Google Scholar] [CrossRef]
  25. Stern, R.A. A New Isotopic and Trace-Element Standard for the Ion Microprobe: Preliminary Thermal Ionization Mass Spectrometry (TIMS) U-Pb and Electron-Microprobe Data; Natural Resources Canada, Geological Survey of Canada: Ottawa, ON, Canada, 2001. [Google Scholar]
  26. Lee, J.K.; Tromp, J. Self-induced fracture generation in zircon. J. Geophys. Res. Solid Earth 1995, 100, 17753–17770. [Google Scholar] [CrossRef]
  27. Nasdala, L.; Pidgeon, R.; Wolf, D.; Irmer, G. Metamictization and U-Pb isotopic discordance in single zircons: A combined Raman microprobe and SHRIMP ion probe study. Mineral. Petrol. 1998, 62, 1–27. [Google Scholar] [CrossRef]
  28. Colombini, L.L.; Miller, C.F.; Gualda, G.A.; Wooden, J.L.; Miller, J.S. Sphene and zircon in the Highland Range volcanic sequence (Miocene, southern Nevada, USA): Elemental partitioning, phase relations, and influence on evolution of silicic magma. Mineral. Petrol. 2011, 102, 29–50. [Google Scholar] [CrossRef]
  29. Linnen, R.L.; Keppler, H. Melt composition control of Zr/Hf fractionation in magmatic processes. Geochim. Cosmochim. Acta 2002, 66, 3293–3301. [Google Scholar] [CrossRef]
  30. Wang, X.; Griffin, W.L.; Chen, J. Hf contents and Zr/Hf ratios in granitic zircons. Geochem. J. 2010, 44, 65–72. [Google Scholar] [CrossRef] [Green Version]
  31. Tomaschek, F.; Kennedy, A.K.; Villa, I.M.; Lagos, M.; Ballhaus, C. Zircons from Syros, Cyclades, Greece—Recrystallization and mobilization of zircon during high-pressure metamorphism. J. Petrol. 2003, 44, 1977–2002. [Google Scholar] [CrossRef] [Green Version]
  32. Murakami, T.; Chakoumakos, B.C.; Ewing, R.C.; Lumpkin, G.R.; Weber, W.J. Alpha-decay event damage in zircon. Am. Mineral. 1991, 76, 1510–1532. [Google Scholar]
  33. Ge, R.; Wilde, S.A.; Nemchin, A.A.; Whitehouse, M.J.; Bellucci, J.J.; Erickson, T.M. Mechanisms and consequences of intra-crystalline enrichment of ancient radiogenic Pb in detrital Hadean zircons from the Jack Hills, Western Australia. Earth Planet. Sci. Lett. 2019, 517, 38–49. [Google Scholar] [CrossRef]
  34. Reddy, S.M.; van Riessen, A.; Saxey, D.W.; Johnson, T.E.; Rickard, W.D.; Fougerouse, D.; Fischer, S.; Prosa, T.J.; Rice, K.P.; Reinhard, D.A.; et al. Mechanisms of deformation-induced trace element migration in zircon resolved by atom probe and correlative microscopy. Geochim. Cosmochim. Acta 2016, 195, 158–170. [Google Scholar] [CrossRef] [Green Version]
  35. Peterman, E.M.; Reddy, S.M.; Saxey, D.W.; Fougerouse, D.; Snoeyenbos, D.; Rickard, W. Nanoscale processes of trace element mobility in metamorphosed zircon. Contrib. Mineral. Petrol. 2019, 174, 92. [Google Scholar] [CrossRef]
Figure 1. CL images of: (A) RC12_g13; (B) W34_g30; and (C) W65_g02 showing the difference in oscillatory zoning of the different sample locations. RC12 zircons show a bimodal zoning consistent of a clear alternation of CL-bright and dark zones. W34 and W65 zircons show more broader and faint oscillatory zones. Scale bars represent 70 µm.
Minerals 12 01489 g001
Figure 2. (A) BSE image of grain W34_g10 showing outline of images in B and C; (B) detailed BSE image of the concentric and radial fractures (white arrows); and (C) EBSD image showing the relative misorientation from a user-defined reference orientation (white cross). Black arrows indicate fractures and the corresponding relative misorientations.
Minerals 12 01489 g002
Figure 3. (A) CL image; (B) detail of grain RC12_g52. Indicated with red arrows and numbering are the different textures related to zircon recrystallisation: (1) (primary) zoned zircon, (2) transitional replacement, (3) convolute zoning, (4) transgressive replacement/unzoned zircon; (B) enhanced migration of the convolute zoning in the vicinity of a fracture (5) and the recrystallisation front (6). Transgressive boundary/recrystallisation interface (red dashed line); and (C) band contrast (B,C) image of the same grain showing the quality of diffraction patterns.
Minerals 12 01489 g003
Figure 4. (A) CL image of grain RC12_g10 with the recrystallisation interface indicated with a white arrow; (B) EBSD map of RC12_g10 of an interface which shows no apparent misorientation; (C) FSE image of the same region as E showing an interface defined by fractures; (D) CL image of grains RC12_g52 showing the interface between unzoned and zoned zircon (white arrow). Black scale bars are 80 μm; (E) EBSD map of RC12_g52 showing the interface between primary zoned and recrystallised zircon with a minor deviation in orientation; and (F) FSE image of the same region as B showing that there are no fractures present along the interface.
Minerals 12 01489 g004
Figure 5. CL, BSE and WDS maps of various elements in grain RC12_g45 and RC12_g52. The convolute zoning and unzoned zircon (bright CL signal; RC12_g45 spot 1 and RC12_g52 spots 4, 5 and 6) are clearly enriched in Hf and depleted in Y compared to the primary zoned zircon (dark CL; RC12_g45 spot 2 and RC12_g52 spots 1, 2 and 3). P is only enriched in the fractures. U does not have a significant concentration variation across the interface. Red dots indicate spot measurements taken with the microprobe.
Minerals 12 01489 g005
Figure 6. Proposed formation of recrystallisation microstructures of grain RC12_g52 (modified after Piazolo et al. [12]): (A) grain scale; and (B) microscale. Stage 1: primary crystallisation and formation of oscillatory zoning. Stage 2: migration of trace elements and dislocations occurs (black arrows in (A)) and accumulated dislocations permit diffusion via pipe diffusion (red arrows in (A)) in which Hf is incorporated, and other trace elements are expelled and leached (blue arrow in (B)). Stage 3: metamictization of the primary oscillatory zoning causing amorphization of the zircon structure and associated fracture formation. Stage 4: metamict domains undergo recrystallisation accompanied by leaching of trace elements (red and blue arrows in (B)).
Minerals 12 01489 g006
Table 1. Microprobe spot measurement results of grains RC12_g45 and g52 corresponding to red dots in Figure 5 taken from rim to core. Measurements below detection limit indicated with b.d.l.
RC12SpotHf (wt%) U (ppm)Th (ppm)Y (ppm)
g4511.55 ± 0.0002b.d.l454 ± 72519 ± 25
21.76 ± 0.0002759 ± 43b.d.l.1152 ± 13
g5211.12 ± 0.0003508 ± 64869 ± 381641 ± 9
21.04 ± 0.0003499 ± 64466 ± 701322 ± 11
31.09 ± 0.0003b.d.l.b.d.l1550 ± 10
41.34 ± 0.0002b.d.l.b.d.l.247 ± 51
51.58 ± 0.0002b.d.l.b.d.l.b.d.l.
62.13 ± 0.0002616 ± 52b.d.l.350 ± 37
Publisher’s Note: MDPI stays neutral with regard to jurisdictional claims in published maps and institutional affiliations.

