Article

Experimental Study on the Evolution Law of Coal Mine Underground Reservoir Water Storage Space under the Disturbance and Water—Rock Interaction Effect

1
State Key Laboratory of Coal Resources and Safe Mining, China University of Mining and Technology, Xuzhou 221116, China
2
School of Mines, China University of Mining and Technology, Xuzhou 221116, China
*
Author to whom correspondence should be addressed.
Minerals 2022, 12(12), 1491; https://doi.org/10.3390/min12121491
Submission received: 15 October 2022 / Revised: 9 November 2022 / Accepted: 21 November 2022 / Published: 23 November 2022

Abstract

:
The void of the cracked rock mass of the goaf is the main water storage space of underground reservoirs, which is in a time-space dynamic evolution process. Before the formation of the underground reservoir, the water storage space was primarily affected by disturbances. After the safe operation of the coal mine underground reservoir, the water level of the mine rises and falls repeatedly and the water storage space is affected by the water-rock interaction. To study the void evolution law of a cracked rock mass under mining disturbance and the compaction and void deformation characteristics of caving gangue under the effect of the water-rock interaction, a simulation test of a coal mine underground reservoir is conducted. Furthermore, the rupture motion law and movement deformation characteristics of the overburden during coal mining are analyzed. The digital image method and fractal theory are introduced to describe the fractal characteristics of the rock mass void of the caving zone, fracture zone, and entire goaf during the mining process. Five prototype gangue samples with different immersion times are prepared with the same grain size grading as the similar model caving gangue. The influence of the immersion times on the compaction characteristics and evolution law of the void rate of the gangue are also studied. Based on the parameter fitting method, the stress–strain relationship equation of the gangue sample and void rate-stress relationship equation of the cylindrical gangue sample, considering the influence of the immersion times, are constructed. The results show that the overburden of the model is of a “two zone” structure and the entire structure moves and sinks asymmetrically in a “∩” shape. As the advancing distance of the working face increased, the fractal dimensions of the rock mass void of the caving zone and entire goaf increased logarithmically, and the fractal dimension of the rock mass void of the fracture zone first increased rapidly (60–80 cm) and then decreased linearly (80–200 cm). As the immersion time increased, the saturated moisture content and density of the gangue samples increased logarithmically and exponentially, respectively. Under the same stress, the strain of the gangue sample increased gradually, and the void rate decreased gradually (except for the initial loading).

1. Introduction

The five provinces of Shanxi, Shaanxi, Inner Mongolia, Xinjiang, and Ningxia in the mining area of western China have large coal reserves and shallow coal seams, which provide a guarantee for China’s coal supply. However, the climate in this region is arid and semi-arid with low atmospheric precipitation and water resources [1,2]. Coal mining leads to the destruction of the roof overburden structure and integrity. The water circulation mode changes from interlayer to vertical runoff, leading to the outflow of a large amount of mine water, causing coal mining and water resource protection to be the main contradictions in the region [3]. To solve this contradiction, numerous studies have been conducted on water protection mining [4,5,6]. In addition to the water protection mining method, Gu [7] proposed a coal mine underground reservoir technology characterized by “guide, store, and utilize.” The underground coal mine reservoir mainly uses the overburden fracture from mining to lead the water in the aquifer into the goaf and forms a closed water storage space by connecting the coal pillar dam with the artificial dam at the boundary of goaf, so as to store and utilize the mine water [8,9,10], which also transforms the water in the aquifer into mining-affected water resources [11]. Mining-affected water resources play a key role in the coal mining ecological coordination relationship, which is the inducement of ecological deterioration and mine accidents and the key to ecological restoration and comprehensive water supply. The determination of the storage capacity is an important research topic in the theoretical system of coal mine underground reservoirs and an important index to evaluate the practicability of coal mine underground reservoirs. The storage capacity is primarily affected by the storage coefficient, which is the water storage capacity of the goaf per unit volume. Because coal mine underground reservoirs mainly use the gangue voids in the caving zone and fractures of the fracture zone (collectively referred to as the voids of the cracked rock mass) to store water, the storage coefficient is the void rate of the rock mass in the coal mine underground reservoir. The storage coefficient is closely related to the working face size, mining technology and method, overburden pressure, lithology of the roof and floor of the coal seam, lumpiness, and manner of stacking. In the process of coal mining, owing to disturbances, the overburden structure and cracked space evolve with the advancement of the working face. After the safe operation of the underground reservoir, the repeated rise and fall in the mine water level weakens the compaction characteristics of the gangue, which changes the voids of the gangue. This changes the size of the water storage space and hence affects the storage capacity. The schematic diagram of the coal mine underground reservoir is shown in Figure 1.
Regarding research on the storage capacity, storage coefficient, and voids of broken rock in underground reservoirs in coal mines, Zhang et al. [12] determined the relationship between the storage and hulking coefficients of the gangue. Ju et al. [13] deduced that the storage capacity of an underground reservoir is the sum of the free space between the gangue of the caving zone and the separation gap of the fractured rock formation in the fracture zone. The equation for the storage capacity of the coal mine underground reservoir was established based on the key stratum theory and the parabolic space morphological model of the caving zone. Pang et al. [14] calculated the volume difference before and after the caving of the rock formation using the vertical displacement locus equation of overburden separation, built a theoretical calculation model for the storage space of a coal mine underground reservoir, and verified the reliability of the model through field water injection and drainage tests. The space of the broken gangue in the caving zone is the main space for water storage in underground coal mine reservoirs. Wang et al. [15] developed a testing device for the storage coefficient of a coal mine underground reservoir, used this device to perform compaction tests on broken rock, coal, and similar materials, and analyzed the relationship between the particle size grading and hulking coefficient of broken coal and rock. Based on elastic mechanics, seepage mechanics, and the fluid–solid coupling theory, Song et al. [16] built a calculation model for the caving zone storage coefficient of a coal mine underground reservoir considering the effect of effective stress and analyzed the influence of the mining height, elastic modulus, Poisson’s ratio, overburden stress, and caving zone height on the storage coefficient. They deduced that the mining height had the greatest influence on the storage coefficient of the caving zone, and the elastic modulus had the lowest. Ma et al. [17] conducted a non-Darcy seepage test of broken mudstone using a testing machine and self-made seepage instrument, studied the influence of the compaction degree and particle size grading on the void rate of broken mudstone, and found that the void rate decreased with the increase in the compaction degree and increased with the increase in the number of large particle-sized broken rock. Li et al. [18,19] studied the mechanical properties of the gangue under axial and lateral loads using a self-made two-way loading test system for particle filling materials, analyzed the influence of lateral stress on the void rate of the gangue during compaction, and studied the influence of particle size grading on the compression deformation law of gangue based on PFC3D numerical software. It was deduced that a reasonable particle size grading can enable large particles of the gangue to form a frame structure and small particles to fill the void, which decreases the void rate and resistance capacity to deformation. Li et al. [20] realized the transparency of the internal structure of the gangue through CT scanning tests and 3D reconstruction technology and studied the space-time evolution characteristics of the void rate and void structure of the gangue during compaction. Hu et al. [21,22] analyzed the influence of stress transfer and evolution between gangue blocks on the void rate and void distribution law of gangue based on the EDEM numerical software and the discrete element method.
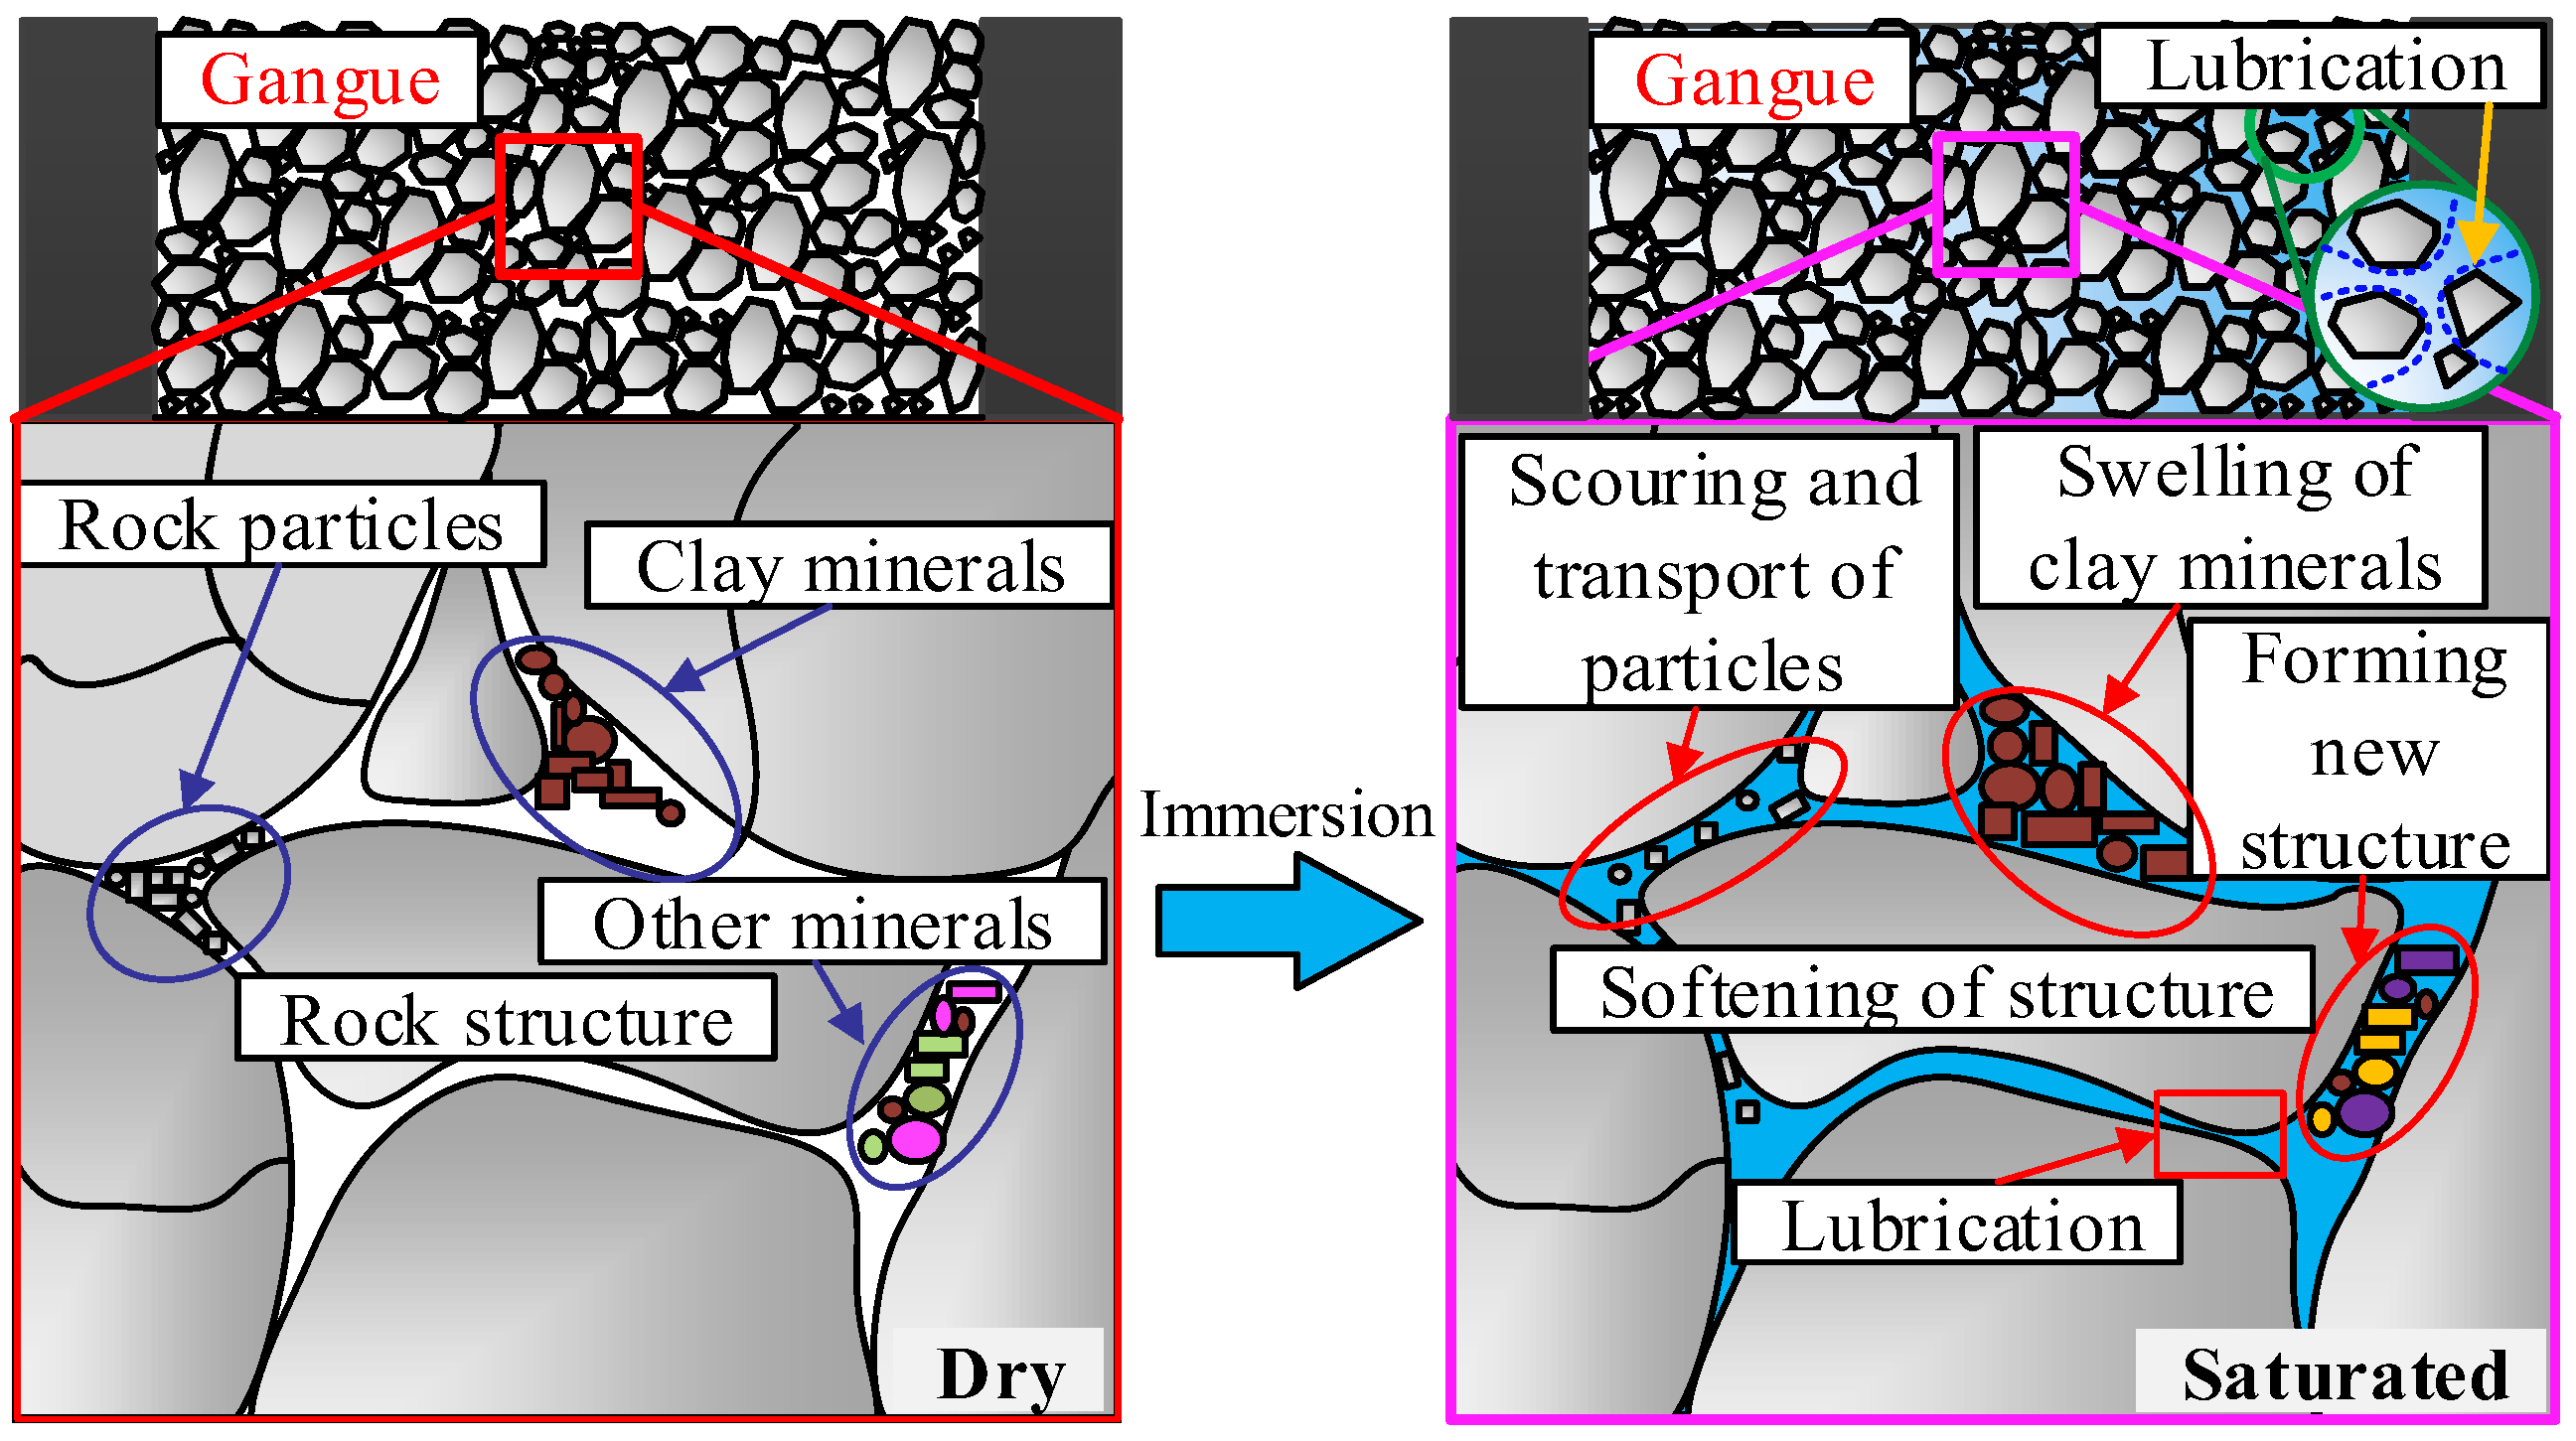
During the safe operation of a coal mine underground reservoir, the water level rises and falls repeatedly [23], which has repeated effects on the gangue of the caving zone, causing uneven expansion and contraction of the gangue and irreversible damage to the bearing and compression capacity of the gangue; this causes changes in the internal structure and void rate of the gangue. At the macro level, the water in the void reduces the friction coefficient between the gangue blocks, causing it to be easier for the blocks to slip. At the micro level, water-rock interactions occur after water enters the rock [24,25]. The water lubricates and scours the rock particles, leading to the softening and argillization of clay minerals. When water enters the mineral lattice, it undergoes a hydration reaction and changes the rock microstructure. The hydrogen or hydroxide ions in water exchange ions and isotopes with mineral ions, causing changes in the mineral composition [26,27,28]. The process of water-rock interaction after gangue soaking is shown in Figure 2.
Most studies only consider the gangue void of the caving zone as the water storage space of the coal mine underground reservoir. However, the overburden fracture space of the fracture zone can also store water. It is rare to combine similar model tests with gangue compaction tests to study the storage coefficient of coal mine underground reservoirs. Moreover, studies on the storage coefficient of coal mine underground reservoirs seldom consider the influence of the water-rock interaction. To improve the research on the storage coefficient of coal mine underground reservoirs and enrich the research results, this study considered caving zone voids and fracture zone fractures as the water storage space of the coal mine underground reservoir. The underground reservoir of typical coal mines in the Shendong mining area in China was the research object. This study conducted physical model tests, analyzed the overburden fracture and movement deformation law under the influence of mining, and explored the caving zone. The evolution law and spatial distribution characteristics of the void between the fracture zone and entire goaf and the distribution law of the gangue block size at different heights of the caving zone were obtained using the physical model test method. Considering that similar materials are easy to disintegrate after encountering water, and that it is impossible to conduct relevant research on water-rock interaction, prototype gangue samples with the same particle size grading as the model caving gangue were prepared. Furthermore, the compaction characteristics and void evolution law of five gangue samples with different immersion times were tested. The research results provide a useful reference for the calculation of the underground reservoir capacity and storage coefficient.

2. Experimental Design

2.1. Test Equipment

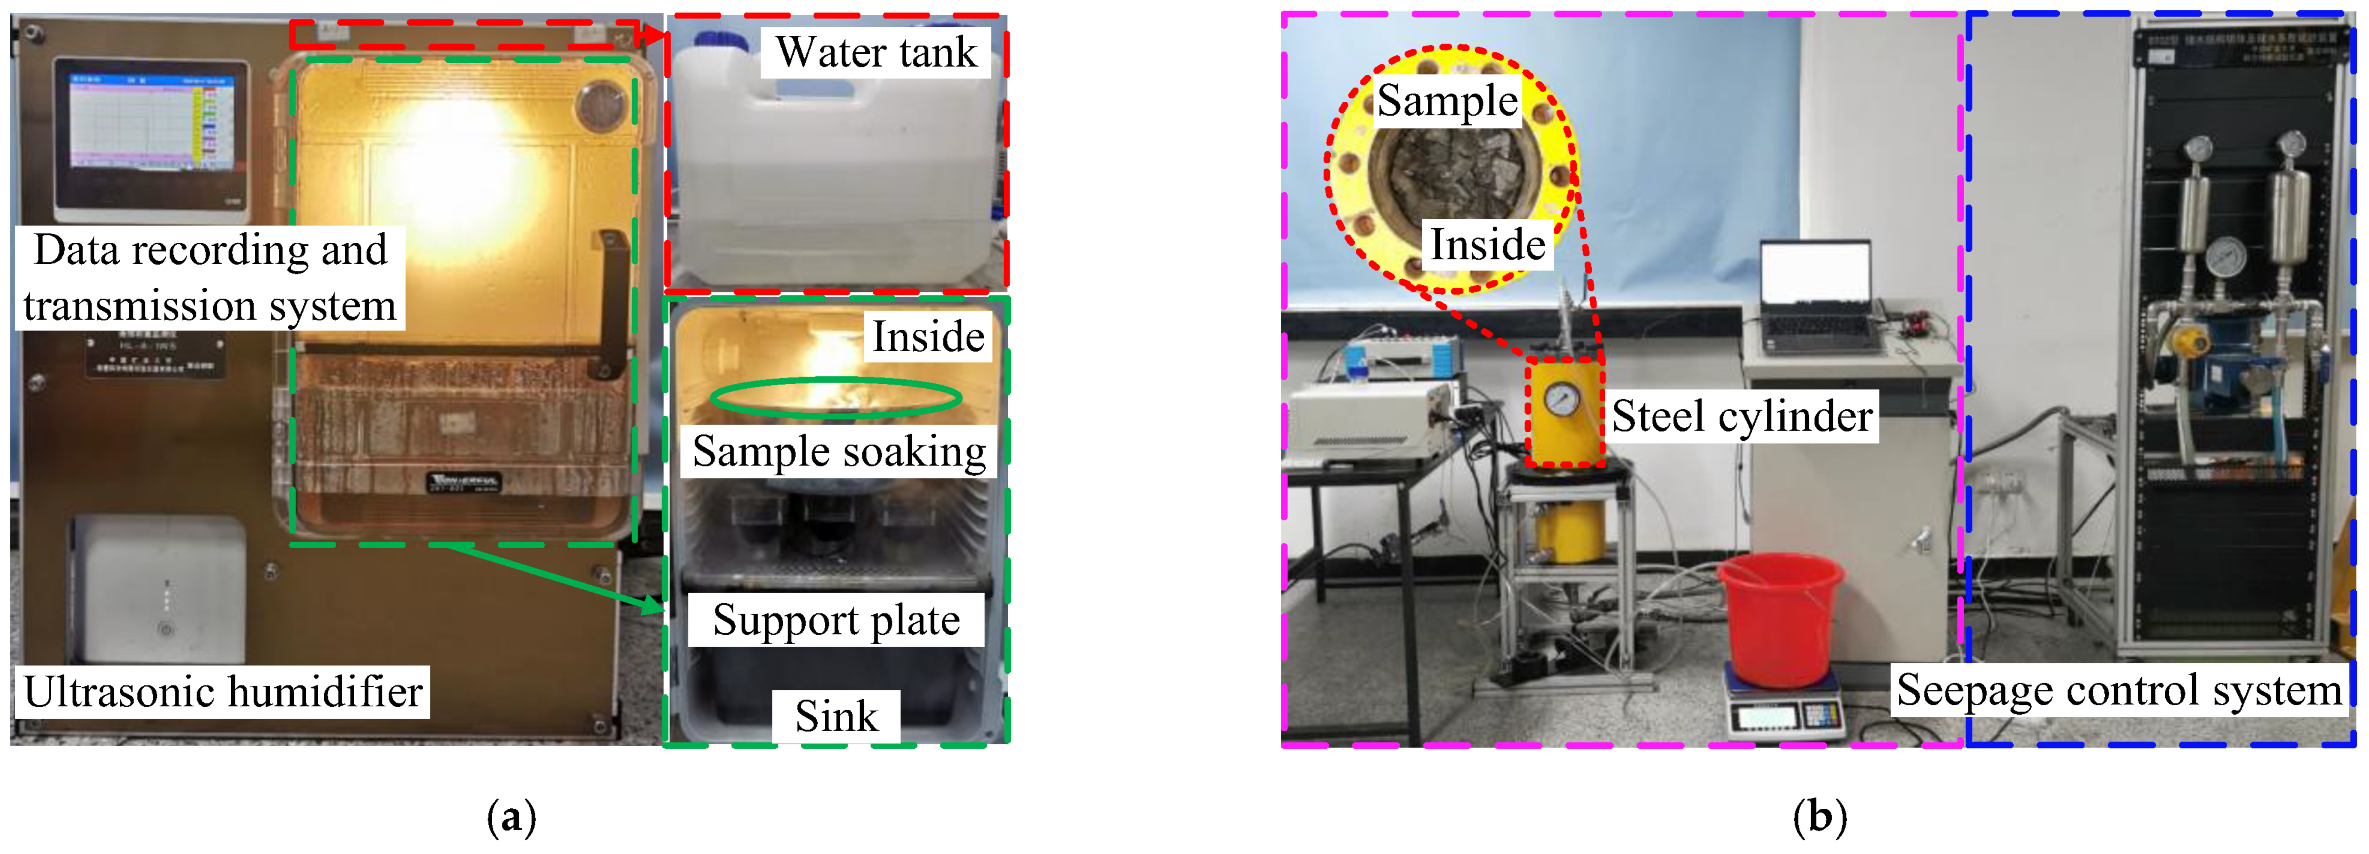
The equipment used for the physical model test included a simulation test-bed and camera; the test-bed was 2.5 m long, 0.2 m thick, and 1.5 m high. The equipment used for the gangue compaction test included a constant-temperature drying oven (101-00B, Changge Mingtu Machinery Equipment Co., Changge, China), an automatic non-destructive water immersion device (ANDWID) [29,30] independently developed by the research group, and a broken rock mechanics and seepage test system (BR-MSTS). The ANDWID is composed of an ultrasonic humidifier, a high-precision stress sensor, a data acquisition and transmission system, and a pumping system, which realize the nondestructive immersion of samples. The BR-MSTS comprises four parts: an axial loading system, sample filling system, seepage control system, and data monitoring and acquisition system. The axial loading system used a constant-flux pump (2PB-1040, Beijing Xingda Technology Development Co., Beijing, China) to provide a hydraulic power supply and the maximum hydraulic pressure was 40 MPa. The sample-filling system consisted of a steel cylinder, top, base, and permeable board. The steel cylinder was a stainless-steel cylinder with an internal diameter of 150 mm, internal height of 250 mm, and thickness of 30 mm. The BR-MSTS is used for conventional compression, conventional seepage, creep compression, and creep seepage tests of broken rocks. In this study, the compression module of the BR-MSTS was used for the gangue compression test. The ANDWID and BR-MSTS are shown in Figure 3a and Figure 3b, respectively.

2.2. Physical Model Construction

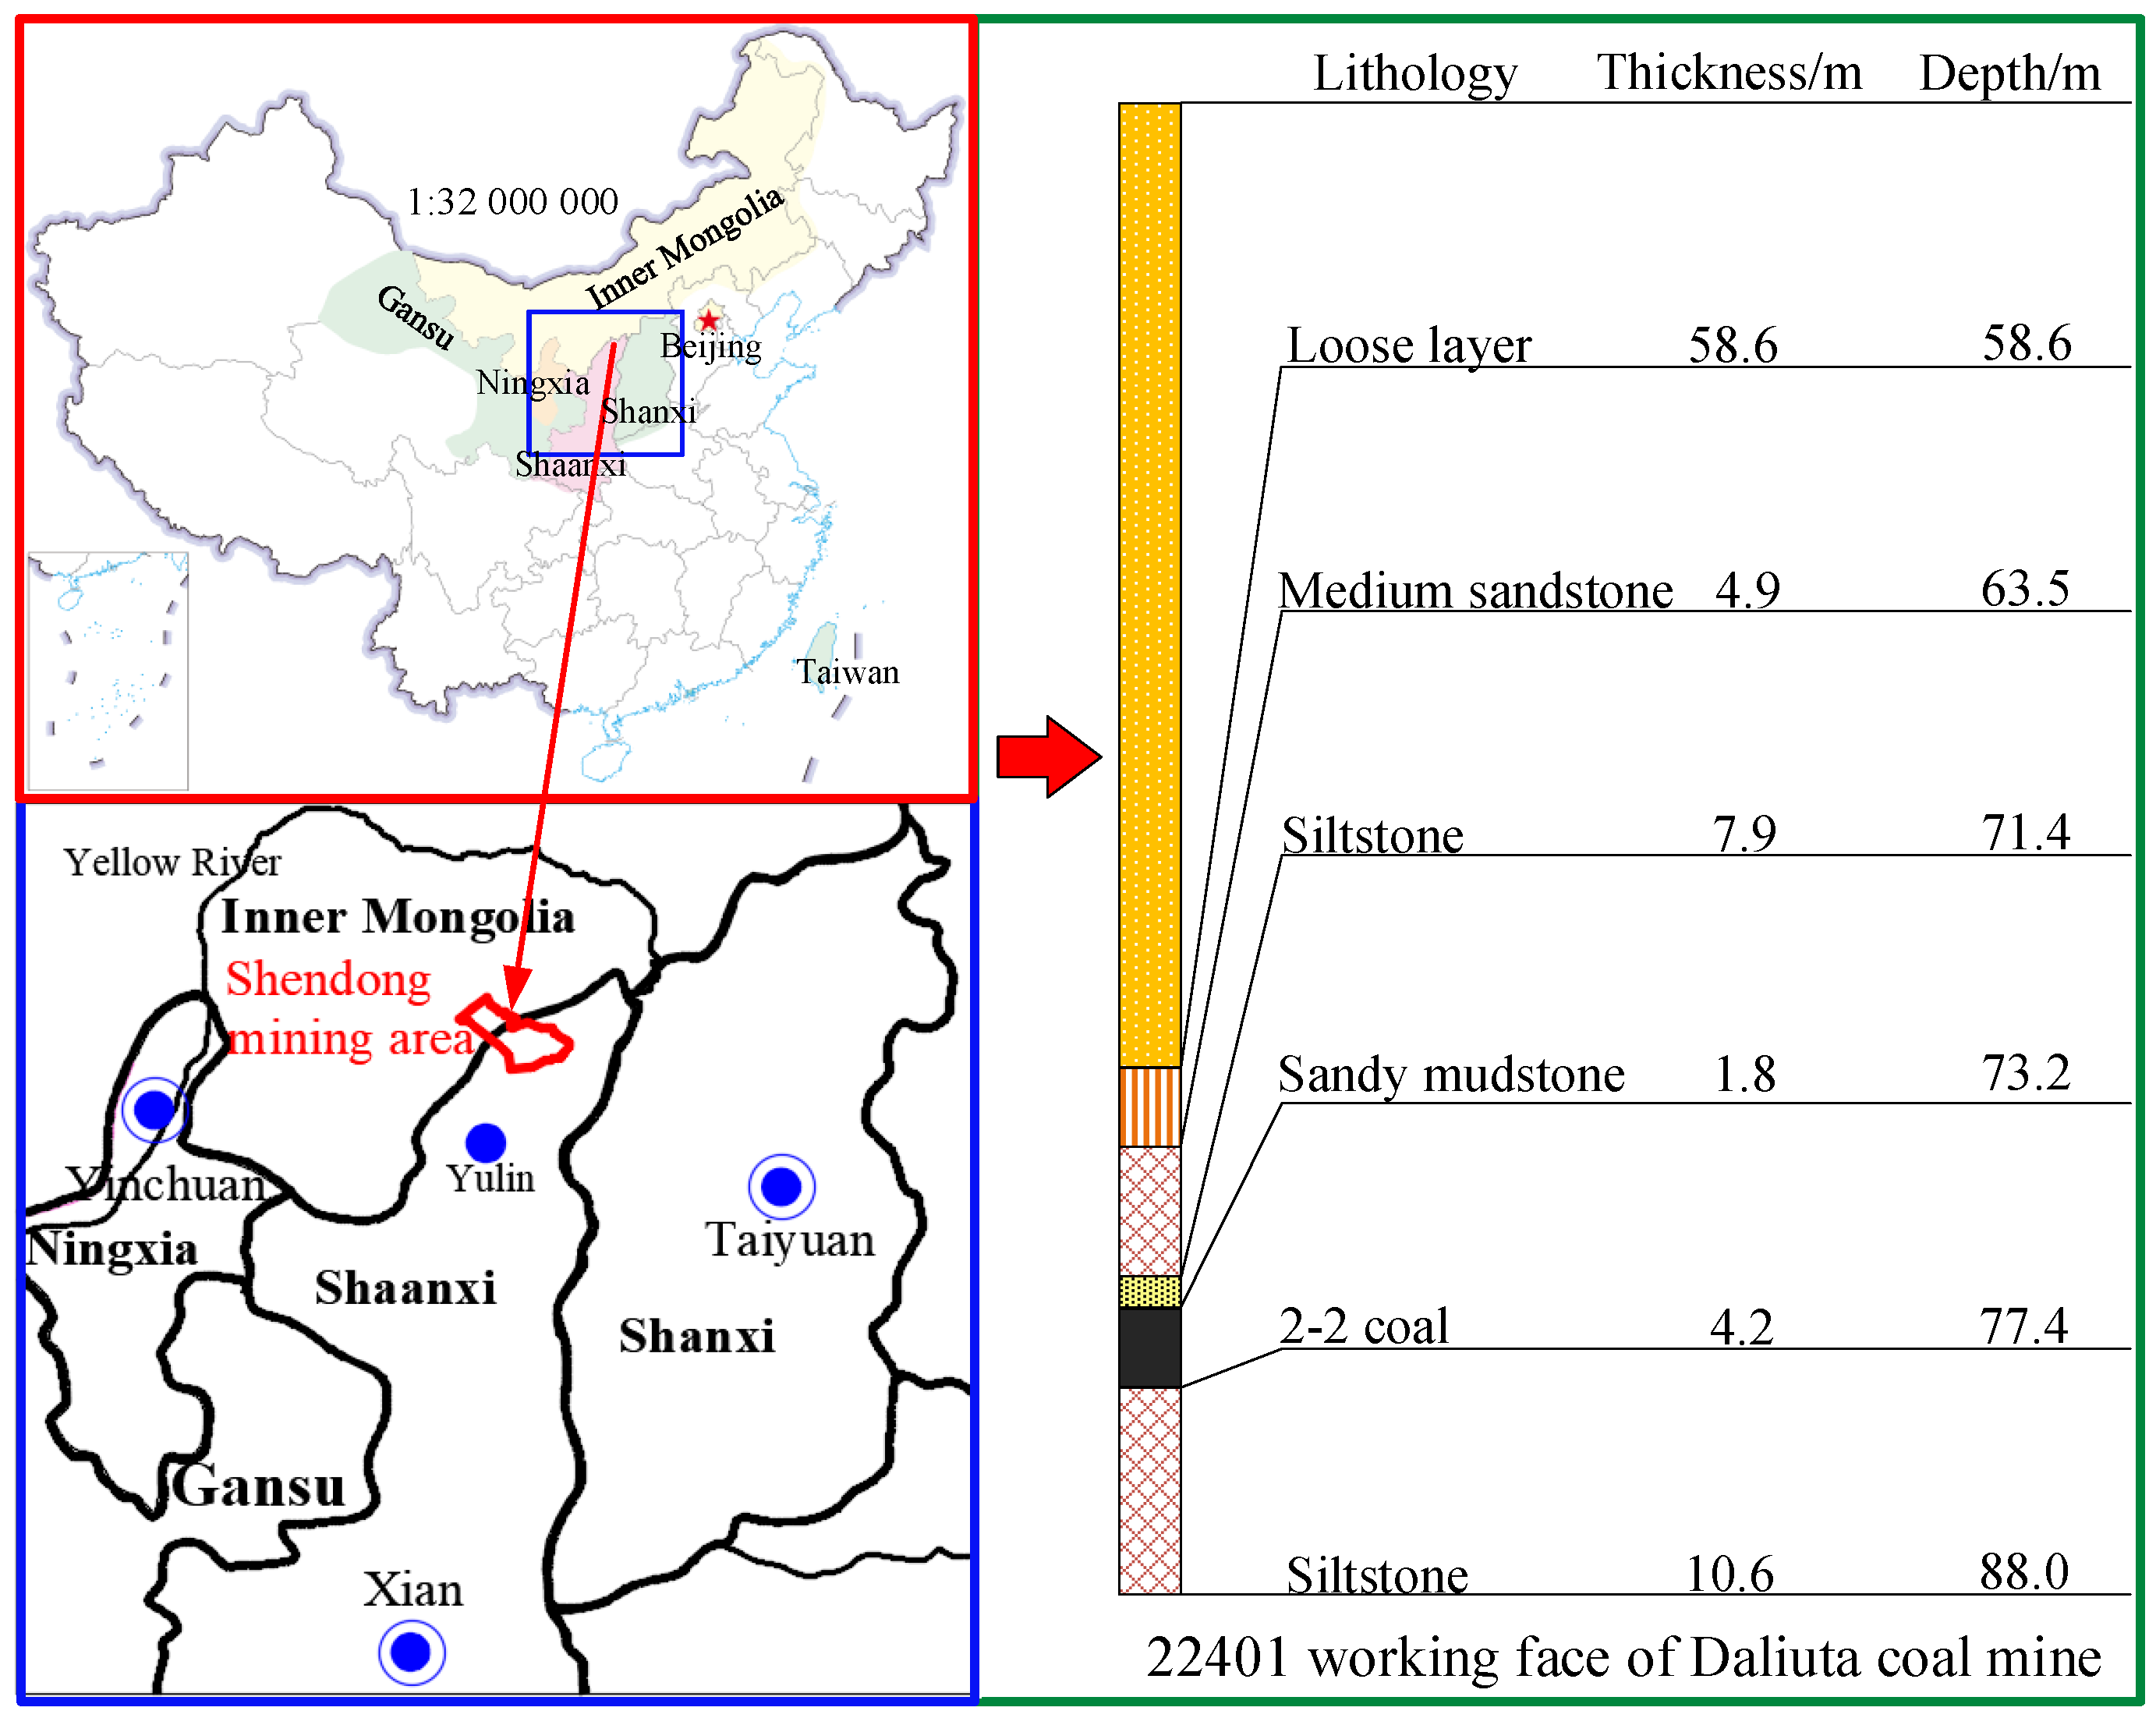
The 22401 working face of the mine in the Shendong mining area is one of the working faces where the No. 1 underground reservoir is located. The water storage capacity of No. 1 underground reservoir is 336.2 × 10⁴ m3 and the water storage height is 4.4 m. The main mining seam 2-2 has a simple structure, with a buried depth of 18.2–128.5 m, an average thickness of 4.0 m, and an inclination of 1–3°. The 22401 working face was selected as the geological prototype for the physical model test. The mining method uses long wall fully mechanized mining. The lithology and thickness of the rock formation are shown in Figure 4.
Based on the similarity principle and dimensional analysis, the model size, material strength, and density should satisfy the following requirements [31,32,33]:
C σ = C l × C ρ
C σ = σ p / σ m ,   C ρ = ρ p / ρ m ,   C l = l p / l m
where Cσ is the strength similarity coefficient, Cl is the size similarity coefficient, Cρ is the density similarity coefficient, subscript p represents the prototype, and subscript m represents the model.
The model size and time meet the following requirements, respectively.
C t = C l
C t = t p / t m
where Ct is the time similarity coefficient.
Use Cl = 150, Cσ = 225, Cρ = 1.5, and Ct = 12.25.
The model was paved to the surface and 25 cm boundary coal pillars were left on both sides to eliminate the boundary effect. The model mining length was 200 cm; that is, the simulated prototype mining length was 300 m. Subsequently, a layer of putty powder was brushed on the outer surface of the model to observe and study the evolution of the overburden cracks during the model excavation. The displacement measuring points were used to monitor the movement and deformation of the overburden during the mining process. The interval between the measuring points in the horizontal direction was 10 cm and that in the vertical direction was 5 cm. Nine rows of measuring points were arranged from the bottom to the top, with 22 for each row.
Referring to the table by Shi et al. [34] for material proportioning, fine sand was selected as the aggregate, gypsum and calcium carbonate were the cementing agents, and water was added for mixing. In each lithology model material, the mass of water accounts for 7% of the total mass of solid materials. The physical and mechanical parameters and compounding ratios of the prototypes and physical models of lithology are listed in Table 1.

2.3. Experimental Scheme

The specific test steps were as follows (Figure 5):
(1)
The actual advancing speed of the working face is 15 m/d and once mining full height. The model is excavated from right to left and advanced forward from the open cut. Based on the actual advancing speed and Ct of the working face, the model was excavated 5 cm every 12 h.
(2)
The camera was fixed at a specific position in front of the model, photographs of the overburden-breaking movement during the test were taken, and binary processing of the model photographs was performed using MATLAB software to obtain the fractal dimension of the model rock mass void.
(3)
To restore the compaction environment of the caving rock mass in the goaf to the greatest extent, a scale was used to measure the gangue block size of the model caving zone and calculate a similar gangue block size ratio of the caving zone. The rock samples were crushed and screened according to similar gangue lumpiness to prepare the gangue samples.
(4)
Using a constant-temperature drying oven and ANDWID, the prepared gangue samples were subjected to drying saturation cycle treatment and five different immersion times of the gangue samples were prepared (immersion 0–4 times); the 0 times immersion was the dry rock sample and immersion 1–4 times was the saturated rock sample. Wang et al. [29,30] were referred to for water immersion process. In the process of drying the saturation cycle treatment, three gangue samples were selected to be weighed separately and the saturated moisture contents of the gangue samples immersed 1–4 times were calculated using Equation (5) [23]. After the three gangue samples were immersed in water for the first time and weighed, their volume was measured by the drainage method (the saturated samples no longer absorbed water and the volume of the discharged water was the volume of the gangue samples). The densities of the gangue samples with different immersion times were obtained by dividing the mass and volume of the gangue samples with different immersion times.
(5)
The BR-MSTS was used to conduct compression tests on the gangue samples with five different immersion times. The pumping rate of the advection pump was 10 mL/min and the sampling frequency of the pressure and displacement sensors was 2 Hz.
w s n = 1 3 i = 1 3 1 m i d m i s n m i d × 100 %
where wsn is the saturated moisture content when immersed n times, mid is the mass of the ith sample when dry, and misn is the mass of the ith sample when immersed in water n times.
The voids of the saturated gangue sample gradually decreased during the loading deformation process. Because the steel cylinder is a closed space, the void between the gangue is gradually compacted if excess water cannot be discharged. As the load continued to increase, the water produced a large pore water pressure on the gangue sample, reducing the effective stress of the gangue sample and changing its compaction mechanical characteristics. To avoid this, the seepage channel above the steel cylinder was opened so that excess water could be discharged through the water pipe.

3. Deformation and Failure Process of Mining Overburden and Evolution Law of Water Storage Space

3.1. Breaking Motion Law

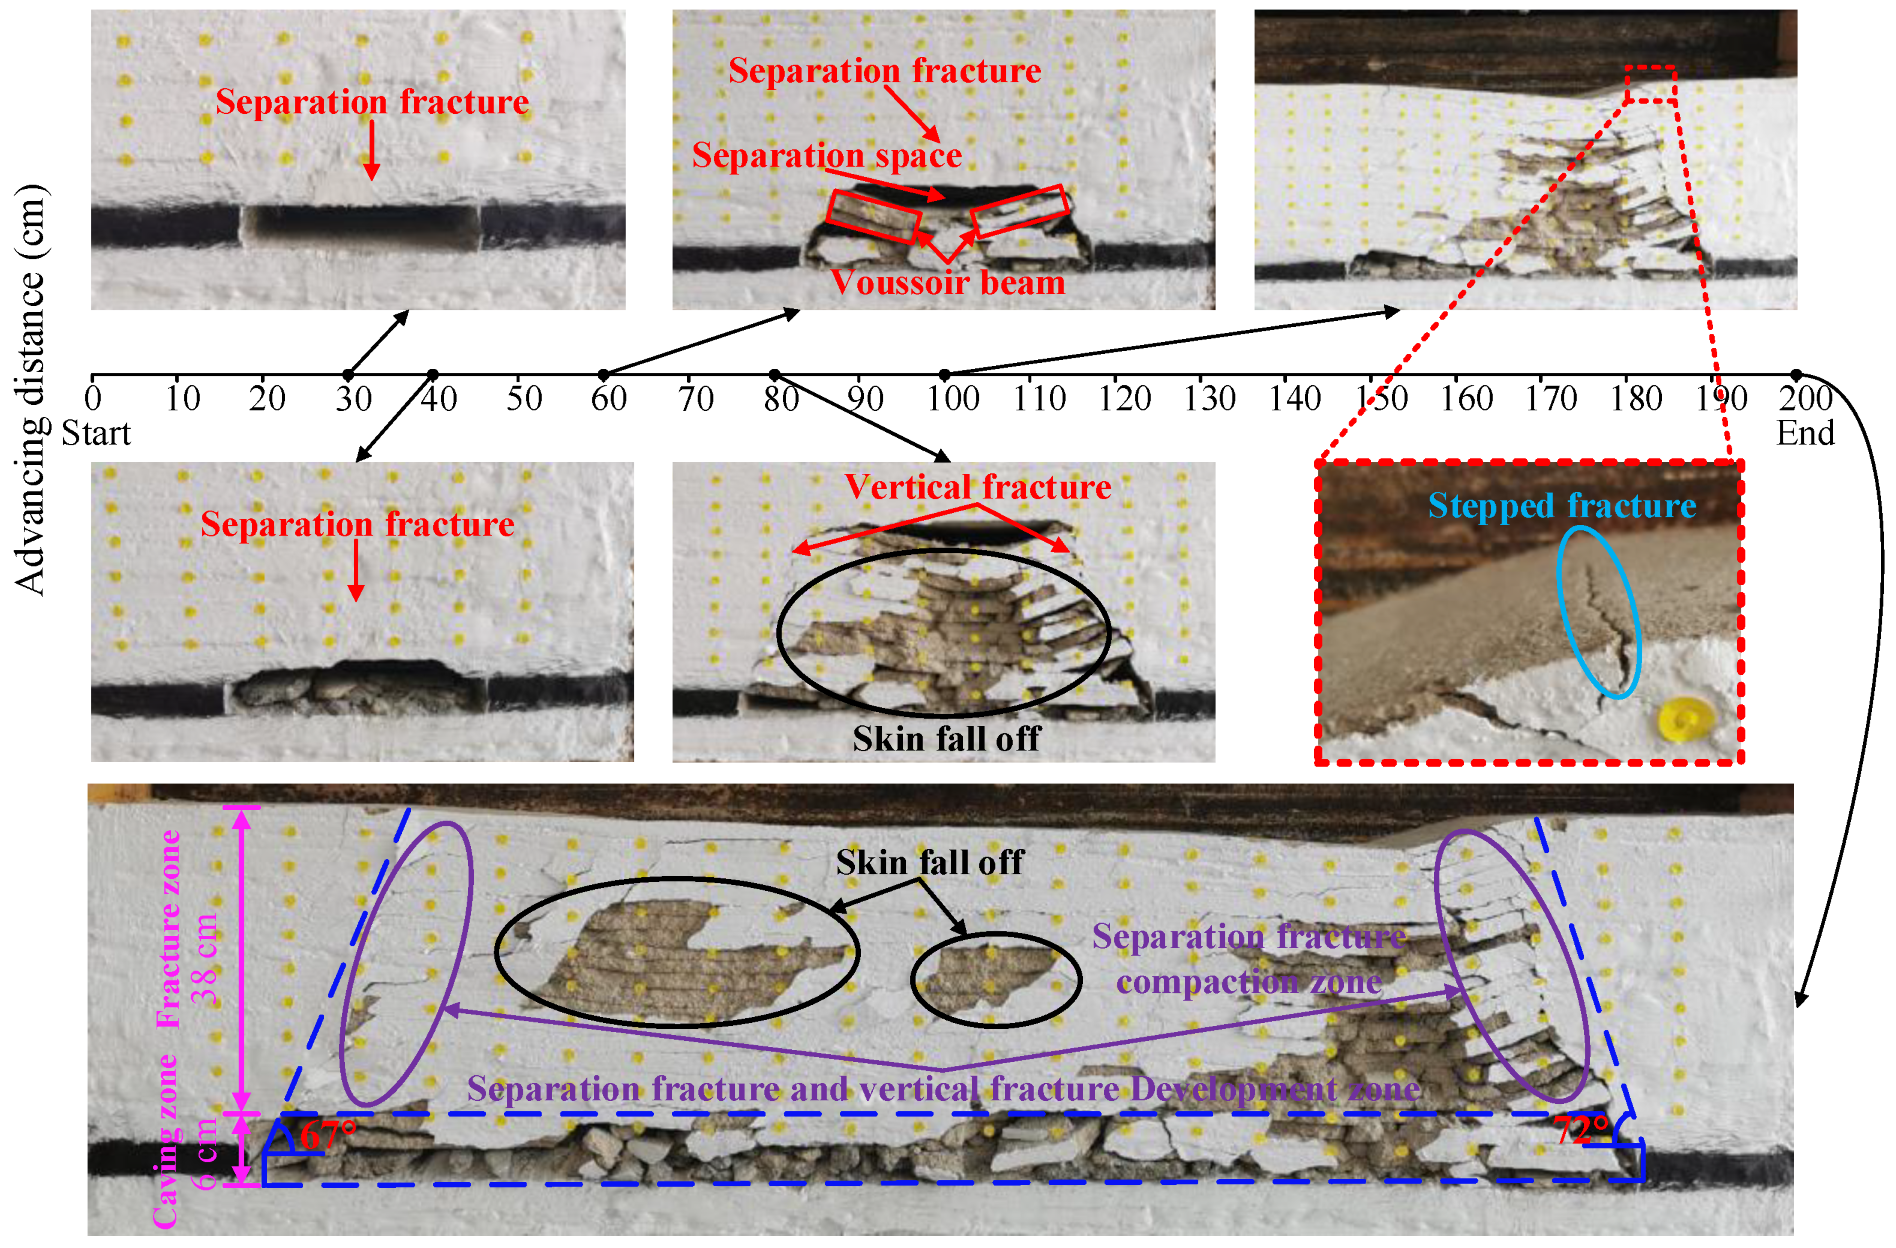
Figure 6 shows the fracture evolution law of the overburden structure during the process of advancing the working face of the model. When the working face advanced by 30 cm, the immediate roof did not cave but a separation fracture began to appear above it under the action of geostatic and tensile stress. When the working face advanced by 40 cm, the immediate roof caved for the first time and a separation fracture developed 11 cm above the coal seam roof. The main roof caved for the first time when the working face advanced by 60 cm. The immediate roof began to cave during mining. The main roof on both sides of the goaf formed a masonry beam structure. The caving height was 12 cm from the coal seam roof, forming a large separation space within the upper rock formation. The separation fracture increased to 20 cm above the roof of the coal seam. When the working face advanced by 80 cm, the first periodic caving of the main roof occurred. The caving step distance was 20 cm, caving height was 32 cm, separation fracture rose to 40 cm above the coal seam roof, and vertical fractures were generated on both sides of the goaf to connect with the caving zone. When the working face advanced by 100 cm, the main roof caved periodically for a second time. The vertical fractures on both sides of the goaf ran through the surface, the top rock formation slid downward, and the surface exhibited stepped fracture. As the working face continued to advance, the immediate roof caved periodically with an average caving step of 20 cm. The geostatic stress of the upper rock formation was greater than that of the lower caved rock formation and the separation space of the rock formation was gradually compacted. When the working face advanced by 200 cm, the overburden rock presented a “two zone” structure of the caving and fracture zones. The height of the caving zone was 7 cm and the fracture ran through the ground. The fracture angle of the overburden rock at the side of the open cut was 72° and that of the coal wall side of the working face was 67°. The two sides of the fracture zone were the separation and vertical fracture development zones and the middle was the separated fracture compaction zone. Apart from the caving zone, the separation on both sides of the separation and vertical fracture development zones also had a large water storage space.
It is worth noting that, during the excavation process, the skin fell off owing to the influence of the disturbance. This may have been caused by excessively thick putty powder. The skin fell off causing the displacement measuring point at this position to fall; however, there was a drop trace. To avoid affecting the displacement monitoring results, the displacement measurement points should be replenished at the location of the falling trace after the excavation is completed.

3.2. Movement and Deformation Characteristics

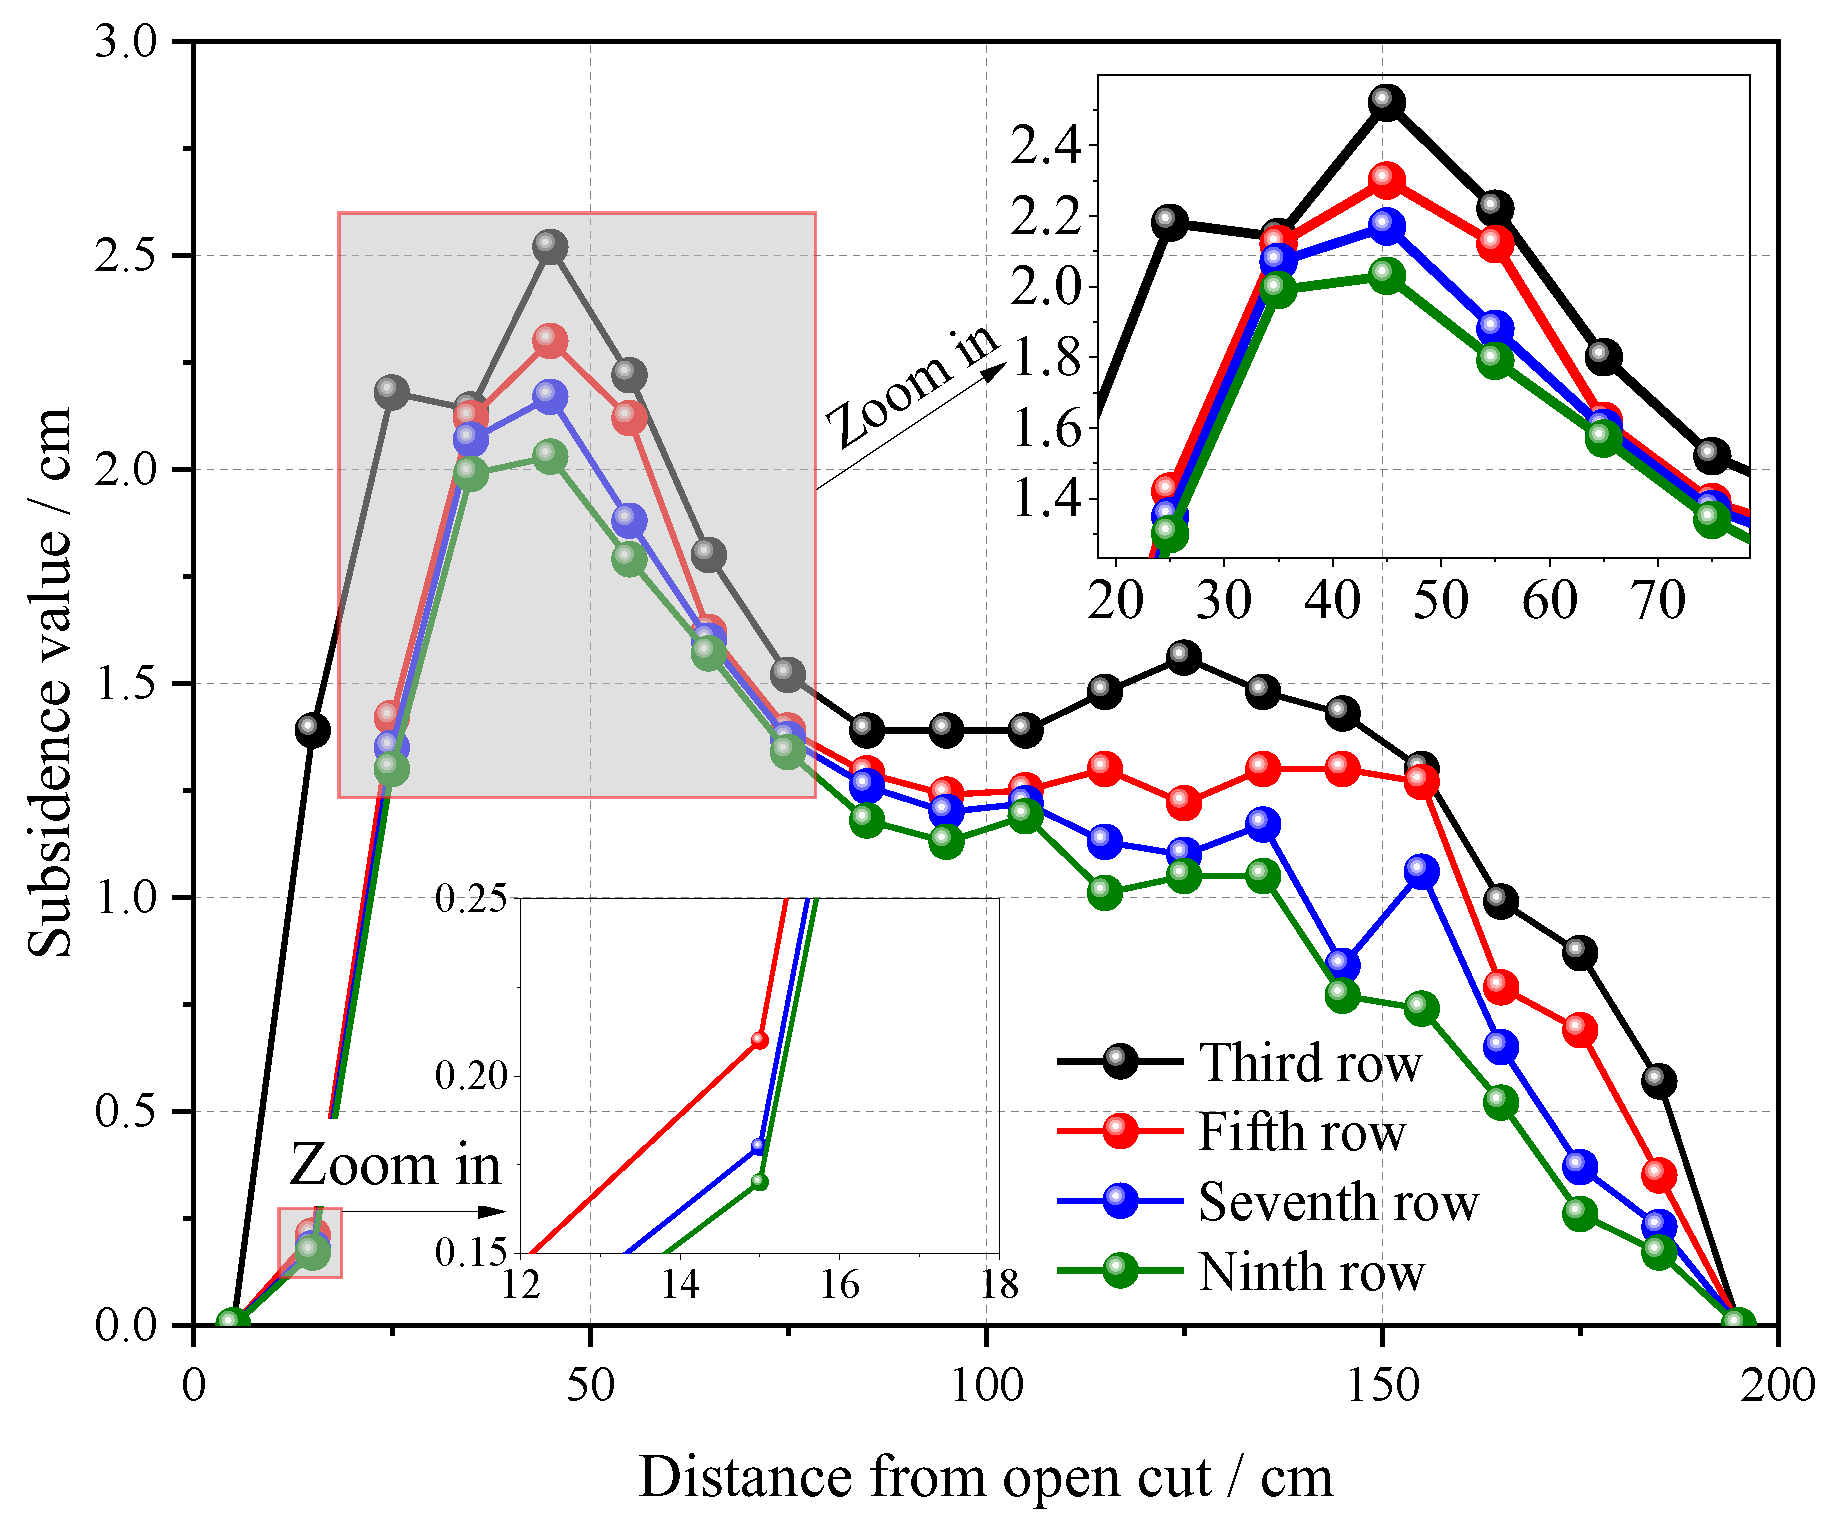
Coal mining causes differential movement of the overburden. Using the displacement change of the third, fifth, seventh, and ninth rows of the measuring points (15, 25, 35, and 45 cm, respectively, from the coal seam roof before mining) as an example, the overburden subsidence curve after the completion of the model mining is obtained through geometric conversion, as shown in Figure 7. Evidently, a positive value indicates that the vertical ground movement is from top to bottom in the direction.
As shown in Figure 7, after the completion of the model mining, the subsidence values of the rock strata in different layers are distributed in an asymmetric manner in the form of “∩”, and the subsidence values of the rock strata gradually decrease from the middle zone of the goaf to both sides. Using the center of the goaf as the dividing line, the breaking movement law of the overburden on both sides of the model is not completely consistent. The subsidence value of different strata in the middle zone of the goaf, which is inclined to the side of the open cut, is greater than that of the side of the working face and the maximum subsidence value is 45 cm away from the open cut. This is because there is a 39.1-cm-thick loose layer above the overburden, accounting for 80.1% of the overall overburden thickness. The mechanical properties of the loose layer are poor and the bearing structure formed during the migration process is unstable. Consequently, the weight of the loose layer mostly acts on the bedrock [35], resulting in a large degree of breakage and subsidence of the overburden in the early mining period. This can also be observed in Figure 6 (the working face is advanced by 200 cm). Similarly, this is also the reason why the fracture angle of the overburden rock at the side of the open cut is larger than that of the coal wall side of the working face. The subsidence values of the different strata gradually decrease with an increase in the vertical height. The maximum subsidence values of the third, fifth, seventh, and ninth rows of the measuring points were 2.52, 2.30, 2.17, and 2.03 cm, respectively. From the third to ninth row of the measuring points, the maximum subsidence values decreased by 0.49 cm, which was a 19.4% decrease. This is because coal mining causes the rock formation to break and cave and a fracture space is formed between the rock strata. The overburden geostatic stress of the lower rock formation was greater than that of the upper rock formation, the compression degree of the fracture space was greater, and the subsidence value was greater.

3.3. Fractal Characteristics of Water Storage Space

The fractal dimension is a significant parameter for quantitatively characterizing the irregularity of complex shapes and reflects the effectiveness of the space occupation of complex shapes [36,37,38]. The complexity of the fracture field and occupation characteristics of the fractures can be expressed in the physical model test. Therefore, the fractal dimension is of great significance for quantitatively describing the evolution of mining-induced fractures. The box-counting method is often used to study the fracture fractals of mining rock masses. In this study, the box-counting method was used to cover the crack with a square whose side length was r, enlarge or reduce the size of the square in proportion, and calculate the number of squares required to cover the crack N(r) [39,40]. If the fracture network has fractal characteristics, the relationship between N(r) and r satisfies the following equation [41]:
N ( r ) = r D
where D is the fractal dimension.
Using the logarithms of N(r) and r in Equation (6), we obtain:
D = lg N ( r ) lg r
As expressed in Equation (7), there is a linear relationship between lgN(r) and lgr and the slope of the lgN(r)–lgr relationship curve is –D.
The fracture image contains a large amount of color information, which interferes with the fracture extraction and quantitative calculations. Therefore, the fracture images should be digitally processed to ensure accurate fracture image information [42]. The surface photograph of the physical model is an RGB color image. First, the RGB color image was converted into a 256-color grayscale image, which is a two-dimensional matrix of pixels whose elements are grayscale values [43].
F ( x , y ) = f ( 1 , 1 ) f ( 1 , 2 ) f ( 1 , m ) f ( 2 , 1 ) f ( 2 , 2 ) f ( 2 , m ) f ( n , 1 ) f ( n , 2 ) f ( n , m )
where F(x, y) is the pixel matrix; (x, y) are the row and column of the pixel matrix, respectively; f(x, y) is the gray value of the pixel matrix x row y column; and n and m are the number of rows and columns of the grayscale image pixel matrix, respectively.
In the grayscale image, a grayscale value of 0 represents all black images and 255 represents all white images. The grayscale image was binarized according to Equation (9).
g ( x , y ) = 0 f ( x , y ) < T 255 f ( x , y ) T
where g(x, y) is the gray value after image binarization and T is the gray threshold.
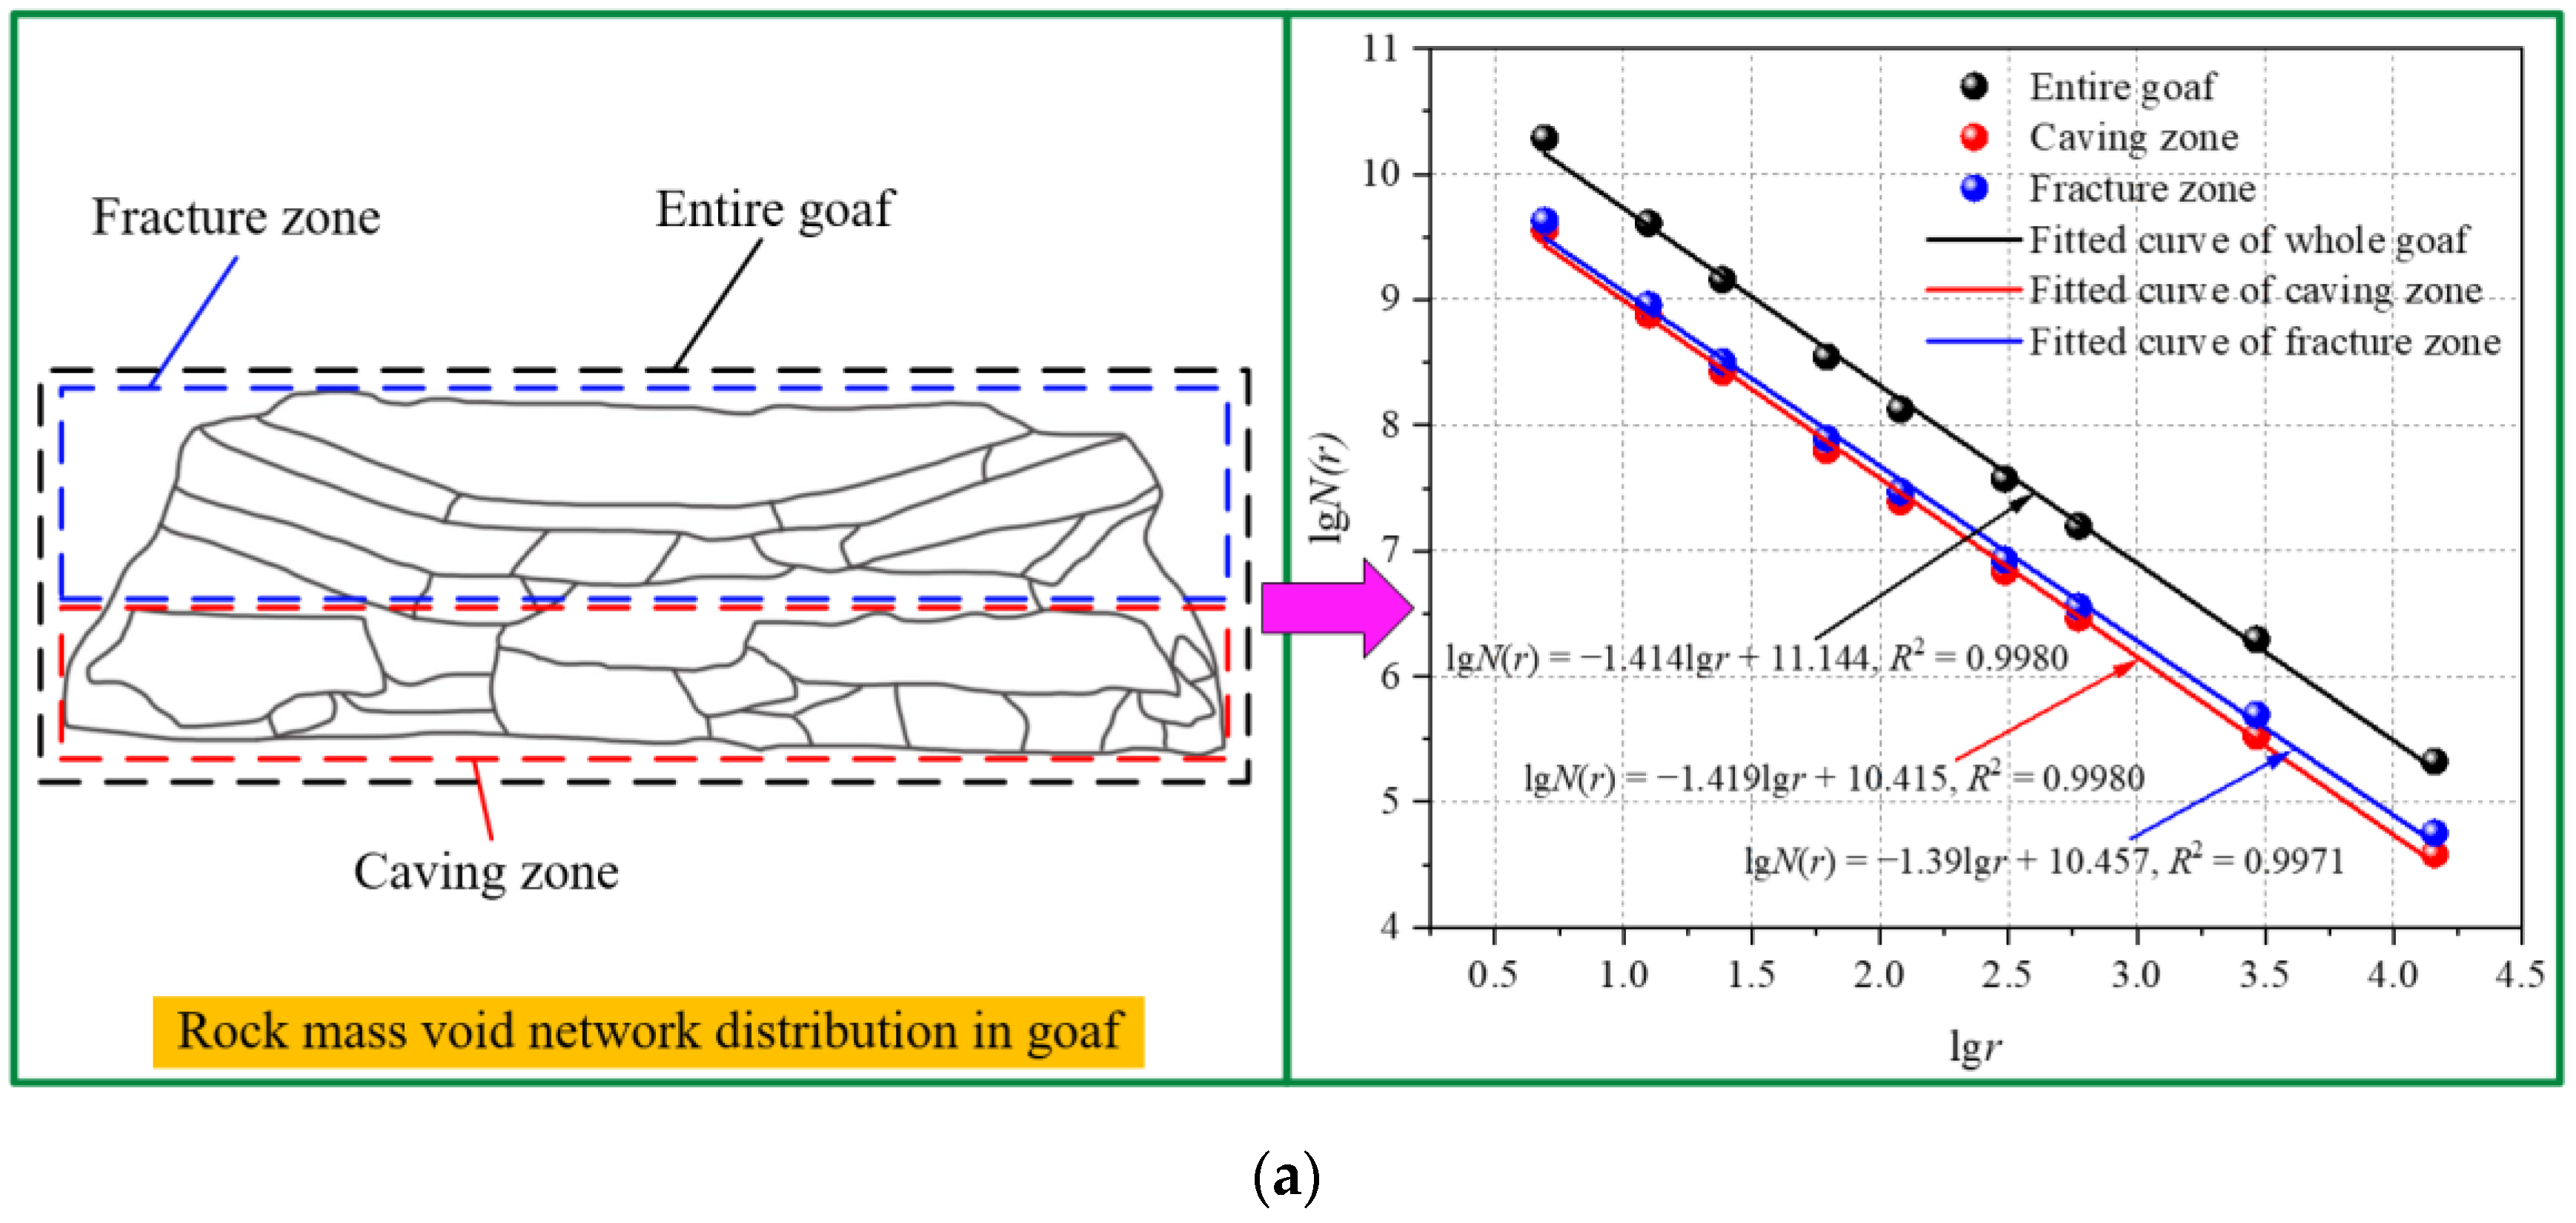
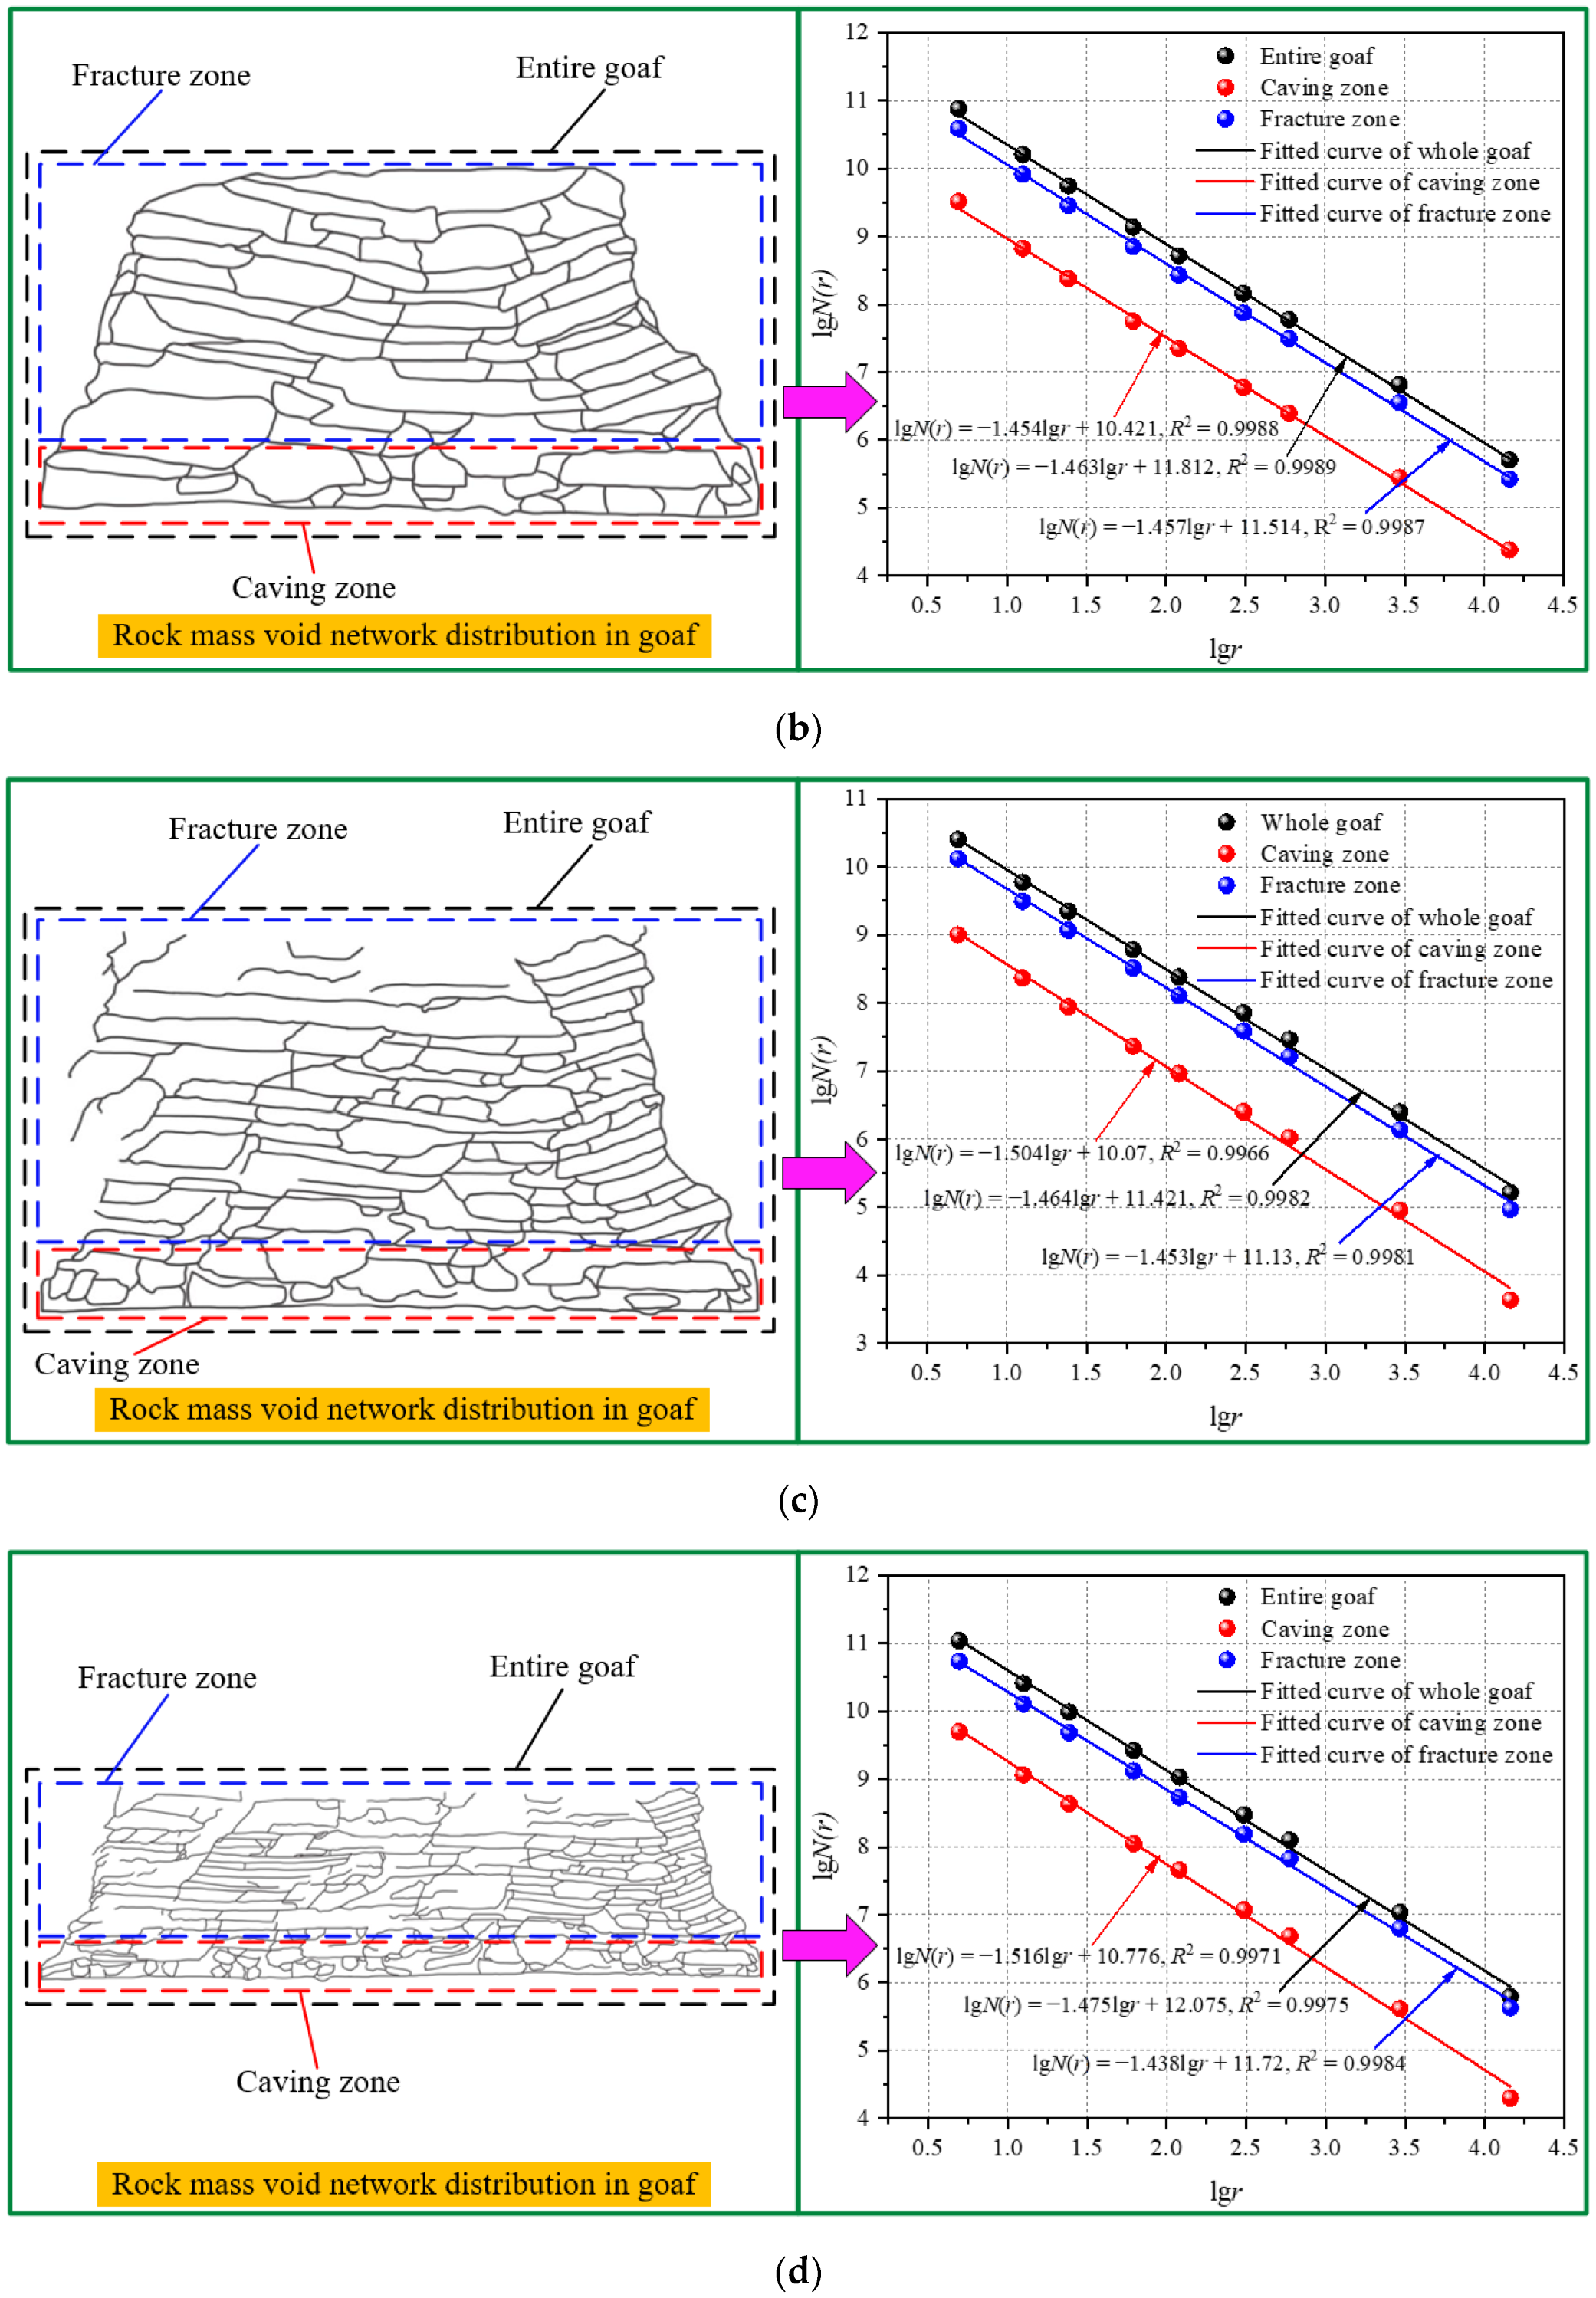
First, Photoshop software was used to remove the interference and sketch the photos of different working face advance distances (60, 80, 100, 120, 160, 180, and 200 cm) [44], depict the distribution of the rock mass void network, and save it as an RGB pixel format file. Subsequently, MATLAB software was used to convert the RGB image into a grayscale image and, based on Equation (8), T was adjusted to obtain a binary image of the physical model. Finally, the fractal dimension of the binary image was calculated using the Fraclab toolbox in MATLAB software [45]. Using the above method, the fractal dimensions of the rock mass voids of the entire goaf, caving zone, and fracture zone were calculated. The calculation process of the fractal dimension is shown in Figure 8 (using the models with 60, 80, 100, and 200 cm working face advances as examples).
As shown in Figure 8, when the working face was advanced by 60 cm, the fractal dimensions of the rock mass voids of the entire goaf, caving zone, and fracture zone were 1.414, 1.419, and 1.39, respectively. When the working face was advanced by 80 cm, the corresponding three fractal dimensions were 1.463, 1.454, and 1.457, respectively. When the working face was advanced by 100 cm, the corresponding three fractal dimensions were 1.464, 1.504, and 1.453, respectively. When the working face was advanced by 200 cm, the corresponding three fractal dimensions were 1.475, 1.516, and 1.438, respectively.
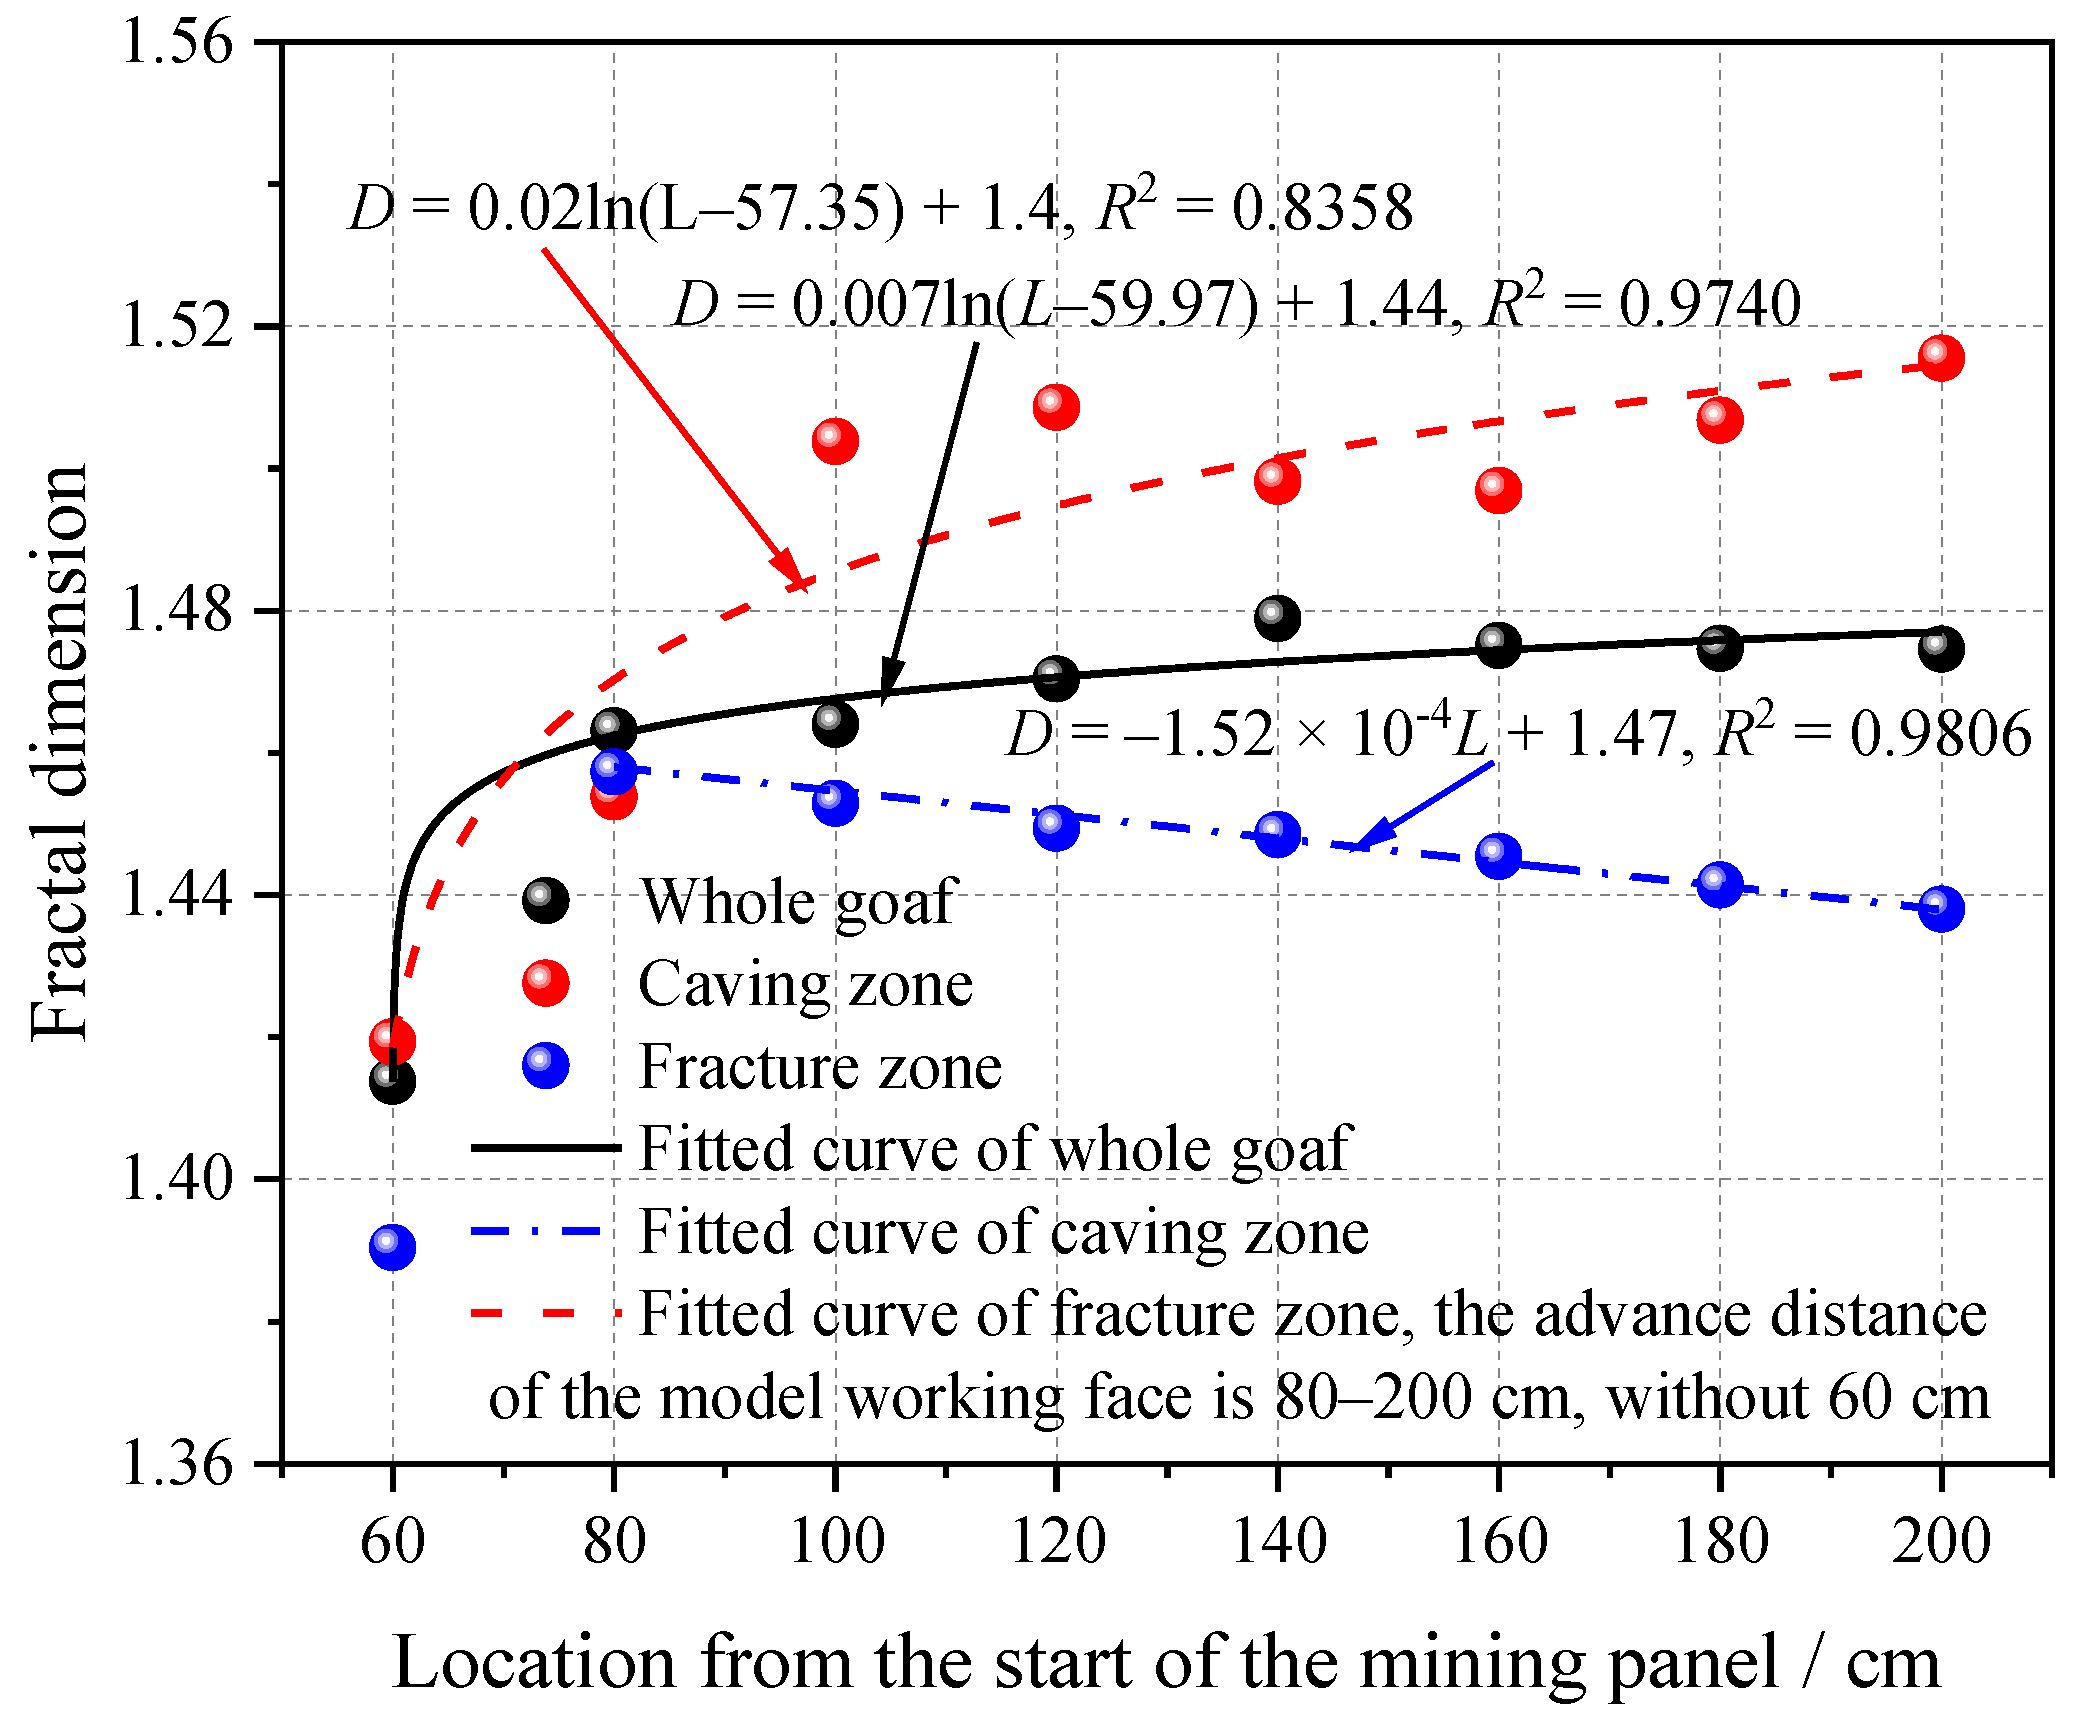
The evolution rule of the fractal dimension of the rock mass voids of the entire goaf, caving zone, and fracture zone with the advancing distance of the working face obtained by the box-dimension method is shown in Figure 9.
It can be observed from Figure 9 that the fractal dimensions of the rock mass voids of the entire goaf, caving zone, and fracture zone are quite different. For the same advance distance of the working face, the fractal dimension of the rock mass void of the caving zone is the largest, followed by the entire goaf, and the fracture zone is the smallest. The rock mass of the caving zone is formed by the free caving of the coal seam roof after it is broken. The caving rock mass was arranged freely, the void distribution was disordered, and the fractal dimension was relatively large. The fracture zone includes the top separation fracture zone, separation and vertical fracture development zones on both sides, and the middle separation fracture compaction zone. The fracture space was mainly concentrated in the separation fracture, separation, and vertical fracture development zones. The fracture space in the separation fracture compaction zone was small. Because the separation fracture compaction zone was the largest, the fracture space and fractal dimension were relatively small. The entire goaf included the caving and fracture zones. The fractal dimension of the rock mass void was determined by both the caving and fracture zones; therefore, the fractal dimension lies between the caving and fracture zones. Because the fractal dimension of the rock void in the caving zone was larger than that of the fracture zone, the fractal evolution characteristics of the entire underground reservoir were mainly affected by the caving zone. With an increase in the advancing distance of the working face, the fractal dimension of the rock mass void of the caving zone and the entire goaf increased logarithmically. The working face was advanced from 60 to 200 cm and the fractal dimension of the rock mass void of the caving zone increased from 1.419 to 1.516, an increase of 6.8%. The fractal dimension of the rock mass void of the entire goaf increased from 1.414 to 1.475, an increase of 4.3%. During the process of advancing the working face, the voids in the caving zone gradually increased. The caving rock mass formed an articulated structure that was difficult to compact. The compaction rate of the void was less than the expansion rate, which was more complex overall, and the fractal dimension continued to increase. The advancing distance of the working face was from 60 to 80 cm and the fractal dimension of the rock mass void increased rapidly, from 1.391 to 1.457, an increase of 4.7%. The advancing distance of the working face was from 80 to 200 cm and the fractal dimension of the rock mass void decreased linearly from 1.457 to 1.438, a decrease of 1.9%. At the initial stage of mining, the overburden fractures were generated and rapidly extended, the complexity of the fractures increased, and the fractal dimension increased rapidly. With the advancement of the working face, the separation fractures began to be compacted and closed under the overburden gravity stress, and new fractures began to emerge and develop again; this situation circulated periodically. The fracture compaction rate was greater than the expansion rate, as shown by the continuous reduction in the fractal dimension.

4. Compaction Characteristic Damage and Void Evolution Characteristics of Gangue under Repeated Drying-Wetting Conditions

During the safe operation of the coal mine underground reservoir, the repeated rise and fall of the mine water level occurs, which causes repeated damage to the caving gangue of the underground reservoir, weakening the gangue compaction characteristics. Under the effect of the overburden stress, changes occur in the void structure and space of the gangue, affecting the storage capacity of the underground reservoir. Because the similar materials that were used contained gypsum and calcium carbonate, which easily disintegrate in water, it is impossible to conduct research on water-rock interactions. Therefore, it is necessary to use a prototype gangue to study the influence of repeated drying-wetting on the compaction characteristics and void evolution of the gangue.

4.1. Preparation of the Gangue Sample

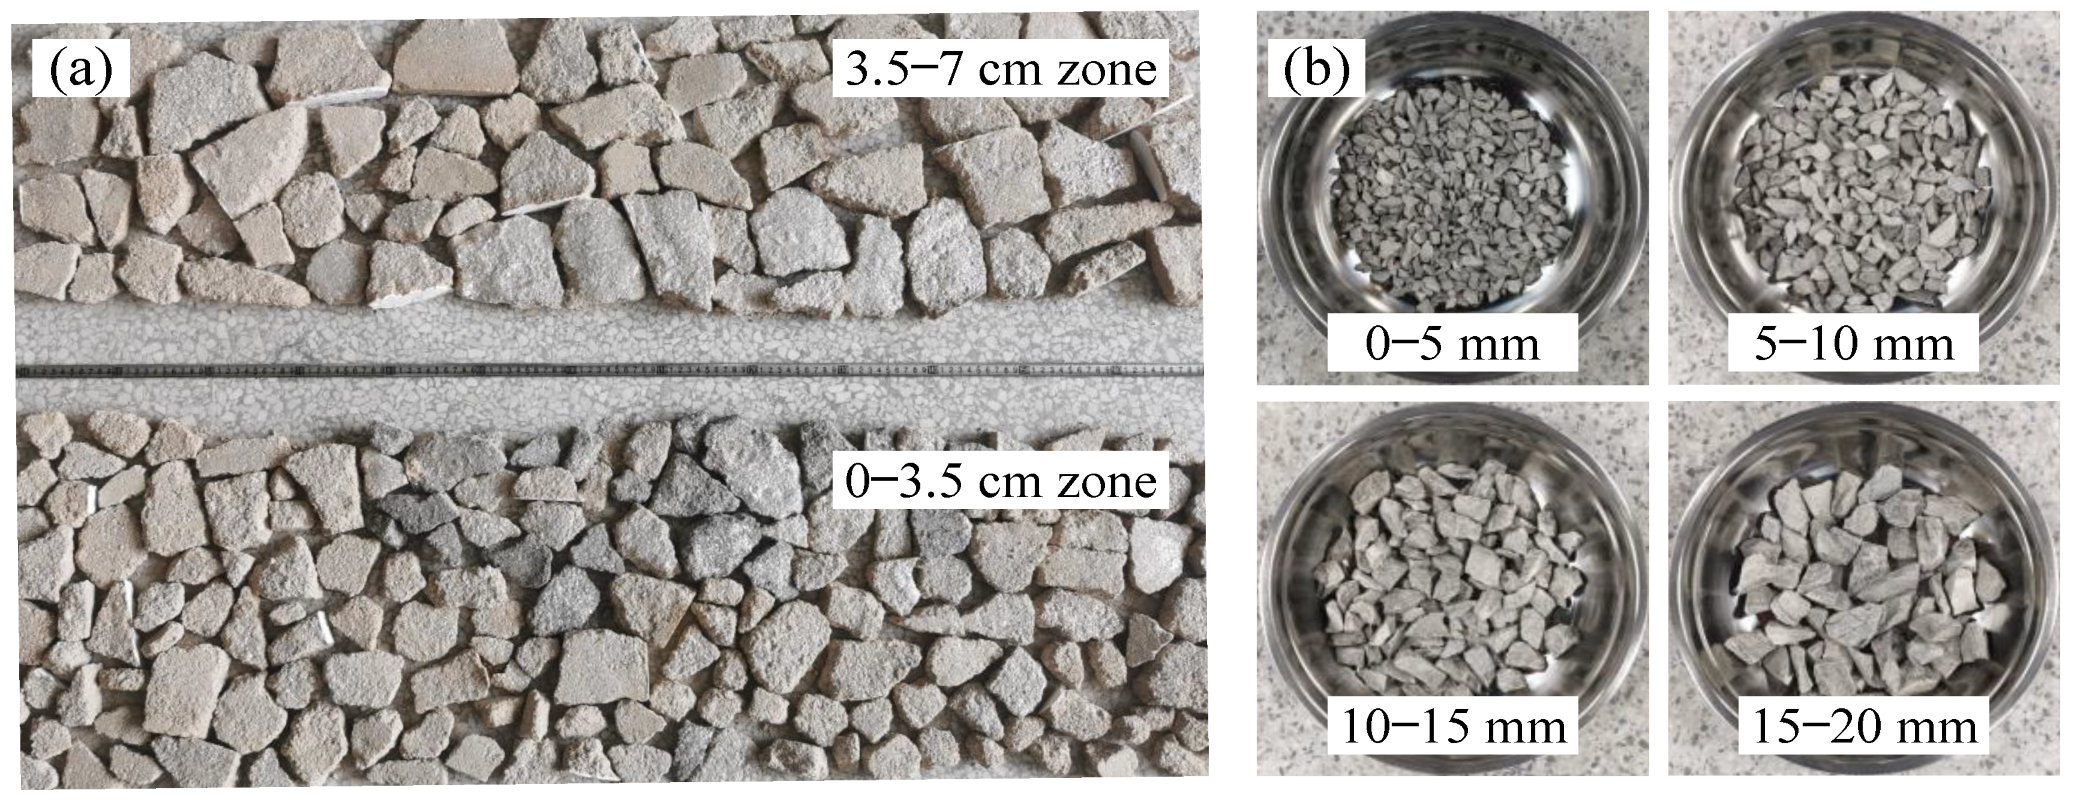
According to the caving zone height of the physical model after mining, the caving zone is divided into two areas, 0–3.5 cm and 3.5–7 cm, and the similar gangue and its lumpiness ratio are presented in Figure 10a and Table 2, respectively.
When the height of the model caving zone was multiplied by Cl, the prototype caving zone height was 10.5 m. By comparing the lithology and thickness in Table 1, it can be observed that, from the gangue of the caving zone, the proportions of sandy mudstone, siltstone, and medium sandstone are 17.1%, 75.2%, and 7.7%, respectively, and the proportion of siltstone is much higher than that of the sandy mudstone and medium sandstone. Therefore, the field prototype siltstone was selected and, according to the gangue lumpiness ratio in Table 2, the gangue sample grain size grading was determined to be 0–5, 5–10, 10–15, and 15–20 mm, respectively, as shown in Figure 10b. Refer to test step (4) to prepare gangue samples with zero–four times immersion.
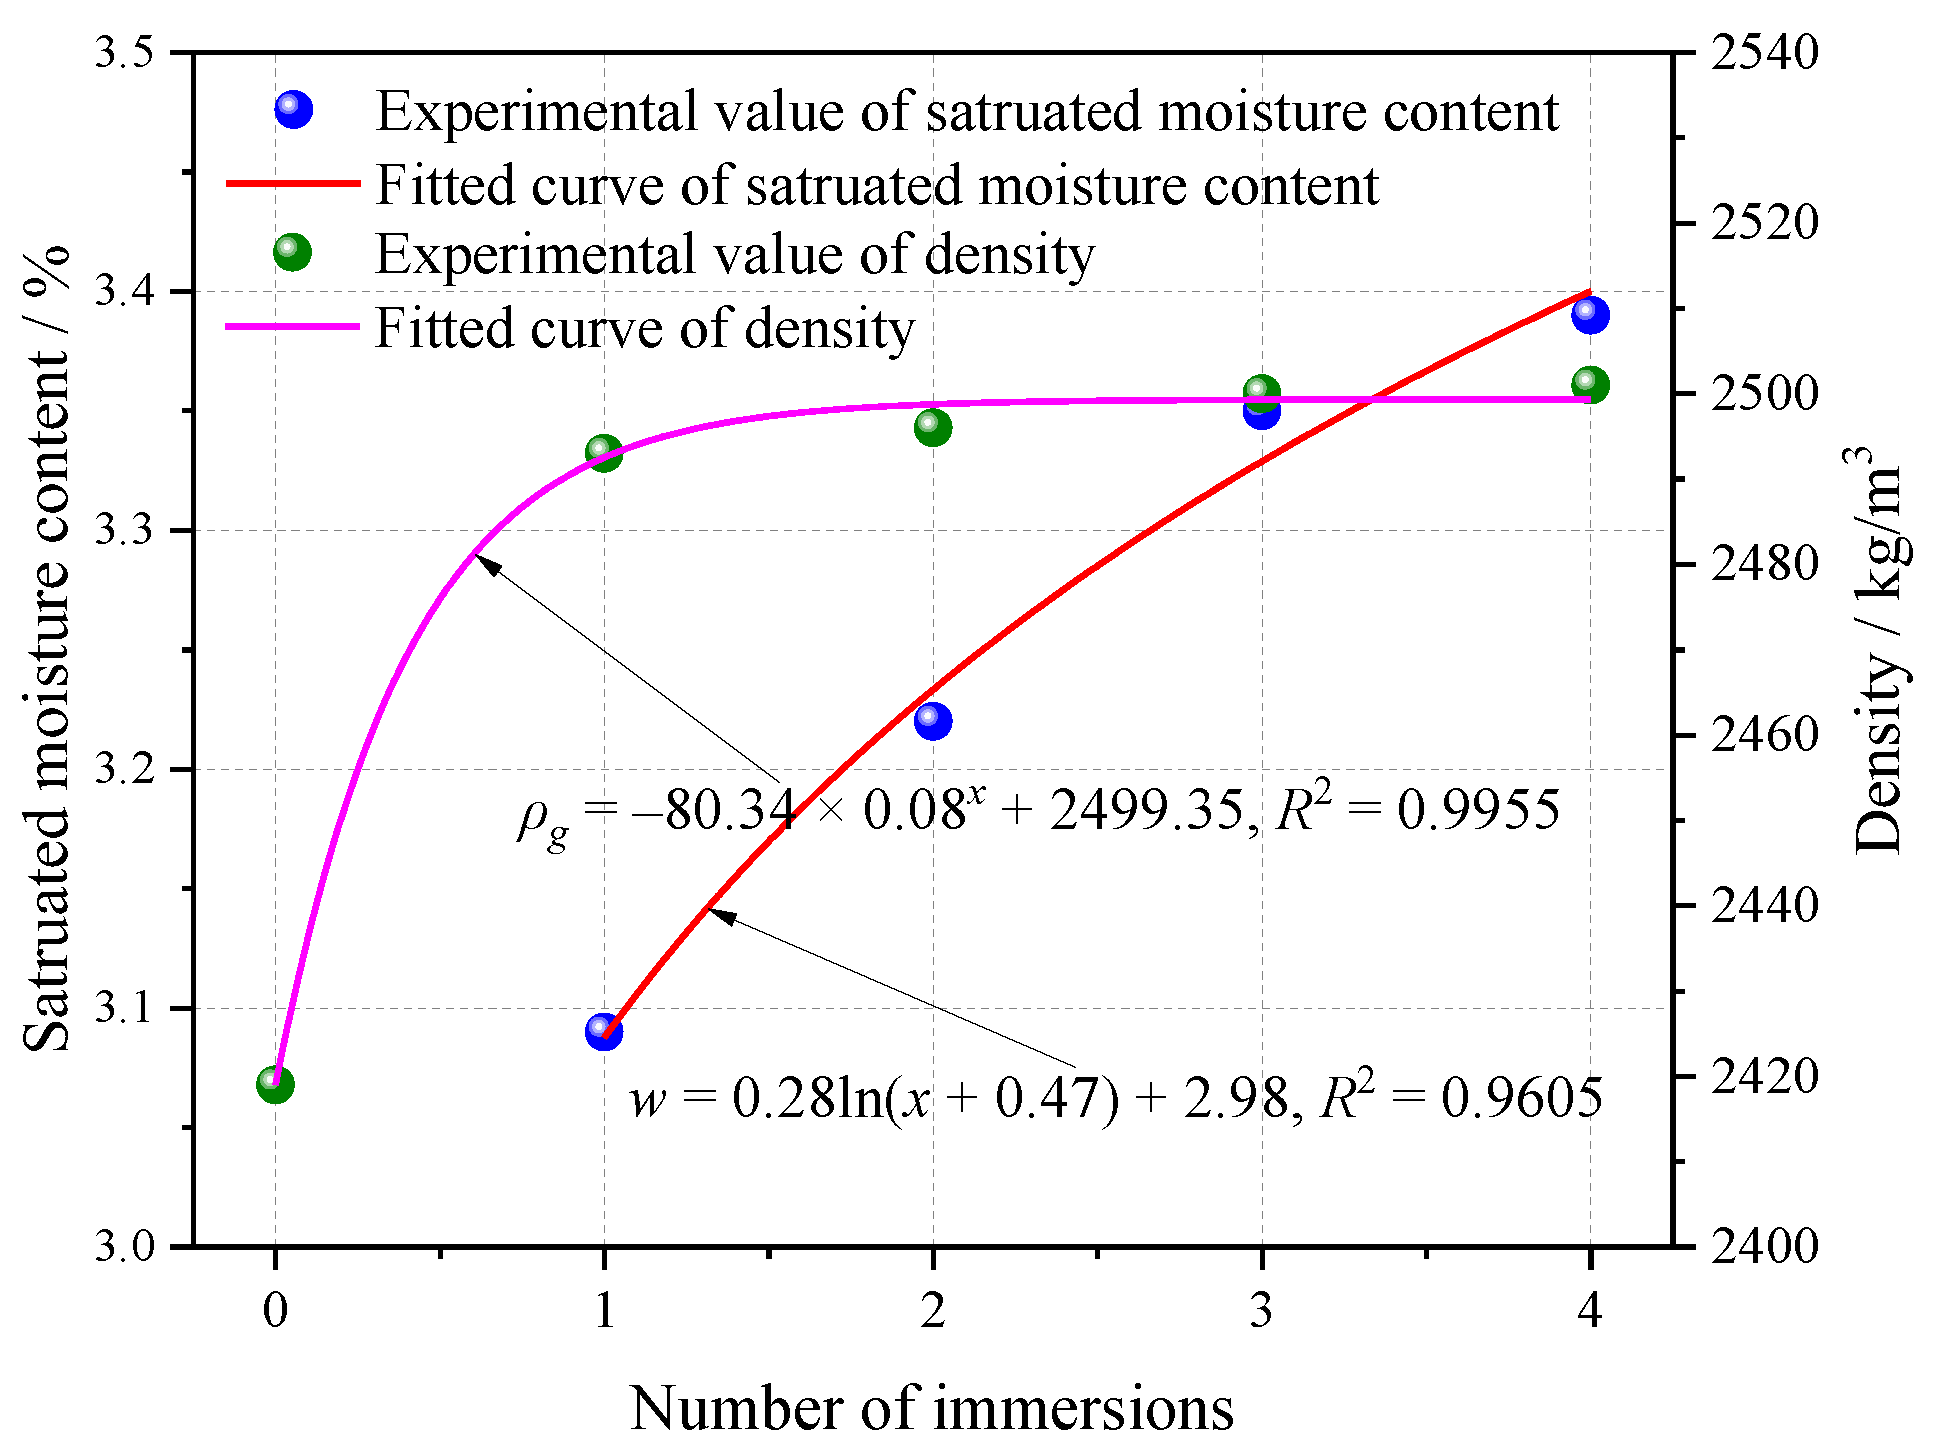
The relationship between the saturated moisture content, gangue density, and immersion time is shown in Figure 11.
As shown in Figure 11, with an increase in the immersion time, the saturated moisture content and density of the gangue increased gradually, and the increase in amplitude decreased gradually. The change law was fitted using logarithmic and exponential functions. From one to two times immersion, the saturated moisture content of the gangue increased from 3.09 to 3.25%, an increase of 0.16%. From two to three times immersion and from three to four times immersion, the increase in the saturated moisture content of the gangue was 0.08 and 0.06%, respectively. During repeated drying-wetting, on the one hand, the dissolution and scouring of water increased the original pores and fractures in the gangue; on the other hand, the clay minerals in the gangue expanded after encountering water, limiting the growth of pores and fractures. The densities of the gangue were 2419, 2493, 2496, 2500, and 2501 kg/m3, respectively, after drying and one time immersion. The gangue density increased by 3.39% from the dry state to four times immersion. As the external volume of the gangue remained unchanged, the saturated moisture content and quality of the gangue increased, and thus the measured gangue density increased.

4.2. Compaction Characteristics

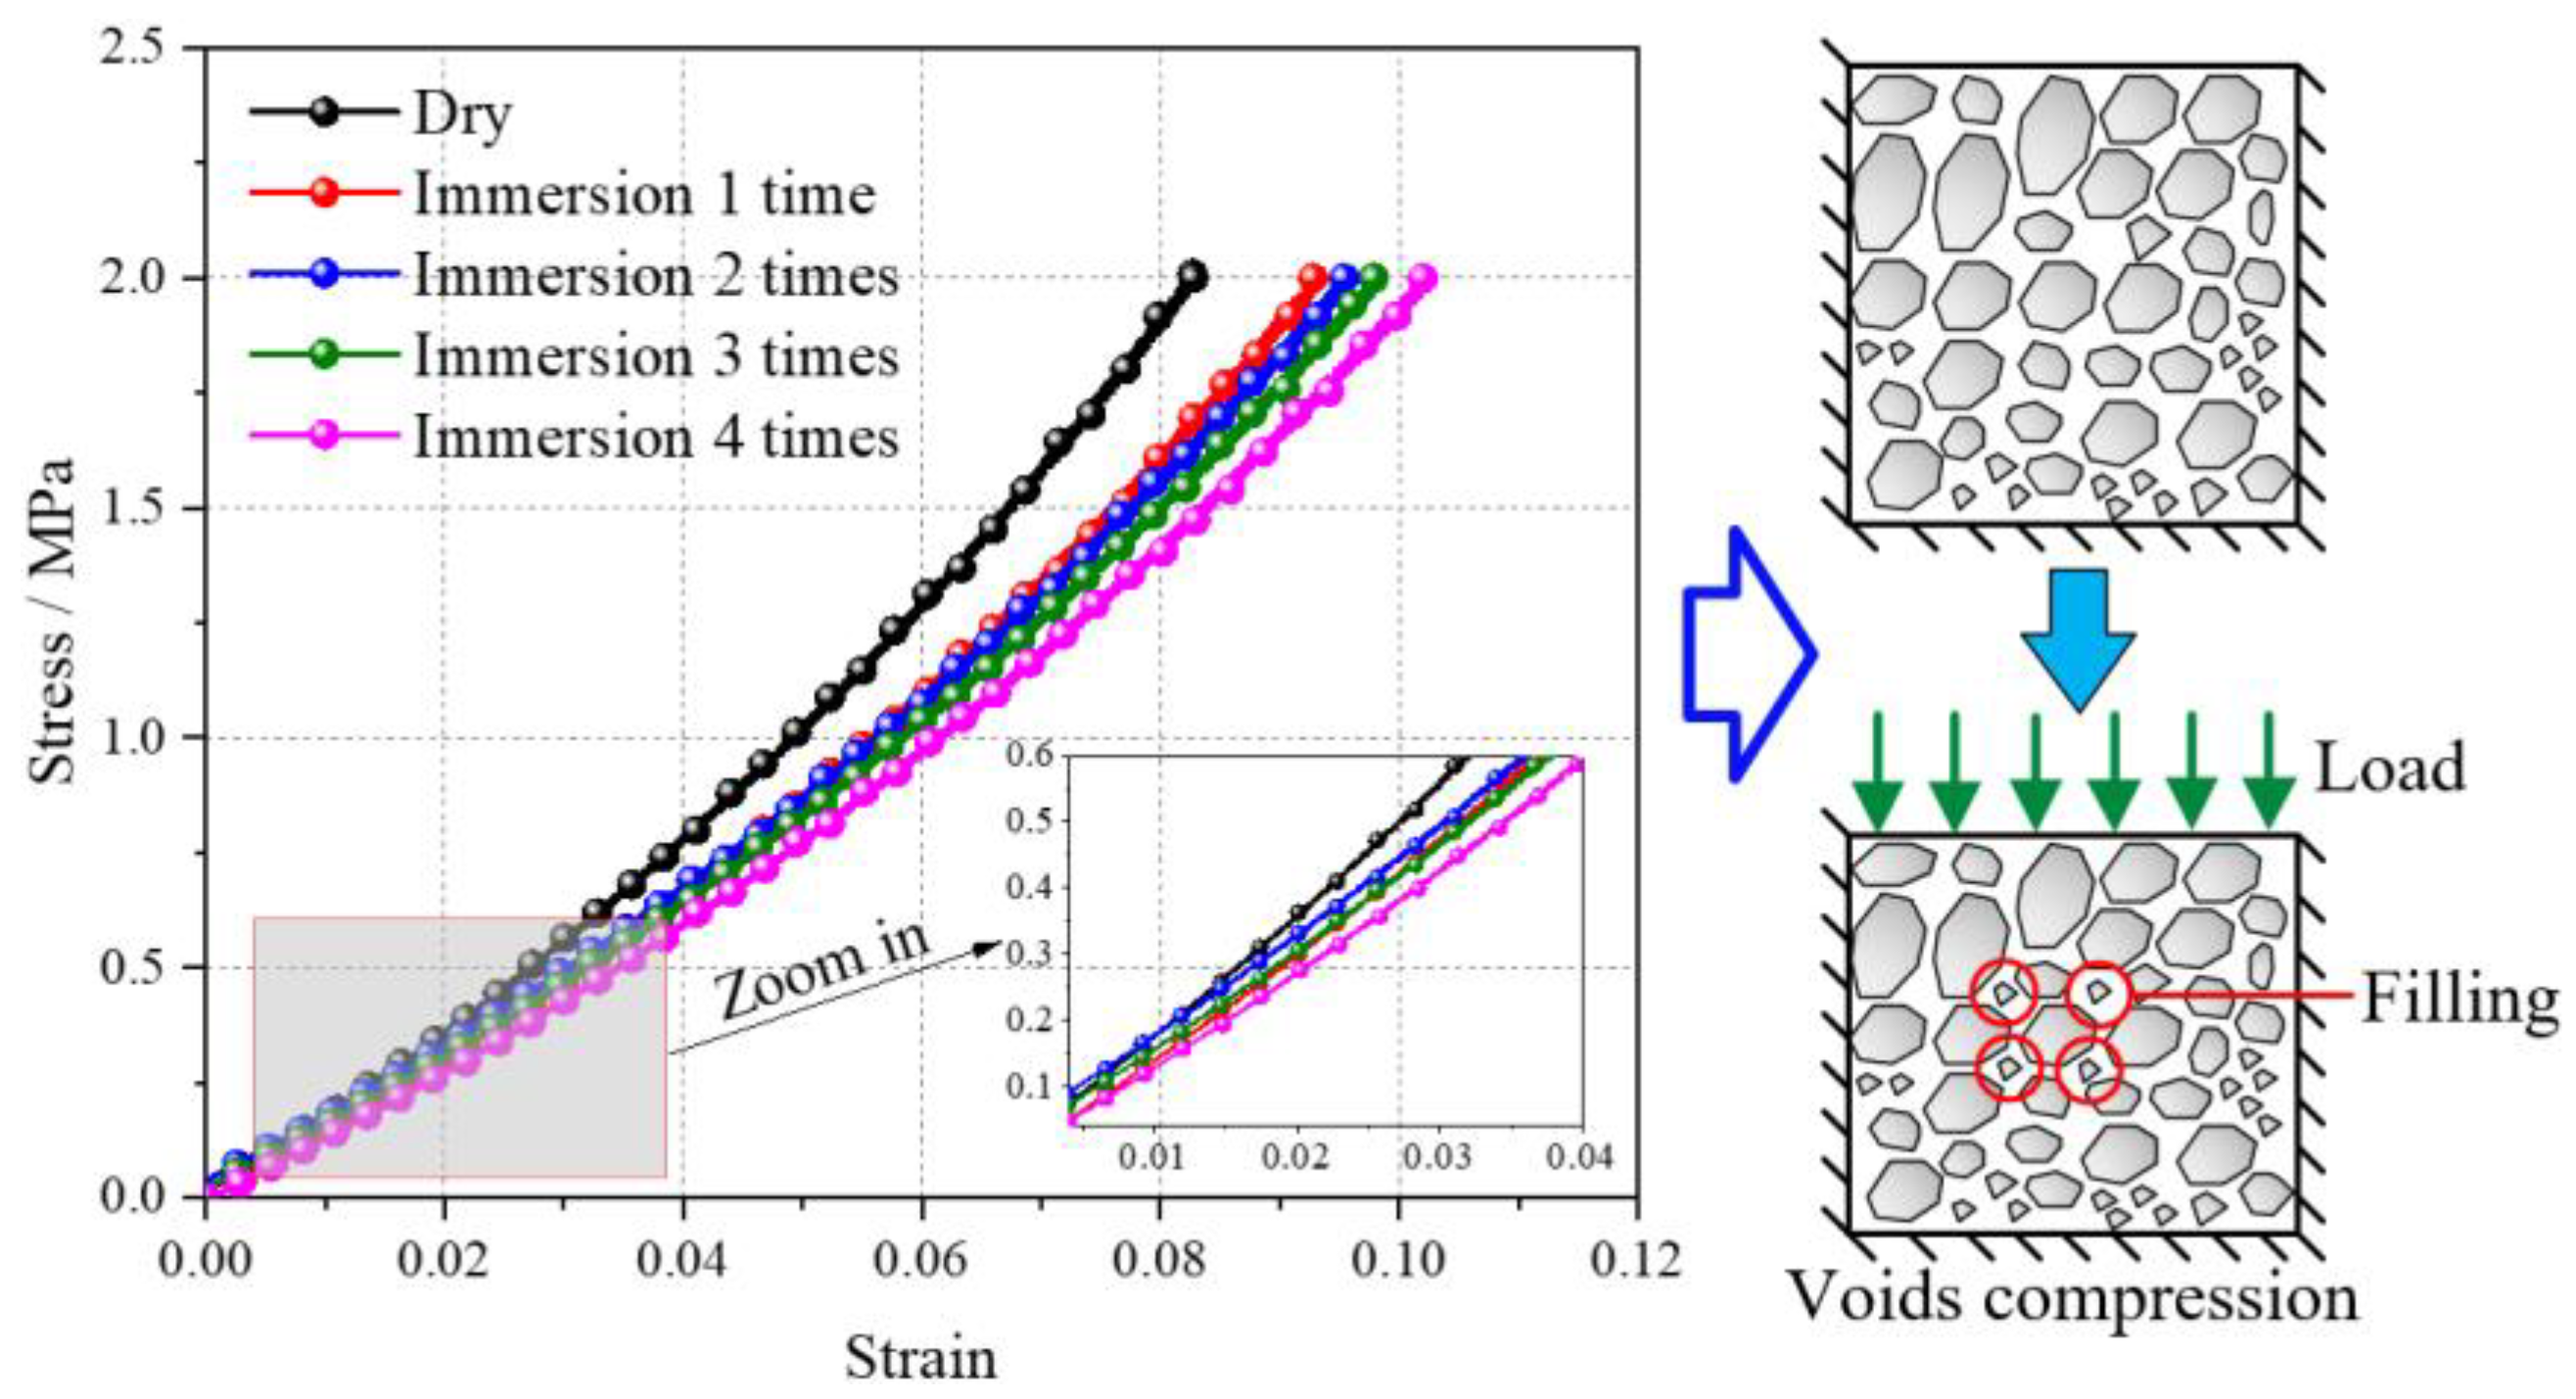
The stress–strain relationship of the gangue with different immersion times is shown in Figure 12 (the final stress is 2 MPa).
As shown in Figure 12, the stress and strain of the gangue samples with different immersion times during compaction were nonlinear. With an increase in stress, the strain of the gangue increased gradually, but the amplitude of the increase decreased gradually. This is because, in the initial stage of loading, there was a large void in the gangue sample, which was easily compressed under stress and sliding, and the rotation between blocks occurred easily, leading to a weak overall bearing capacity and resistance capacity to the deformation of the sample. During the process of compaction, the contact force between the gangue blocks caused the blocks to be crushed and the structure to be reorganized. With an increase in stress, the voids inside the gangue gradually decreased, and the large voids were filled and compacted by small blocks. The overall structure of the sample gradually stabilized and the bearing capacity and resistance to deformation gradually increased. At the initial stage of loading, the deformation of the two- and three-times immersion gangue samples was larger than that of the one time immersion, which was related to the stacking form of the sample and the uniformity of the particle size distribution. With an increase in stress, the effect of the immersion time on the compaction characteristics of the gangue increased gradually. When the stress reached 2 MPa, the strain values of the gangue sample from the dry state to four times immersion were 0.083, 0.093, 0.095, 0.098, and 0.102, respectively. The strain of the gangue sample increased by 44.58% from the dry state to four times immersion. When water enters the gangue, it weakens the connection force between the particles, dissolves some particles, changes the internal pore structure, and damages the local bearing structure of the gangue, reducing its compaction mechanical properties. The water on the surface of the gangue block forms a thin film, reducing the friction between the blocks and increasing the sliding degree between them. The macro and micro effects of water on the gangue reduced the loading and resistance capacities to the deformation of the gangue samples.
The stress–strain curves of the gangue samples with different immersion times are fitted by an exponential function and the expression is as follows:
y = 1 b e x a + c
where, a, b, and c are all the parameters of the exponential function.
According to Equation (10), the stress–strain curves of the gangue samples with different immersion times were fitted and the fitting parameters and equations are listed in Table 3.
The relationship between the fitting parameters and immersion times obtained from Table 3 is illustrated in Figure 13.
As shown in Figure 13, with an increase in the immersion time, parameters a and b increased exponentially, and the change in parameter a was more evident than that of parameter b. Parameter a of the dry gangue sample was 0.104, whereas parameter b was 0.612. When the sample was soaked four times, parameter a increased to 0.127 and parameter b increased to 0.620, which translated to 22.1% and 1.3%, respectively. Parameter c had no evident regularity with the increase in the immersion time and had a small range from −1.004 (immersion twice) to −0.976 (immersion three times).
The stress–strain curve of the gangue sample varied with parameters a, b, and c, as shown in Figure 14a, Figure 14b, and Figure 14c, respectively. To facilitate the comparative analysis, the stress and strain data were normalized.
As shown in Figure 14, the strain of the gangue sample under the same stress increased with an increase in parameters a and b and decreased with an increase in parameter c. Parameter a had the greatest influence on the shape of the stress–strain curve of the gangue sample, followed by parameter b, whereas parameter c had the least influence (parameter c ranges from −1.00 to −0.96, and there is little difference in the strain under the same stress). Therefore, parameters a and b are expressed by the number of immersion times and parameter c is used as the average value under different immersion times. The stress–strain relationship equation of the gangue sample based on parameter fitting considering the influence of the immersion time can be obtained as follows:
σ = 1 0.009 × 0.648 x + 0.622 e ε 0.024 × 0.533 x + 0.128 0.9926

4.3. Evolution Law of Voids

In a coal mine underground reservoir, the void rate of the gangue in the caving zone is also the storage coefficient of the caving zone. The void rate directly reflected the compactness of the gangue sample. The higher the void rate, the lower the compactness of the gangue sample. The calculation formula for the void rate of the gangue sample in a cylindrical steel cylinder is [46].
φ = V g V r V g = 1 4 m π d 2 h ρ
where φ is the void rate of the gangue sample, Vg is the volume of the gangue sample, Vr is the volume of the rock block, m is the mass of the gangue sample, d is the inner diameter of the steel cylinder, h is the height of the gangue sample, and ρ is the gangue density.
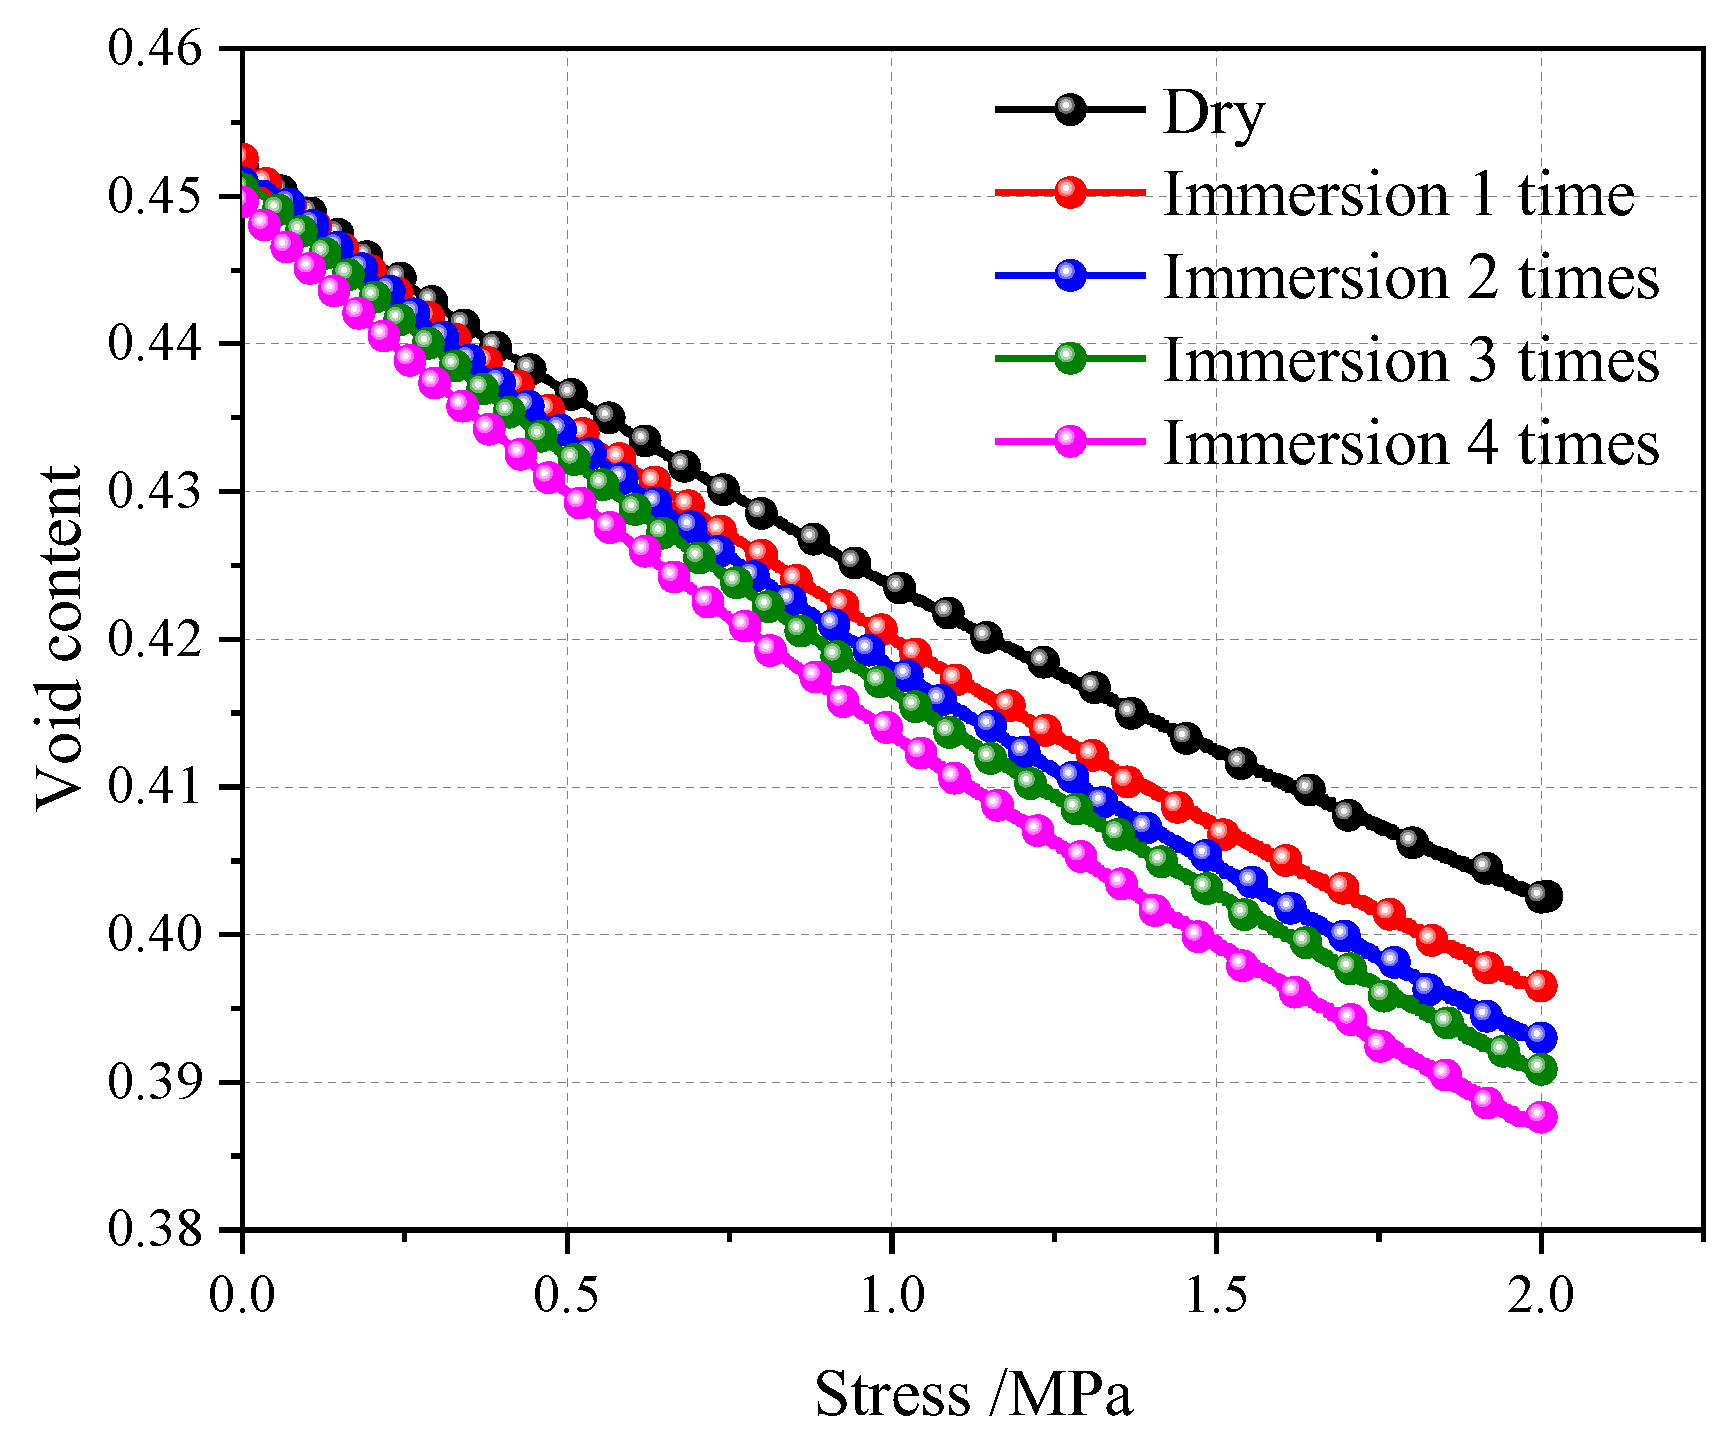
According to Equation (12), the change rule of the void rate of the gangue samples with stress at different immersion times is shown in Figure 15.
As shown in Figure 15, the change rule of the void rate of the gangue samples with the different immersion times was similar, decreasing gradually with an increase in stress, and the decreasing rate gradually slowed down. This is because, in the initial stage of loading, the internal stability of the gangue sample was poor, the blocks were squeezed and slipped, the small blocks were filled with large voids, and the voids were gradually reduced. With an increase in stress, the structure of the gangue sample stabilized gradually and the number of sliding and filling blocks decreased gradually, which slowed down the void rate reduction. In addition to the initial stage of loading, with an increase in the immersion time, the void rate of the gangue samples under the same stress gradually decreased. When the stress reached 2 MPa, the void rates of the gangue samples from the dry state to immersion four times were 0.403, 0.396, 0.393, 0.3911, and 0.388, respectively. From the dry state to immersion four times, the void rate of the gangue sample decreased by 0.015, which was 3.7%. The lubrication of water increased the sliding degree between the blocks and the dissolution and erosion of water increased the voids in the gangue sample, providing more space for small block filling. The softening of water reduced the compaction mechanical properties of the gangue sample, reducing the void rate of the gangue samples.
From Equations (11) and (12), the void rate-stress relationship equation of the cylindrical gangue sample based on parameter fitting considering the influence of the immersion time is
φ = 1 4 m π d 2 h 0 1 0.024 × 0.533 x + 0.128 ln 0.009 × 0.648 x + 0.622 σ + 0.9926 ρ
Equations (11) and (13) provide a reference for the study of gangue-related numerical simulations considering the effect of the water-rock interaction and the calculation of the storage coefficient of the caving zone of a coal mine underground reservoir.

5. Conclusions

A similar physical model test of a coal mine underground reservoir and gangue compaction test were conducted to study the mining overburden fracture movement law, fractal characteristics of water storage space, and influence of immersion times on the gangue compaction characteristics and void rate evolution law. The main conclusions were as follows:
(1)
The first caving step distance of the immediate roof and the main roof of the model working face was 40 cm and 60 cm, respectively. The average caving step distance was 20 cm. The overburden only had the “two zone” structure of the caving and fracture zones. When the working face was advanced by 100 cm, the fracture penetrated the ground and the height of the caving zone was 7 cm. The rock strata in different layers all moved and sunk in a “∩” shaped asymmetry. The subsidence value of the rock strata on the side of the open cut was larger than that on the side of the working face. The maximum subsidence was 45 cm from the open cut.
(2)
When the advancing distance of the working face was the same, the fractal dimensions from large to small are the caving zone, entire goaf, and fracture zone. The fractal dimension of the rock void of the caving zone and the entire goaf increased logarithmically with an increase in the advancing distance of the working face. When the advancing distance of the working face was from 60 to 80 cm, the fractal dimension of the rock void of the fracture zone increased rapidly and then decreased linearly (80–200 cm).
(3)
With an increase in the immersion time, the saturated moisture content of the gangue increased logarithmically, and the density increased exponentially. From immersion one time to immersion four times, the saturated moisture content of gangue increases from 3.09% to 3.39%, increasing by 0.3%. From dry to immersion four times, the density of gangue increases from 2419 kg/m3 to 2501 kg/m3, increasing by 3.39%. Except at the initial stage of loading, the strain of the gangue samples under the same stress gradually increased and the void rate gradually decreased. With an increase in stress, the strain of the gangue samples immersed in water for different times gradually increased, but the rate of increase gradually decreased. The void rate gradually decreased with the increase in stress, and the rate of decrease gradually slowed.
(4)
The stress–strain curves of the gangue samples with different immersion times were fitted and the fitting parameters and equations were obtained. With an increase in the immersion time, parameters a and b increased exponentially, whereas parameter c had no evident regularity. From immersion one time to immersion four times, the parameters a and b increased from 0.104 and 0.612 to 0.127 and 0.620, respectively, increasing by 22.1% and 1.3%, respectively. The strain of the gangue sample was positively correlated with parameters a and b and negatively correlated with parameter c. Parameter a had the greatest influence on the shape of the stress–strain curve of the gangue sample, parameter c had the least influence, and parameter b was in the middle. The stress–strain and void rate-stress relationship equations of the gangue sample and cylindrical gangue sample based on parameter fitting considering the influence of the immersion time were established, respectively.
In this paper, the influence of disturbance and repeated drying-wetting on the evolution law of water storage space in a coal mine underground reservoir were studied through a simulation test and gangue compaction test. The test also needs further refinement. The size of the gangue sample is designed to fit BR-MSTS, however, the size of the gangue in the goaf is much larger than that in the laboratory. The influence of size effect on the compaction characteristics of gangue could not be ignored. Further studies will focus on the compaction characteristics of gangue considering the water-rock interaction under different size conditions.

Author Contributions

Conceptualization, methodology, writing—original draft preparation, W.W.; writing—review and editing, funding acquisition, Q.Y.; investigation, resources, Q.X.; data curation, X.C. and H.L.; supervision, X.L. All authors have read and agreed to the published version of the manuscript.

Funding

This work was funded by the National Natural Science Foundation of China (grant number: 51874283).

Institutional Review Board Statement

Not applicable.

Informed Consent Statement

Not applicable.

Data Availability Statement

Not applicable.

Conflicts of Interest

The authors declare no conflict of interest.

References

  1. Yao, Q.L.; Chen, T.; Tang, C.J.; Sedighi, M.; Wang, S.W.; Huang, Q.X. Influence of moisture on crack propagation in coal and its failure modes. Eng. Geol. 2019, 258, 105156. [Google Scholar] [CrossRef]
  2. Yao, Q.L.; Tang, C.J.; Xia, Z.; Liu, X.L.; Zhu, L.; Chong, Z.H.; Hui, X.D. Mechanisms of failure in coal samples from underground water reservoir. Eng. Geol. 2020, 267, 105494. [Google Scholar] [CrossRef]
  3. Yao, Q.L.; Tang, C.J.; Liu, Z.C. Analysis of coal and water co-mining in ecologically fragile mining areas in Western China. Coal Sci. Technol. 2021, 49, 225–232. [Google Scholar]
  4. Chi, M.B.; Zhang, D.S.; Liu, H.L.; Wang, H.Z.; Zhou, Y.Z.; Zhang, S.; Yu, W.; Liang, S.; Zhao, Q. Simulation analysis of water resource damage feature and development degree of mining-induced fracture at ecologically fragile mining area. Environ. Earth Sci. 2019, 78, 88. [Google Scholar] [CrossRef]
  5. Liu, S.L.; Li, W.P.; Wang, Q.Q.; He, J.H.; Xue, S. Water Inrush Risk zoning and Water Conservation Mining Technology in the Shennan Mining Area, Shaanxi, China. Arab. J. Sci. Eng. 2018, 43, 321–333. [Google Scholar] [CrossRef]
  6. Zhang, Y.; Cao, S.G.; Guo, S.; Wan, T.; Wang, J.J. Mechanisms of the development of water-conducting fracture zone in overlying strata during shortwall block backfill mining: A case study in Northwestern China. Environ. Earth Ences. 2018, 77, 543. [Google Scholar] [CrossRef]
  7. Gu, D.Z. Theory framework and technological system of coal mine underground reservoir. J. China Coal Soc. 2015, 40, 239–246. [Google Scholar]
  8. Jiang, B.B.; Gao, J.; Du, K.; Deng, X.; Zhang, K. Insight into the water-rock interaction process and purification mechanism of mine water in underground reservoir of Daliuta coal mine in China. Environ. Sci. Pollut. R 2022, 29, 28538–28551. [Google Scholar] [CrossRef]
  9. Kong, X.S.; Xu, Z.Z.; Shan, R.L.; Liu, S.; Xiao, S.C. Investigation on groove depth of artificial dam of underground reservoir in coal mines. Environ. Earth Sci. 2021, 80, 214. [Google Scholar] [CrossRef]
  10. Liu, X.S.; Song, S.L.; Wu, B.Y.; Li, X.B.; Kang, Y. Study on Deformation and Fracture Evolution of Underground Reservoir Coal Pillar Dam under Different Mining Conditions. Geofluids 2022, 2022, 2186698. [Google Scholar]
  11. Yao, Q.L.; Tang, C.J.; Xu, Q.; Yu, L.Q.; Li, X.H. Technical framework for exploitation and utilization of mining-affected water resource in coal mine. China Sci. 2020, 15, 973–979. [Google Scholar]
  12. Zhang, C.; Wang, F.T.; Bai, Q.S. Underground space utilization of coalmines in China: A review of underground water reservoir construction. Tunn. Undergr. Space Technol. 2021, 107, 103657. [Google Scholar] [CrossRef]
  13. Ju, J.F.; Xu, J.L.; Zhu, W.B. Storage capacity of underground reservoir in the Chinese western water-short coalfield. J. China Coal Soc. 2017, 42, 381–387. [Google Scholar]
  14. Pang, Y.H.; Li, Q.S.; Cao, G.M.; Zhou, B.J. Analysis and calculation method of underground reservoir water storage space composition. J. China Coal Soc. 2019, 44, 557–566. [Google Scholar]
  15. Wang, B.F.; Liang, B.; Wang, J.G.; Sun, K.M.; Sun, W.J.; Chi, H.B. Experiment study on rock bulking of coal mine underground reservoir. Rock Soil Mech. 2018, 39, 4086–4092. [Google Scholar]
  16. Song, H.Q.; Xu, J.J.; Fang, J.; Cao, Z.G.; Li, T.X. Potential for mine water disposal in coal seam goaf: Investigation of storage coefficients in the Shendong mining area. J. Clean Prod. 2019, 244, 118646. [Google Scholar] [CrossRef]
  17. Ma, D.; Bai, H.B.; Chen, Z.Q.; Pu, H. Effect of Particle Mixture on Seepage Properties of Crushed Mudstones. Transp. Porous Med. 2015, 108, 257–277. [Google Scholar] [CrossRef]
  18. Li, M.; Li, A.L.; Zhang, J.X.; Huang, Y.L.; Li, J.M. Effects of particle sizes on compressive deformation and particle breakage of gangue used for coal mine goaf backfill. Powder Technol. 2020, 360, 493–502. [Google Scholar] [CrossRef]
  19. Li, M.; Zhang, J.X.; Sun, K.; Zhang, S. Influence of Lateral Loading on Compaction Characteristics of Crushed Waste Rock Used for Backfilling. Minerals 2018, 8, 552. [Google Scholar] [CrossRef] [Green Version]
  20. Li, J.M.; Huang, Y.L.; Gao, H.D.; Ouyang, S.Y.; Guo, Y.C. Transparent characterization of spatial-temporal evolution of gangue solid wastes’ void structures during compression based on CT scanning. Powder Technol. 2020, 376, 477–485. [Google Scholar] [CrossRef]
  21. Hu, S.Y.; Guan, S.W.; Feng, G.R.; Li, G.F.; Han, D.D.; Guo, H.B. Numerical simulations of the void distribution characteristics of crushed rock masses in mine gobs. Adv. Powder Technol. 2020, 31, 3928–3936. [Google Scholar] [CrossRef]
  22. Hu, S.Y.; Han, D.D.; Feng, G.R.; Zhang, A.; Hao, G.C.; Hu, L.Q.; Zhu, L.P.; Li, B. Influence of Stress on Void Ratios of Compacted Crushed Rock Masses in Coal Mine Gobs. Nat. Resour. Res. 2020, 29, 1361–1373. [Google Scholar] [CrossRef]
  23. Tang, C.; Yao, Q.; Xu, Q.; Shan, C.; Xu, J.; Han, H.; Guo, H. Mechanical Failure Modes and Fractal Characteristics of Coal Samples under Repeated Drying–Saturation Conditions. Nat. Resour. Res. 2021, 30, 4439–4456. [Google Scholar] [CrossRef]
  24. Fitz-Diaz, E.; Hudleston, P.; Siebenaller, L.; Kirschner, D.; Camprubi, A.; Tolson, G.; Puig, T.P. Insights into fluid flow and water-rock interaction during deformation of carbonate sequences in the Mexican fold-thrust belt. J. Struct. Geol. 2011, 33, 1237–1253. [Google Scholar] [CrossRef]
  25. Yao, Q.L.; Tang, C.J.; Xia, Z.; Xu, Q.; Wang, W.N.; Wang, X.H.; Chong, Z.H. Experimental Study of Coal Sample Damage in Acidic Water Environments. Mine Water Environ. 2021, 40, 1003–1015. [Google Scholar] [CrossRef]
  26. Corteel, C.; Dini, A.; Deyhle, A. Element and isotope mobility during water-rock interaction processes. Phys. Chem. Earth 2005, 30, 993–996. [Google Scholar] [CrossRef]
  27. LEE, S. Preliminary Experimental Result for Clarifying Sr Isotope Behaviour of Water due to Water-Rock Interaction. Econ. Environ. Geol. 2010, 43, 211–222. [Google Scholar]
  28. Hernandez-Terrones, L.M.; Street, J.; Null, K.; Paytan, A. Groundwater chemistry and Sr isotope ratios shed light on connectivity and water-rock interactions in the coastal aquifer of the Caribbean coast, Mexico. Cont. Shelf Res. 2021, 212, 104293. [Google Scholar] [CrossRef]
  29. Wang, W.N.; Yao, Q.L.; Tang, C.J.; Li, X.H.; Chong, Z.H. Study of the Mechanical Properties and Fracture Evolution of Sandstone with Different Moisture Contents Under True Triaxial Stress. Arab. J. Sci. Eng. 2021, 461, 1497–1518. [Google Scholar] [CrossRef]
  30. Wang, W.N.; Yao, Q.L.; Tang, C.J.; Li, X.H.; Xu, Q. Experimental study on the shear characteristics and weakening mechanism of water-bearing rock joints. B Eng. Geol. Environ. 2021, 80, 7653–7668. [Google Scholar] [CrossRef]
  31. Gangrade, V.; Schatzel, S.J.; Harteis, S.P.; Addis, J.D. Investigating the Impact of Caving on Longwall Mine Ventilation Using Scaled Physical Modeling. Min. Metall. Explor. 2019, 36, 729–740. [Google Scholar] [CrossRef]
  32. Yoo, C.; Abbas, Q. Interaction between two-arch tunnel and pile supported bridge—An experimental investigation. Tunn. Undergr. Space Technol. 2021, 112, 103869. [Google Scholar] [CrossRef]
  33. Lei, M.; Peng, L.; Shi, C. Model test to investigate the failure mechanisms and lining stress characteristics of shallow buried tunnels under unsymmetrical loading. Tunn. Undergr. Space Technol. 2015, 46, 64–75. [Google Scholar] [CrossRef]
  34. Shi, X.C. Control of overlying strata migration by shallow isolated coal pillars and their reasonable setting-up. J. Chongqing Univ. 2019, 42, 106–114. [Google Scholar]
  35. Lai, X.P.; Zhang, X.D.; Shan, P.F.; Cui, F.; Liu, B.W.; Bai, R. Study on development law of water-conducting fractures in overlying strata of three soft coal seam mining under thick loose layers. Chin. J. Rock Mech. Eng. 2021, 40, 1739–1750. [Google Scholar]
  36. Morita, T.; Sato, K. Fractal dimension estimators for a fractal process. J. Korean Phys. Soc. 2005, 46, 631–637. [Google Scholar]
  37. Fernandez-Martinez, M.; Nowak, M.; Sanchez-Granero, M.A. Counterexamples in theory of fractal dimension for fractal structures. Chaos Soliton Fract. 2016, 89, 210–223. [Google Scholar] [CrossRef] [Green Version]
  38. Sarkheil, H.; Hassani, H.; Alinia, F. Fractures distribution modeling using fractal and multi-fractal-neural network analysis in Tabnak hydrocarbon field, Fars, Iran. Arab. J. Geosci. 2013, 6, 945–956. [Google Scholar] [CrossRef]
  39. Caballero, Y.; Giraldo, R.; Mateu, J. A spatial randomness test based on the box-counting dimension. Adv. Stat. Anal. 2022, 106, 499–524. [Google Scholar] [CrossRef]
  40. Acosta, C.; Penunuri, F.; Carvente, O.; Rivadeneyra, G.; Martin, I. A comparison between “rod counting” and “box counting” methods in linear fractal dimensions measurements. Rev. Int. Metod. Numer. 2022, 38. [Google Scholar]
  41. Nayak, S.R.; Mishra, J. Fractal dimension-based generalized box-counting technique with application to grayscale images. Fractals 2021, 29, 2150055. [Google Scholar] [CrossRef]
  42. Marmo, R.; Amodio, S.; Tagllaferri, R.; Ferreri, V.; Longo, G. Textural identification of carbonate rocks by image processing and neural network: Methodology proposal and examples. Comput. Geosci. 2005, 31, 649–659. [Google Scholar] [CrossRef]
  43. Haliche, Z.; Hammouche, K. The gray level aura matrices for textured image segmentation. Analog. Integr. Circ. S 2011, 69, 29–38. [Google Scholar] [CrossRef]
  44. Li, Z.H.; Ding, X.P.; Cheng, Z.H. Research on Fractal Characteristics of Overlying Strata Crack Evolution in Coal Seam with T hin Bedrock. J. Min. Saf. Eng. 2010, 27, 576–580. [Google Scholar]
  45. Jaya, V.; Raghukanth, S.T.G.; Mohan, S.S. Estimating fractal dimension of lineaments using box counting method for the Indian landmass. Geocarto. Int. 2014, 29, 314–331. [Google Scholar] [CrossRef]
  46. Li, B.; Liang, Y.P.; Zhang, L.; Zou, Q.L. Experimental investigation on compaction characteristics and permeability evolution of broken coal. Int. J. Rock Mech. Min. 2019, 118, 63–76. [Google Scholar] [CrossRef]
Figure 1. Schematic diagram of the coal mine underground reservoir.
Minerals 12 01491 g001
Figure 2. Schematic diagram of the water-rock interaction after gangue soaking.
Minerals 12 01491 g002
Figure 3. Gangue compression test equipment. (a) ANDWID. (b) BR-MSTS.
Minerals 12 01491 g003
Figure 4. Rock lithology and thickness of the working face.
Minerals 12 01491 g004
Figure 5. Test process. (a) Physical model test and (b) gangue compaction test.
Minerals 12 01491 g005
Figure 6. Overburden migration and fracture development.
Minerals 12 01491 g006
Figure 7. Overburden migration rule before and after mining.
Minerals 12 01491 g007
Figure 8. Calculation process of fractal dimension of overburden void of the model. (a) Working face advanced by 60 cm, (b) working face advanced by 80 cm, (c) working face advanced by 100 cm, and (d) working face advanced by 200 cm.
Minerals 12 01491 g008aMinerals 12 01491 g008b
Figure 9. Relation between the fractal dimension and advancing distance of the working face.
Minerals 12 01491 g009
Figure 10. Similar and prototype gangue. (a) Similar gangue in different height zones of the caving zone. (b) Gangue samples with different levels of grain size grading.
Minerals 12 01491 g010
Figure 11. Saturated moisture content- and density-immersion times. Note: w in the fitting equation is the saturated moisture content, ρg is the density of the gangue, and x is the number of immersions.
Minerals 12 01491 g011
Figure 12. Stress–strain curve of the gangue with different immersion times.
Minerals 12 01491 g012
Figure 13. Relationship between fitting parameters and immersion times. (a) a, (b) b, and (c) c.
Minerals 12 01491 g013
Figure 14. Influence of the fitting parameters after data normalization on the stress–strain curve. (a) Influence of a on stress–strain curve, (b) influence of b on stress–strain curve, and (c) influence of c on stress–strain curve.
Minerals 12 01491 g014
Figure 15. Void stress curve of the gangue with different immersion times.
Minerals 12 01491 g015
Table 1. Physical and mechanical parameters and compounding ratio of the prototype and modeling materials.
LithologyPrototype Compressive Strength/MPaModel
Compressive
Strength/MPa
Prototype
Density
g/cm3
Model Density/g/cm3Material Ratio (Sand: Calcium Carbonate: Gypsum)
Minerals 12 01491 i001Loose layer0.70.0031.731.1511:1:0
Minerals 12 01491 i002Medium sandstone37.00.1642.571.717:5:5
Minerals 12 01491 i003Siltstone26.50.1182.461.647:6:4
Minerals 12 01491 i004Sandy mudstone17.20.0762.461.648:6:4
Minerals 12 01491 i0052-2 coal15.00.0671.330.898:7:3
Table 2. Ratio of similar gangue lumpiness in different zones of the caving zone.
Height (cm)Grain Size Grading (cm)Ratio (%)
3.5–71–2021.11
10–1552.55
5–1026.34
0–3.510–1524.51
5–1065.96
0–59.53
Table 3. Fitting parameters and equations of the stress and strain relationship of the gangue with different immersion times.
Number of ImmersionsabcFitted EquationR2
00.1040.612−0.993σ = (eε/0.104−0.993)/0.6120.9999
10.1160.616−1.004σ = (eε/0.116−1.004)/0.6160.9895
20.1210.617−0.976σ = (eε/0.121−0.976)/0.6170.9897
30.1230.619−0.988σ = (eε/0.123−0.988)/0.6190.9894
40.1270.620−1.002σ = (eε/0.127−1.002)/0.6200.9893
Publisher’s Note: MDPI stays neutral with regard to jurisdictional claims in published maps and institutional affiliations.