Article

Silica-Resin-Bentonite Nanocomposite and Its Application in Catalysis

by
Federico M. Perez
1,2,
Gerardo F. Santori
1,2,
Francisco Pompeo
1,2 and
Nora N. Nichio
1,2,*
1
Centro de Investigación y Desarrollo en Ciencias Aplicadas (CINDECA), Facultad de Ciencias Exactas, Universidad Nacional de La Plata (UNLP)—CONICET, Calle 47, 257, La Plata 1900, Argentina
2
Facultad de Ingeniería, Universidad Nacional de La Plata (UNLP), Calle 1 esq. 47, La Plata 1900, Argentina
*
Author to whom correspondence should be addressed.
Minerals 2022, 12(12), 1486; https://doi.org/10.3390/min12121486
Submission received: 31 October 2022 / Revised: 17 November 2022 / Accepted: 21 November 2022 / Published: 23 November 2022
(This article belongs to the Special Issue Recent Advances in Clay-Based Nanocomposites)

Abstract

:
Bentonites are natural clays found in abundance in deposits all over the planet and possess certain properties that make them interesting for various industrial applications. Through their activation or acid treatment, they can be used as catalysts in several reactions of interest. However, these materials form colloidal suspensions in water or in aqueous solutions, which makes their separation and recovery difficult and prevents their implementation on an industrial scale. To overcome these limitations, in the present work, a silica-resin-bentonite composite material was synthesized and activated with HNO3. The activated solids were characterized and evaluated in the catalytic reaction of solketal synthesis from glycerol and acetone. The best results were obtained for a composite containing 47 wt.% acidified bentonite at 90 °C, with a HNO3 concentration of 0.5 mol L−1, which was attributed to both its acid site density—3.9 mmol per gram of bentonite—and the acidic strength of these sites.

1. Introduction

Bentonites are natural clays found in abundance in deposits all over the world. The main clay mineral that constitutes them is montmorillonite, which ultimately determines their properties. Montmorillonite can be classified as a smectite, with a structure of two tetrahedral silica layers and one octahedral alumina layer. These layers have a net negative charge due to the substitution of ions of different valence or a vacancy of ions in the octahedral positions. For this reason, positive ions, usually sodium and calcium coordinated to water molecules, are present in the interlamellar space, balancing the charges. This structure confers bentonites a number of interesting properties for various industrial applications, such as their inclusion in drilling fluids, as an additive to improve adhesion and plasticity properties in the foundry industry as an adsorbent for organic compounds, among others [1]. In addition, these materials can be activated by treatment with inorganic acids, which gives them acidic properties. In this sense, bentonites have been used at a laboratory scale to catalyze certain reactions, such as pyrolysis [2], cracking [3], etc. However, these materials form colloidal suspensions in water or in aqueous solutions, which makes their separation and recovery difficult and prevents their implementation on an industrial scale.
The addition of bentonite to polymeric matrices has made it possible to obtain nanocomposites with improved mechanical, thermal, and hydrophobic properties for different applications in food technology, pharmaceuticals, the packaging industry, coatings, etc. [4,5,6,7,8]. Particularly, sol–gel silica/nanoclay composites generated from tetraethyl orthosilicate precursor (TEOS) and montmorillonite were reported as suitable materials for surface coatings, due to their hydrophobic properties [9], and for the removal of toxic contaminants from aqueous systems [10]. Recently, bentonite-silica-resin nanocomposites from the gelation of TEOS were synthesized with the aim of achieving a porous composite, where bentonite retains its adsorption capacity to be applied in water treatments [11].
Considering this background, the present work aims to synthesize a composite material containing bentonite in a way that allows its separation, avoiding colloidal suspensions, both in the bentonite activation process and in the catalytic reaction. In particular, it is proposed to evaluate the solid in the reaction of glycerol ketalization with acetone, which represents a way of glycerol valorization for the synthesis of fuel additives.

2. Materials and Methods

2.1. Catalyst Preparation

2.1.1. Preparation of Activated Bentonites

The natural sodic bentonite (Bentonita del Lago) was extracted from the Lago Pellegrini deposit, in the Río Negro province, Argentina. This material, named B, was used as received without further purification, avoiding the time-consuming processes of purification and separation of the clay. The bentonite B has an average particle size of 0.053 mm (99.5% in the No. 200 sieve size).
For the activation of the bentonites, nitric acid 0.15–0.5 mol L−1 was mixed in a three-neck, round-bottom flask with solid B at an acid/solid ratio of 25 mL g−1, under stirring at a temperature of 30–90 °C for 1 h. Then, the solution was filtered, and the solid was washed with distilled water until neutral pH was reached. Finally, the solids were dried at 120 °C for 24 h. The catalysts were named BX-Y, where X stands for the acid concentration, while Y stands for the temperature employed during the activation process.

2.1.2. Preparation of the Activated Bentonite Nanocomposite

The silica-resin-bentonite nanocomposite, named CB, was prepared using the sol–gel precursor mixture of the partially hydrolyzed tetraethyl orthosilicate TEOS (Evonik Industries, Bitterfeld, Germany) and a phenol formaldehyde F-919 resin (Foundry Resins S.A, Buenos Aires, Argentina). An amount of 12 mL of TEOS with 6 g of F-919 resin was mixed until an emulsion was obtained. Then, 12 mL of commercial ethyl alcohol (96%) was gradually added until a translucent amber liquid was obtained, and finally, 6 mL of distilled water was added. When the gel was formed, bentonite B was added, which was previously thermally treated at 300 °C for 72 h, in order to dehydrate the interlayer and thus minimize the TEOS penetration into the clay during mixing.
The pre-gelled liquids were placed into cylindrical jars and covered; then, they were left at room temperature for 24 h without evaporation of the solvents (alcohol and water). After that time, they were uncovered to allow the evaporation of the solvents for 24–48 h. When the syneresis process was finished, the samples were ready to be removed from the jars. Once unmolded, they were aged at room temperature for another 24 h. After that, the curing process was carried out by a thermal treatment with a heating rate of 0.5 °C min−1 from 25 to 270 °C, maintaining the final temperature for 60 min. Under these conditions, the resin polymerized and solidified, finally yielding the monolithic composite.
Since bentonite represents the component of interest in the composite, the largest possible amount of bentonite was included. In this way, it was possible to incorporate 47 wt.% of clay, and this material was selected for the subsequent activation with HNO3.

2.2. Catalyst Characterization
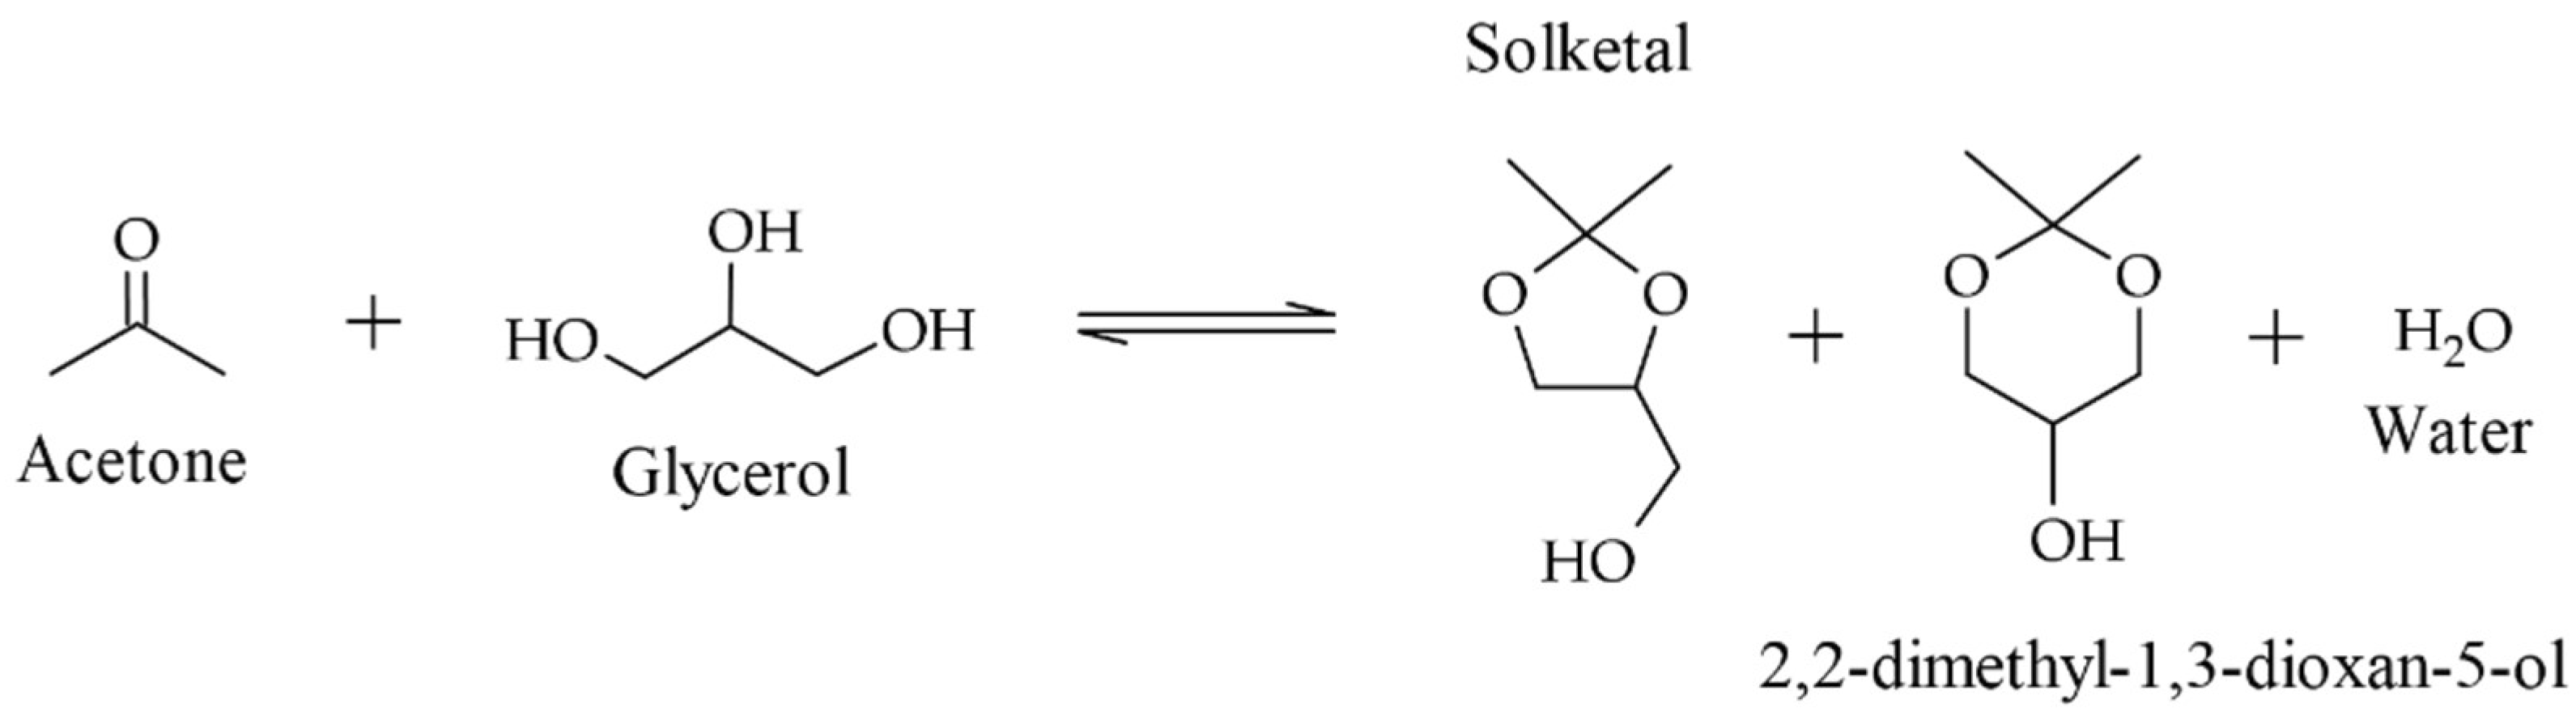
Textural properties of the solids (B, CB, and activated solids) were determined by nitrogen adsorption–desorption isotherms at the temperature of liquid nitrogen (−196 °C) and by employing a Micrometrics ASAP 2020 instrument (Micromeritics Instrument Corporation, Norcross, GA, USA). The samples were heated at 100 °C in a vacuum for 12 h before adsorption, at a pressure lower than 4 Pa. The specific surface area was calculated according to the Brunauer–Emmett–Teller (BET) equation, in the 0.05−0.35 relative pressure range.
Powder X-ray diffraction patterns were obtained by employing a Panalytical X’Pert PRO equipment (Malvern Panalytical Ltd., Malvern, UK) and the Cu Kα radiation (λ = 1.542 Å), in the range of 2θ = 2–70°, with a step size of 0.02°. The operating voltage was 40 kV, with an amperage of 20 mA. The PDF cards from the International Centre for Diffraction Data were used for the identification of the crystalline phases. Samples B, CB, and activated solids were previously dried at 100 °C.
The potentiometric titration technique was employed to determine the strength of the acid sites in the solids (B, CB, and activated solids). In a typical measurement, 0.05 g of the solids were suspended in acetonitrile and stirred for 3 h. Then, the suspension was titrated with a solution of n-butylamine in acetonitrile (0.05 mol L−1) at 0.05 mL min−1. A digital pH meter (Metrohm 794 Basic Titrino apparatus with a double junction electrode, purchased by Metrohm, C.A.B.A, Buenos Aires, Argentina) was employed to register the electrode potential variation.
The energy-dispersive X-ray analysis of the samples was performed to determine the quantity of different species present in B, CB, and activated solids, using an EDAX DX PRIME 10 analyzer (EDAX, New Jersey, NJ, USA) at a working potential of 15 kV, coupled to a SEM Philips 505 equipment (Philips Co., Amsterdam, The Netherlands).
The functional groups present in B, CB, and activated solids were determined by performing the Fourier-transform infrared spectroscopy (FTIR) technique, using a Nicolet 380 spectrophotometer (ThermoFisher Scientific, Waltham, MA USA) and obtaining transmission spectra in the range of 4000–400 cm−1. The samples were prepared in KBr-supported pellets.
The back titration method with NaOH was employed to measure the amount of acid sites present in B, CB, and activated solids [12]. In a typical procedure, 100 mg of solid was suspended in an NaOH solution (0.05 mol L−1) and stirred at 600 rpm for 4 h. Then, the mixture was filtered, and the solution was titrated with HCl 0.05 M. The moles consumed during the neutralization indicated the amount of acid sites in the catalysts and were determined using Equation (1).
C   ( mmol   g 1 ) = total   mmoles   of   NaOH     remaining   mmoles   of   NaOH catalyst   mass   ( g )

2.3. Activity Test

The activated nanocomposites were evaluated as catalysts in the glycerol ketalization reaction in order to determine the effects of the activation conditions over the activity and selectivity of the solids. The reaction between glycerol and acetone led to the formation of 2,2-dimethyl-1,3-dioxolane-4-yl methanol, known as solketal, a novel compound with interesting applications, such as fuel additives. Furthermore, 2,2-dimethyl-1,3-dioxan-5-ol and water were also obtained as byproducts of this reaction (Scheme 1).
The reactions were carried out in a 100 cm3 BR-100 (Berghof, Eningen, Germany) high-pressure, stainless-steel batch reactor. The reaction product mixture was composed of water, solketal, and unreacted glycerol and acetone, and its composition was determined by gas chromatography with flame ionization detector (CG/FID). The glycerol conversion was determined by Equation (2) and the selectivity toward solketal by Equation (3).
X % = ( initial   glycerol   moles     final   glycerol   moles ) initial   glycerol   moles
S % = solketal   moles ( initial   glycerol   moles     final   glycerol   moles )

3. Results and Discussions

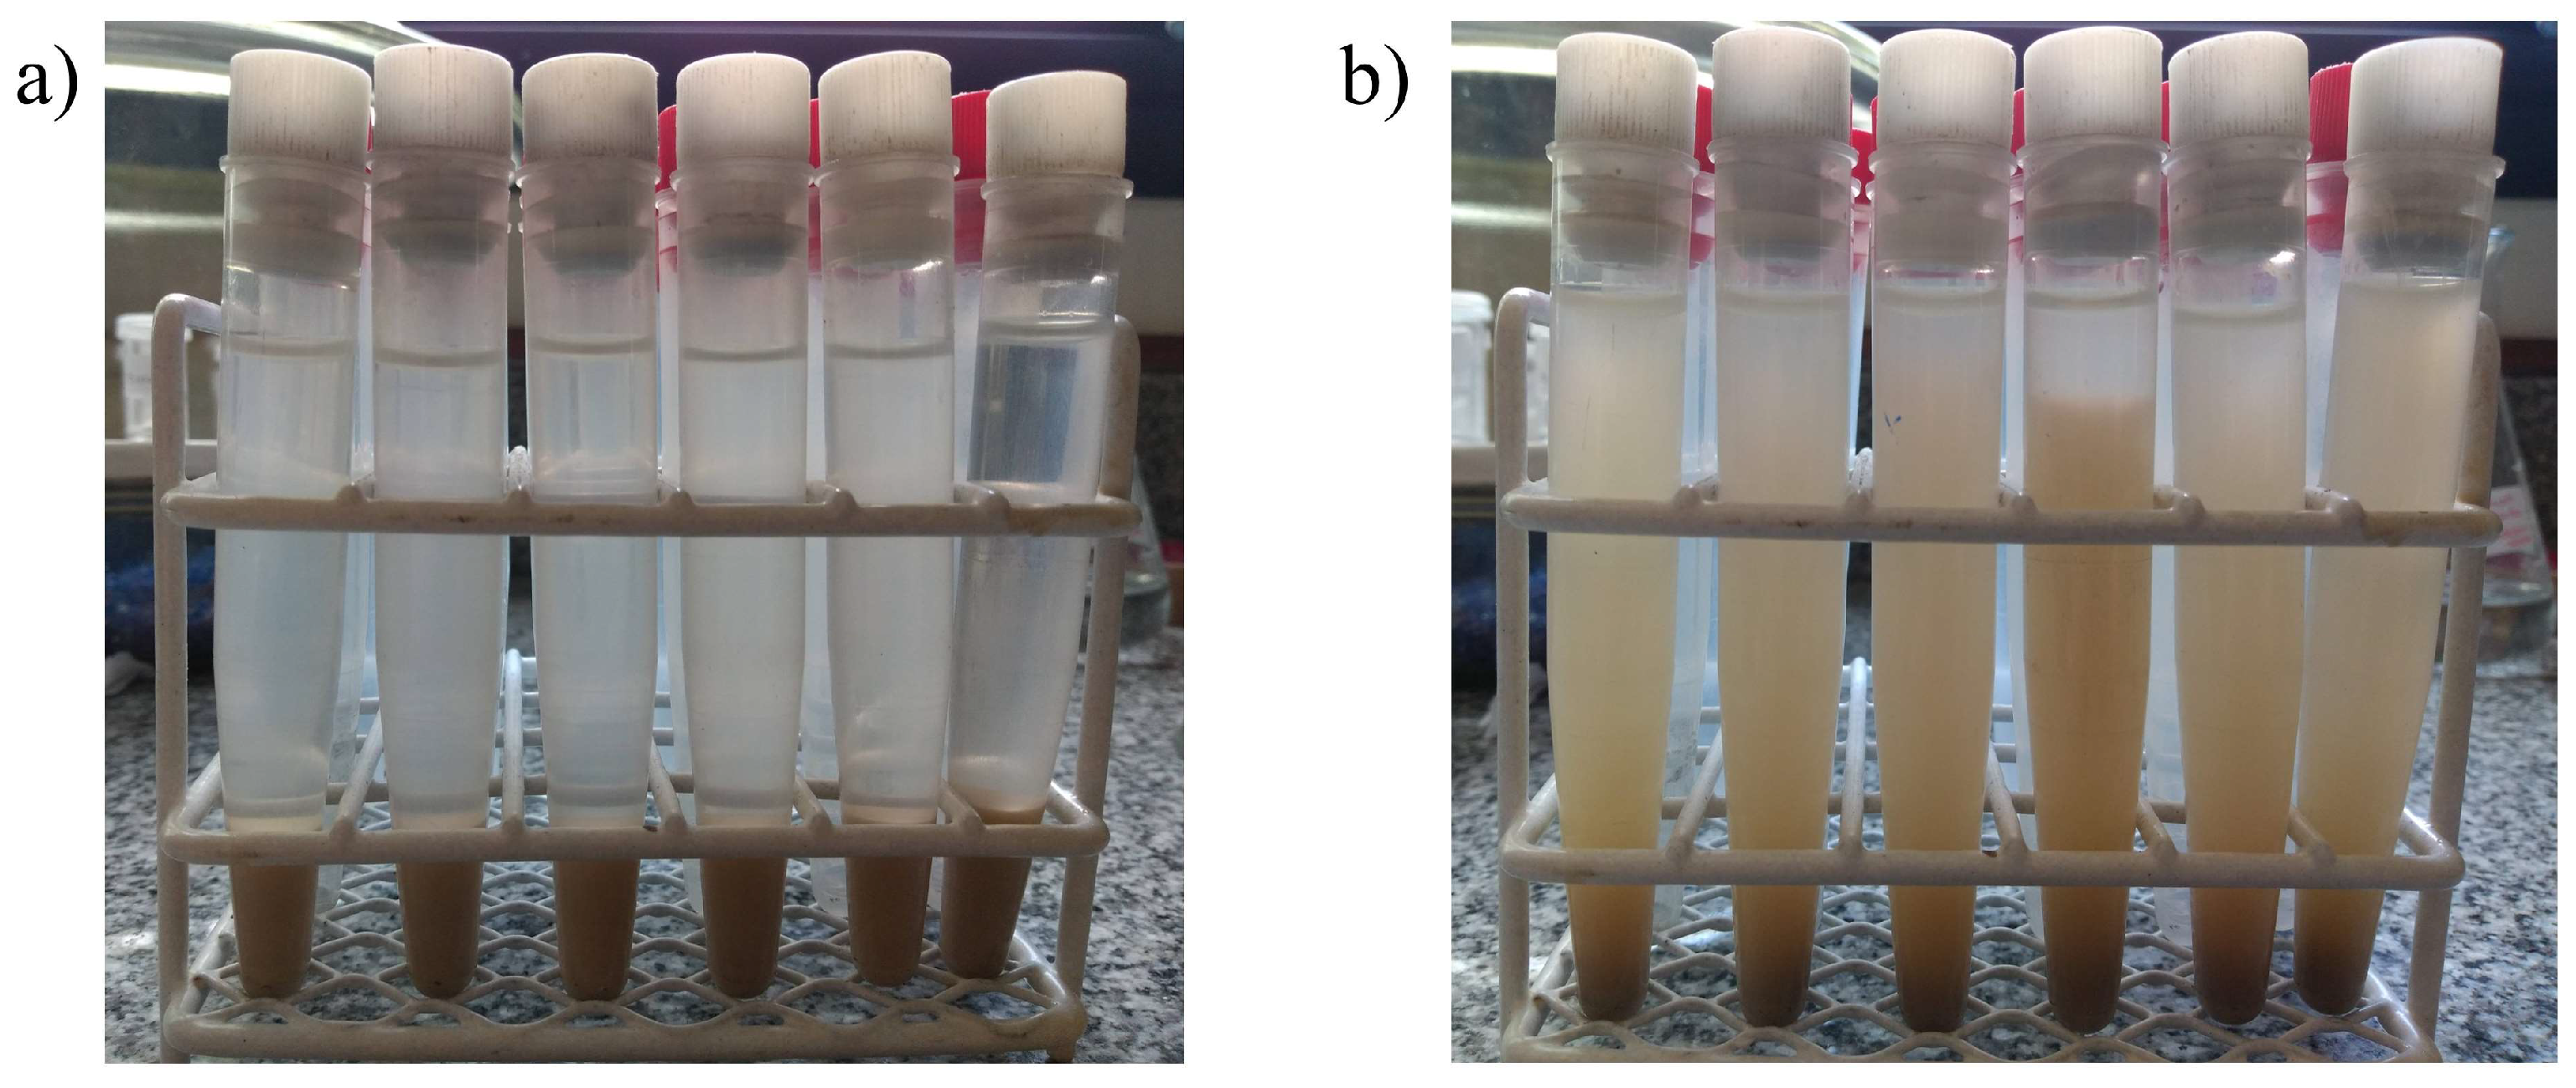
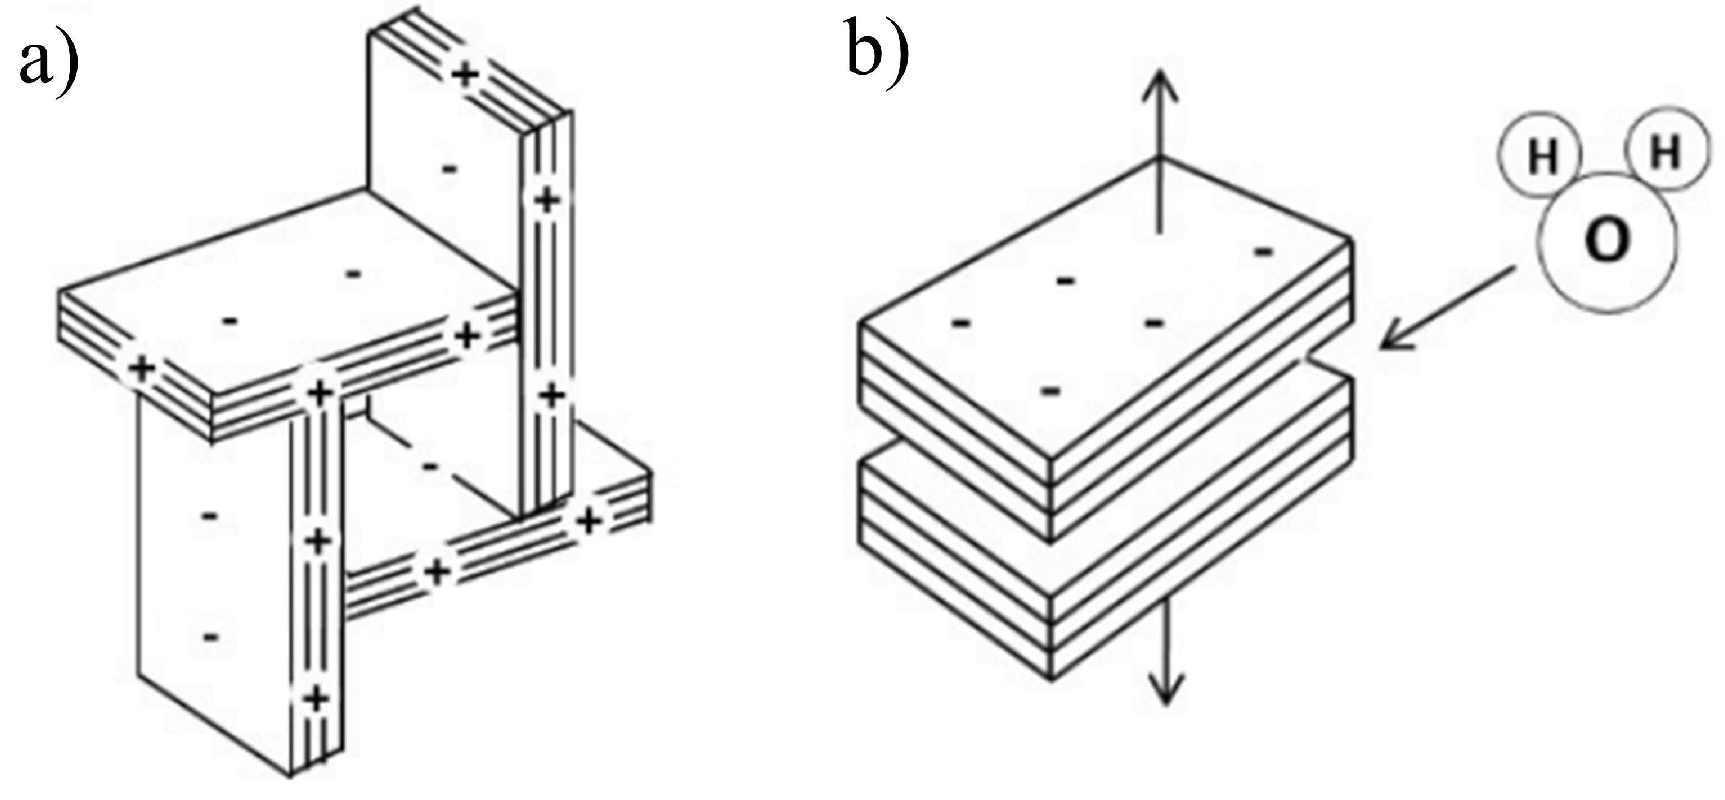
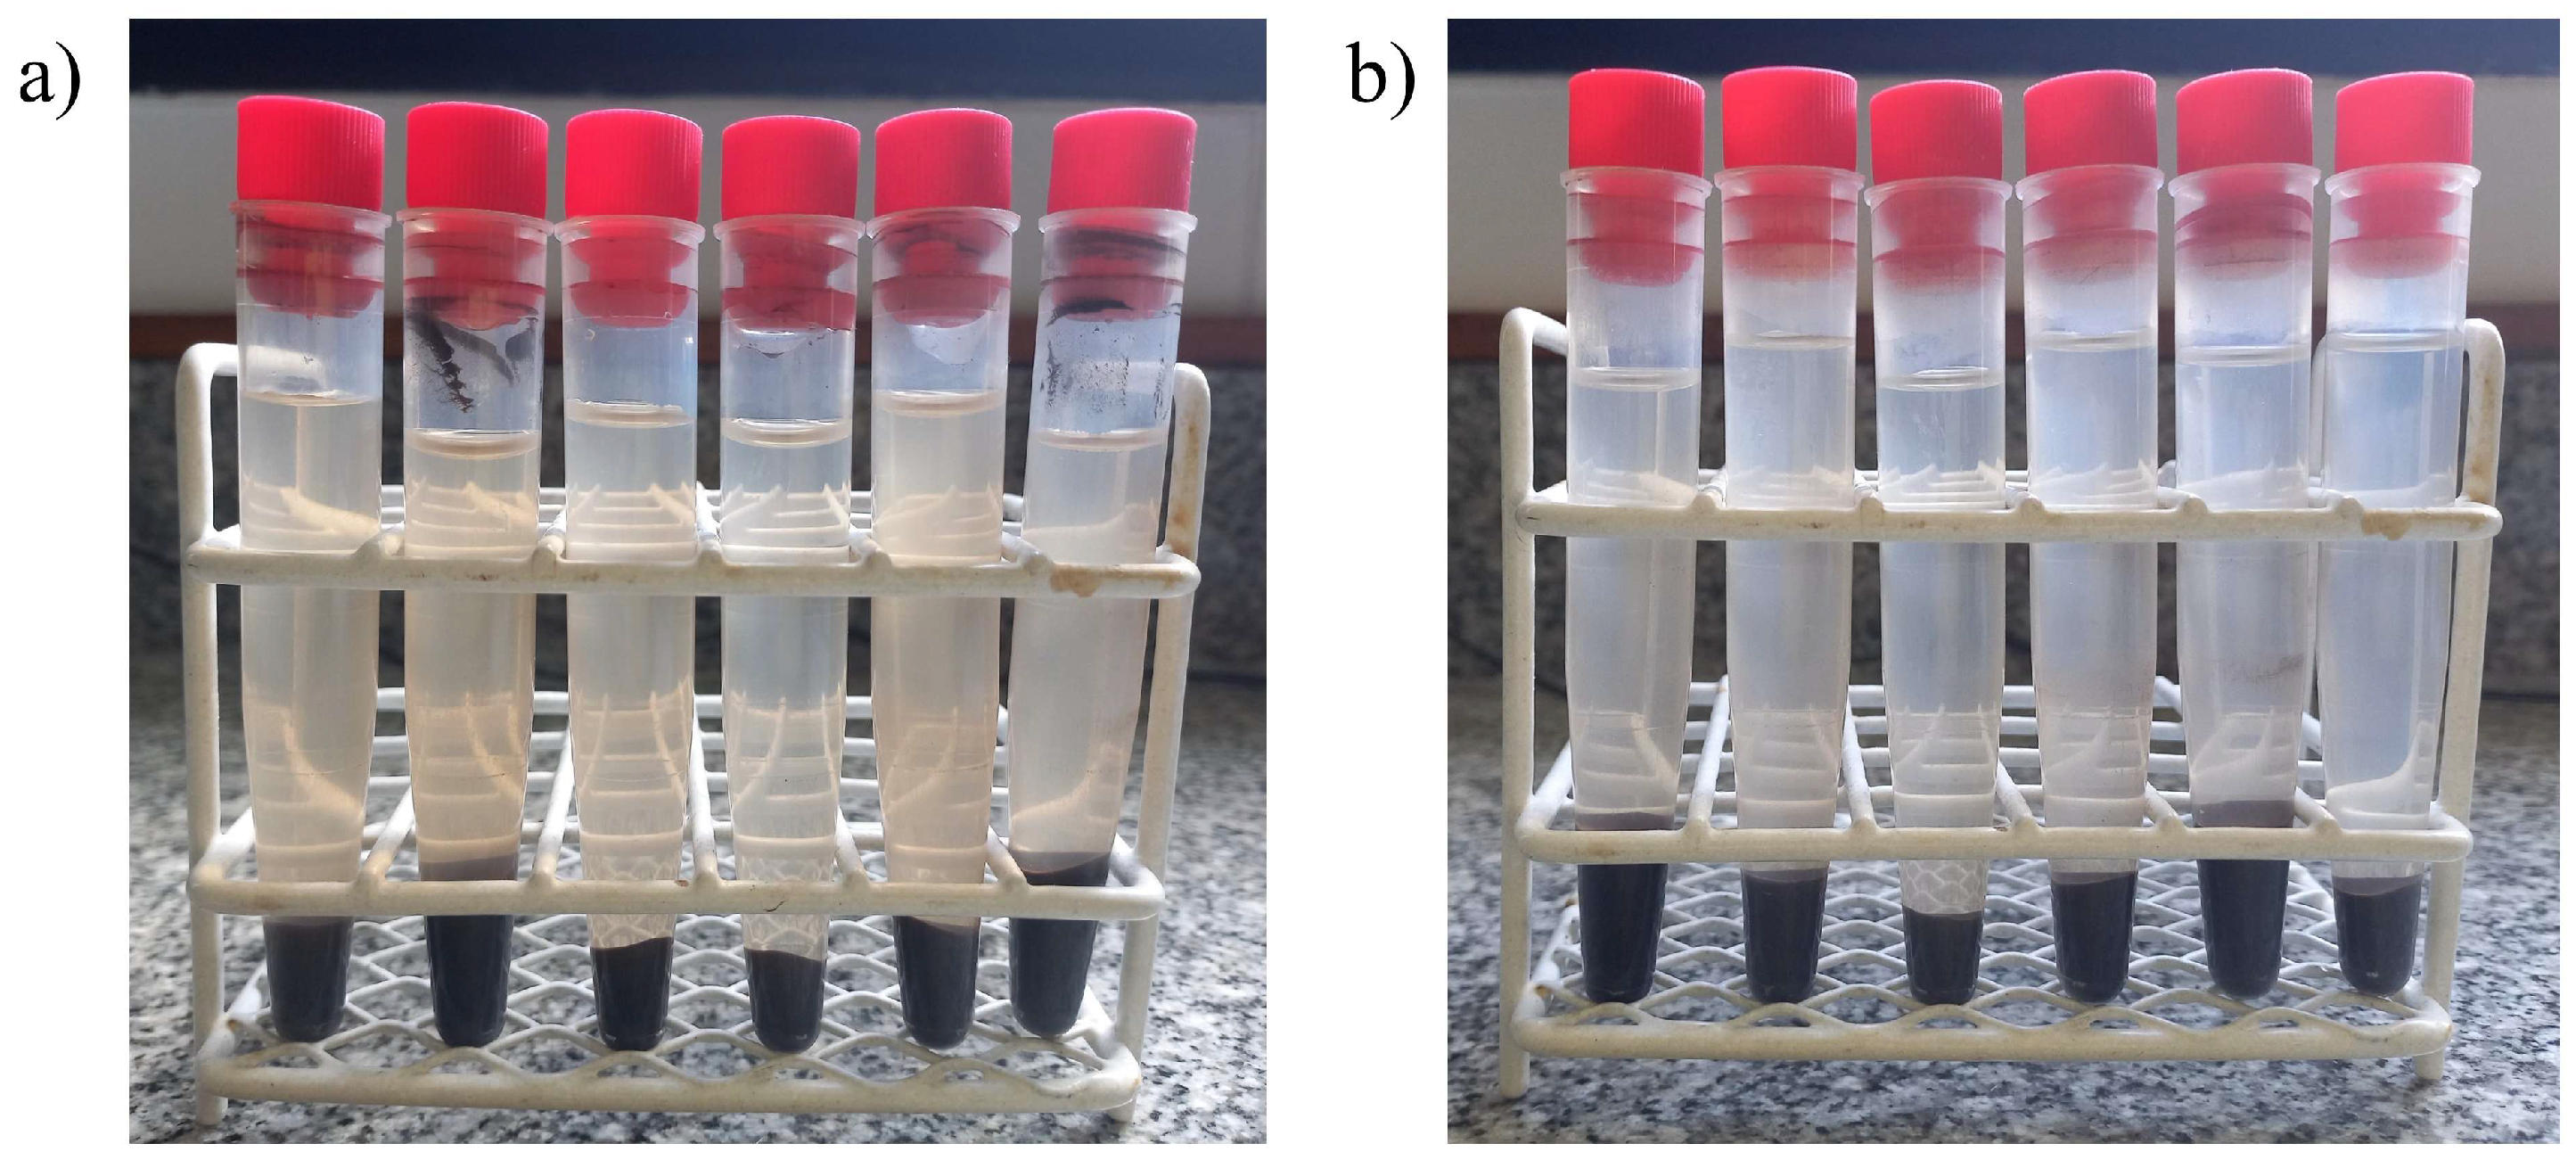
3.1. Precipitation Properties

The natural sodium bentonite used for this purpose (denoted B) was extracted from the Pellegrini Lake deposit in the province of Rio Negro, Argentina. The nanocomposite (denoted CB) was prepared by mixing TEOS sol–gel precursors and a phenol formaldehyde resin F-919. For the activation of B and CB, nitric acid solutions were employed, varying their concentrations between 0.15 and 0.5 mol L−1, at temperatures between 30 °C and 90 °C. Activated bentonites were referred to as BX-Y, while the solids prepared from the CB compound were referred to as CBX-Y, where X represents the acid concentration and Y the temperature used during activation.
These activation processes require contact between the bentonite and water during the washing steps of the solid, carried out to eliminate the residual HNO3 until a neutral pH is reached. Nevertheless, this type of clay forms colloidal suspensions in aqueous media, complexifying its separation and implementation in different processes where water is present.
The formation of suspensions is due to the ability of bentonites to retain a large amount of water in their structure; they can contain up to four layers of water molecules in the interlaminar space, depending on the moisture of the medium and the surface charges of the layers [13]. The amount of water molecules in the interlaminar space also depends on the valences of the ions: Na+ and Ca2+ can lead to the formation of up to four layers of water, while K+ can induce the formation of a monolayer. This generates a stable suspension in aqueous media and generally occurs at pH values above 5–6. Figure 1b shows the appearance of natural bentonite in aqueous media under these conditions. However, when the pH of the medium is below 5, an interaction occurs between the positive charges on the edges with the permanent negative charges of the layers, causing the bentonite to coagulate spontaneously, due to its “house of cards” conformation, as seen in Scheme 2a. This situation occurs because the alumina becomes more positively charged at low pH values, resulting in an “edge-face” interaction between Al-edge and Si-surface. As the pH increases, the edge charge shifts from positive to negative, causing the edge-face electrostatic interaction to weaken and leading to a collapse of the “house of cards” structure, recovering the original form of a pile of plates [13]. H. Seher et al. determined the pH values of the isoelectric points for some bentonites, an important parameter which determines the occurrence of edge-face interactions. In their study, they demonstrated that for electrolytes containing Na+ ions in low concentrations, at pH values of 5–6, the edge charge was still negative, which favors the formation of stable colloids [14]. These results reinforce the behavior observed in Figure 1.
Since several washing steps are required during the bentonite activation process (until pH 7 is reached), the higher the pH, the more difficult it becomes to separate the solid from the medium.
On the contrary, the CB nanocomposite did not form colloidal suspensions for the whole pH range (1–7). In Figure 2a,b, the solid-free liquid phase can be clearly observed, which would indicate that the composite did not present the same lamellar structure and avoided the formation of stable suspensions in aqueous solutions.

3.2. Characterization Results

Figure 3a shows that the N2 adsorption–desorption isotherm of natural bentonite was of type II, according to the IUPAC classification. With respect to the hysteresis loop, it was of type H3, characteristic of porous materials consisting of agglomerates of particles in the form of plates [16,17]. The low adsorption of N2 at low values of P(P0)−1 suggests that the contribution of micropores is low, while the abrupt growth of the amount of adsorbed N2 at high relative pressures suggests that there is a higher contribution of meso/macro pores.
On the other hand, Figure 3b shows the N2 adsorption–desorption isotherms for the nanocomposite CB, indicating that the adsorption curve was of type II, similar to that of natural bentonite. However, an H4-type hysteresis loop was observed, characteristic of slit pores. This fact indicates that the porosity of the silica-resin-bentonite nanocomposite is different from that of the natural bentonites.
The pore diameter distribution for sample B was determined using the BJH method in the desorption isotherm, assuming pores of cylindrical geometry [17], and it presented a unimodal character, with an average pore diameter of 4.18 Å. However, nanocomposite CB presented a uniform distribution in the mesopores range, so it was not possible to report an average diameter [18]. On the other hand, with the activation of both solids, the adsorption and desorption curves did not present changes, and neither did the pore size distribution (not shown in Figure 3).
Table 1 summarizes the textural property values of B, CB, and activated samples. The total pore volume was calculated using the N2 adsorption data at a relative pressure of 0.98, while the total specific surface area was calculated using the Brunauer–Emmett–Teller method [19]. It can be observed that solid B presented a large contribution of mesopores, while micropores represented 5.5% of the total volume. In the CB solid, a decrease in the contribution of micropores to the total volume was observed, representing 2% of the total volume. This fact could be due to the inclusion of the silica-resin structure in the bentonite. In addition, the activation of solids B and CB with HNO3 did not generate significant changes, neither in the specific surface area nor in the volume or pore size, with respect to the non-activated samples.
Table 2 shows the percentages of oxides that constitute the natural bentonite (B), the nanocomposite (CB), and the activated solids, obtained from the scanning electron microscopy analysis with EDS. As it can be observed, silicon and aluminum were the main elements in all the samples, since these elements are part of the structures of the bentonite layers. In CB, a higher percentage of Si was observed due to the contribution of Si present in TEOS. In addition, all solids presented a lower percentage of sodium, an element that is present in the interlamellar space of the bentonites, balancing the net negative charges of the layers.
The activation treatment of B and CB did not modify the compositions of Si and Al. However, in both materials, a slight decrease in the percentage of Na+ ions was observed when the severity of the acid treatment increased, which could be due to the partial substitution of Na+ ions by protons from HNO3 [20].
The XRD results are shown in Figure 4. Natural bentonite consisted mainly of montmorillonite (Mt), with some impurities of gypsum (g), quartz (q) and feldspar (f). The peaks were assigned by comparison with PDF charts from the International Diffraction Data Center, whose references are given in Table 3.
A quantitative analysis by Rietveld indicated that the bentonite consisted of 97.4% montmorillonite, the main mineral present and the most important one from the catalytic point of view. The peak observed at 2θ = 7.1° corresponded to the d001 diffraction of the montmorillonite interlamellar space, whose position depends on the degree of broadening, which generally changes when hydration conditions are changed. For sample B, the interlaminar space had a length of 12.41 Å, typical of a hydrated montmorillonite [13]. The rest of the peaks corresponded to diffractions belonging to the layer structure and remained invariant, regardless of the degree of hydration.
On the other hand, in the activated bentonites, the positions of the peaks corresponding to the layer structure were not modified, indicating that the levels of acid concentration (0.01–0.5 M) and temperatures (30–90 °C) used in the activation did not generate significant changes in the crystalline structure. However, a shift of the peak corresponding to the basal space from 2θ = 7.08° to 7.4° was observed when bentonite was acidified with 0.5 M HNO3 (samples B0.5-30 and B0.5-90), implying a reduction of this space from 12.41 Å to 11.94 Å (Figure 4). This may be due to the partial substitution of the cations present in the interlaminar space by protons coming from nitric acid, which are smaller and therefore present a smaller hydration sphere as well [21].
In the case of the CB nanocomposite, although it retained the peaks of natural bentonite, it showed changes in the laminar structure due to the shift of the d001 peak towards a lower value of 2θ, from 7.08° to 5.72°, indicating a widening of the interlaminar space from 12.41 Å to 15.17 Å (Figure 4). The shift of the d001 peak for the activated composite samples could be visualized because the interlaminar space was already widened by the incorporation of the silica-resin structure into the bentonite.
Figure 5a shows the FTIR spectra of natural bentonite and the activated sample under the most severe conditions (solid B0.5-90). The signals at 465 and 520 cm−1 correspond to Si-O vibrations in the tetrahedral sheets, while the signal observed at 798 cm−1 is characteristic of the Si-O vibration present in quartz [18]. In addition, the signals at 919 cm−1 and 3629 cm−1 are attributed to the Al-OH vibrations of the octahedral layers [20]. On the other hand, the bands observed at 1641 and 3460 cm−1 are attributed to the H-OH vibrations of the water adsorbed in the interlamellar space [22].
As it can be observed, the spectra of the activated bentonites indicate that the acid treatment did not affect the structures of the solids, as the bands observed in both solids are the same.
Figure 5b shows the infrared spectra of the CB and CB0.5-90 solids. The CB solid presents the same bands as B, and it also presents two bands at 808 and 1100 cm−1, which can be attributed to Si–O–Si bonds coming from the condensation of TEOS [18]. The bands observed in both solids remain unchanged, indicating that the acid treatment did not generate important changes in the structure of the solid.
The potentiometric titration technique was carried out to determine the average strength of the acid sites of the solids. The acid sites present in natural bentonite came from two main sources [23]. On the one hand, the cations were present in the interlaminar space, which had a strong polarization effect on the water molecules that were part of the hydration sphere. On the other hand, there were sites located at the edges of the layers, resulting from the breaking of saturated bonds. The latter can be compensated by hydroxyl groups, constituting Brϕnsted-type acid sites. For example, the cleavage of the ≡ Si–O–Si ≡ bond in the tetrahedral layer can generate an ≡ Si-OH site. Additionally, coordinately unsaturated Al+3 and Mg+2 cations can behave as Lewis-type acid sites, due to their capacities to accept electrons. This has been schematized in Scheme 3, where the locations of acid sites in natural bentonites are shown.
As observed in Figure 6 and Table 4, the initial potential of natural bentonite presented a value of −62.7 mV, indicating that the average strength of the acid sites was weak. However, even at the mildest acidification conditions (0.15 mol L−1 and 30 °C), sites of higher strength were generated. As the nitric acid concentration and temperature increased, the initial potential increased (Table 4), indicating that the average strength of the acid sites increased. Furthermore, it can be observed that the effect of increasing temperature was stronger than increasing acid concentration. This behavior was reported by H. Babaki, who established that the activation energy of the acidification process of solids decreases if the temperature is increased, accelerating the acidification process [24]. For this reason, the condition of 90 °C and an HNO3 concentration of 0.5 mol L−1 led to the generation of sites with higher strength.
To determine the amount of acid sites (without discriminating their strength) of natural bentonite, a titration with sodium hydroxide was performed as reported by Maryam Tangestanifard et al. [12]. The results in Table 5 show that the amount of acid sites was approximately 3 times higher in sample B0.5-90, with respect to B. It was also observed that there were smaller differences in the amount of acid sites in samples B0.15-30 and B0.5-30. This can be explained by the fact that protonation starts from the Si-OH sites located at the edges, which present the lowest acidic strength. When the HNO3 concentration is increased, protonation occurs in the interlaminar spaces [25], giving higher acidic strength, as determined by potentiometric titration. Moreover, these results are in agreement with the EDS observations: the increase in HNO3 concentration and temperature favors the exchange of interlaminar ions for protons, increasing the strength of the acid sites.
The results obtained with the CB0.5-90-activated composite show that the concentrations of the acid sites were similar to those in the B0.5-90 sample, (3.9 mmol per gram of bentonite), indicating that the acidity of CB0.5-90 was provided by the bentonite fraction of the nanocomposite.
To test the effectiveness of the activated material as a catalyst, the activity in the reaction of solketal synthesis from glycerol and acetone was evaluated. The tests were performed at 50 °C, with an acetone/glycerol molar ratio (A/G) of 6, and a bentonite mass to glycerol mass ratio of 0.05.
Solids B and CB showed no activity during the reaction, while the acidified solids turned out to be active. In addition, it is worth mentioning that the activated silica-resin structure by itself did not exhibit any activity, so the presence of bentonite in the nanocomposite was necessary to generate activity. This was in agreement with the results obtained for the number of moles, which indicated that the acid sites were generated on the bentonite and not on the silica-resin structure.
In addition, the activity of the solids was higher for the acidified samples with higher acid concentrations and temperatures in the same direction of the determined surface acidity.
With respect to the solketal selectivity observed, in all cases, a selectivity higher than 80% was obtained, results that agree with those reported by all authors [26,27,28,29].
The difference in the results obtained in the second use for both solids is remarkable, mainly due to the loss of solid material (35–45 wt.%) during the process of separating the bentonites from the aqueous solution of reaction products. As the silica-resin-bentonite nanocomposite does not form colloidal suspensions, its recovery from reaction media allows it to be reused, preserving its activity without losing material.

4. Conclusions

In the present work, it was possible to synthesize a silica-resin-bentonite nanocomposite material, which does not form colloidal suspensions typical of natural bentonites, and facilitate the process of separation of aqueous media, both in the activation medium and in the catalytic reaction. This is indispensable for the acidification of the material on a larger scale and the reuse of the solid in catalytic applications.
The solids were activated with HNO3, varying the acid concentrations (0.15–0.5 mol L−1) and acidification temperatures (30–90 °C), in order to provide acid sites capable of catalyzing reactions, such as the glycerol ketalization, with acetone.
The inclusion of the silica-resin structure to the bentonite generated a widening of the interlaminar space of the bentonite due to condensation reactions between the silica-resin and the -OH groups of the clay layers, with the consequent modification of the porosity. In addition, the properties of the bentonite in the composite were not modified by the activation process, reaching a concentration of acid sites and catalytic activity similar to that of the activated natural bentonite.

Author Contributions

Conceptualization, N.N.N., G.F.S. and F.M.P.; methodology, F.P.; investigation, F.M.P. and F.P.; writing—original draft preparation, F.M.P. and F.P.; writing—review and editing, N.N.N. and G.F.S.; supervision, N.N.N.; project administration, G.F.S.; funding acquisition, N.N.N. and G.F.S. All authors have read and agreed to the published version of the manuscript.

Funding

This research was funded by “Consejo Nacional de Investigaciones Científicas y Técnicas” (CONICET-PIP 0065) and “Universidad Nacional de La Plata” (UNLP-I248).

Acknowledgments

The doctoral fellowship granted by UNLP to F.M.P. is gratefully acknowledged.

Conflicts of Interest

The authors declare no conflict of interest. The funders had no roles in the design of the study; in the collection, analyses, or interpretation of data; in the writing of the manuscript; or in the decision to publish the results.

References

  1. Murray, H.H. Applied Clay Mineralogy; Elsevier: Amsterdam, The Netherlands, 2007. [Google Scholar]
  2. Elfadly, A.M.; Zeid, I.F.; Yehia, F.Z.; Abouelela, M.M.; Rabie, A.M. Production of Aromatic Hydrocarbons from Catalytic Pyrolysis of Lignin over Acid-Activated Bentonite Clay. Fuel Process. Technol. 2017, 163, 1–7. [Google Scholar] [CrossRef]
  3. Rabie, A.M.; Mohammed, E.A.; Negm, N.A. Feasibility of Modified Bentonite as Acidic Heterogeneous Catalyst in Low Temperature Catalytic Cracking Process of Biofuel Production from Nonedible Vegetable Oils. J. Mol. Liq. 2018, 254, 260–266. [Google Scholar] [CrossRef]
  4. Nones, J.; Riella, H.G.; Trentin, A.G.; Nones, J. Effects of Bentonite on Different Cell Types: A Brief Review. Appl. Clay Sci. 2015, 105, 225–230. [Google Scholar] [CrossRef]
  5. Jlassi, K.; Chandran, S.; Poothanari, M.A.; Benna-Zayani, M.; Thomas, S.; Chehimi, M.M. Clay/Polyaniline Hybrid through Diazonium Chemistry: Conductive Nanofiller with Unusual Effects on Interfacial Properties of Epoxy Nanocomposites. Langmuir 2016, 32, 3514–3524. [Google Scholar] [CrossRef]
  6. Heydari, A.; Sheibani, H. Fabrication of Poly(β-Cyclodextrin-Co-Citric Acid)/Bentonite Clay Nanocomposite Hydrogel: Thermal and Absorption Properties. RSC Adv. 2015, 5, 82438–82449. [Google Scholar] [CrossRef]
  7. Ollier, R.; Rodriguez, E.; Alvarez, V. Unsaturated Polyester/Bentonite Nanocomposites: Influence of Clay Modification on Final Performance. Compos. Part A Appl. Sci. Manuf. 2013, 48, 137–143. [Google Scholar] [CrossRef]
  8. Rivas-Rojas, P.C.; Ollier, R.P.; Alvarez, V.A.; Huck-Iriart, C. Enhancing the Integration of Bentonite Clay with Polycaprolactone by Intercalation with a Cationic Surfactant: Effects on Clay Orientation and Composite Tensile Properties. J. Mater. Sci. 2021, 56, 5595–5608. [Google Scholar] [CrossRef]
  9. Seeni Meera, K.M.; Murali Sankar, R.; Murali, A.; Jaisankar, S.N.; Mandal, A.B. Sol-Gel Network Silica/Modified Montmorillonite Clay Hybrid Nanocomposites for Hydrophobic Surface Coatings. Colloids Surf. B Biointerfaces 2012, 90, 204–210. [Google Scholar] [CrossRef]
  10. Choudhury, P.R.; Mondal, P.; Majumdar, S. Synthesis of Bentonite Clay Based Hydroxyapatite Nanocomposites Cross-Linked by Glutaraldehyde and Optimization by Response Surface Methodology for Lead Removal from Aqueous Solution. RSC Adv. 2015, 5, 100838–100848. [Google Scholar] [CrossRef]
  11. Legarto, C.M.; Scian, A.; Lombardi, M.B. Preparation and Characterization of Bentonite Nanocomposites via Sol–Gel Process. SN Appl. Sci. 2019, 1, 1–7. [Google Scholar] [CrossRef]
  12. Tangestanifard, M.; Ghaziaskar, H.S. Arenesulfonic Acid-Functionalized Bentonite as Catalyst in Glycerol Esterification with Acetic Acid. Catalysts 2017, 7, 211. [Google Scholar] [CrossRef] [Green Version]
  13. Bergaya, F.; Theng, B.K.G.; Lagaly, G. Handbook of Clay Science; Elsevier: Amsterdam, The Netherlands, 2006. [Google Scholar]
  14. Seher, H.; Geckeis, H.; Fanghänel, T.; Schäfer, T. Bentonite Nanoparticle Stability and the Effect of Fulvic Acids: Experiments and Modelling. Colloids Interfaces 2020, 4, 16. [Google Scholar] [CrossRef] [Green Version]
  15. Shamsuddin, R.M.; Verbeek, C.J.R.; Lay, M.C. Settling of Bentonite Particles in Gelatin Solutions for Stickwater Treatment. Procedia Eng. 2016, 148, 194–200. [Google Scholar] [CrossRef] [Green Version]
  16. Rutherford, D.W.; Chiou, C.T.; Eberl, D.D. Effects of Exchanged Cation on the Microporosity of Montmorillonite. Clays Clay Miner. 1997, 45, 534–543. [Google Scholar] [CrossRef]
  17. Torres, D.; Villarroel-Rocha, J.; Barrera, D.; Gutarra, A.; Sapag, K.; Citar, C. Effects of the Calcination Temperature and the Load of Sodium Carboxymethyl Cellulose in the Synthesis of Novel Bentonite Ceramic Foams. Rev. Av. Investig. Ing. 2017, 14, 133–144. [Google Scholar]
  18. Legarto, M.C.; Benito, D.; Scian, A.; Lombardi, M.B. Obtention and Characterization of a Hybrid Nanocomposite Monolith by Sol–Gel Process. Boletín Soc. Española Cerámica Vidr. 2021, 1–11. [Google Scholar] [CrossRef]
  19. Brunauer, S.; Emmett, P.H.; Teller, E. In Multimolecular. J. Am.Chem.Soc. 1938, 60, 309–319. [Google Scholar] [CrossRef]
  20. Alexander, J.A.; Ahmad Zaini, M.A.; Surajudeen, A.; Aliyu, E.N.U.; Omeiza, A.U. Surface Modification of Low-Cost Bentonite Adsorbents—A Review. Part. Sci. Technol. 2019, 37, 534–545. [Google Scholar] [CrossRef]
  21. Timofeeva, M.N.; Panchenko, V.N.; Krupskaya, V.V.; Gil, A.; Vicente, M.A. Effect of Nitric Acid Modification of Montmorillonite Clay on Synthesis of Solketal from Glycerol and Acetone. Catal. Commun. 2017, 90, 65–69. [Google Scholar] [CrossRef]
  22. Alabarse, F.G.; Conceição, R.V.; Balzaretti, N.M.; Schenato, F.; Xavier, A.M. In-Situ FTIR Analyses of Bentonite under High-Pressure. Appl. Clay Sci. 2011, 51, 202–208. [Google Scholar] [CrossRef] [Green Version]
  23. Lambert, J.F.; Poncelet, G. Acidity in Pillared Clays: Origin and Catalytic Manifestations. Top. Catal. 1997, 4, 43–56. [Google Scholar] [CrossRef]
  24. Babaki, H.; Salem, A.; Jafarizad, A. Kinetic Model for the Isothermal Activation of Bentonite by Sulfuric Acid. Mater. Chem. Phys. 2008, 108, 263–268. [Google Scholar] [CrossRef]
  25. Komadel, P. Chemically Modified Smectites. Clay Miner. 2003, 38, 127–138. [Google Scholar] [CrossRef] [Green Version]
  26. Nanda, M.R.; Zhang, Y.; Yuan, Z.; Qin, W.; Ghaziaskar, H.S.; Xu, C. Catalytic Conversion of Glycerol for Sustainable Production of Solketal as a Fuel Additive: A Review. Renew. Sustain. Energy Rev. 2016, 56, 1022–1031. [Google Scholar] [CrossRef]
  27. Perez, F.M.; Nichio, N.; Pompeo, F. Thermodynamic Assessment of Chemical Equilibrium for the Synthesis of Solketal in the Liquid Phase. Chem. Eng. Technol. 2021, 44, 1356–1363. [Google Scholar] [CrossRef]
  28. Perez, F.M.; Legarto, C.; Lombardi, M.B.; Santori, G.F.; Pompeo, F.; Nichio, N.N. Activated Bentonite Nanocomposite for the Synthesis of Solketal from Glycerol in the Liquid Phase. Catalysts 2022, 12, 673. [Google Scholar] [CrossRef]
  29. Moreira, M.N.; Faria, R.P.V.; Ribeiro, A.M.; Rodrigues, A.E. Solketal Production from Glycerol Ketalization with Acetone: Catalyst Selection and Thermodynamic and Kinetic Reaction Study. Ind. Eng. Chem. Res. 2019, 58, 17746–17759. [Google Scholar] [CrossRef]
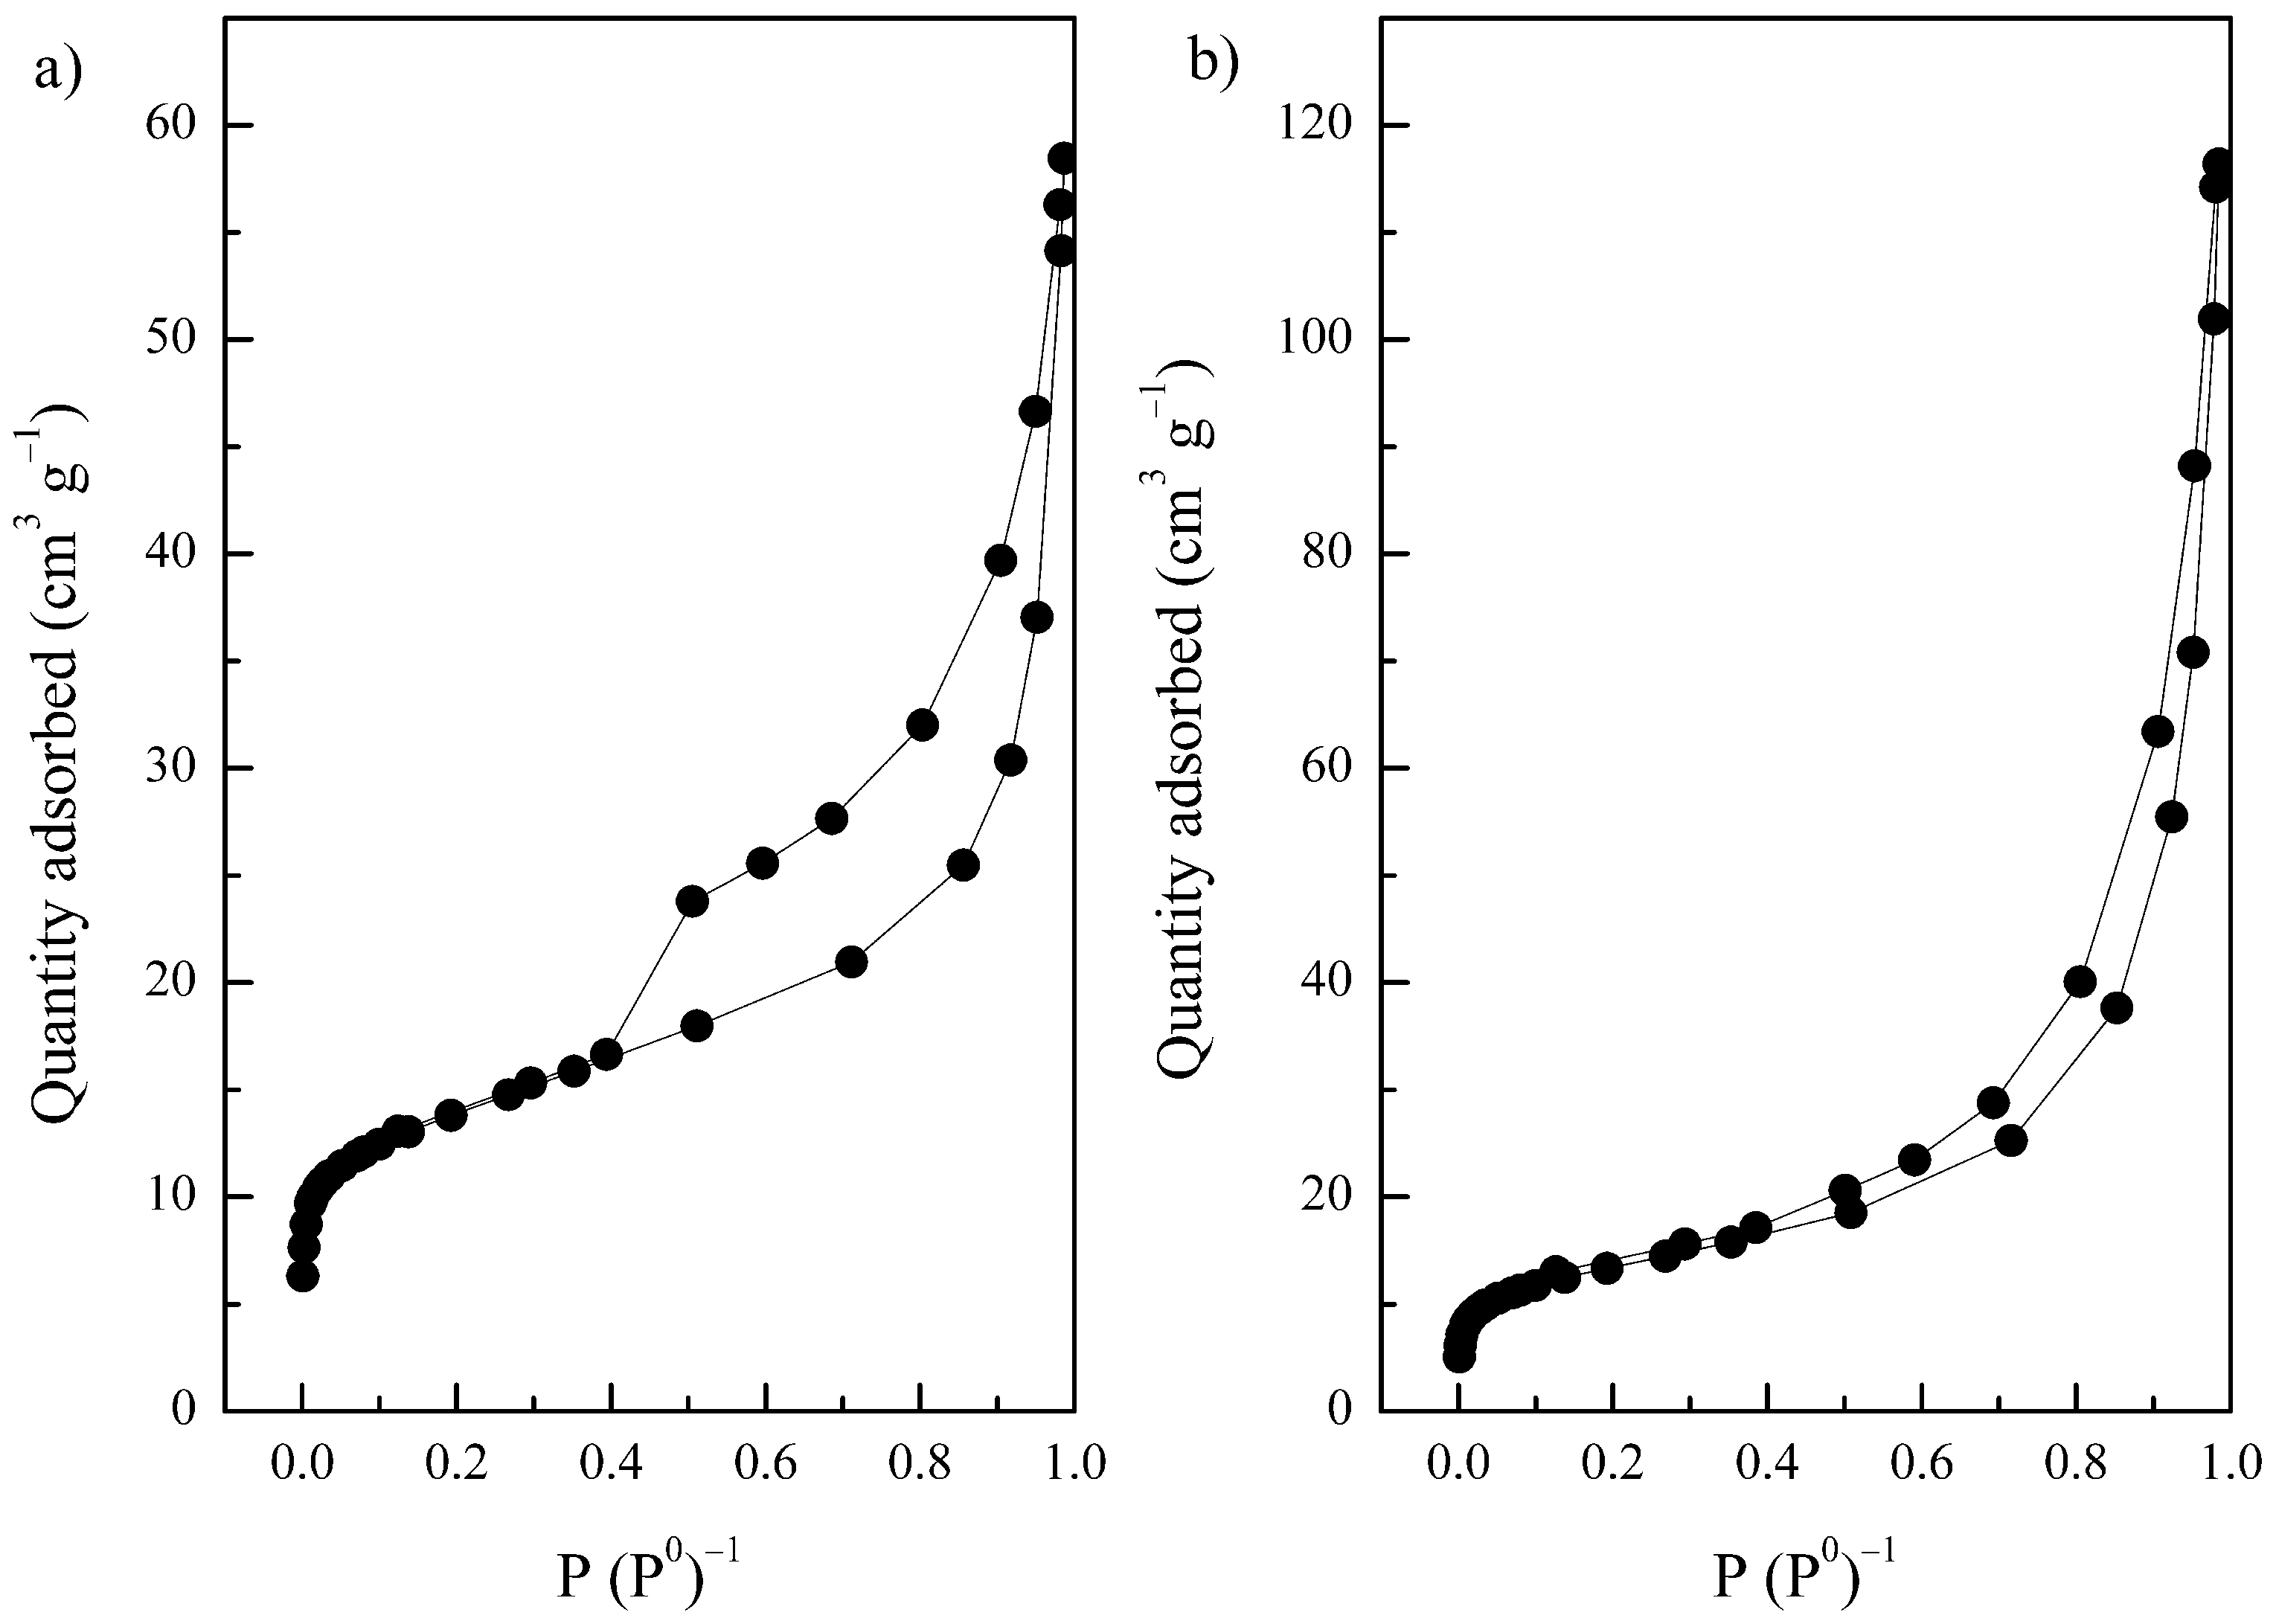
Scheme 1. Ketalization reaction between glycerol and acetone.
Minerals 12 01486 sch001
Figure 1. Bentonite B in contact with an aqueous solution of HNO3; (a) pH = 3; (b) pH = 5. All the vials contain bentonite B.
Minerals 12 01486 g001
Scheme 2. (a) “House of cards” conformation of bentonites at pH < 5 due to the interaction between positively charged edges and Si-surface; (b) original conformation of bentonites at pH near 7, due to the negative edge charge that generates a collapse of the “house of cards” structure. Extracted from [15].
Minerals 12 01486 sch002
Figure 2. Silica-resin-bentonite nanocomposite CB in contact with the water solution of HNO3; (a) pH = 3; (b) pH = 5. All the vials contain solid CB.
Minerals 12 01486 g002
Figure 3. N2 adsorption–desorption isotherms for: (a) natural bentonite; (b) silica-resin-bentonite nanocomposite.
Minerals 12 01486 g003
Figure 4. X-ray diffractions of solids.
Minerals 12 01486 g004
Figure 5. FTIR spectra of the solids. (a) Spectra of the bentonite B and the acidified solid B0.5-90; (b) spectra of the silica-resin-bentonite nanocomposite CB and the acidified solid CB0.5-90.
Minerals 12 01486 g005
Scheme 3. Location of acid sites in natural bentonites.
Minerals 12 01486 sch003
Figure 6. Potentiometric titration of the solids: (a) natural and activated bentonites; (b) silica-resin-bentonite nanocomposite.
Minerals 12 01486 g006
Table 1. Textural properties of the solids.
SolidSBET 1Vpore 2MicroporesMesopores
Smicro 3Vmicro 3Smeso 4Vmeso 4
B38.600.082310.420.0045428.180.0778
B0.15-3046.980.071315.920.0068631.060.0644
B0.5-3038.600.059812.570.0054426.030.0544
B0.5-9040.100.060711.370.0042528.730.0565
CB45.070.15764.260.0031440.810.1545
CB0.5-9042.280.14684.780.0035637.500.1442
1 Total specific area (m2 g−1). 2 Total pore volume (cm3 g−1). 3 Micropore area (m2 g−1) and micropore volume (cm3 g−1). 4 Mesopore area (m2 g−1) and mesopore volume (cm3 g−1).
Table 2. Approximate composition of the solids.
Element in Oxide FormSolid
BB0.15-30B0.5-30B0.5-90CBCB0.5-90
SiO268.4173.5776.2976.0783.484.1
Al2O323.2621.2918.9920.1112.213.0
Na2O4.502.392.721.522.60.9
MgO3.842.751.992.301.82.0
Table 3. Phase assignment to the diffractogram peaks.
Phase2θ (°)PDF Card
Montmorillonite7.1; 19.7; 34.8; 54.2; 61.700-029-1498
Gypsum11.400-021-0816
Quartz20.8; 26.6 00-046-1045
Feldspar28.400-020-0548
Table 4. Initial potential of the solids.
SolidInitial Potential (mV)
B−62.7
B0.15-30384.5
B0.5-30374.1
B0.5-90496.3
CB−25.2
CB0.5-90450.1
Table 5. Determination of the number of acid sites present in solids and catalytic activity in the solketal synthesis reaction. * Reaction conditions: T = 50 °C; t = 30 min; A/G = 6; bentonite to glycerol mass ratio = 0.05.
ResultSolid
BB0.15-30B0.5-30B0.5-90CBCB0.5-90
Acid sites concentrations (mmol per gram of bentonite)1.442.382.934.11.403.9
Glycerol conversion (1st use) *045.353.672070.5
Glycerol conversion (2nd use) *029.432.140.2066.4
Publisher’s Note: MDPI stays neutral with regard to jurisdictional claims in published maps and institutional affiliations.

