Article

Assessing the Risk of Total and Available Potentially Toxic Elements in Agricultural Soil in Typical Mining Areas in Xiangjiang River Basin, Hunan Province

1
Anhui Institute of Optics and Fine Mechanics, Hefei Institutes of Physical Science, Chinese Academy of Sciences, Hefei 230026, China
2
University of Science and Technology of China, Hefei 230026, China
3
State Ecological Environment, Key Laboratory of Quality Control in Environmental Monitoring, China National Environmental Monitoring Center, Beijing 100012, China
*
Author to whom correspondence should be addressed.
Minerals 2021, 11(9), 953; https://doi.org/10.3390/min11090953
Submission received: 9 July 2021 / Revised: 22 August 2021 / Accepted: 25 August 2021 / Published: 31 August 2021

Abstract

:
In this study, soil and rice samples from 85 sites in six cities in Hunan Province were analyzed for Cu, Zn, Pb, Cd, Hg, Mn, and Co (total and bioavailable concentrations for soil) in July 2014. The results indicated that the total concentrations of Cu, Zn, Pb, Cd, and Hg in soil had increased significantly compared with the 1980s, and were correlated with their bioavailable concentrations in soil positively. The total concentrations of Cd and Co in soil were correlated with those in rice. Bioavailable concentrations of Cd, Mn, Co, Pb, and Cu represented 64.4%, 33.2%, 12.0%, 11.6%, and 6.1% of the total soil concentrations, respectively. The bioavailable concentrations of Cd and Co in soil had a extremely significant (p < 0.01) positive correlation with those in rice, suggesting that bioavailable concentrations was a better indicator for soil potentially toxic elements contamination. The pH values had a significant influence on the bioavailability of Cd and Cu and the amounts taken up by rice. The Cd contamination in 27.0% rice samples exceeded World Health Organization recommended thresholds. The results added basic pollution distribution data, further revealing the relationships of metals in soil and crops and would offer great help to the metallic pollution control in these areas.

1. Introduction

Potentially toxic elements contaminations (PTEs) of soil and crops have arised continuous and comprehensive concerns worldwidely due to the increase in Mining process [1]. The soil pollution caused by mining not only affects the soil quality but also results in absorption and accumulation of PTEs in plants, which threaten the food safety of crops grown in polluted soil [2,3,4,5] and human health [6].
Different methods have been used to evaluate PTEs pollution in soil and quality and safety of agricultural products [7,8,9,10]. In China, the total concentration of PTEs has been widely used to assess soil quality according to GB15618-2018 [11]. When the total concentrations of PTEs in soil exceed the threshold, the soil is considered polluted, which may overestimate the risk. In fact, the amount of PTEs absorbed by plants does not necessarily increase linearly with the total amount of PTEs in soil [12], and PTEs can result in considerable crop contamination. There may be a discrepancy in the evaluation of crop safety using the total concentration of PTEs in soil. Therefore, the bioavailability of PTEs and soil characteristics need to be considered [13]. To date, the term bioavailability has not been consistently defined. Some researchers believe that the accumulation of PTEs in plants from soil mainly depends on the uptake mechanisms of plants, physicochemical properties of the soil, and chemical speciation of the metals and metalloids in soils [14]. Peijnenburg et al. [15] and Lanno et al. [16] emphasized that bioavailability should be considered a dynamic process comprising the following three distinct steps: (1) a physicochemically controlled desorption process, referred to as environmental availability, (2) physiologically controlled uptake process, referred to as environmental bioavailability, and (3) a physiologically induced effect or accumulation within the organism, referred to as toxicological bioavailability. Herein, bioavailability is the concentration that desorbs from the total concentration and is readily available for plant uptake; it is a fraction of the total concentration [17]. The bioavailability of PTEs can be influenced by elemental geochemical behavior, contaminant source, and physicochemical properties of soil conditions, such as pH, organic matter, clay minerals, soil particle size, and rhizosphere enhancement [18,19,20,21]. Studies have revealed that the environmental risks of PTEs are linked to their bioavailable fractions in soil [13].
Rice is an important cereal crop in global agriculture. More than 90% of the world’s rice-growing area lies in Asia, mainly in China [22]. In some regions of China, PTEs contamination in rice is a critical problem because of soil pollution from agriculture, fossil fuels, mining, and other industrial activities [23]. According to recent studies, approximately 20 million km2 of arable land in China (i.e., approximately 20% of the total arable land) has been contaminated by cadmium (Cd), mercury (Hg), lead (Pb), arsenic (As), and chromium (Co). Among these, Cd is the most severe pollutant, contaminating approximately 12,700 km2 of land in China [24,25].
Hunan is one of the most important rice-producing areas in China and is rich in mineral resources. PTEs waste produced by mining activities has polluted the soil in this province [26]. It is located in the middle reaches of the Yangtze River, and the Xiangjiang River runs through the province from north to south.
Several studies have assessed the total PTEs concentrations in soil [27,28]; however, only a few have focused on the bioavailable fractions [29] or impact of PTEs bioavailability on rice [30]. This study aims to investigate the relationship between PTEs in soil (both total and bioavailable concentrations) and in rice and the risk to human health in China.

2. Materials and Methods

2.1. Sampling Sites

This study focused on characterizing and evaluating soils from six cities located along Xiangjiang River in Hunan Province. According to the concentration of PTEs in soil in history of Hunan Province [31], 85 sites were selected for sampling [32].

2.1.1. Soil Sampling and Preparation

Soil samples were collected from the upper horizon (0 cm–20 cm) of soils across a 50 m × 50 m area on each sampling site. Five samples were taken by plum blossom method, each sample was 25 cm × 25 cm, and then fully mixed [33]. All soil samples were spread out on a piece of kraft paper (80 cm × 110 cm) in an air-drying room, in a layer with a thickness of 2 cm. After removing plant leaves, crushed stone and so on, the samples were dried naturally. Following grinding and passed through a 0.15 mm sieve was used for further analyses.

2.1.2. Rice Sampling

Rice samples were collected from point to point of soil samples. Five samples of 25 cm × 25 cm were taken for each site, then fully mixed and manually threshed to separate grains from other plant materials. The grains were then air-dried to a constant weight. Husks were removed using a laboratory de-husker (OHYA-25, Satake, Japan), and the rice grains were polished with a rice polishing machine(JXFM110, CPC 96-3, CPCLAER, Shenzhen, China) until the cortices were removed from the rice grains. The polished rice grain samples were ground to a powder in a ball mill (JXFM110, CPC 96-3, CPCLAER, Shenzhen, China).

2.2. Sample Analyses

2.2.1. Analyses of Total PTEs in Soil

For each soil sample, 0.20 g of soil was digested with a mixture of 5 mL HNO3, 1 mL HClO and 1 mL HF, and processed following the methods specified by the Chinese national standard for measuring soil PTEs [34]. The concentrations of Cd, Mn, Cu, Zn, Co, and Hg were analyzed by inductively coupled plasma–mass spectrometry (ICP-MS, Agilent, 7700x, Santa Clara, CA, USA). Total Pb in soil was analyzed via X-ray fluorescence spectrometry (Niton XL3t 700s, Washington, DC, USA) [35].

2.2.2. Analyses of Bioavailable PTEs in Soil

Five grams of prepared soil were placed in a 100 mL cone bottle, and 25 mL Diethylenetriaminepentaacetic acid (DTPA) was added with a pipette. The suspensions were shaken at 200 rpm for 2 h at 25 °C, centrifuged at 8000 rpm for 10 min and filtered through 0.45 µm filter paper. The concentration of Cd, Mn, Cu, Zn, Co, Hg, and Pb were analyzed via ICP-MS (Agilent 7500a, Santa Clara, CA, USA) following standard procedures (GB/T 23739-2009) [36].

2.2.3. Analyses of PTEs Concentrations in Rice

For each rice sample, 0.20 g was digested with 7 mL HNO3. The cooled solutions were diluted to 50 mL with distilled water, and the concentrations of Cd, Mn, Cu, Zn, Co, Hg, and Pb were determined using ICP-MS (Agilent, 7500a, Santa Clara, CA, USA) following standard procedures (GB 5009. 15-2014) [37].

2.2.4. Analyses of Soil pH

The air-dried soil samples were filtered through a 0.15 mm sieve, and 10 g of sample was added into a 25 mL beaker with 10 mL distilled water. The mixture was kept still for 30 min and the pH value of the suspension was measured using a pH meter (METTLER, S220, Zurich, Switzerland).

2.3. Data Analyses

The SPSS software (IBM SPSS Statistics for Windows, Version 20.0. Armonk, IBM Corp., Armonk, NY, USA) was used to perform one-tailed and two-tailed chi-square tests of variance, and Pearson correlation and regression analyses. The significance threshold was established at p < 0.05.

3. Results

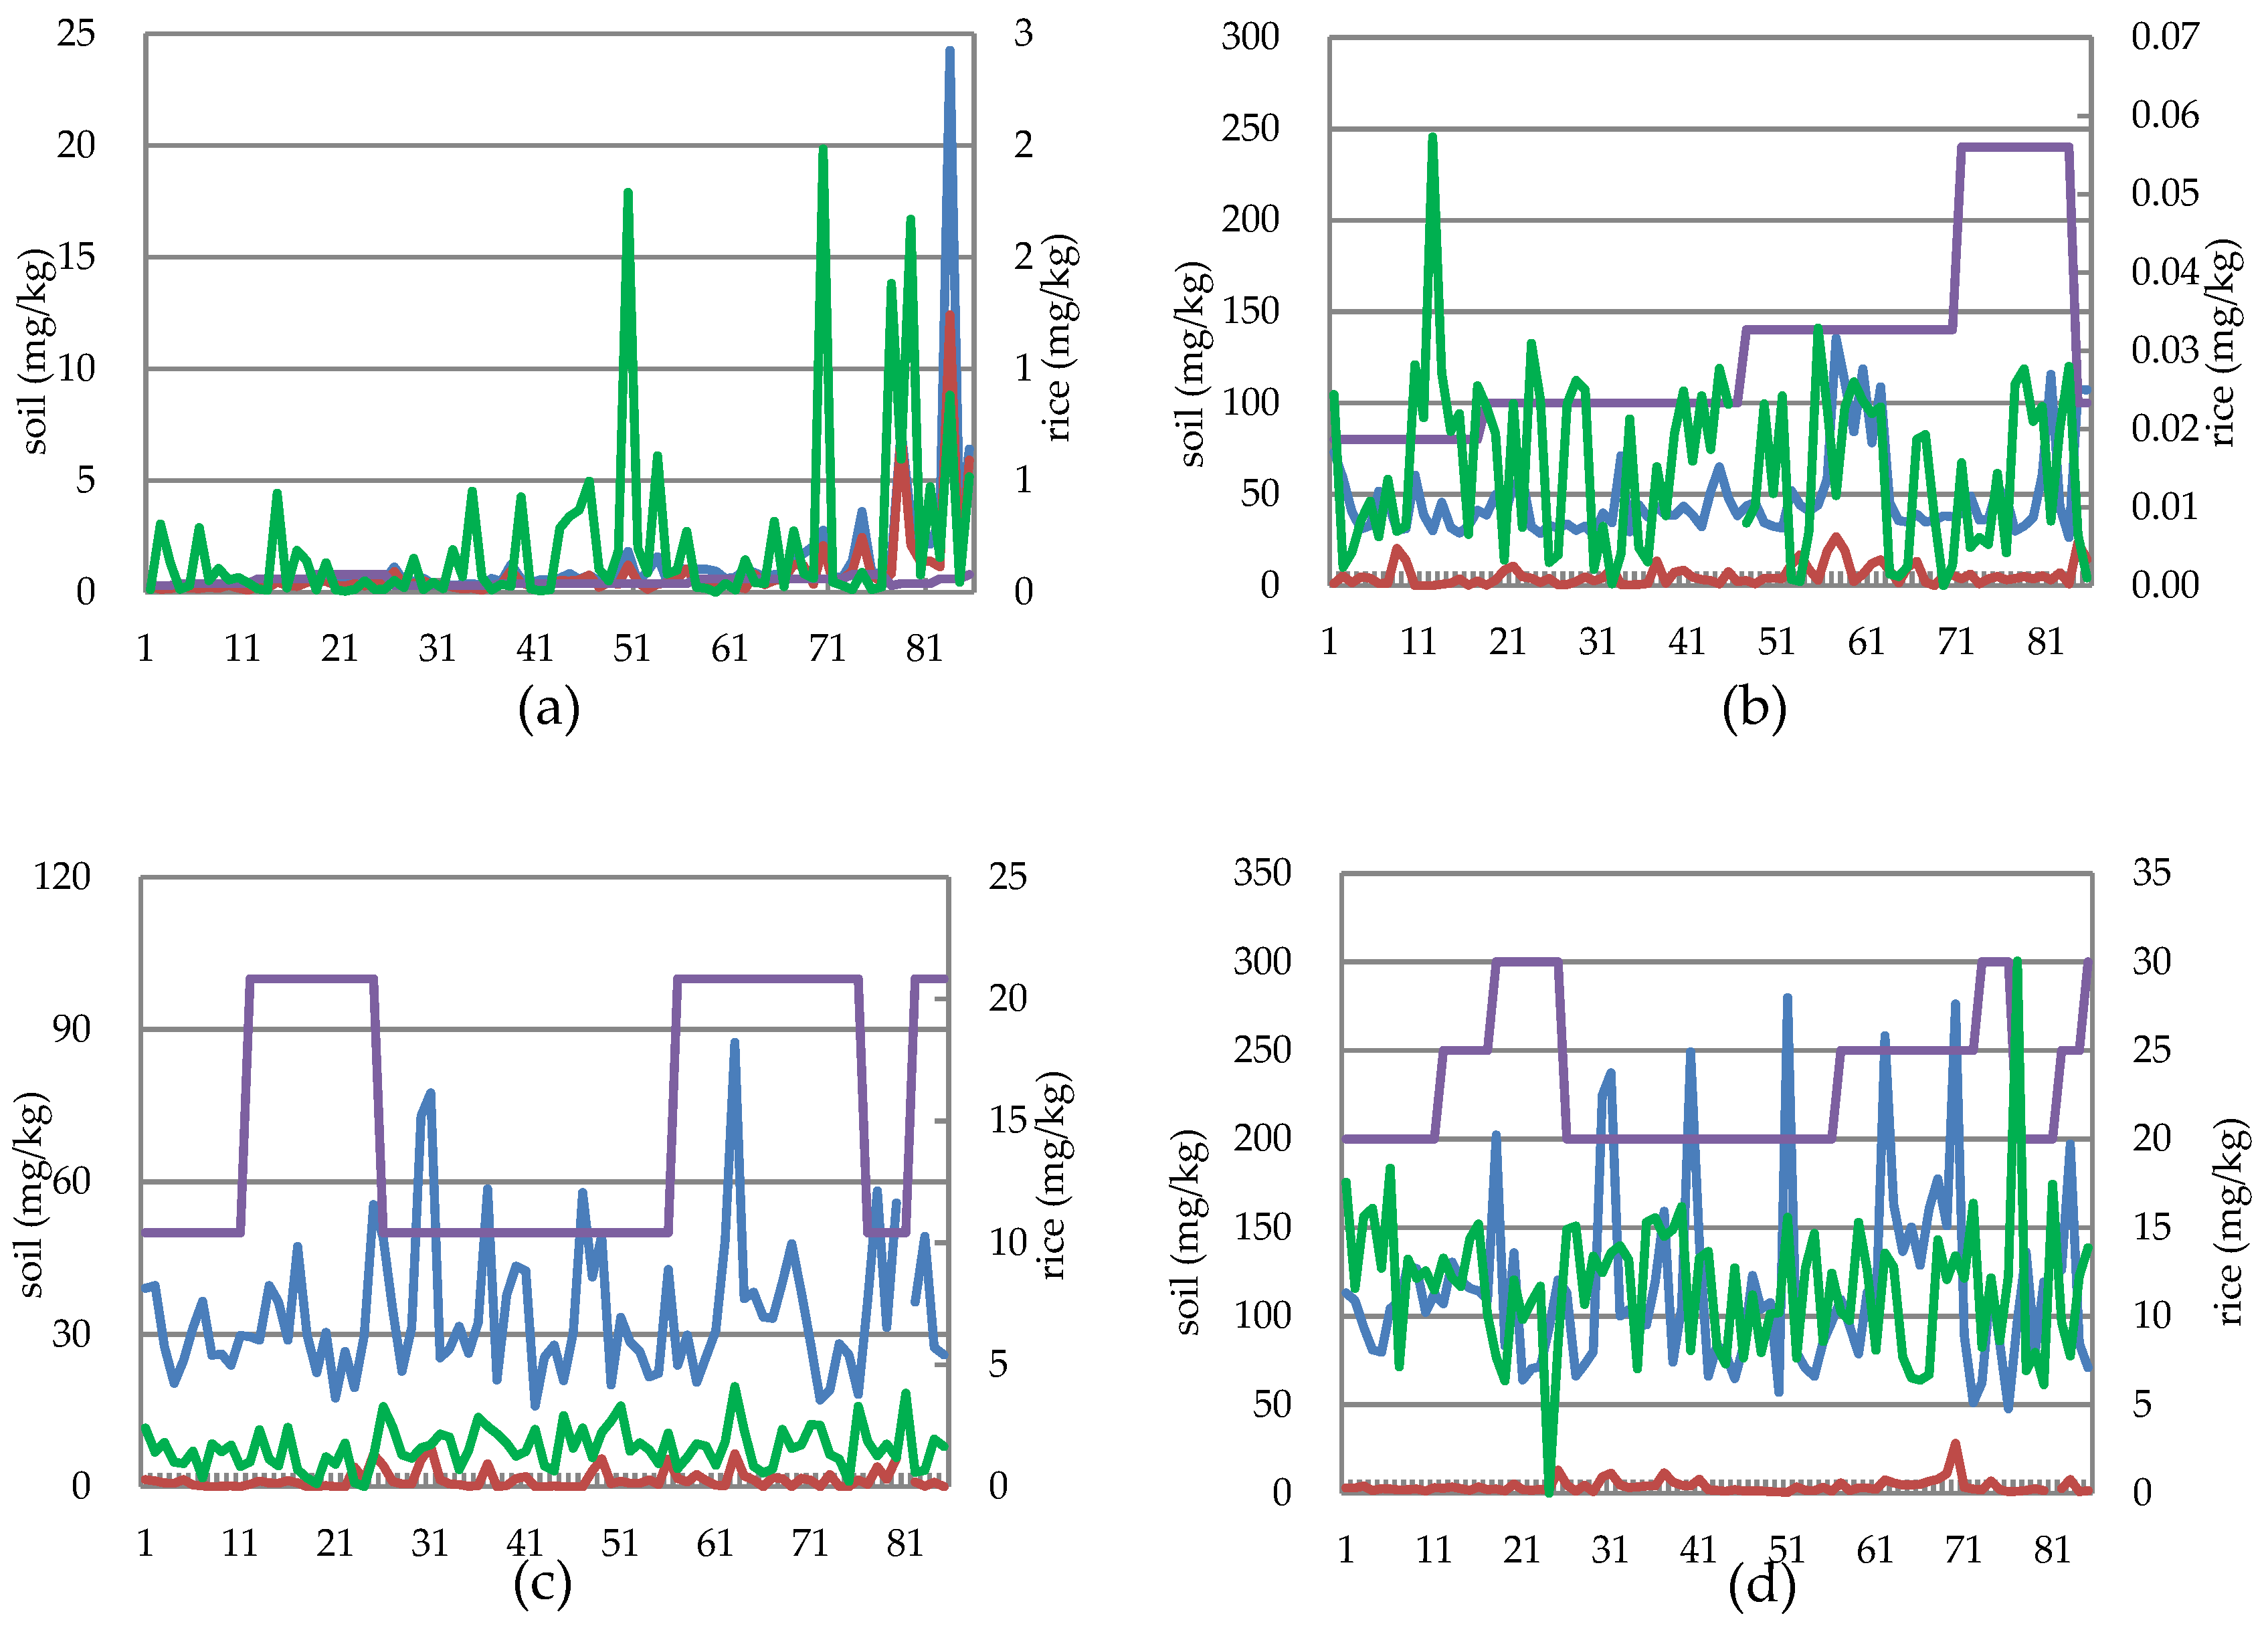
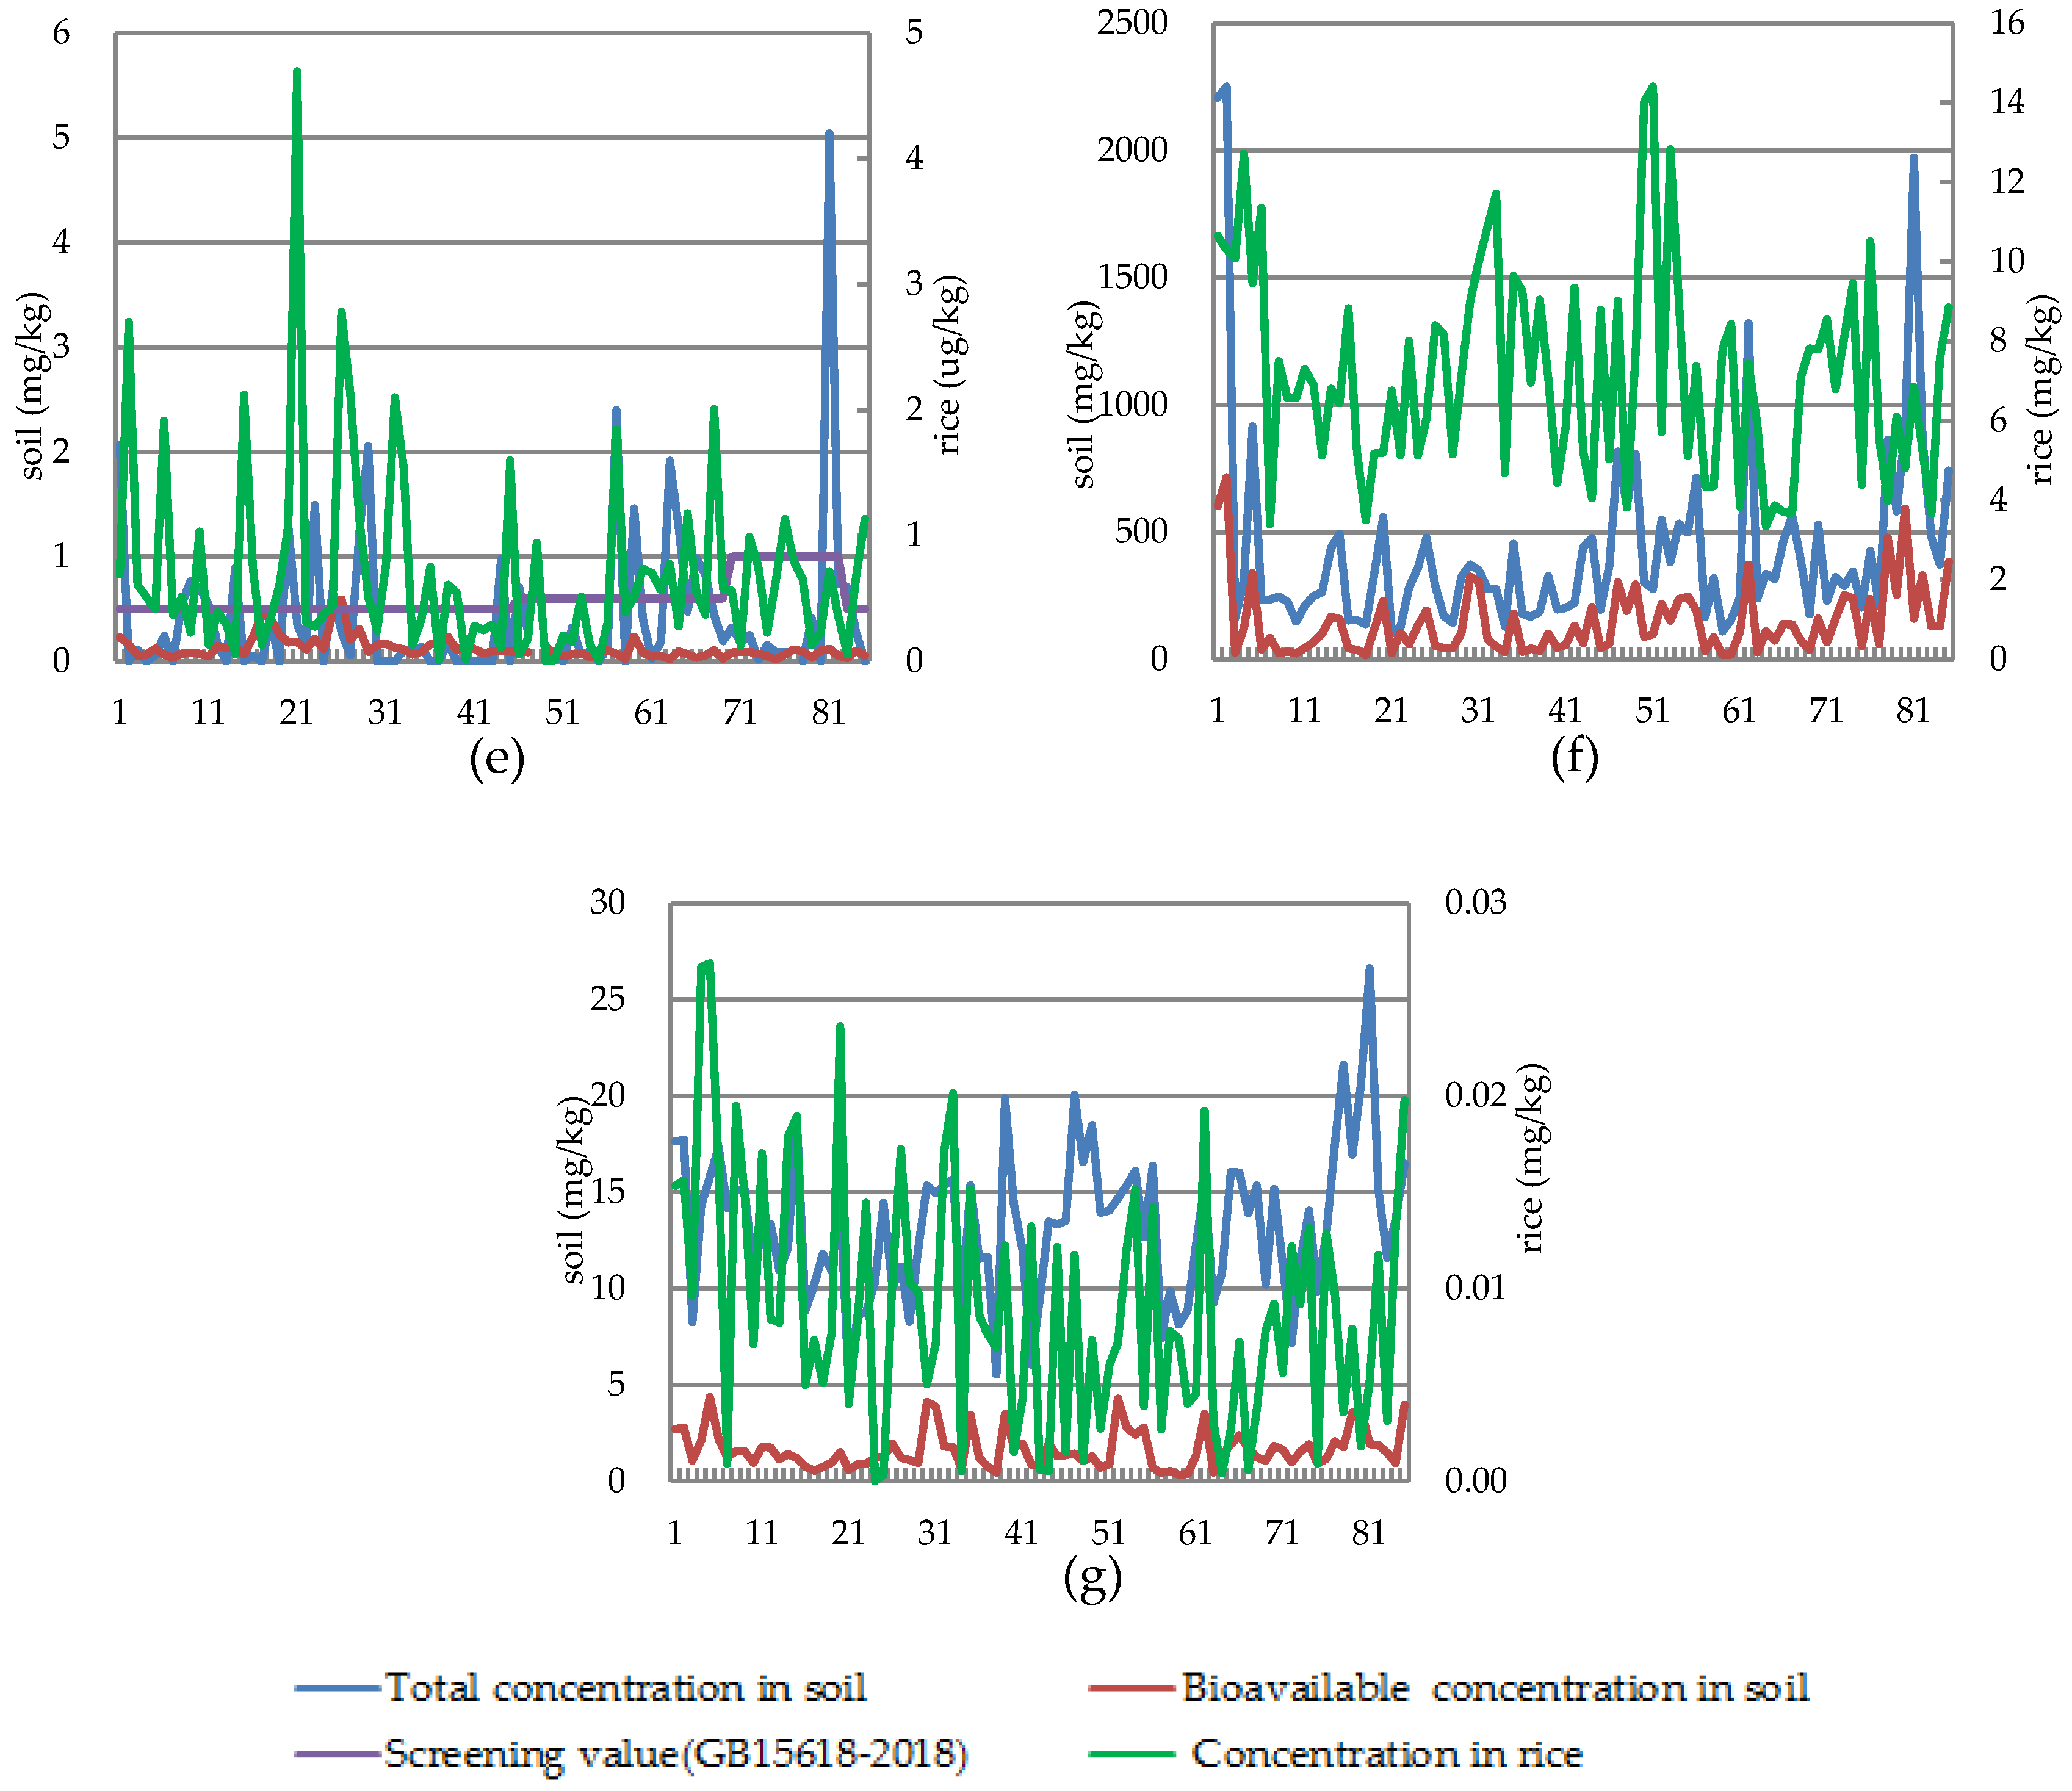
3.1. PTE Concentrations in Soil (Total and Bioavailable) and in Rice Grain

The minimum, maximum, median, mean, and standard deviation of the total Cd, Mn, Cu, Zn, Co, Hg, and Pb concentrations in soil are listed in Table 1. Table 1 also lists the total concentrations of PTEs in a historical study and the Chinese national standard safety threshold for PTEs in soil at pH 5.5 (GB15618-2018) [11].
For the 85 sample sites, the mean concentrations of Mn, Cu, Zn, Co, Pb, Cd, and Hg were 431.2 mg/kg, 45.3 mg/kg, 133.3 mg/kg, 13.29 mg/kg, 49.15 mg/kg, 1.31 mg/kg, and 0.66 mg/kg, respectively. The mean values of the total Cu, Zn, Pb, Cd, and Hg concentrations in the soil were higher than their background values (Table 1), whereas Mn and Co concentrations were lower than their background values (Table 1). For the 85 samples, the element concentrations of some samples were higher than their screening values (Figure 1). Figure 1 shows that for each element, the total soil concentration was higher than the bioavailable concentration and that the content in rice was consistently the lowest.

3.2. Correlations between Total and Bioavailable Concentrations in Soil vs. Rice

There were significant positve correlation between total concentration and the content in rice on Cd (p < 0.01) and Co (p < 0.05), Spearman correlation coefficients were 0.250 and 0.268, respectively. And also have a extremely significant positive correlation (p < 0.01) beween available concentration and the content in rice (Table 2); For Zn, Pb, Cu, Hg and Mn, there were no significant correlations between the total concentrations and the content in rice, the same on the available concentration to the content in rice (p > 0.05).
There was a significant positive correlation between the total and bioavailable concentrations of all PTEs in soil except Hg, The correlation coefficients of Cd, Pb, Mn, Cu, Zn and Co were 0.565, 0.289, 0.883, 0.427, 0.565 and 0.698, respectively (Table 3). This suggests that bioavailable concentrations are affected by the total concentrations, which is in agreement with a previous study which showed that the bioavailability content is related to the total concentration [38].

3.3. Soil pH

According to GB 15618-2018 [11], the standard limit value is divided into four categories according to the soil pH value, i.e., pH ≤ 5.5, 5.5 < pH ≤ 6.5, 6.5 < pH ≤ 7.5, and pH > 7.5. Hence, we divided the 85 soil samples into four groups according to the pH value.
To the Cd, Cu, Co, and Pb, the total soil concentrations were the highest, and followed by the bioavailable concentrations, the contents in rice were the lowest. With an increase in the pH, the bioavailable concentration increased and the content in rice varied slightly for Cd, bioavailable concentration and the content in rice varied for Cu, and the bioavailable concentrations decreased and the contents in rice were unchanged for Co and Pb (Figure 2).

3.4. PTEs Concentrations in Rice

Twenty-three samples (27.1%) exhibited Cd concentrations in rice that exceeded the FAO/WHO [39] and Chinese Academy of Nutrition [40] recommended maximum food safety thresholds (Table 4), whereas the concentrations of other PTEs in rice were within safe thresholds.

4. Discussion

4.1. PTEs Concentrations in Soil and Rice

The mean Cu, Zn, Pb and Hg concentrations were lower than their respective screening values in the study area. However, the mean concentration of Cd was higher than its screening value (Table 1), and the mean values of the total Cu, Zn, Pb, Cd, and Hg concentrations in the study area were higher than their background data (Table 1). However, the mean concentration data have a wide range and some samples exceeded the screening values (Figure 1). Sites that had concentrations within the upper parts of the ranges were mainly located in regions with factories and mining sites. According to the site locations, the highest mean Cd, Cu, and Pb concentrations were found in Hengyang, where many lead–zinc mines are located in this region of China [41]. The Shuikoushan mine was well known in this area. The sample with the highest Cd concentration was obtained from this area; although the mining operations have ceased, PTEs pollutants from mining and processing have polluted and still impact the local soil [42]. Our findings are consistent with study reporting severe Cd and Pb contamination within the study area, with soil Cd exceeding the national standard [42]. These studies also concluded that the surface soil Cd contamination was mostly derived from industrial activities and that soil Pb contamination was mostly derived from industrial activities and transportation, with some portion from background sources [43].

4.2. Accumulation of PTEs in Polished Rice Grain

Although we found a close correlation between the total and bioavailable concentrations of all PTEs except Hg, high total PTEs concentrations in soil may not necessarily lead to high concentrations in rice. For example, the total Mn and Zn concentrations in soil were significantly correlated with the bioavailable concentrations, whereas there were no correlations with the conctents in rice (Table 2), the Anova test showed that the p value were 0.239 and 0.245 between total concentration and the content in rice for Mn and Zn, respectively. This finding implies that the desorption processes from the total concentrations to the bioavailable concentrations in soil were significantly high but were lower during uptake or accumulation processes in rice. Although the absorption of Mn and Zn in rice is significantly low, the bioavailability of a PTEs determines the proportion that is readily available to plants [44].
Herein, the mean bioavailabilities of Cd, Mn, Co, Pb, and Cu were relatively high compared to the mean total concentrations in soil (64.4%, 33.2%, 12.0%, 11.6%, and 6.1%, respectively), whereas the mean bioavailabilities of Zn and Hg were relatively low (3.2% and 0.01%, respectively). Wan et al. [45] also demonstrated that Cd had the highest bioavailability, followed by Cu, Pb, and As, and they showed relatively high concentrations of bioavailable Cd, Pb, Cu, and Co in soil.
Regression relationships between PTEs in rice and soil were only significant (p < 0.05) for Cd, Cu, and Co (Table 5). Logarithmic relationships indicate that the PTEs concentrations in rice increased exponentially as their total and bioavailable concentrations in soil increased. A previous study has shown that the total and bioavailable Cd concentrations in soil were positively correlated with the Cd concentration in brown rice [46]. Additionally, the bioavailable PTEs concentrations in soil and their accumulation in rice were affected by the physiochemical properties of the soil, water management, farming methods, and rice variety [47]. Therefore, 3 of the 6 PTEs in rice showed an exponential relationship with the total concentration and available concentration in soil.

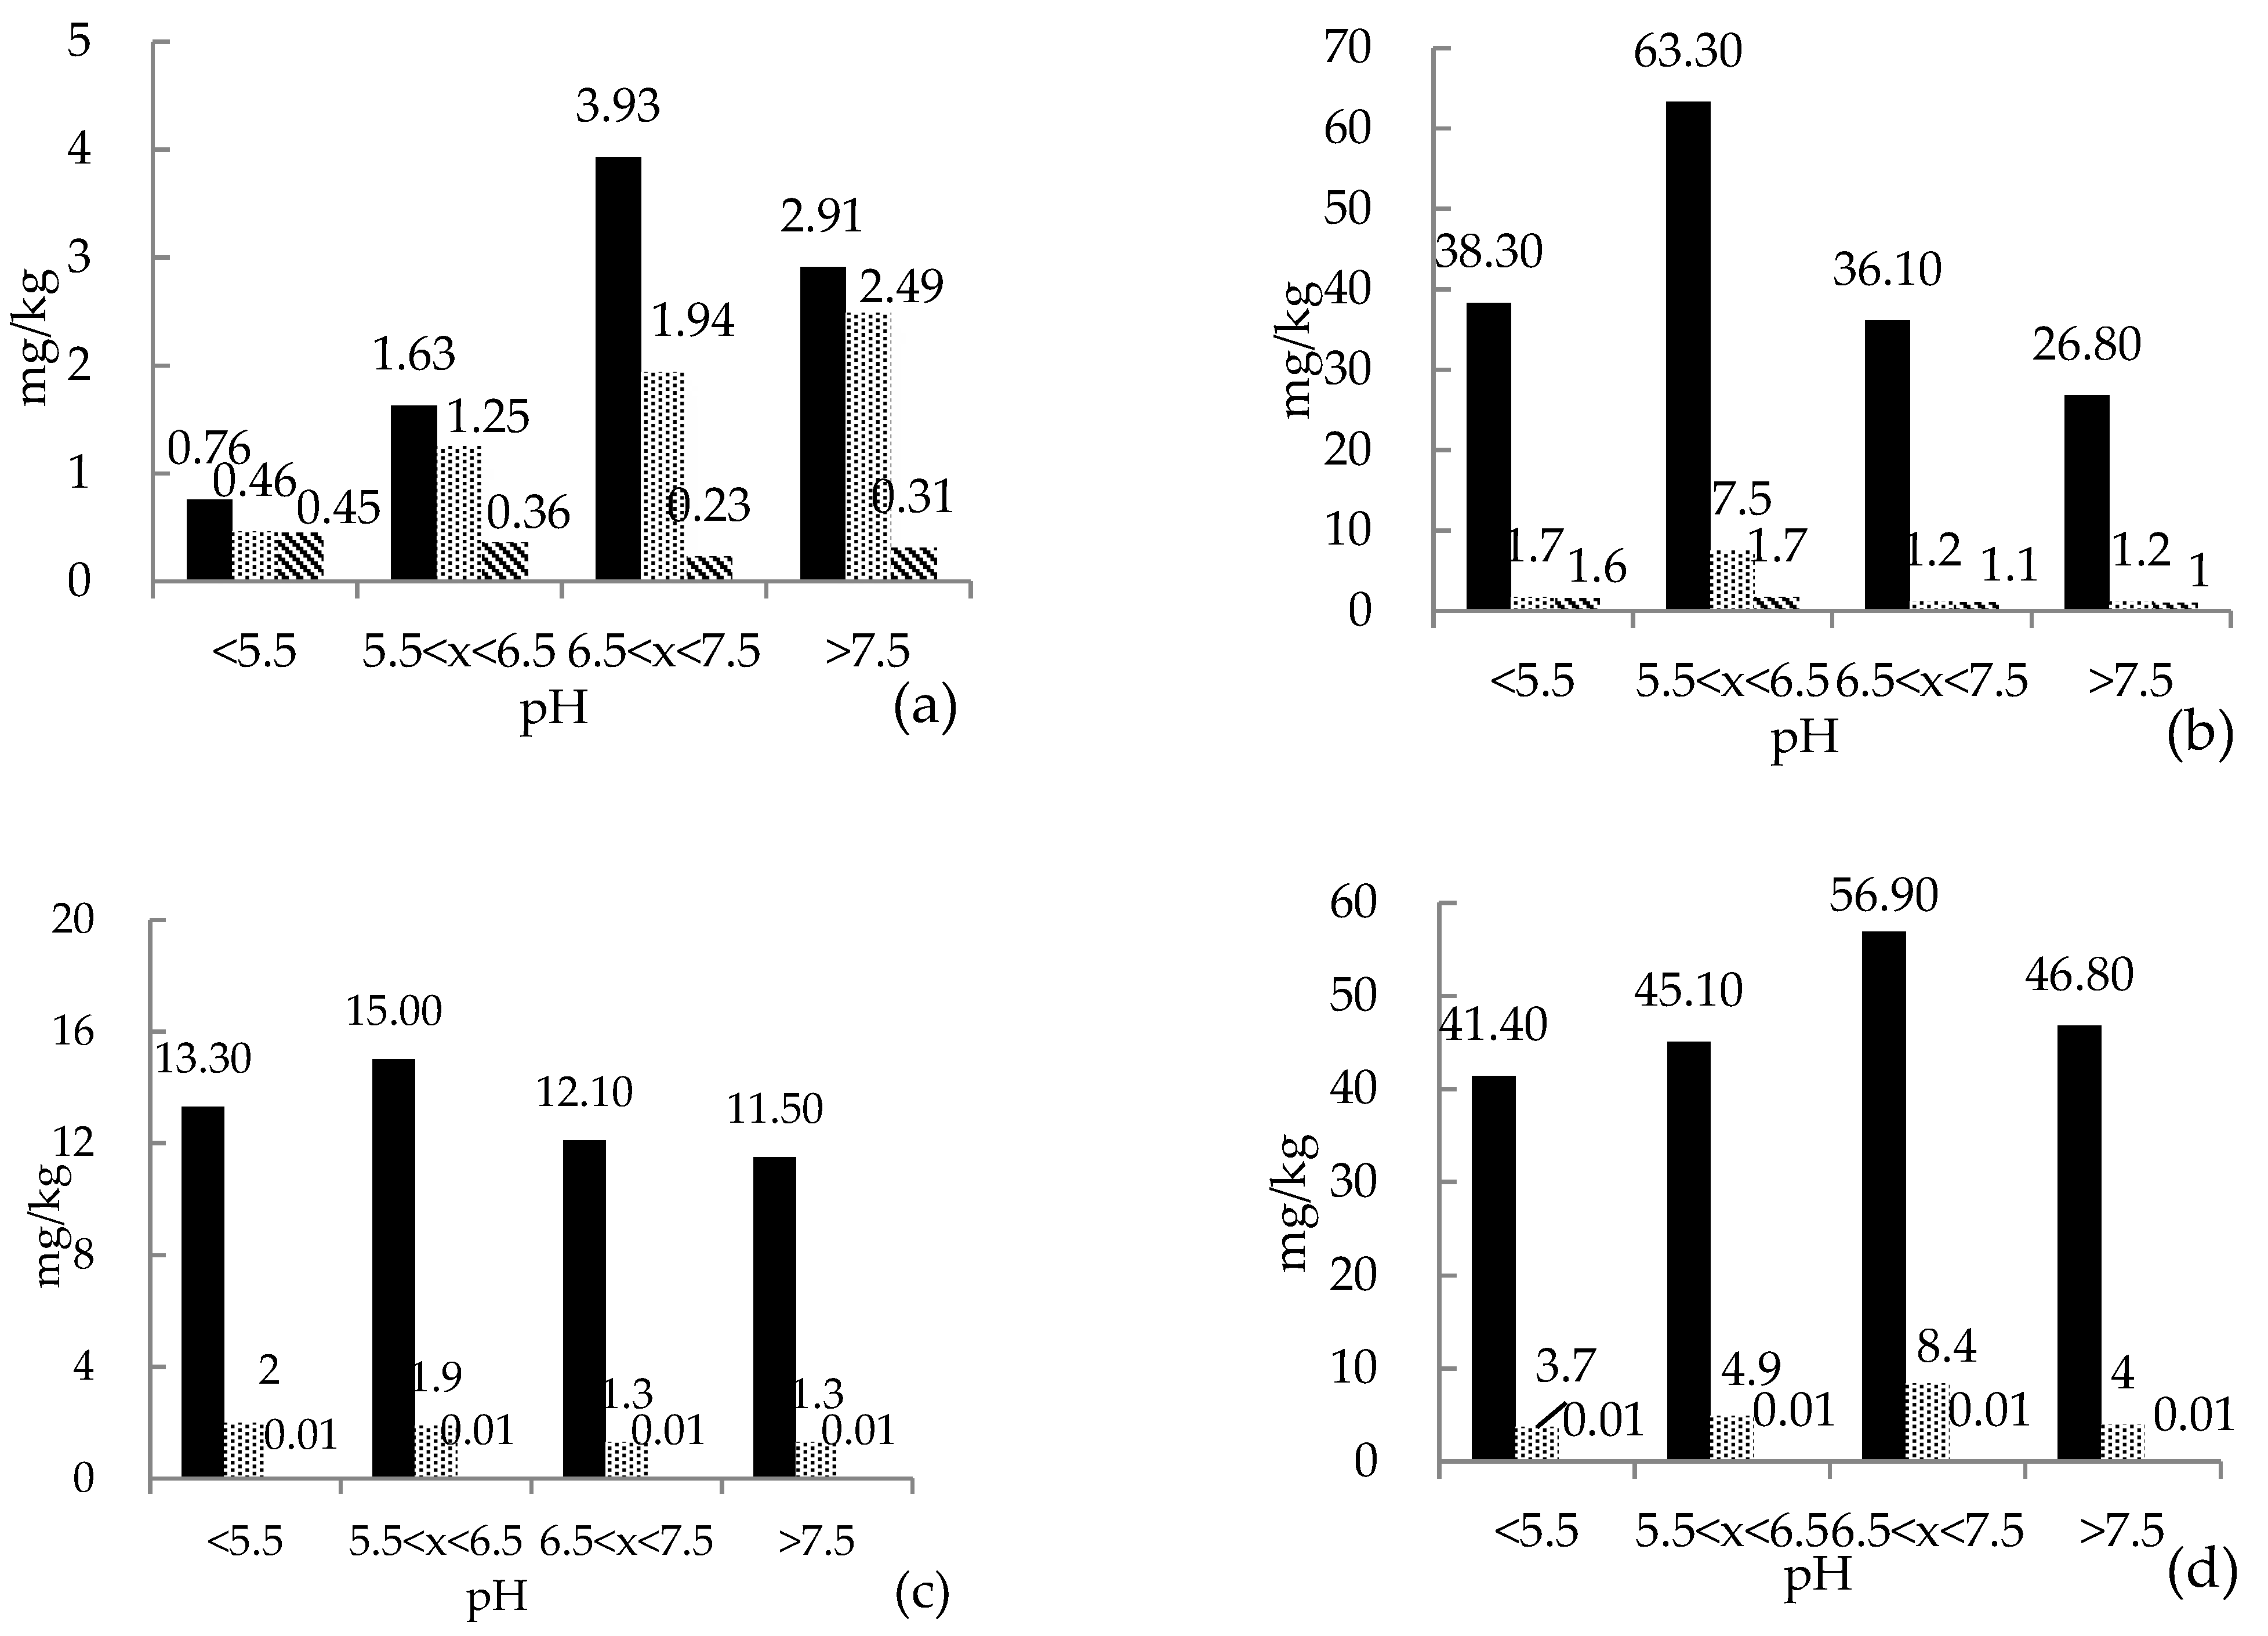
4.3. PTEs Concentrations in Soil (Total and Bioavailable) and in Rice Grain under Different pH Conditions

With an increase in the pH, the Cd and Cu concentrations in rice decreased, whereas the Co and Pb concentrations were unchanged (Figure 2). By analyzing the proportions of PTEs transferred from total to bioavailable concentrations, we found that with increasing pH values (≤ 5.5, 5.5 < x < 6.5, 6.5 < x < 7.5, and ≥ 7.5) the conversion rates were 60.5%, 76.7%, 49.4%, and 85.6% for Cd; 4.4%, 11.8%, 3.3%, and 4.5% for Cu; and 15.0%, 12.7%, 10.7%, and 11.3% for Co. By analyzing the proportion of PTEs transferred from bioavailable concentrations in soil to concentrations in rice, we found that with an increase in the pH, the conversion rates were 97.8%, 28.8%, 11.9%, and 12.4% for Cd; 94.1%, 22.7%, 91.7%, and 83.3% for Cu; 0.5%, 0.5%, 0.8%, and 0.8% for Co; and 0.3%, 0.2%, 0.1%, and 0.3% for Pb. The conversion rates of Cd, Pb, and Cu (and especially Cd) decreased with an increase in the pH. We found that, compared to those of Cu, Co, and Pb, the conversion rate of Cd was higher not only from the total concentration to the bioavailable concentration in soil but also from the bioavailable concentration in soil (pH ≤ 5.5) to the concentration in rice. Previous study has shown that Cd uptake by plants is influenced by physical, chemical, and biological mechanisms, and therefore, combinations of these basic soil properties may explain Cd uptake by plants [48]. PTEs bioavailability can be affected by soil pH [49], and others have found pH to be negatively correlated with the bioavailability of As, Cd, Cr, Pb, and Zn [50]. These findings are consistent with those in this study, which show that pH may be one of the factors that affect the Cd conversion rate. Furthermore, other studies found that the bioaccumulation index of Cd in plants is relatively higher than that of other trace elements due to its greater mobility in soil [51,52]. The conversion rates of PTEs from the total concentration in soil to rice under different pH conditions. Table 6 shows that the conversion rates of Cd and Cu were significantly higher for pH ≤ 5.5 than for other pH conditions. This finding suggests that if the soil pH can be increased through agricultural management (e.g., applying lime to soil), the Cd bioavailability and amount taken up by rice may be reduced. This strategy may be useful to mitigate PTEs contamination in some crops; however, further studies are needed.

4.4. Risk Assessment of PTEs Exposure through Rice Consumption

Some studies show that the safe thresholds of PTEs in rice were calculated by assuming a 323 g daily intake of rice and 60 kg mean bodyweight for Chinese people [52]. The maximum threshold for Cd of 0.19 mg/kg in rice recommended by the WHO is similar to the maximum safe Cd concentration for rice (0.2 mg/kg) established by the Chinese National Food Safety Standard of Maximum Levels of Contaminants in Foods (GB 2762-2012) [53]. Herein, 27.1% of rice samples exceeded the FAO/WHO (WHO, 1995) and the Chinese Academy of Nutrition (1983) recommended maximum food safety thresholds, whereas other PTEs concentrations in rice were within the safe thresholds.
Rice is the staple food of China. Varied dietary habits in different regions of China mean that rice consumption may vary with region; therefore, the standard threshold of 0.2 mg/kg of Cd [53] in rice grain should only be used as a rough reference. We propose that the dietary safety guidelines for rice consumption be established on a sub-regional basis.

5. Conclusions

The mean values of the total concentrations of Cu, Zn, Pb, Cd, and Hg were higher than their respective background values, whereas those of Mn and Co were lower, suggesting that Cu, Zn, Pb, Cd, and Hg concentrations in soil kept increasing over the last few decades in Hunan Province. Under high soil pH conditions, Cd and Cu concentrations in rice decreased, whereas Co and Pb changed slightly, indicating that pH is a key factor influencing Cd and Cu bioavailability in soil and amount taken up by rice. We concluded that the bioavailable concentrations of PTEs in soil were better indicator than total PTEs concentrations in soil to assess soil contamination by PTEs and the impacts on food safety. Unneglectable risks to human health from Cd contamination in rice were identified in the region. Results from this study may provide valuable information for assessing the risk of agricultural food safety caused by soil pollution. Further studies on agricultural management to decrease the accumulation of PTEs in rice crops were proposed in future.

Author Contributions

The authors declare no conflict of interest. All authors contributed to the study conception and design. Material preparation, data collection and analyses were performed by Y.Y., R.X., L.Z., H.L. (Haijiang Luo) and G.W. The first draft of the manuscript was written by Y.Y., F.W., W.L., L.H., H.L. (Haijiang Liu) and Y.W. contributed to the writing, review, and editing of this manuscript. All authors commented on previous versions of the manuscript. All authors have read and agreed to the published version of the manuscript.

Funding

This work was funded by the key strategic consultation project of the Chinese Academy of Engineering “National Strategic Consultation on Soil Risk Identification and Countermeasures” (No. 2020-XY-21).

Acknowledgments

Our study received great support and assistance in sampling, sample preparation, and analysis from the distinguished researchers at the China National Environmental Monitoring Center, the Hunan Environmental Monitoring Center Station, the Geophysical and Geochemical Exploration Institute of the Chinese Academy of Geological Sciences, the former Scientific Research Institute of the State Administration of Grain, and the Jiyuan Environmental Monitoring Station.

Conflicts of Interest

The authors declare no conflict of interest. The corresponding author, on behalf of all co-authors, declares that this paper contains original research that has not been published previously, and has not been under consideration for publication elsewhere, in whole or in part.

References

  1. Peng, Z. Strengthen the prevention mines of Shaoguan City, China. Soil Sediment Contam. 2016, 24, 76–89. [Google Scholar]
  2. Zhou, M.; Liao, B.; Shu, W.S.; Yang, B.; Lan, C.Y. Pollution assessment and potential sources of heavy metals in agricultural soils around four pb/zn mines of shaoguan city, China. Soil Sediment Contam. 2015, 24, 76–89. [Google Scholar] [CrossRef]
  3. Abdelhafez, A.; Li, J. Environmental monitoring of heavy metal status and human health risk assessment in the agricultural soils of the Jinxi River area, China. Environmental monitoring of heavy metal status and human health risk assessment in the agricultural soils of the Jinxi River area, China. Hum. Ecol. Risk Assess. An. Int. J. 2015, 21, 952–971. [Google Scholar]
  4. Chen, X.L.; Zhang, W.K.; Li, W.; Li, Z.Z. Brief summarization of study on heavy-metal pollution of soil in China. Yunnan Geogr. Environ. Res. 2009, 21, 8–13. [Google Scholar]
  5. Lu, Y.W.; Huang, L.B.; Zhang, G.L.; Zhao, Y.G. Assessment of bioaccessibility and exposure risk of arsenic and lead in urban soils of Guangzhou City, China. Environ. Geochem. Health 2011, 33, 93–102. [Google Scholar] [CrossRef] [PubMed]
  6. Fan, S.X.; Gan, Z.T.; Li, M.J.; Zhang, Z.Q.; Zhou, Q. Progress of Assessment Methods of Heavy Metal Pollution in Soil. Chin. Agric. Sci. Bull. 2010, 26, 310–315. [Google Scholar]
  7. Ao, M.; Chai, G.Q.; Fan, C.W.; Liu, G.H.; Qin, S.; Wang, P. Evaluation of potential pollution risk and source analysis of heavy metals in paddy soil and rice. Trans. Chin. Soc. Agric. Eng. 2019, 35, 198–205. [Google Scholar]
  8. Kong, Z.Y.; Teng, Y.G.; Wang, J.S.; Song, L.T.; Zhang, L. Pollution risk assessment of heavy metals in soil based on geochemical baseline. Earth Environ. 2013, 41, 547–552. [Google Scholar]
  9. Li, G.; Chen, T.L.; Wang, Y.H.; Wang, S.C.; Li, B.; Cui, J.H.; Zhang, H. Progresses on risk assessment methods of bioavailability of heavy metal in soils. J. Food Saf. Qual. 2014, 5, 3592–3597. [Google Scholar]
  10. Liu, J.; Teng, T.Y.; Cui, Y.F.; Wang, J.S. Review in ecological risk assessment methods for heavy metal polluted soils. Adm. Tech. Environ. Monit. 2007, 19, 6–11. [Google Scholar]
  11. Environmental Protection Administration of China. Soil Environmental Quality Risk Control Standard for Soil Contamination of Agricultural Land; GB15618-2018; Environmental Protection Administration of China: Beijing, China, 2018.
  12. Sun, X.Y. Phytoavailability of Heavy Metals in Soils from Lead-Zinc Mining Area. Ph.D. Thesis, China University of Geosciences, Beijing, China, 2018. [Google Scholar]
  13. Yuan, B.; Fu, W.L.; Lan, J.C.; Zhang, T.; Peng, J.T. Study on the Available and Bioavailability of Lead and Cadmium in Soil of Vegetable Plantation. J. Soil Water Conserv. 2011, 25, 130–134. [Google Scholar]
  14. Zhang, J.R.; Li, H.Z.; Zhou, Y.Z.; Dou, L.; Cai, L.M.; Mo, L.P.; You, J. Bioavailability and soil-to-crop transfer of heavy metals in farmland soils: A case study in the Pearl River Delta, South China. Environ. Pollut. 2018, 235, 710–719. [Google Scholar] [CrossRef]
  15. Peijnenburg, W.J.G.M.; Posthuma, L.; Eijsackers, H.J.P.; Allen, H.E. A conceptual framework for implementation of bioavailability of metals for environmental management purposes. Ecotoxicol. Environ. Safety 1997, 37, 163–172. [Google Scholar] [CrossRef]
  16. Lanno, R.; Wells, J.; Conder, J.; Bradham, K.; Basta, N. The bioavailability of chemicals in soil for earthworms. Ecotoxicol. Environ. Safety 2004, 57, 39–47. [Google Scholar] [CrossRef] [PubMed]
  17. Liu, L.C.; Li, Y.C.; Huang, Z.C.; Deng, Y.Z.; Min, J.; Liu, S.X.; Hu, M. Current Situation, Problems and Developing Countermeasures of Rice Direct Seeding in Hunan Province. Hunan Agric. Sci. 2019, 9, 12–16. [Google Scholar]
  18. Guo, Z. Recent progress in the study of heavy metal bioavailability in soil. Geophys. Geochem. Explor. 2014, 38, 1097–1106. [Google Scholar]
  19. Atanassov, I.; Angelova, I. Profile differentiation of Pb, Zn, Cd and Cu in soils surrounding Lead and Zinc smelter near Plovdiv (Bulgaria). Bulg. J. Agric. Sci. 1995, 1, 343–348. [Google Scholar]
  20. Babula, P.; Adam, V.; Opatrilova, R.; Zehnalek, J.; Havel, L.; Kizek, R. Uncommon heavy metals, metalloids and their plant toxicity: A review. Environ. Chem. Lett. 2008, 6, 189–213. [Google Scholar] [CrossRef]
  21. Du, F.; Yang, Z.; Liu, P.; Wang, L. Accumulation, translocation, and assessment of heavy metals in the soil-rice systems near a mine-impacted region. Environ. Sci. Pollut. Res. Int. 2018, 25, 32221–32230. [Google Scholar] [CrossRef] [PubMed]
  22. Rafiq, M.T.; Aziz, R.; Yang, X.; Xiao, W.; Rafiq, M.K.; Ali, B.; Li, T. Cadmium phytoavailability to rice (Oryza sativa L.) grown in representative Chinese soils. A model to improve soil environmental quality guidelines for food safety. Ecotox Environ. Safe 2014, 103, 101–107. [Google Scholar] [CrossRef] [PubMed]
  23. Ok, Y.S.; Usman, A.R.; Lee, S.S.; El-Azeem, S.A.A.; Choi, B.; Hashimoto, Y.; Yang, J.E. Effects of rapeseed residue on lead and cadmium availability and uptake by rice plants in heavy metal contaminated paddy soil. Chemosphere 2011, 85, 677–682. [Google Scholar] [CrossRef]
  24. Tian, M.Y.; Hu, T.; Fu, T.L.; Cheng, J.B.; Zhang, T.Y. Research Progress on the Relationship between Cadmium Content in Soil and Rice. Jiangsu Agric. Sci. 2019, 47, 25–28, 40. (In Chinese) [Google Scholar]
  25. Gu, J.G.; Zhou, Q.X. Cleaning up through phytoreme diation: A review of Cd contaminated soils. Ecol. Sci. 2002, 21, 352–356. [Google Scholar]
  26. Pan, Y.M. Background Value and Research Method of Soil in Hunan; China Environmental Science Press: Beijing, China, 1988. [Google Scholar]
  27. He, L.Z.; Zhong, H.; Liu, G.X.; Dai, Z.M.; Brookes, P.C.; Xu, J.M. Remediation of heavy metal contaminated soils by biochar: Mechanisms, potential risks and applications in China. Environ. Pollut. 2019, 252 Pt A, 846–855. [Google Scholar] [CrossRef]
  28. Sodango, T.H.; Li, X.; Sha, J.M.; Bao, Z.C. Review of the Spatial Distribution, Source and Extent of Heavy Metal Pollution of Soil in China: Impacts and Mitigation Approaches. J. Health Pollut. 2018, 8, 53–70. [Google Scholar] [CrossRef] [PubMed] [Green Version]
  29. Smith, S.R. A critical review of the bioavailability and impacts of heavy metals in municipal solid waste composts compared to sewage sludge. Environ. Int. 2008, 142–156. [Google Scholar] [CrossRef] [PubMed]
  30. Takáč, P.; Szabová, T.; Kozáková, Ľ.; Benková, M. Heavy metals and their bioavailability from soils in the long-term polluted Central Spiš region of SR. Plant. Soil Environ. 2009, 55, 167–172. [Google Scholar] [CrossRef] [Green Version]
  31. Pan, Y.M.; Yang, G. Soil Background Values and Research Methods in Hunan Province; Environmental Science Press: Beijing, China, 1988. [Google Scholar]
  32. Yu, Y.M.; Wei, F.S.; Liu, W.Q.; Zhang, L.L.; Xu, R.J.; Wu, G.P. Investigation and evaluation of the risk of Cd contamination of agricultural land in typical areas. In Proceedings of the Third International Conference on Energy Engineering and Environmental Protection; Proquest LLC: Ann Arbor, MI, USA, 11 March 2019. [Google Scholar]
  33. Environmental Protection Administration of China. The Technical Specification for Soil Environmental Monitoring. HJ/T 166-2004, 9 December 2004. [Google Scholar]
  34. Environmental Protection Administration of China. Soil quality-Determination of Lead, Cadmium-Graphite Furnace Atomic Absorption Spectrophotometry. GB 17141-1997, 30 July 1997. [Google Scholar]
  35. Environmental Protection Administration of China. Soil and Sediment-Determination of Inorganic Element-Wavelength Dispersive X-ray Fluorescence Spectrometry. HJ 780-2015, 14 December 2015. [Google Scholar]
  36. The Ministry of Agriculture of the People’s Republic of China. Soil Quality-Analysis of Available Lead and Cadmium Contents in Soils-Atomic Absorption Spectrometry. GB/T 23739-2009, 12 May 2009. [Google Scholar]
  37. China National Health and Family Planning Commission. National Food Safety Standards Determination of Cadmium in Products. GB5009.15-2014, 28 January 2014. [Google Scholar]
  38. Wan, H.Y.; Zhou, S.; Zhao, Q.G. Spatial variation of content of soil heavy metals in region with high economy development of South Jiangsu province. Sci. Geogr. Sin. 2005, 25, 329–334. [Google Scholar]
  39. WHO. Application of Risk Analysis to Food Standards Issues: Report of the Joint FAO/WHO Expert Consultation; World Health Organization: Geneva, Switzerland, 13–17 March 1995. [Google Scholar]
  40. National Research Council. Committee on the Institutional Means for Assessment of Risks to Public: Risk Assessment in the Federal Government: Managing the Process; National Academy Press: Washington, DC, USA, 1983. [Google Scholar]
  41. Jiang, Z.P.; Yang, J.H. Discussion on Heavy Metal Quality Assessment Standards of Urban Pollution Soil—Taking Hengyang City for Example. Saf. Environ. Eng. 2010, 17, 57–64. [Google Scholar]
  42. Yang, H.J.; Xu, Y.H.; Liu, Y.B.; Jin, H.Y.; Mao, Y.C. Environmental health risk assessment of Shuikou mountain section of Hengyang in Xiangjiang river basin. Environ. Chem. 2018, 37, 2060–2070. [Google Scholar]
  43. Duan, S.H.; Zhou, Z.; Liu, Y.J.; Xiao, Y.S.; Chen, P.F.; Fan, C.Y.; Chen, S.B. Distribution and Source Apportionment of Soil Heavy Metals in Central-South of Hunan Province. J. Agric. Sci. Technol. 2018, 20, 80–87. [Google Scholar]
  44. Violante, A.; Cozzolino, V.; Perelomov, L.; Caporale, A.G.; Pigna, M. Mobility and bioavailability of heavy metals and metalloids in soil environments. J. Soil. Sci. Plant. Nutr. 2010, 10, 268–292. [Google Scholar] [CrossRef] [Green Version]
  45. Zhang, H.Z.; Luo, Y.M.; Zhang, H.B.; Song, J.; Chen, Y.S.; Xia, J.Q.; Zhao, Q.G. Characterizing the plant uptake factor of As, Cd and Pb for rice and wheat cereal. Environ. Sci. 2010, 31, 488–495. [Google Scholar]
  46. Han Aimin, C.J.; Tu, J.H.; Yi, J. Correlation of heavy metals contained in paddy rice and soil quality. Environ. Monit. Manag. Technol. 2002, 14, 27–32. [Google Scholar]
  47. Keegan, T.J.; Farago, M.E.; Thornton, I.; Hong, B.; Colvile, R.N.; Pesch, B.; Nieuwenhuijsen, M.J. Dispersion of As and selected heavy metals around a coal-burning power station in central Slovakia. Sci. Total. Environ. 2006, 35, 61–71. [Google Scholar] [CrossRef]
  48. McBride, M. Cadmium uptake by crops estimated from soil total Cd and pH. Soil Sci. 2002, 15, 84–92. [Google Scholar] [CrossRef]
  49. Ding, C.; Chen, Z.J.; Li, H.; Peng, X.C.; Feng, H.L.; Zhang, Y.N.; Lei, G.J.; Zhao, S.H. Correlation analysis of the heavy metal total contents and the available contents of agricultural soil in Chang-Zhu-Tan area. Ecol. Environ. Sci. 2012, 21, 2002–2006. [Google Scholar]
  50. Wen, H. Heavy Metal Bio-Availability and Its Affecting Factors in Soil-Plant System. Ph.D. Thesis, Beijing Forestry University, Beijing, China, May 2008. [Google Scholar]
  51. Kabata-Pendias, A.; Pendias, H. Trace Elements in Soils and Plants; CRC Press: Boca Raton, FL, USA, 2001. [Google Scholar]
  52. Zhong, J.; Yu, M.; Liu, L.; Chen, Y.; Hu, R.; Gong, W. Study on the dietary nutrition intake level in Zhejiang Province. Dis Surveill. 2006, 21, 670–672. [Google Scholar]
  53. Health and Family Planning Commission of the People’s Republic of China. National Food Safety Standard of Maximum Levels of Contaminants in Foods. GB2762-2012, 13 November 2012. [Google Scholar]
Figure 1. PTEs concentrations (mg/kg) in soil (total and bioavailable) and in rice from 85 sampling sites in Hunan, China. (a) Cd, (b), Pb, (c) Cu, (d) Zn, (e) Hg, (f) Mn, and (g) Co.
Minerals 11 00953 g001aMinerals 11 00953 g001b
Figure 2. Mean concentration of PTEs in soil (total and bioavailable) and in rice under different pH conditions: (a) Cd, (b) Cu, (c) Co, and (d) Pb.
Minerals 11 00953 g002aMinerals 11 00953 g002b
Table 1. Total concentrations of PTEs in the soil samples.
ElementSamplesMin
(mg/kg)
Max
(mg/kg)
Median
(mg/kg)
Mean
(mg/kg)
Std b.
Deviation
(mg/kg)
Background Value
(mg/kg)
Screening Value a
(mg/kg)
Mn85102.42250.4318.9431.241.7459 - c
Cu8515.9993.430.345.3104.927.350
Zn8547.81680.8104.8133.3176.994.4200
Co855.026.613.513.293.814.6-
Pb840.0288.539.349.1535.1229.780
Cd850.1924.250.641.312.770.130.3
Hg590.0934.970.320.664.550.121.3
a The screening values of heavy metal concentration based on the Chinese national standard (GB15618-2018) at pH ≤ 5.5. b The Std. means the standard deviation of each PTE. c The—means there is no reference value in the standard.
Table 2. Correlation analysis between PTEs concentrations in soil (total and bioavailable) and in rice.
Rice to:Analytical MethodCdPbMnCuZnCoHg
Total concentration in soilSpearman0.250 **−0.1020.0070.080−0.0240.268 *0.079
p-value0.0210.3550.9480.4690.8250.0130.551
Bioavailable concentration in soil Sample number(N)Spearman0.305 **−0.1750.0640.2030.1200.288 **0.113
p-value0.0050.1090.5590.0620.2740.0080.302
85858585858559
* Correlation is significant at the 0.05 level (two-tailed). ** Correlation is significant at the 0.01 level (two-tailed).
Table 3. Correlation analysis of PTEs concentrations between total and bioavailable concentration.
CdPbMnCuZnCoHg
Spearman0.565 **0.289 **0.883 **0.427 **0.565 **0.698 *0.051
pH0.0000.0070.0000.0000.0000.0000.699
N85858585858559
* Correlation is significant at the 0.05 level (two-tailed). ** Correlation is significant at the 0.01 level (two-tailed).
Table 4. PTEs concentrations in rice grain.
Heavy Metal.Minimum Concentration (mg/kg)Maximum
Concentration (mg/kg)
Mean Concentration (mg/kg)Recommended Maximum Intake (mg/kg)Percentage Exceeding Recommendations
(%)
Cd0.001.980.210.1927.1
Pb0.000.220.020.670.0
Cu0.004.111.601486.000.0
Co0.000.030.0165.000.0
Table 5. Relationships between PTEs in rice grain and total and bioavailable PTEs in soil.
PTEs in RicePTEs in SoilRegression EquationR2p-Value
CdBioavailable concentration
Total concentration
y = 0.2042ln(x) + 0.3652
y = 0.2119ln(x) + 0.2648
0.224
0.216
0.000
0.000
PbBioavailable concentration
Total concentration
y = −0.002ln(x) + 0.0169
y = −0.0009In(x) + 0.0183
0.054
0.014
0.297
0.284
MnBioavailable concentration
Total concentration
y = 0.1771ln(x) + 6.289
y = 0.0007x + 6.8085
0.004
0.010
0.581
0.353
CuBioavailable concentration
Total concentration
y = 0.1231ln(x) + 1.6791
y = 0.4841ln(x) − 0.0979
0.073
0.087
0.012
0.006
ZnBioavailable concentration
Total concentration
y = 0.0711x + 11.383
y = 0.0034x + 11.273
0.029
0.024
0.122
0.161
CoBioavailable concentration
Total concentration
y = 0.0035ln(x) + 0.008
y = 0.0048ln(x) − 0.003
0.106
0.052
0.002
0.033
Table 6. Conversion rates of PTEs from the total concentration in soil to rice under different pH conditions.
pH LevelNpHCd (%)Cu (%)Pb (%)Co (%)
pH ≤ 5.5155.20 ± 0.0535.7 ±1 0.5a7.84 ± 1.36a0.05 ± 0.01a0.07 ± 0.01
5.5< pH ≤ 6.5325.83 ± 0.0427.3 ± 4.6a5.37 ± 0.49b0.04 ± 0.01a0.08 ± 0.01
6.5 < pH ≤ 7.5247.11 ± 0.2515.6 ± 5.0b4.48 ± 0.50bc0.02 ± 0.01b0.06 ± 0.01
pH > 7.5137.68 ± 0.114.2 ± 1.5b2.94 ± 1.40c0.04 ± 0.01a0.08 ± 0.02
Note: Different letters of a, b, c within the same column indicate significant differences at p < 0.05.
Publisher’s Note: MDPI stays neutral with regard to jurisdictional claims in published maps and institutional affiliations.

