
Screening Coarse Airborne Dust for Lead-Rich Phase Occurrence during Characterisation of Particle Mineralogy, Chemistry and Provenance: Application to Deposits in the Vicinity of an Integrated Steelworks

 ,
,
Abstract
:1. Introduction
2. Materials and Methodology
- (1)
- absolute and relative areas of pixel groupings, where these groupings refer to
- a.
- individual grains
- b.
- grain populations
- c.
- total grains per sample
- d.
- the corresponding constituent PARC phases for each of (a)–(c)
- (2)
- EDS sum-spectra of these same pixel groupings for quantitative chemical analysis
- (3)
- size and shape information regarding the grains
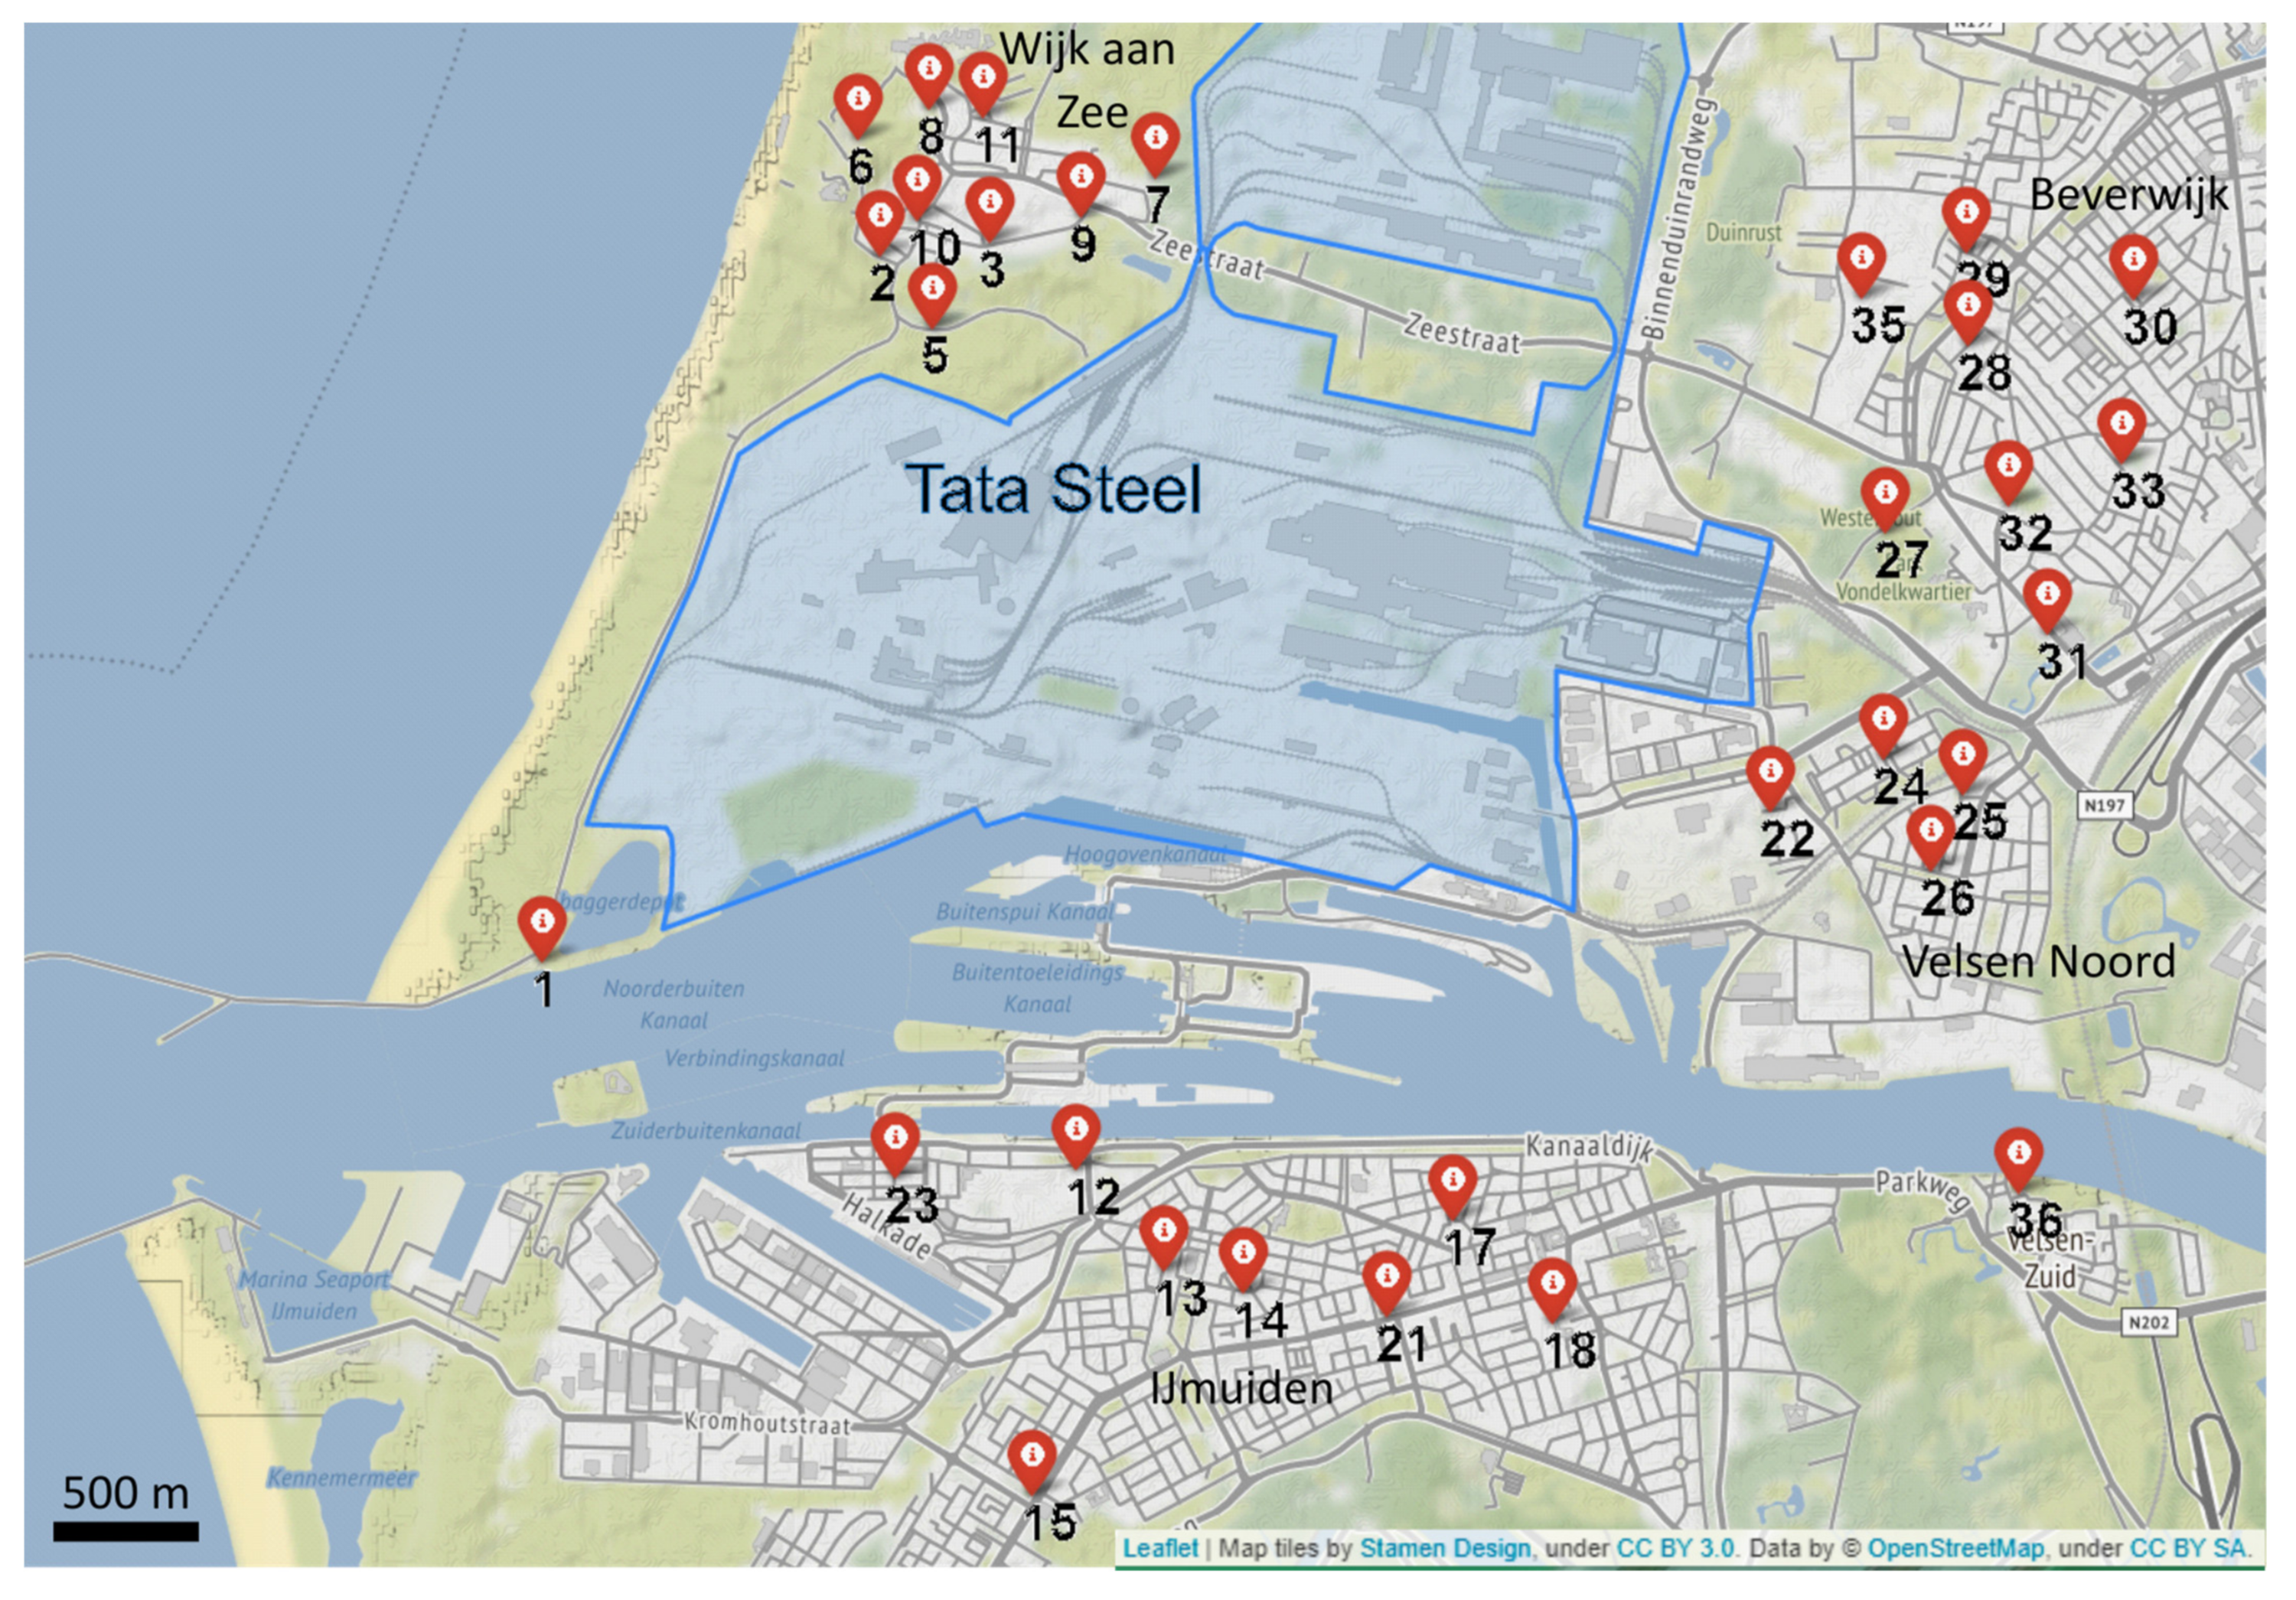
2.1. Sampling
2.2. Sample Preparation
2.3. Raw Data Acquisition
2.3.1. QXRD
2.3.2. LOM Raw Data Acquisition
2.3.3. SEM-EDS-SI Raw Data Acquisition
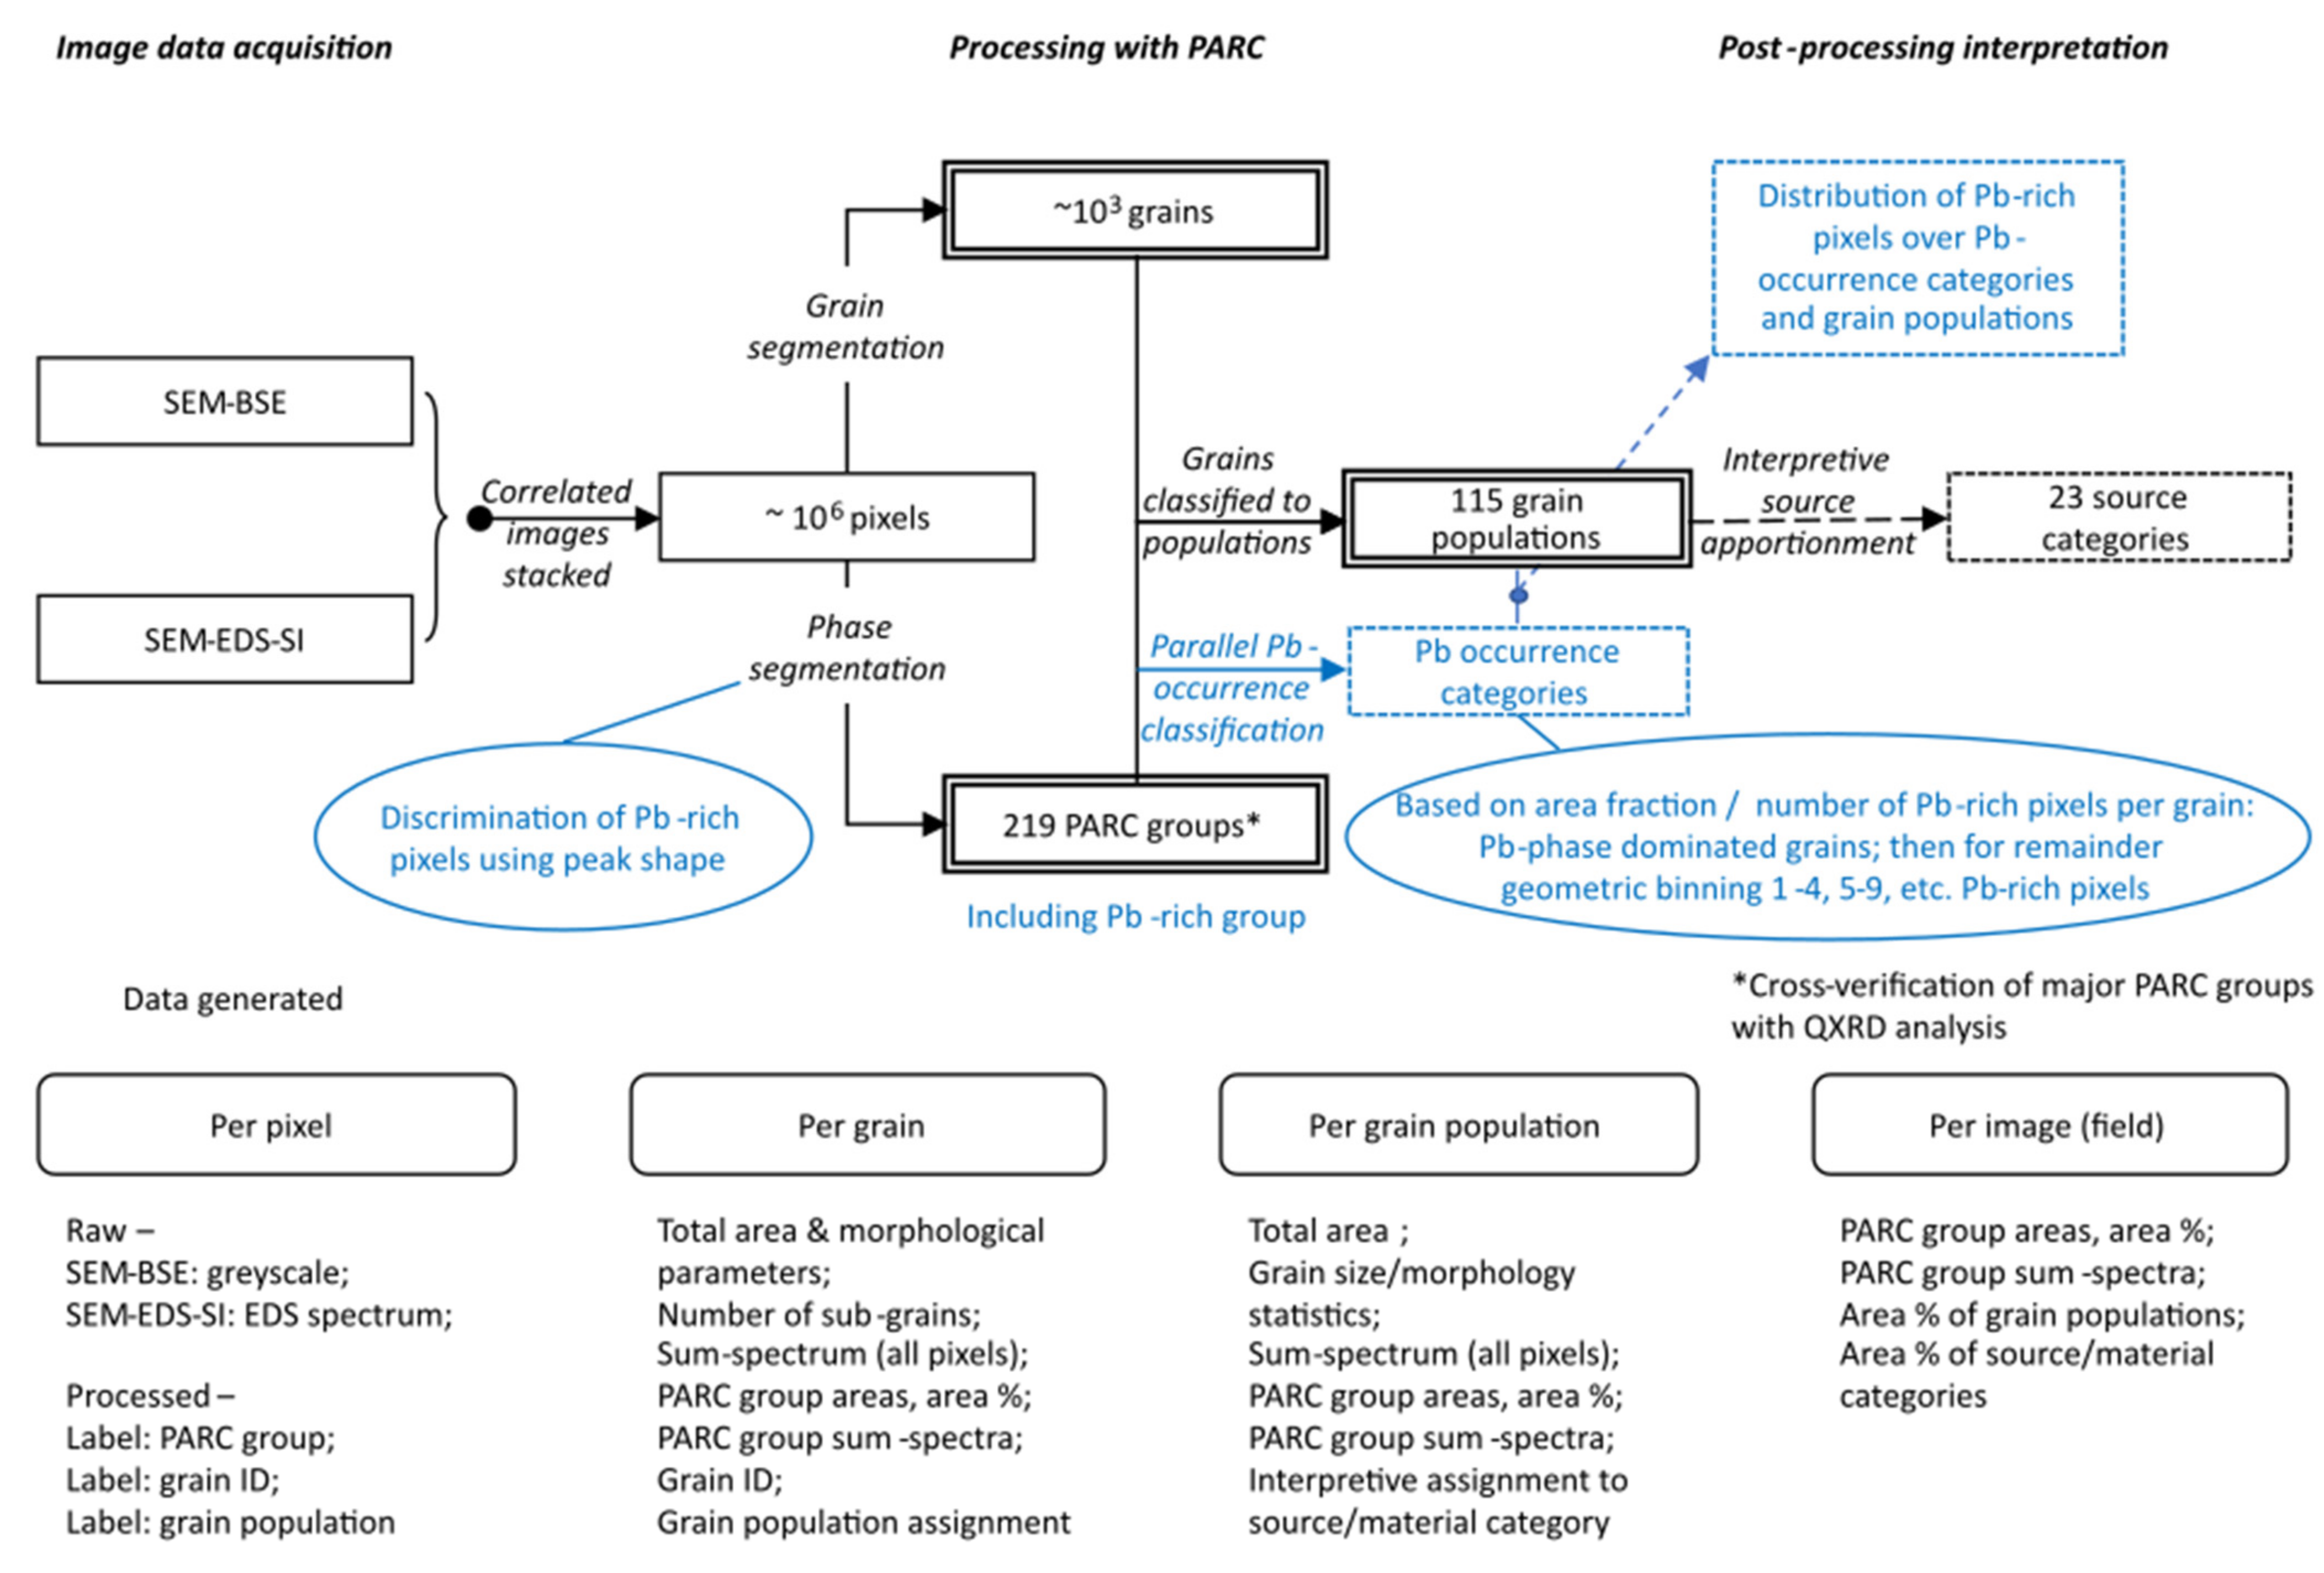
2.4. Data Processing with PARC
2.4.1. PARC, General
Phase Model
Grain Segmentation
Grain Population Model
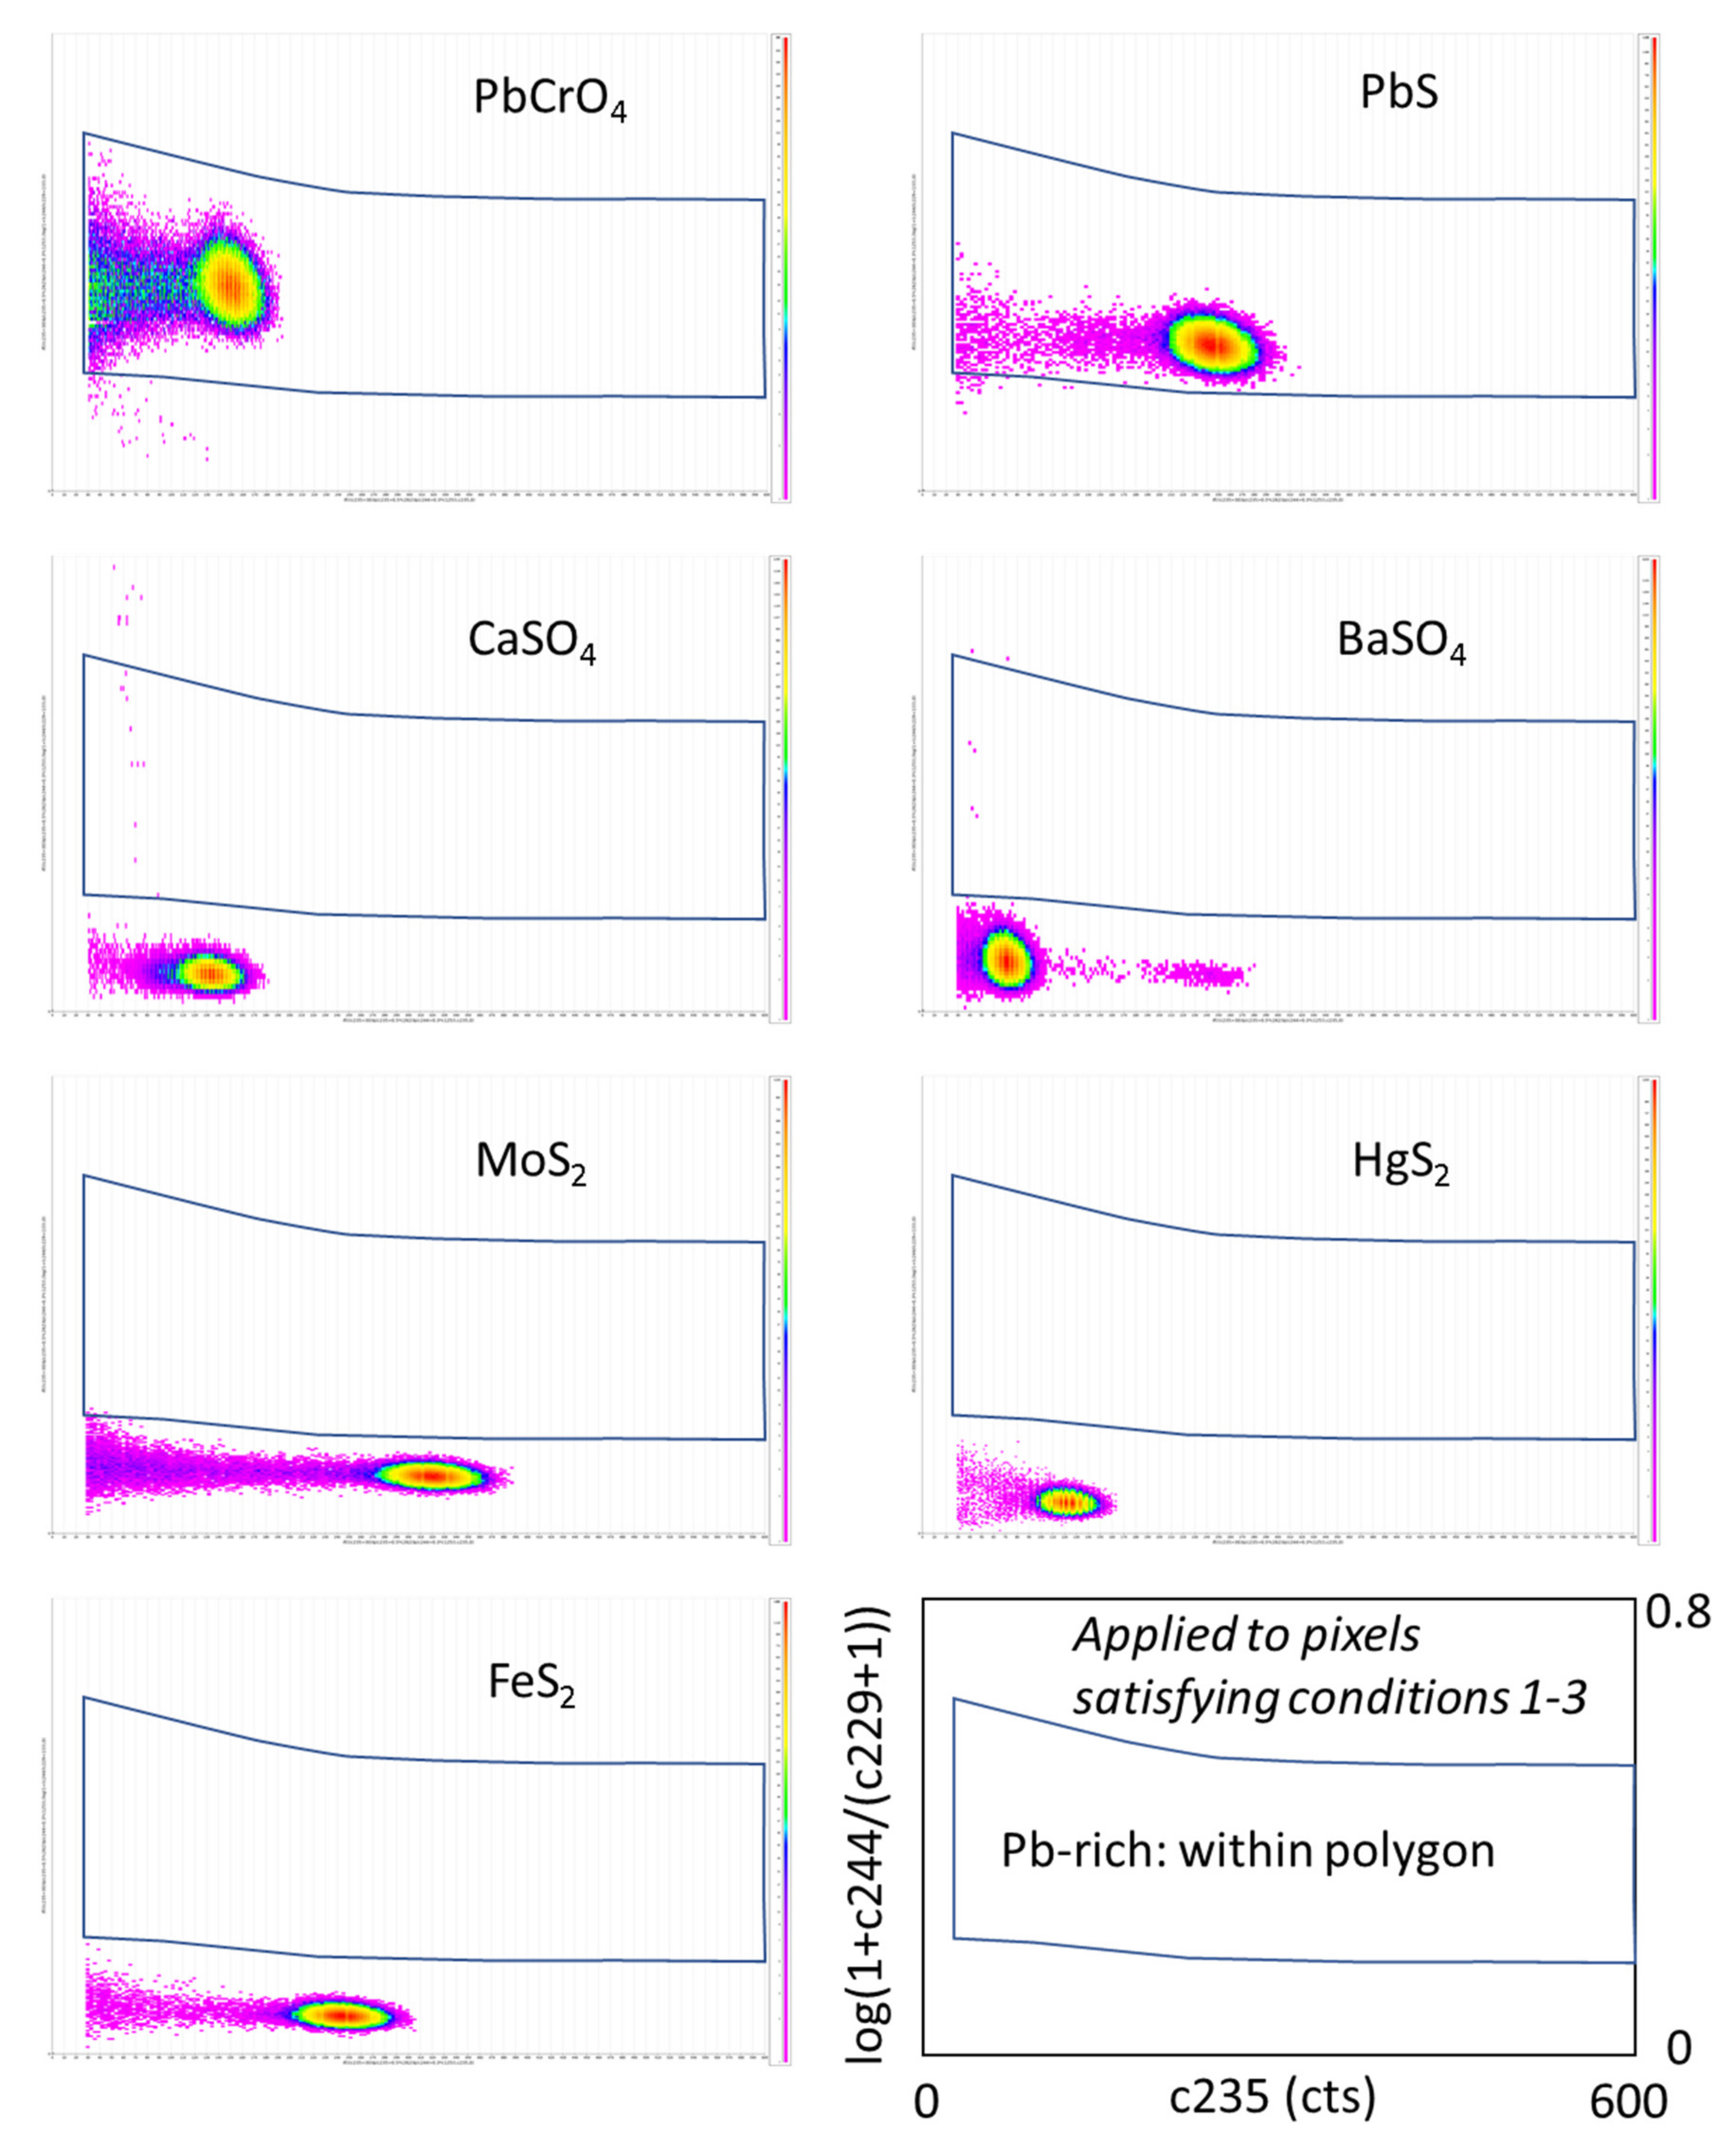
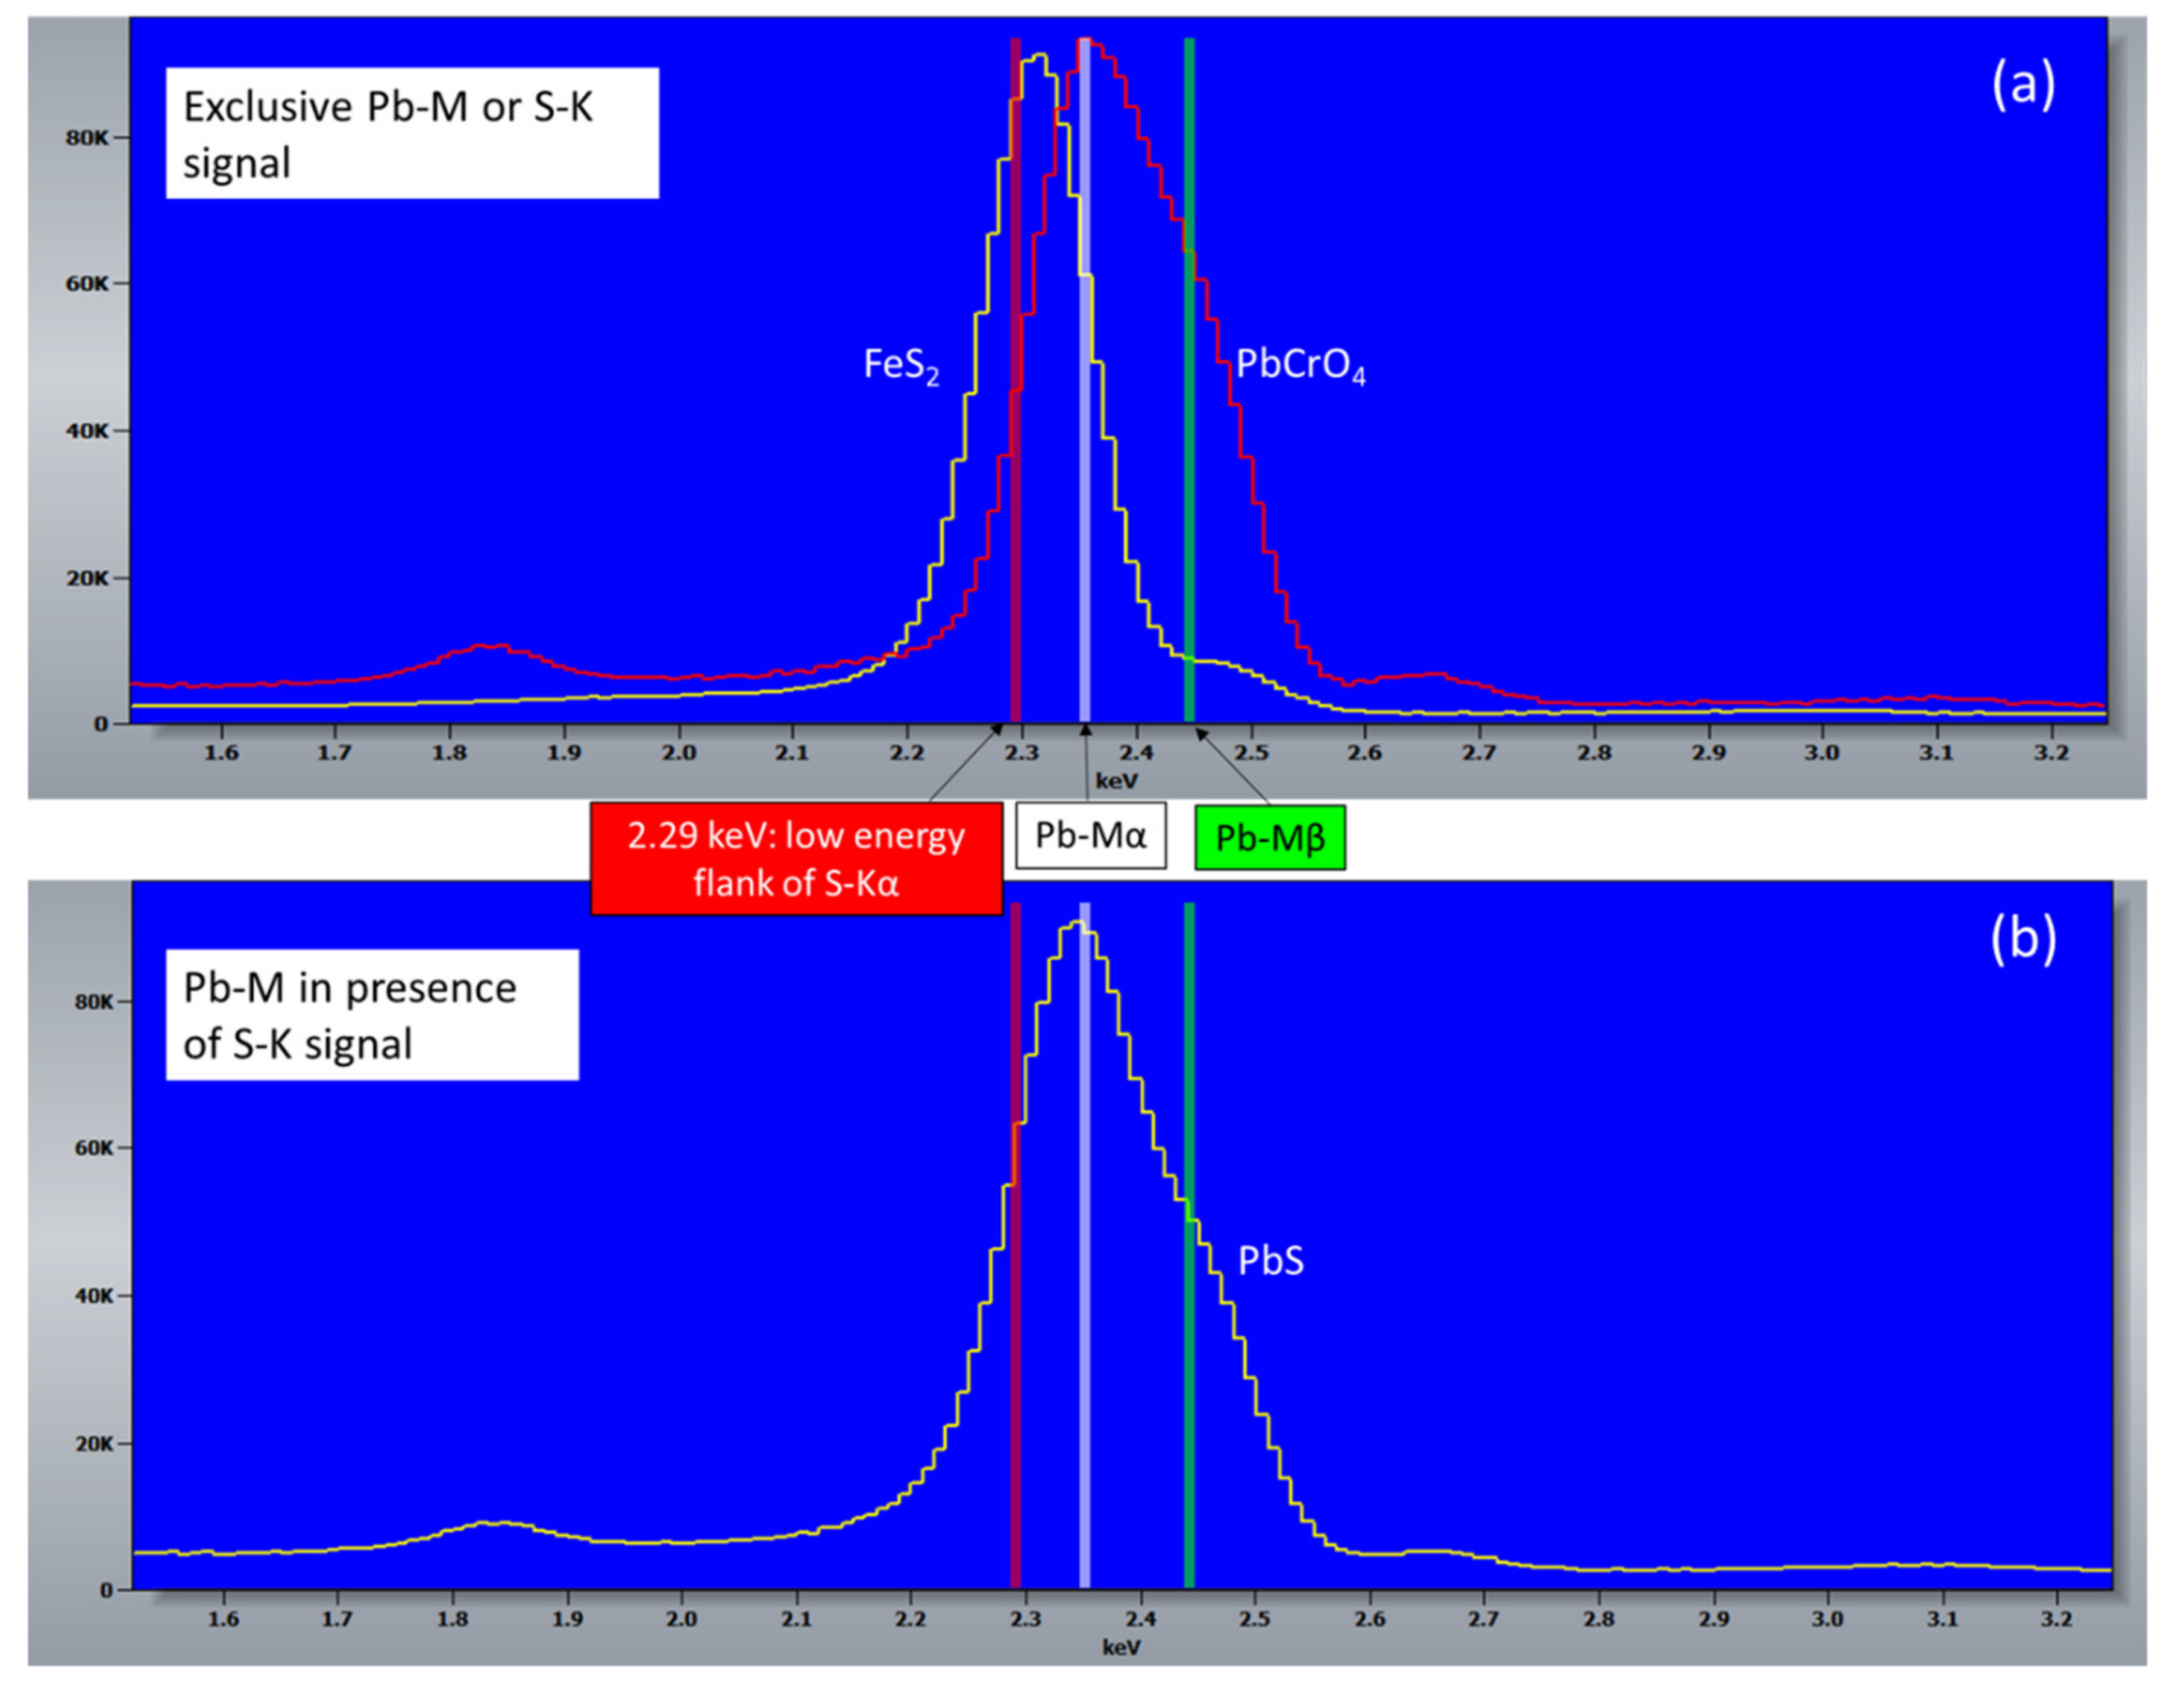
2.4.2. Detection of Pb-Rich Pixels in EDS-SI Data Acquired with 15 kV Accelerating Voltage
Rationale and Definition of Pb-Rich PARC Group
Factors Influencing Sensitivity and Specificity
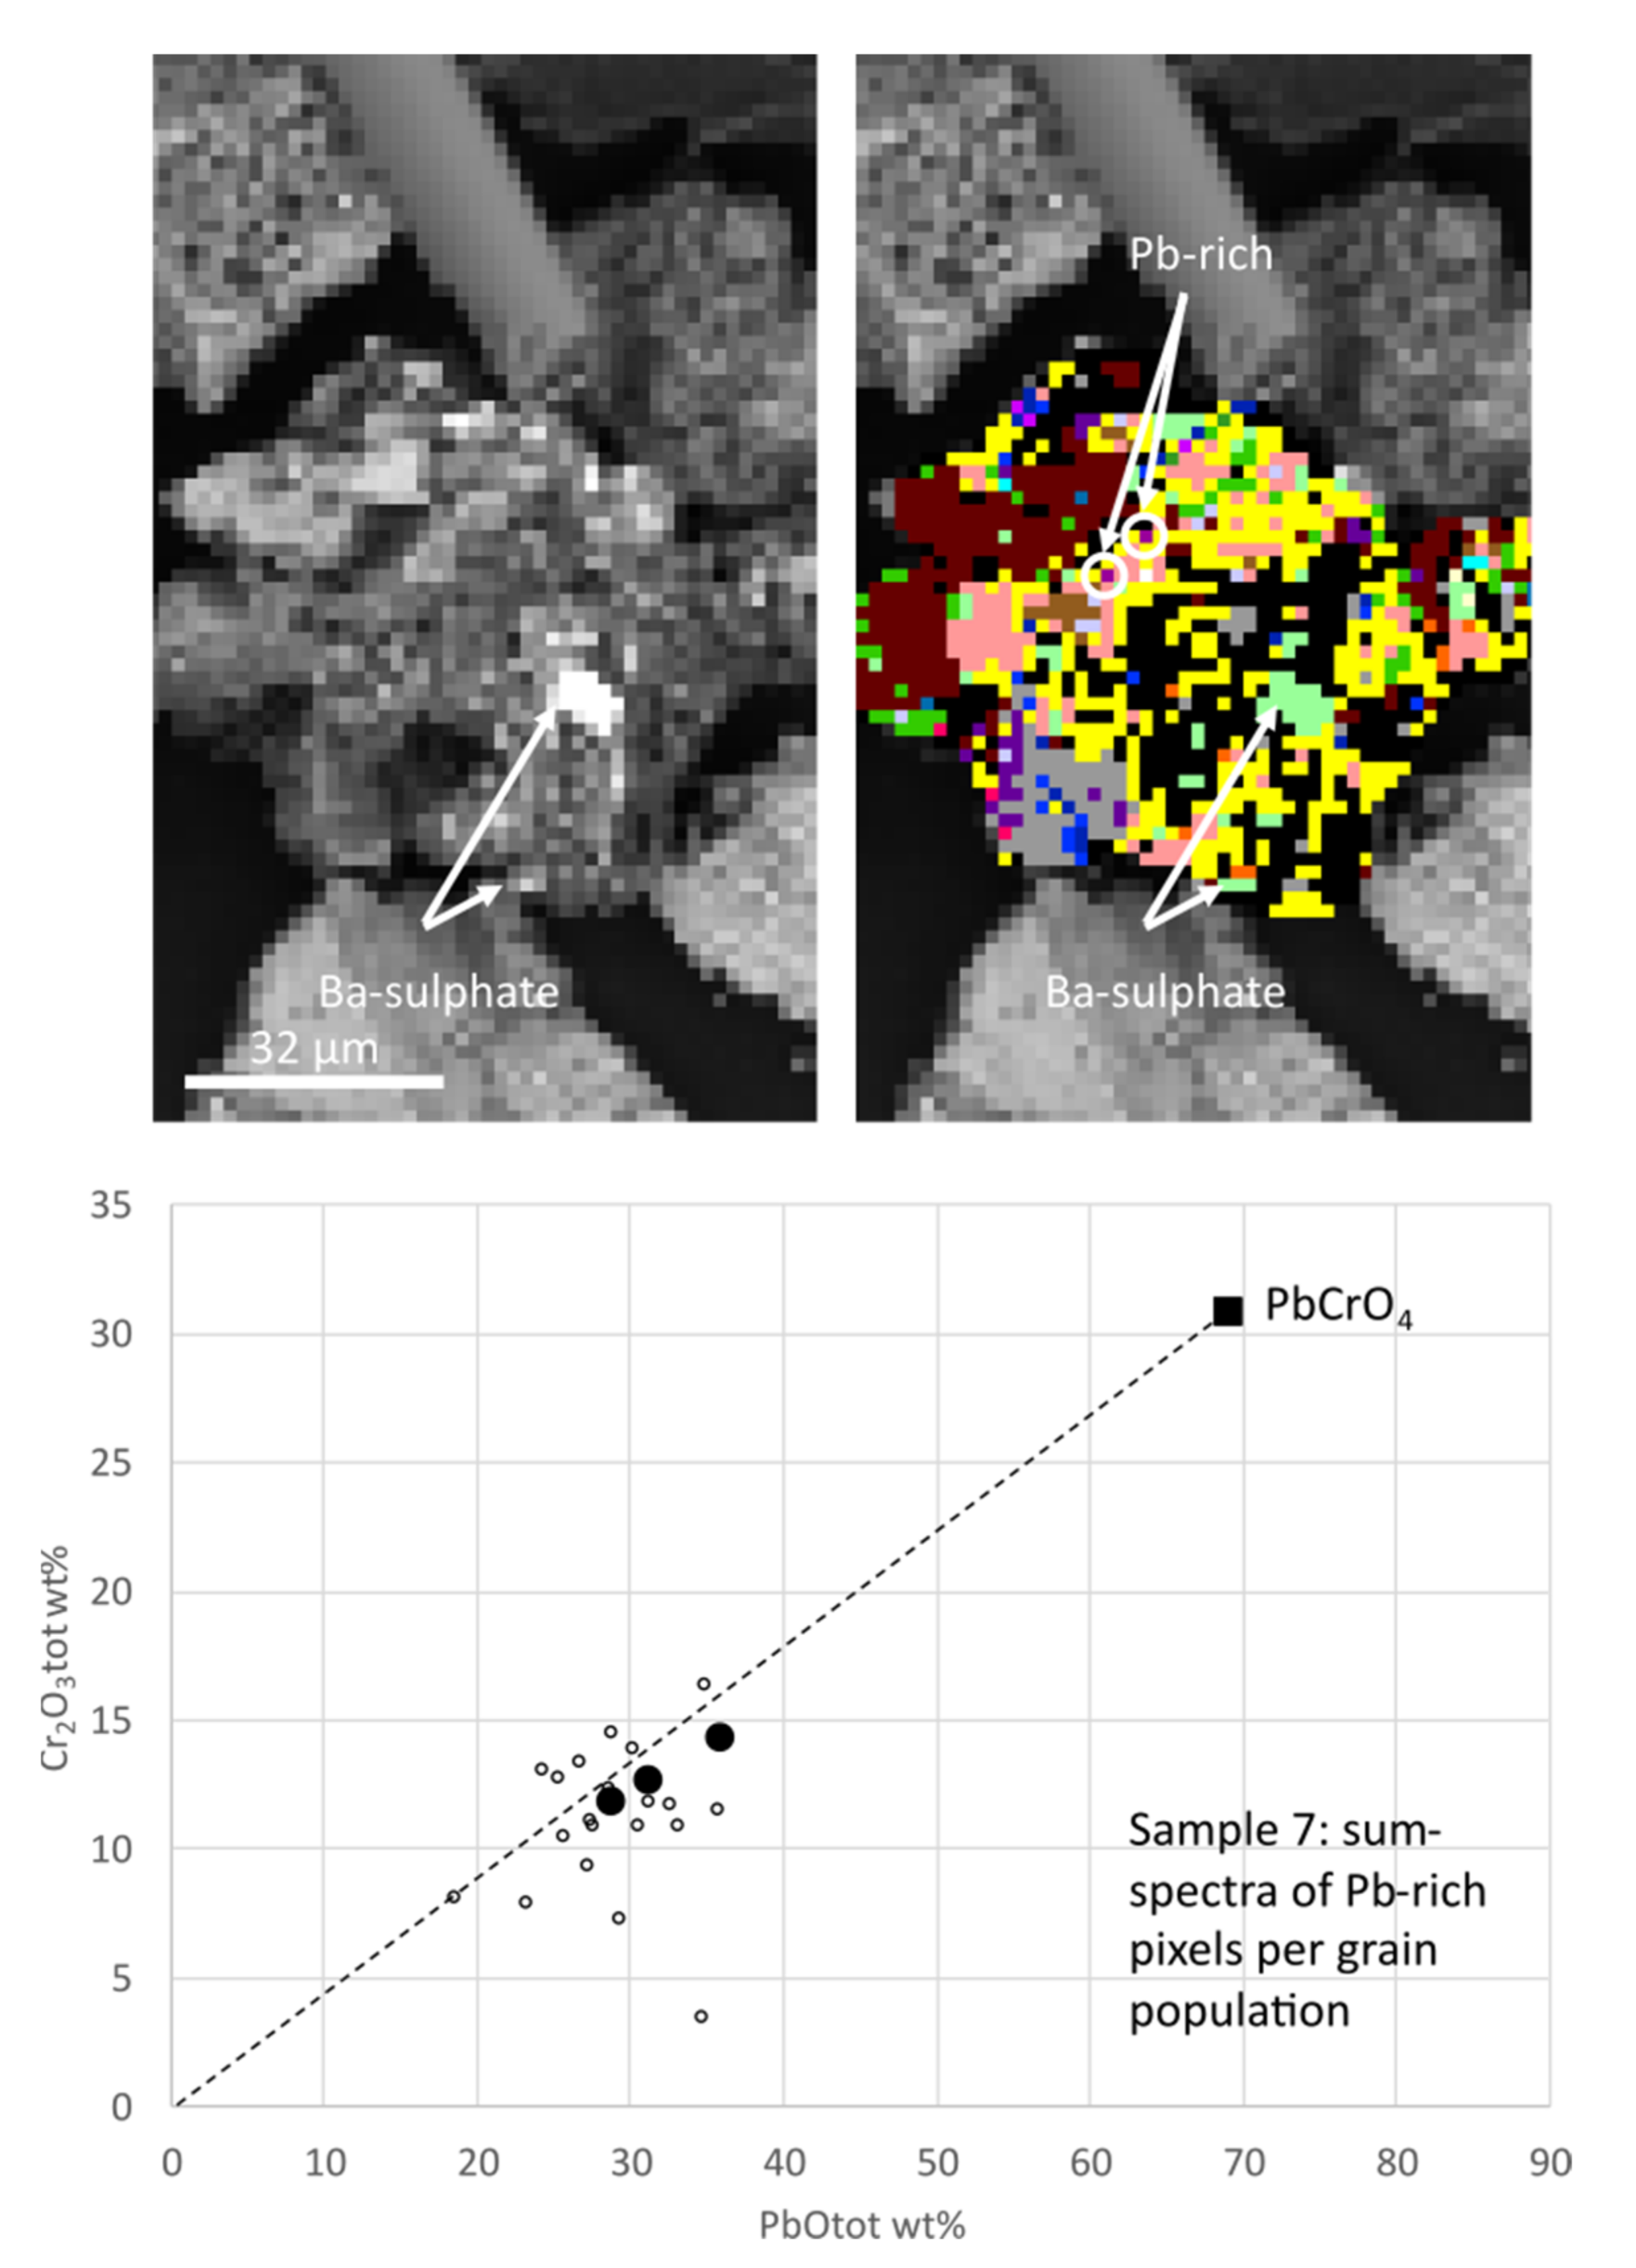
Physical Meaning of Pb-Rich Pixels and Analytical Results
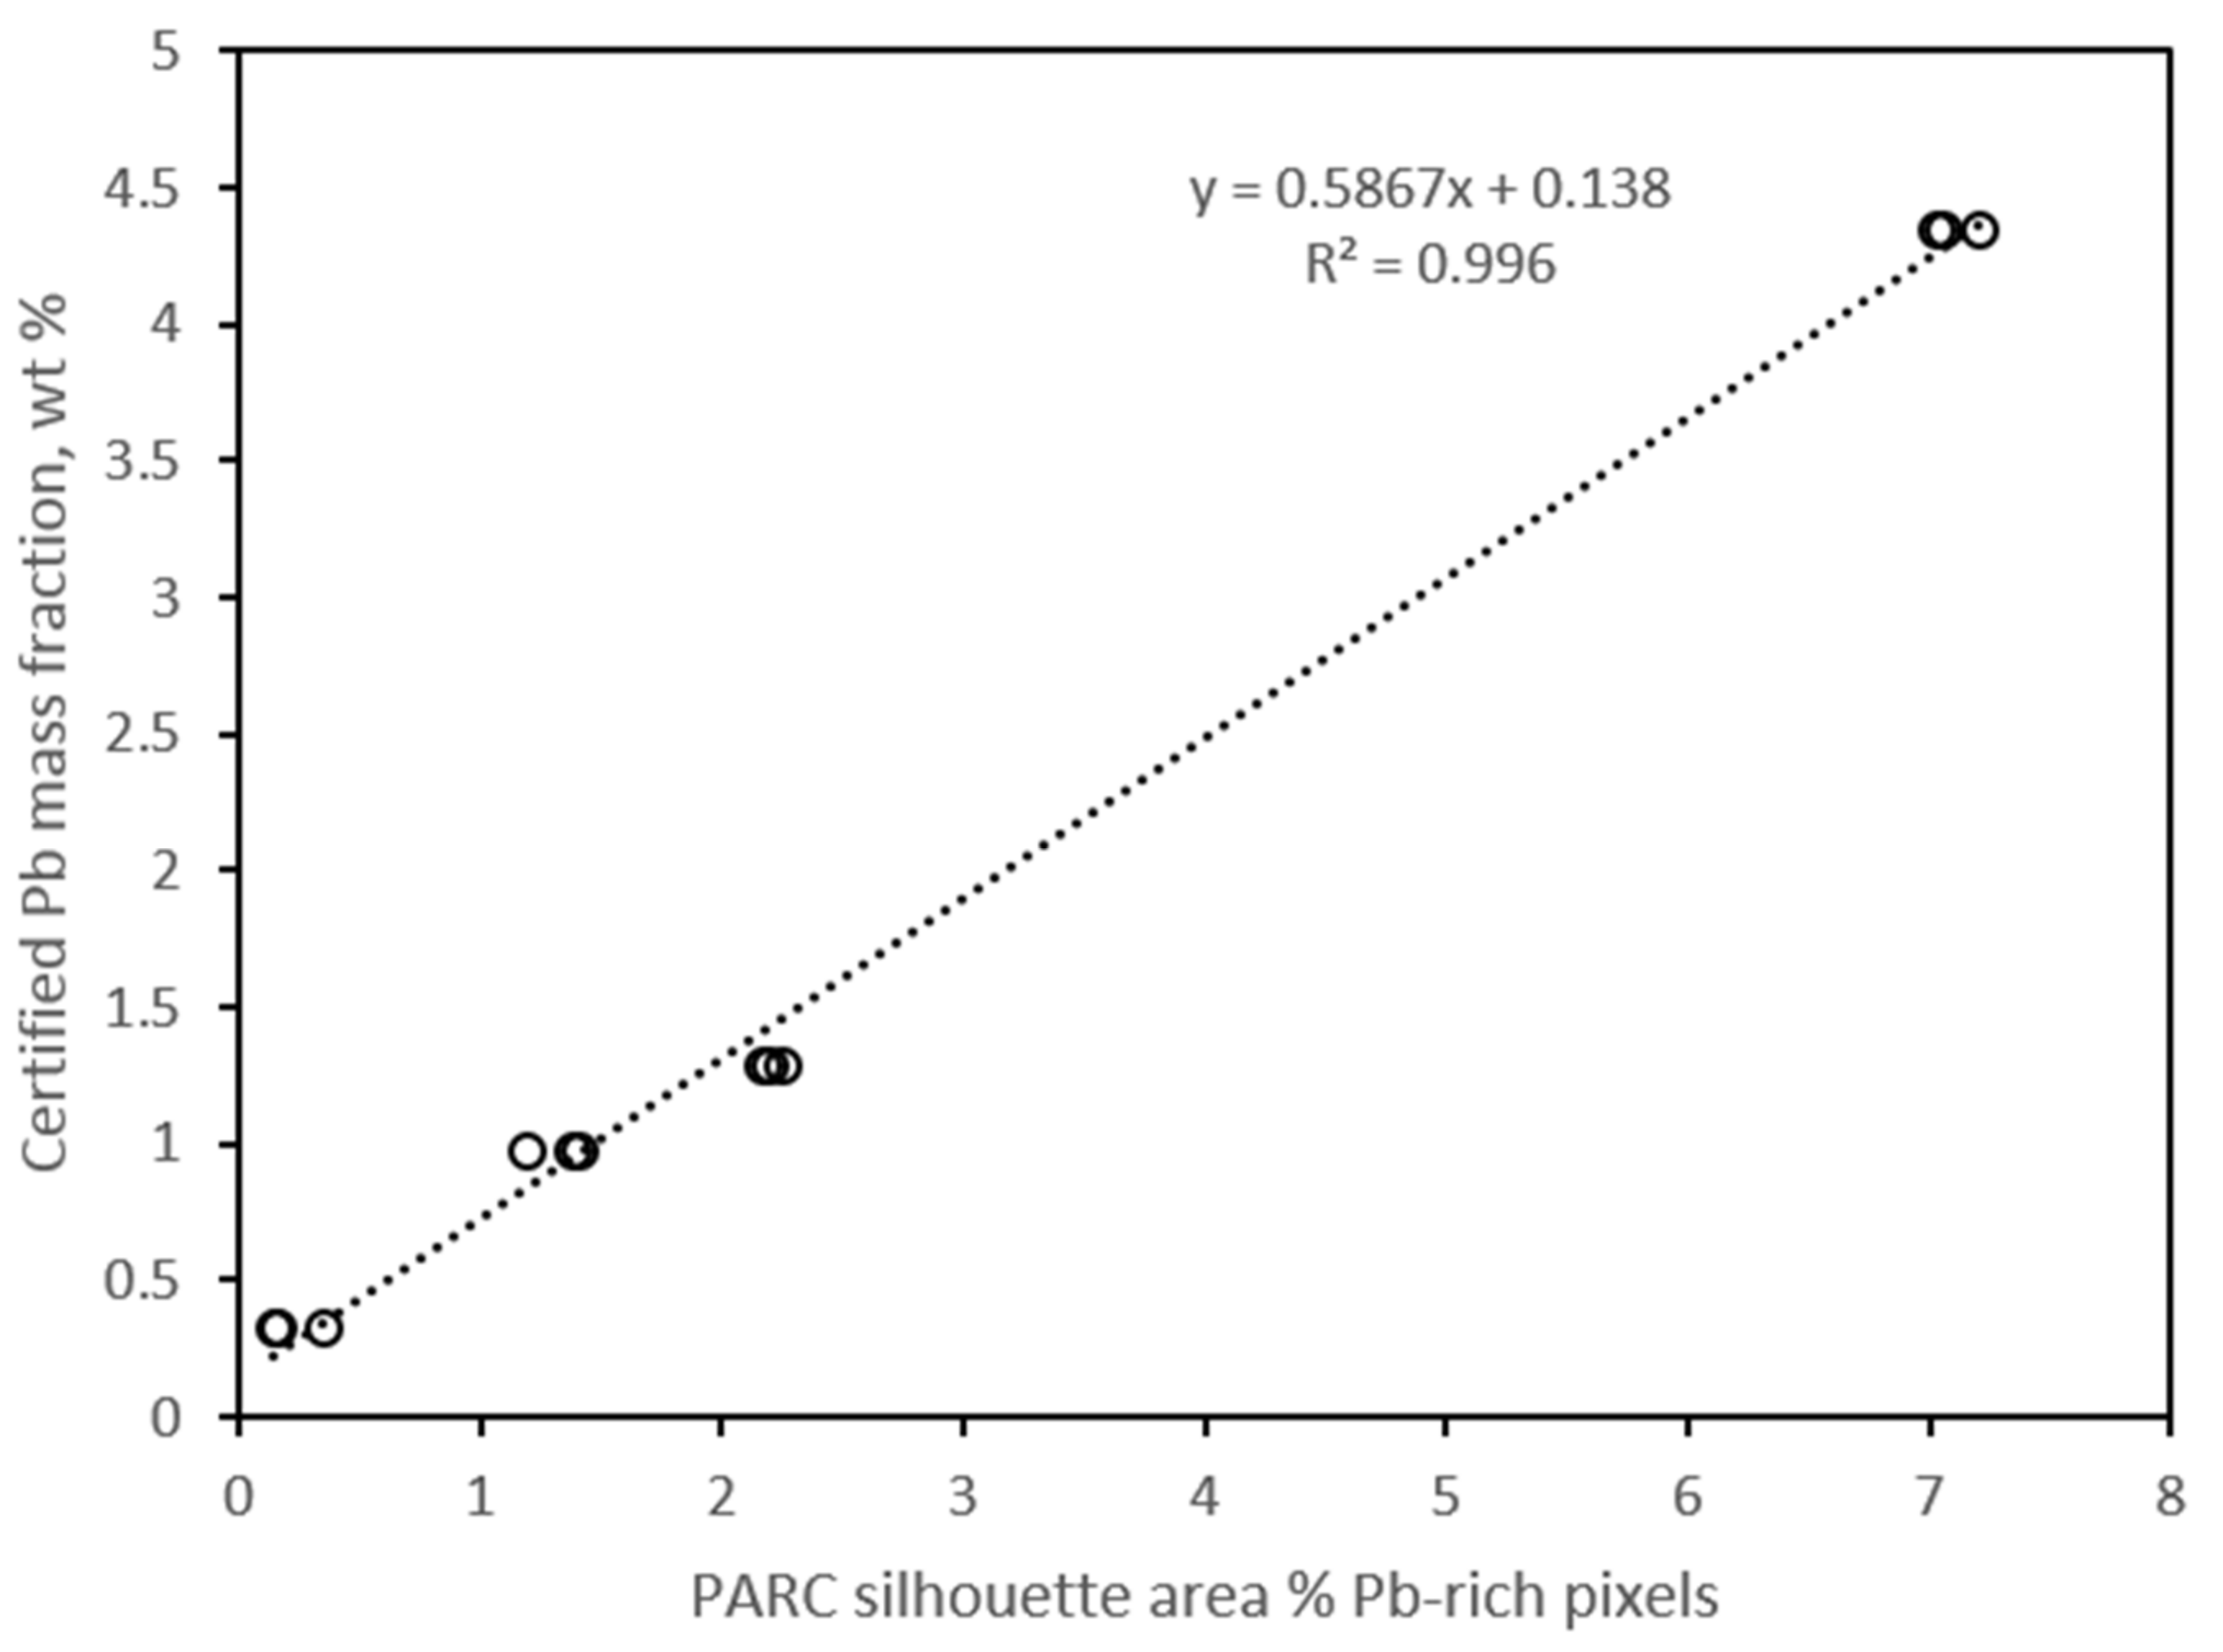
2.5. Application to NIST Pb-Rich Urban and Indoor Dust Standard Reference Materials
3. Results and Discussion
3.1. General Mineralogy of Ijmond Dust Deposit Samples
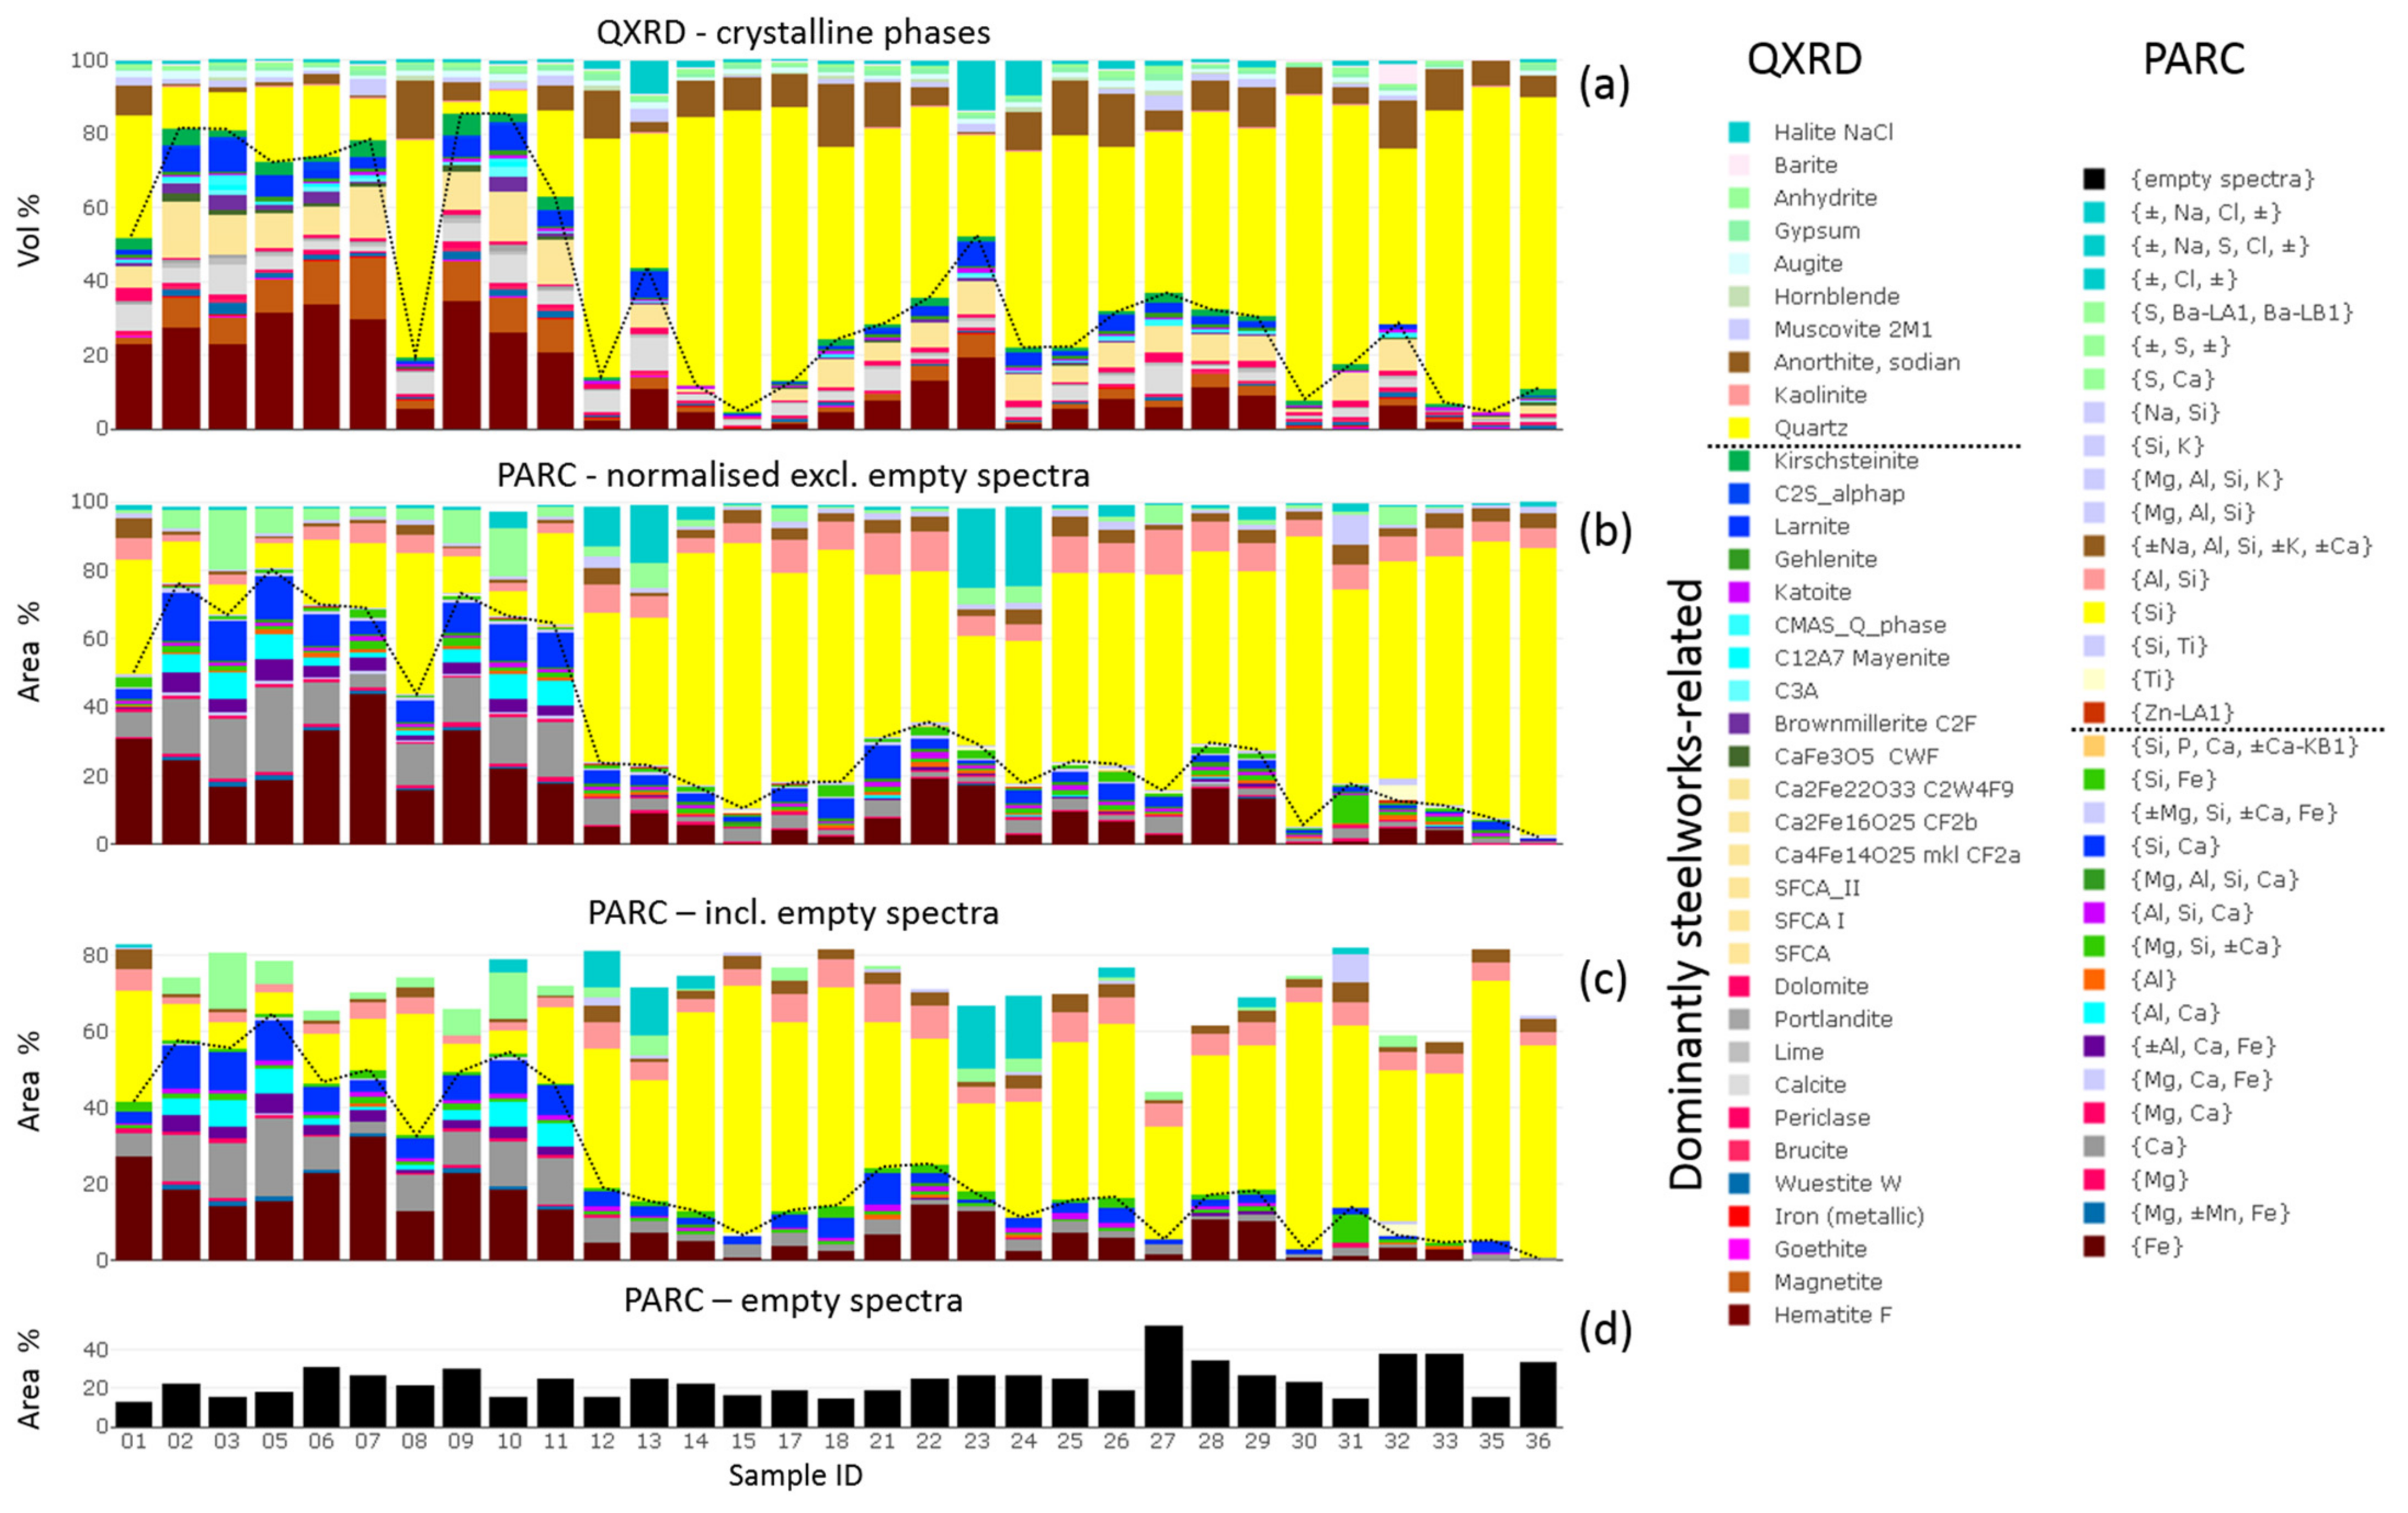
3.1.1. Crystalline Phase Proportions from QXRD
3.1.2. PARC Group Abundances and Relationship with QXRD Analyses
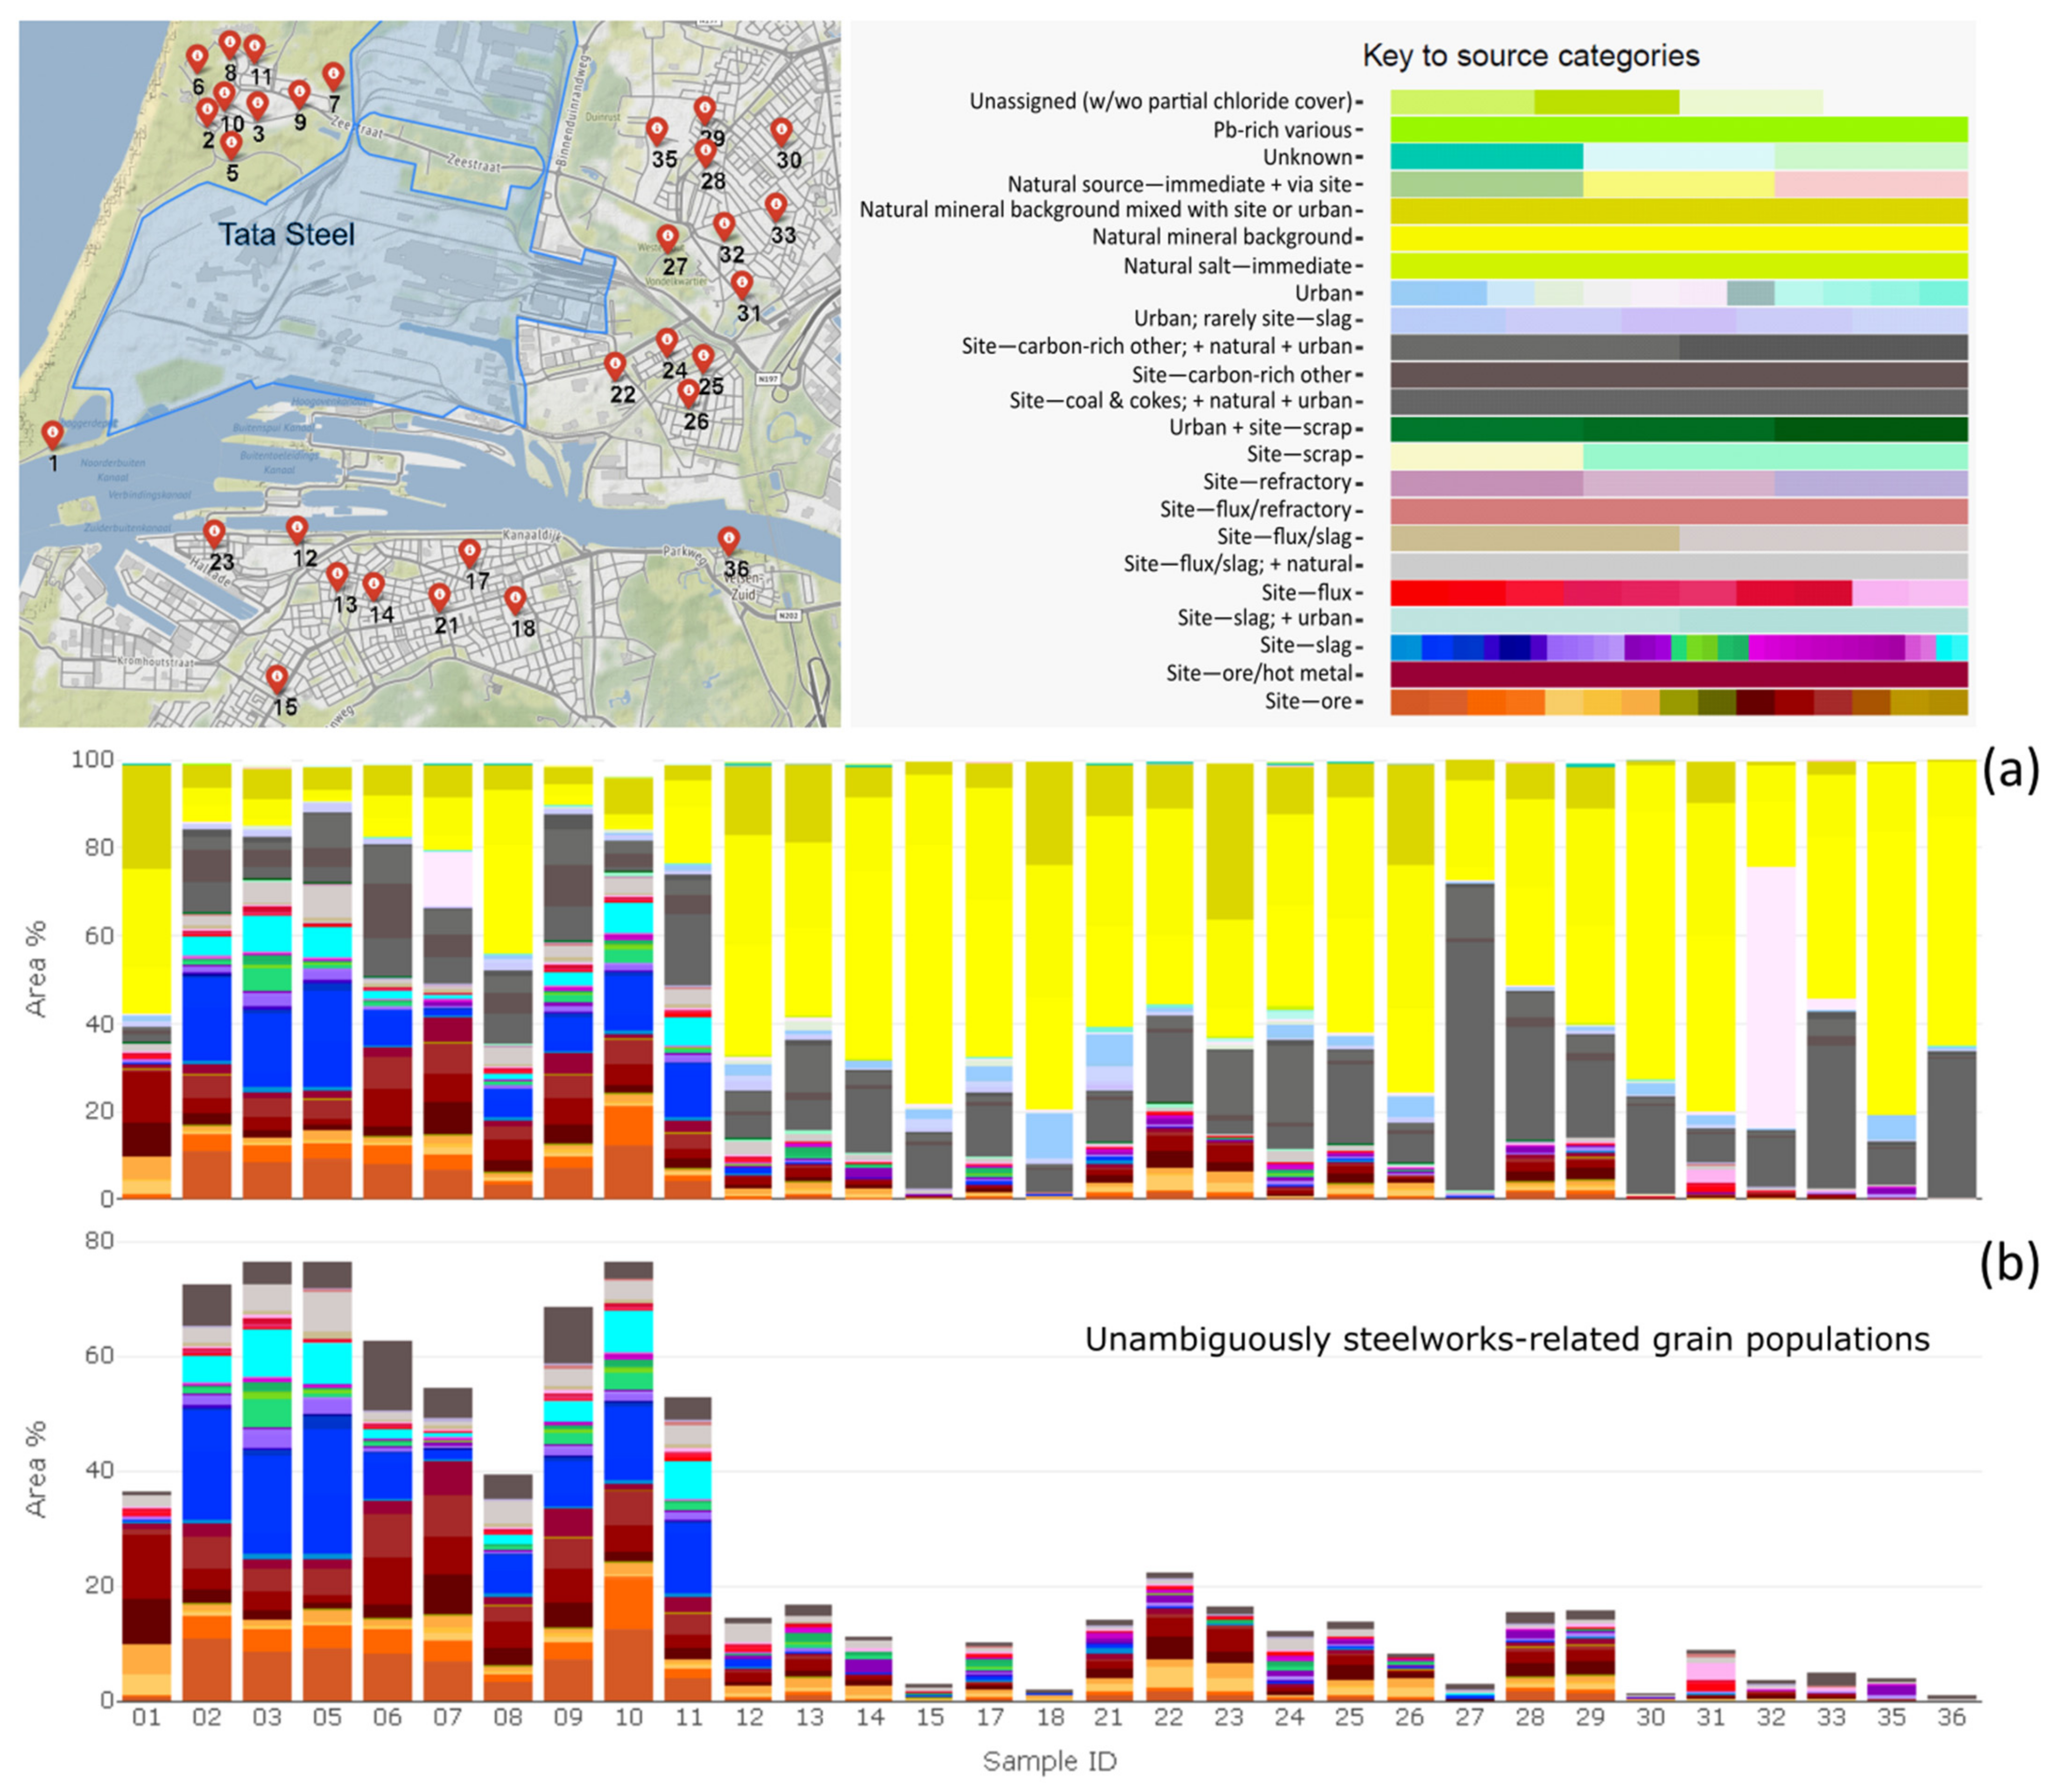
3.2. Grain Population Abundances per Sample
3.2.1. Unambiguous Steelworks-Related Populations
3.2.2. Carbon-Rich Populations
3.2.3. Urban Dust Sources
3.2.4. Natural and Mixed Material
3.3. Occurrence of Pb-Rich Phases in Samples
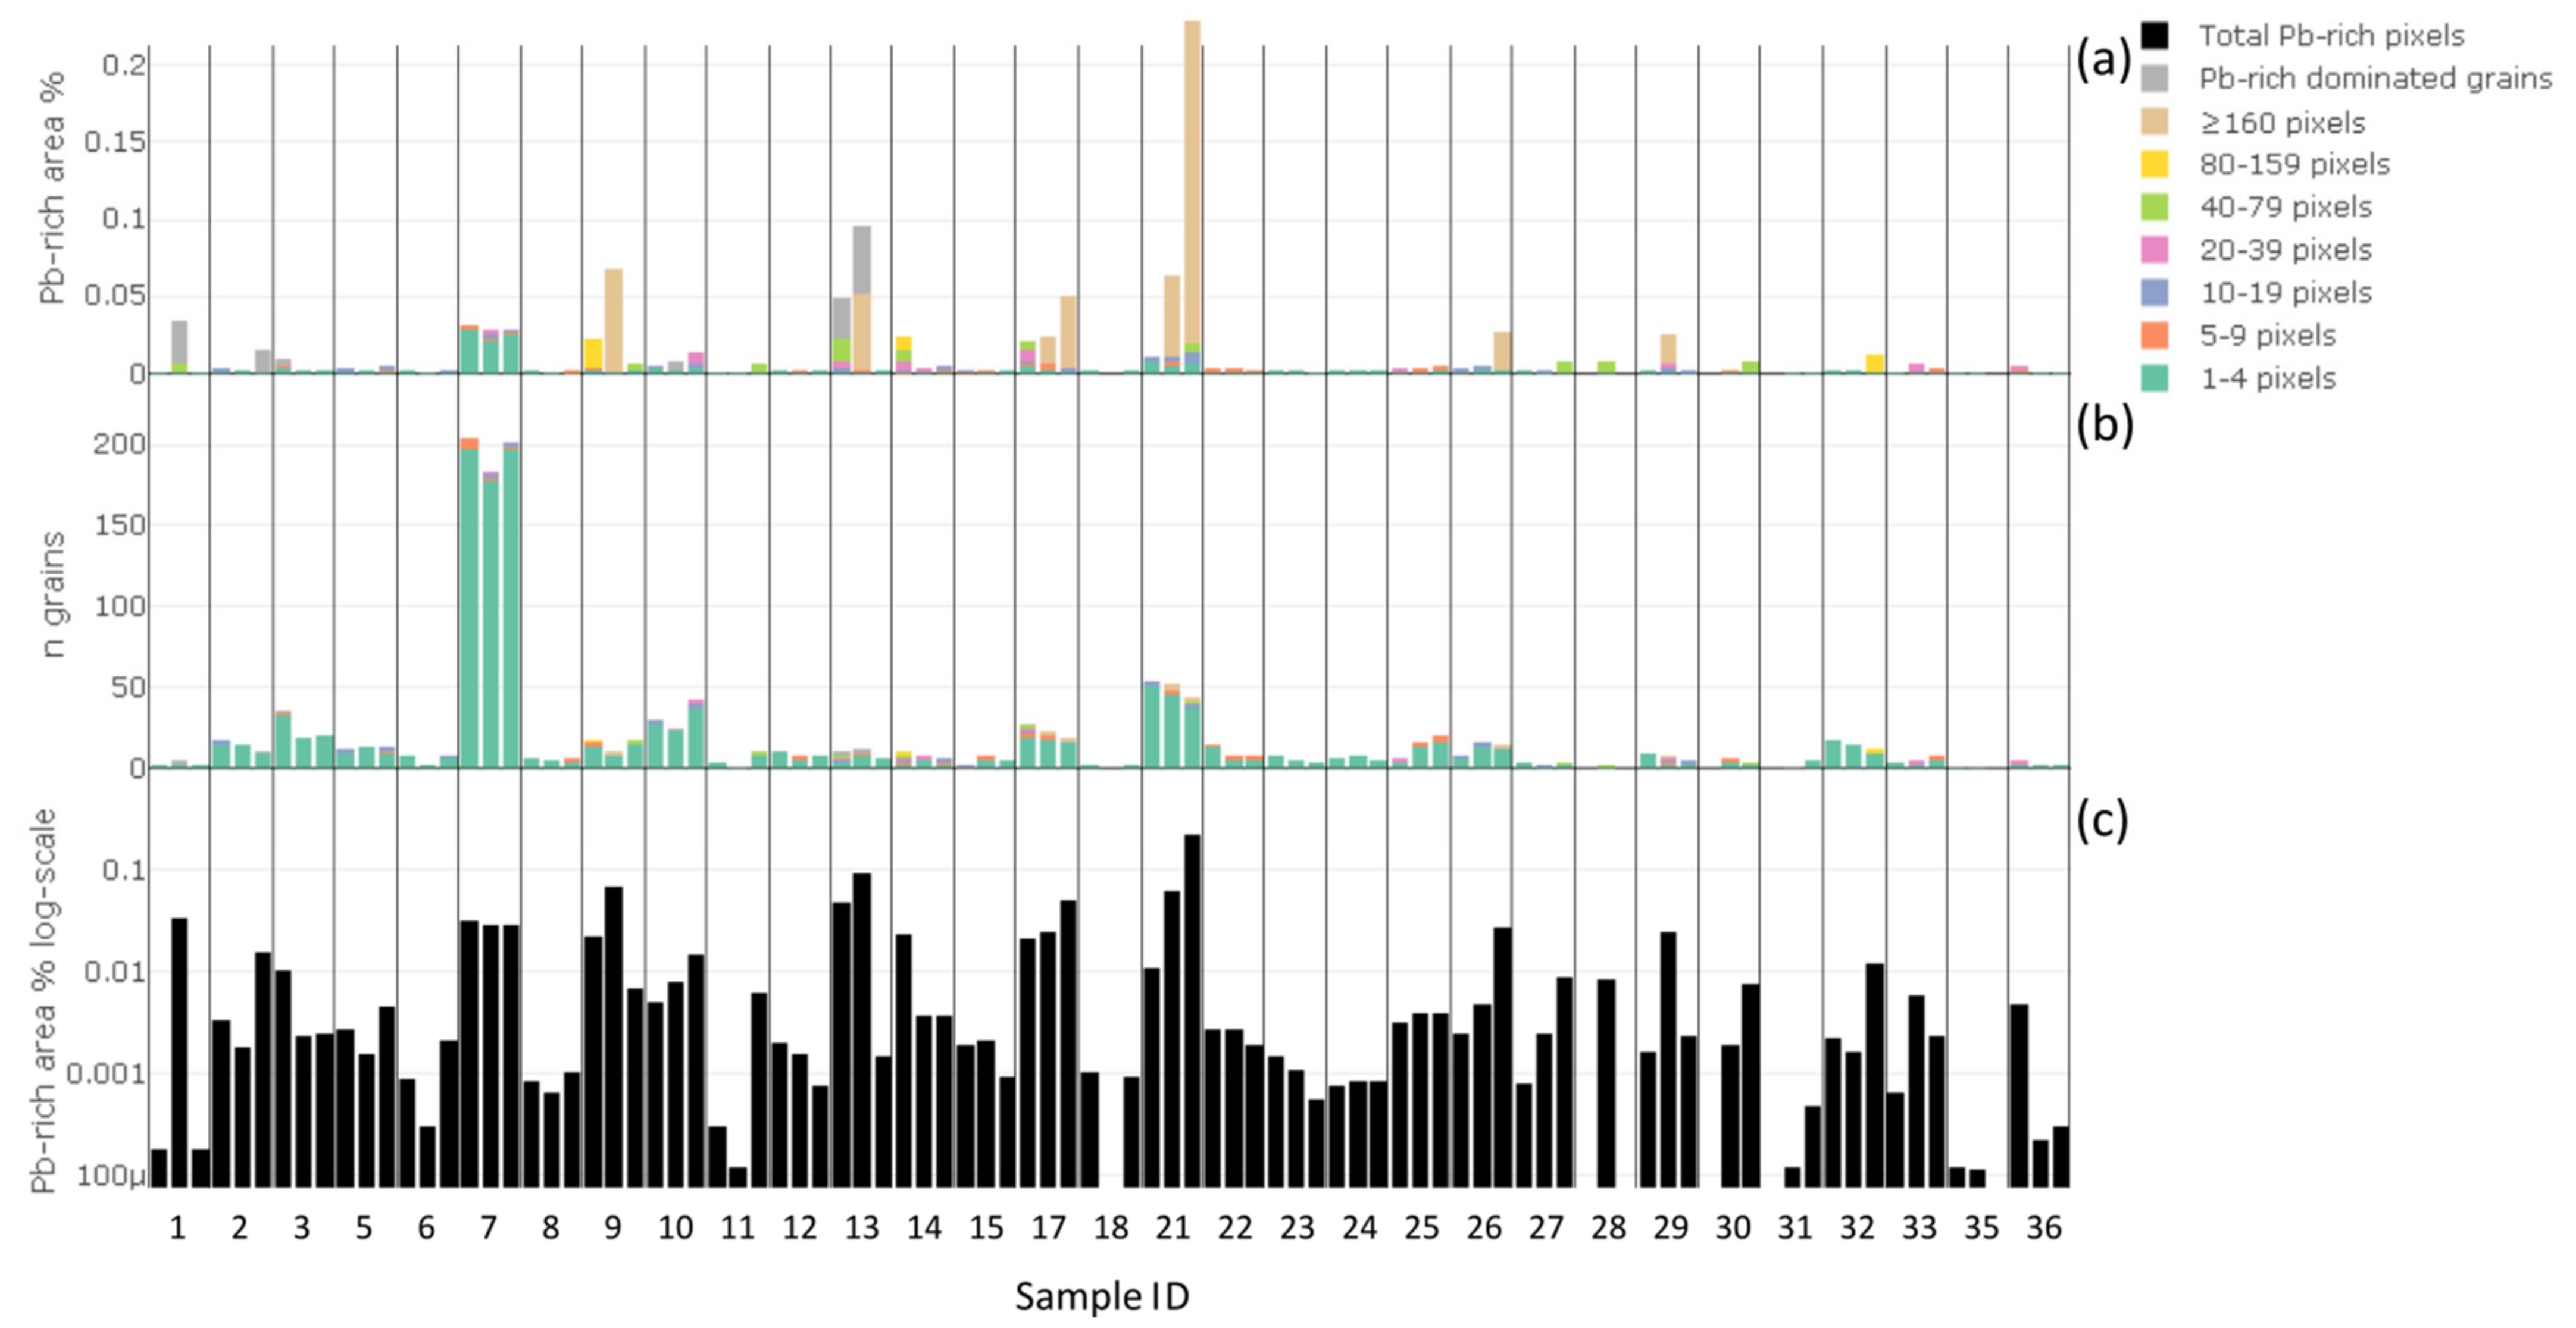
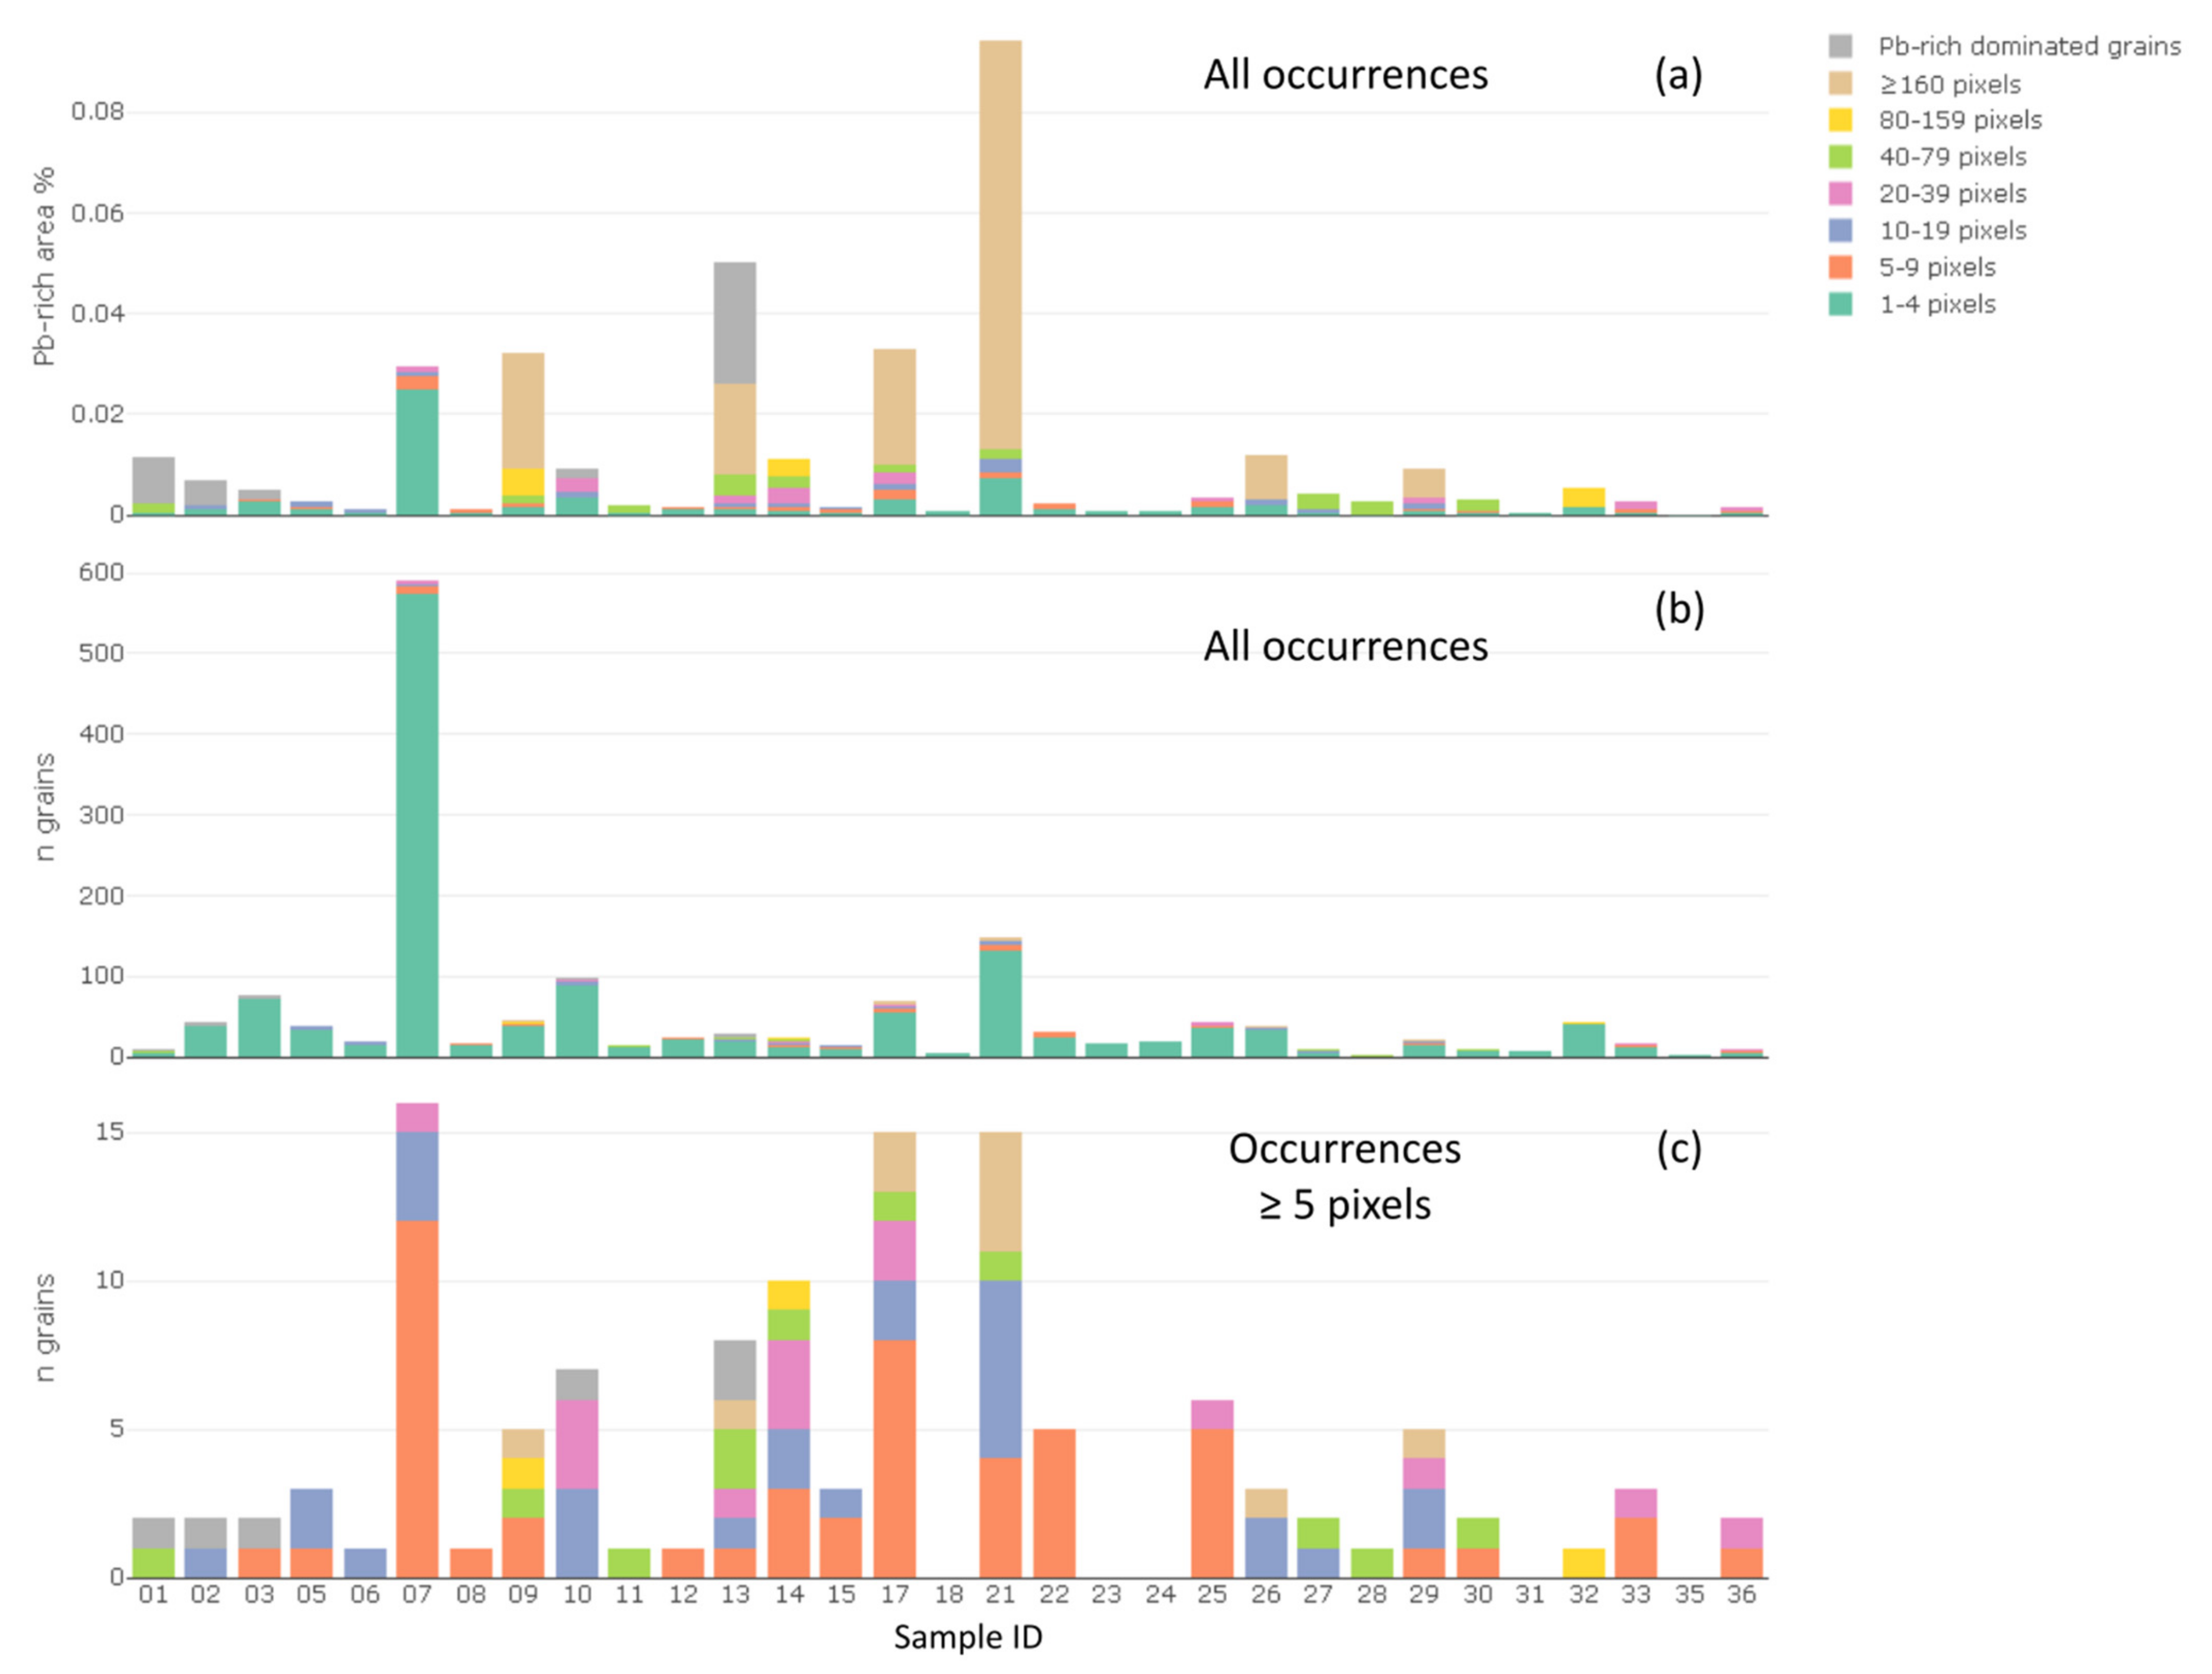
3.3.1. Total Pb-Rich Phase Abundances per Sample
- -
- Pb-rich dominated: grains containing >50 area % Pb-rich pixels and >70 area % when excluding empty spectra pixels. This is a subset of the grain population 111 (Table 1), which captures extremely scarce, discrete grains which in the PARC imagery of the current dataset (specifically) are dominated by Pb-rich pixels with little or no other PARC group present, except for superficial sub-particles or artefacts of grain segmentation.
- -
- The remaining grains (in all populations) containing Pb-rich pixels are subdivided according to the number of Pb-rich pixels they contain, using a geometric binning sequence: 1–4, 5–9, 10–19, 20–39, 40–79, 80–160 and ≥160 Pb-rich pixels.
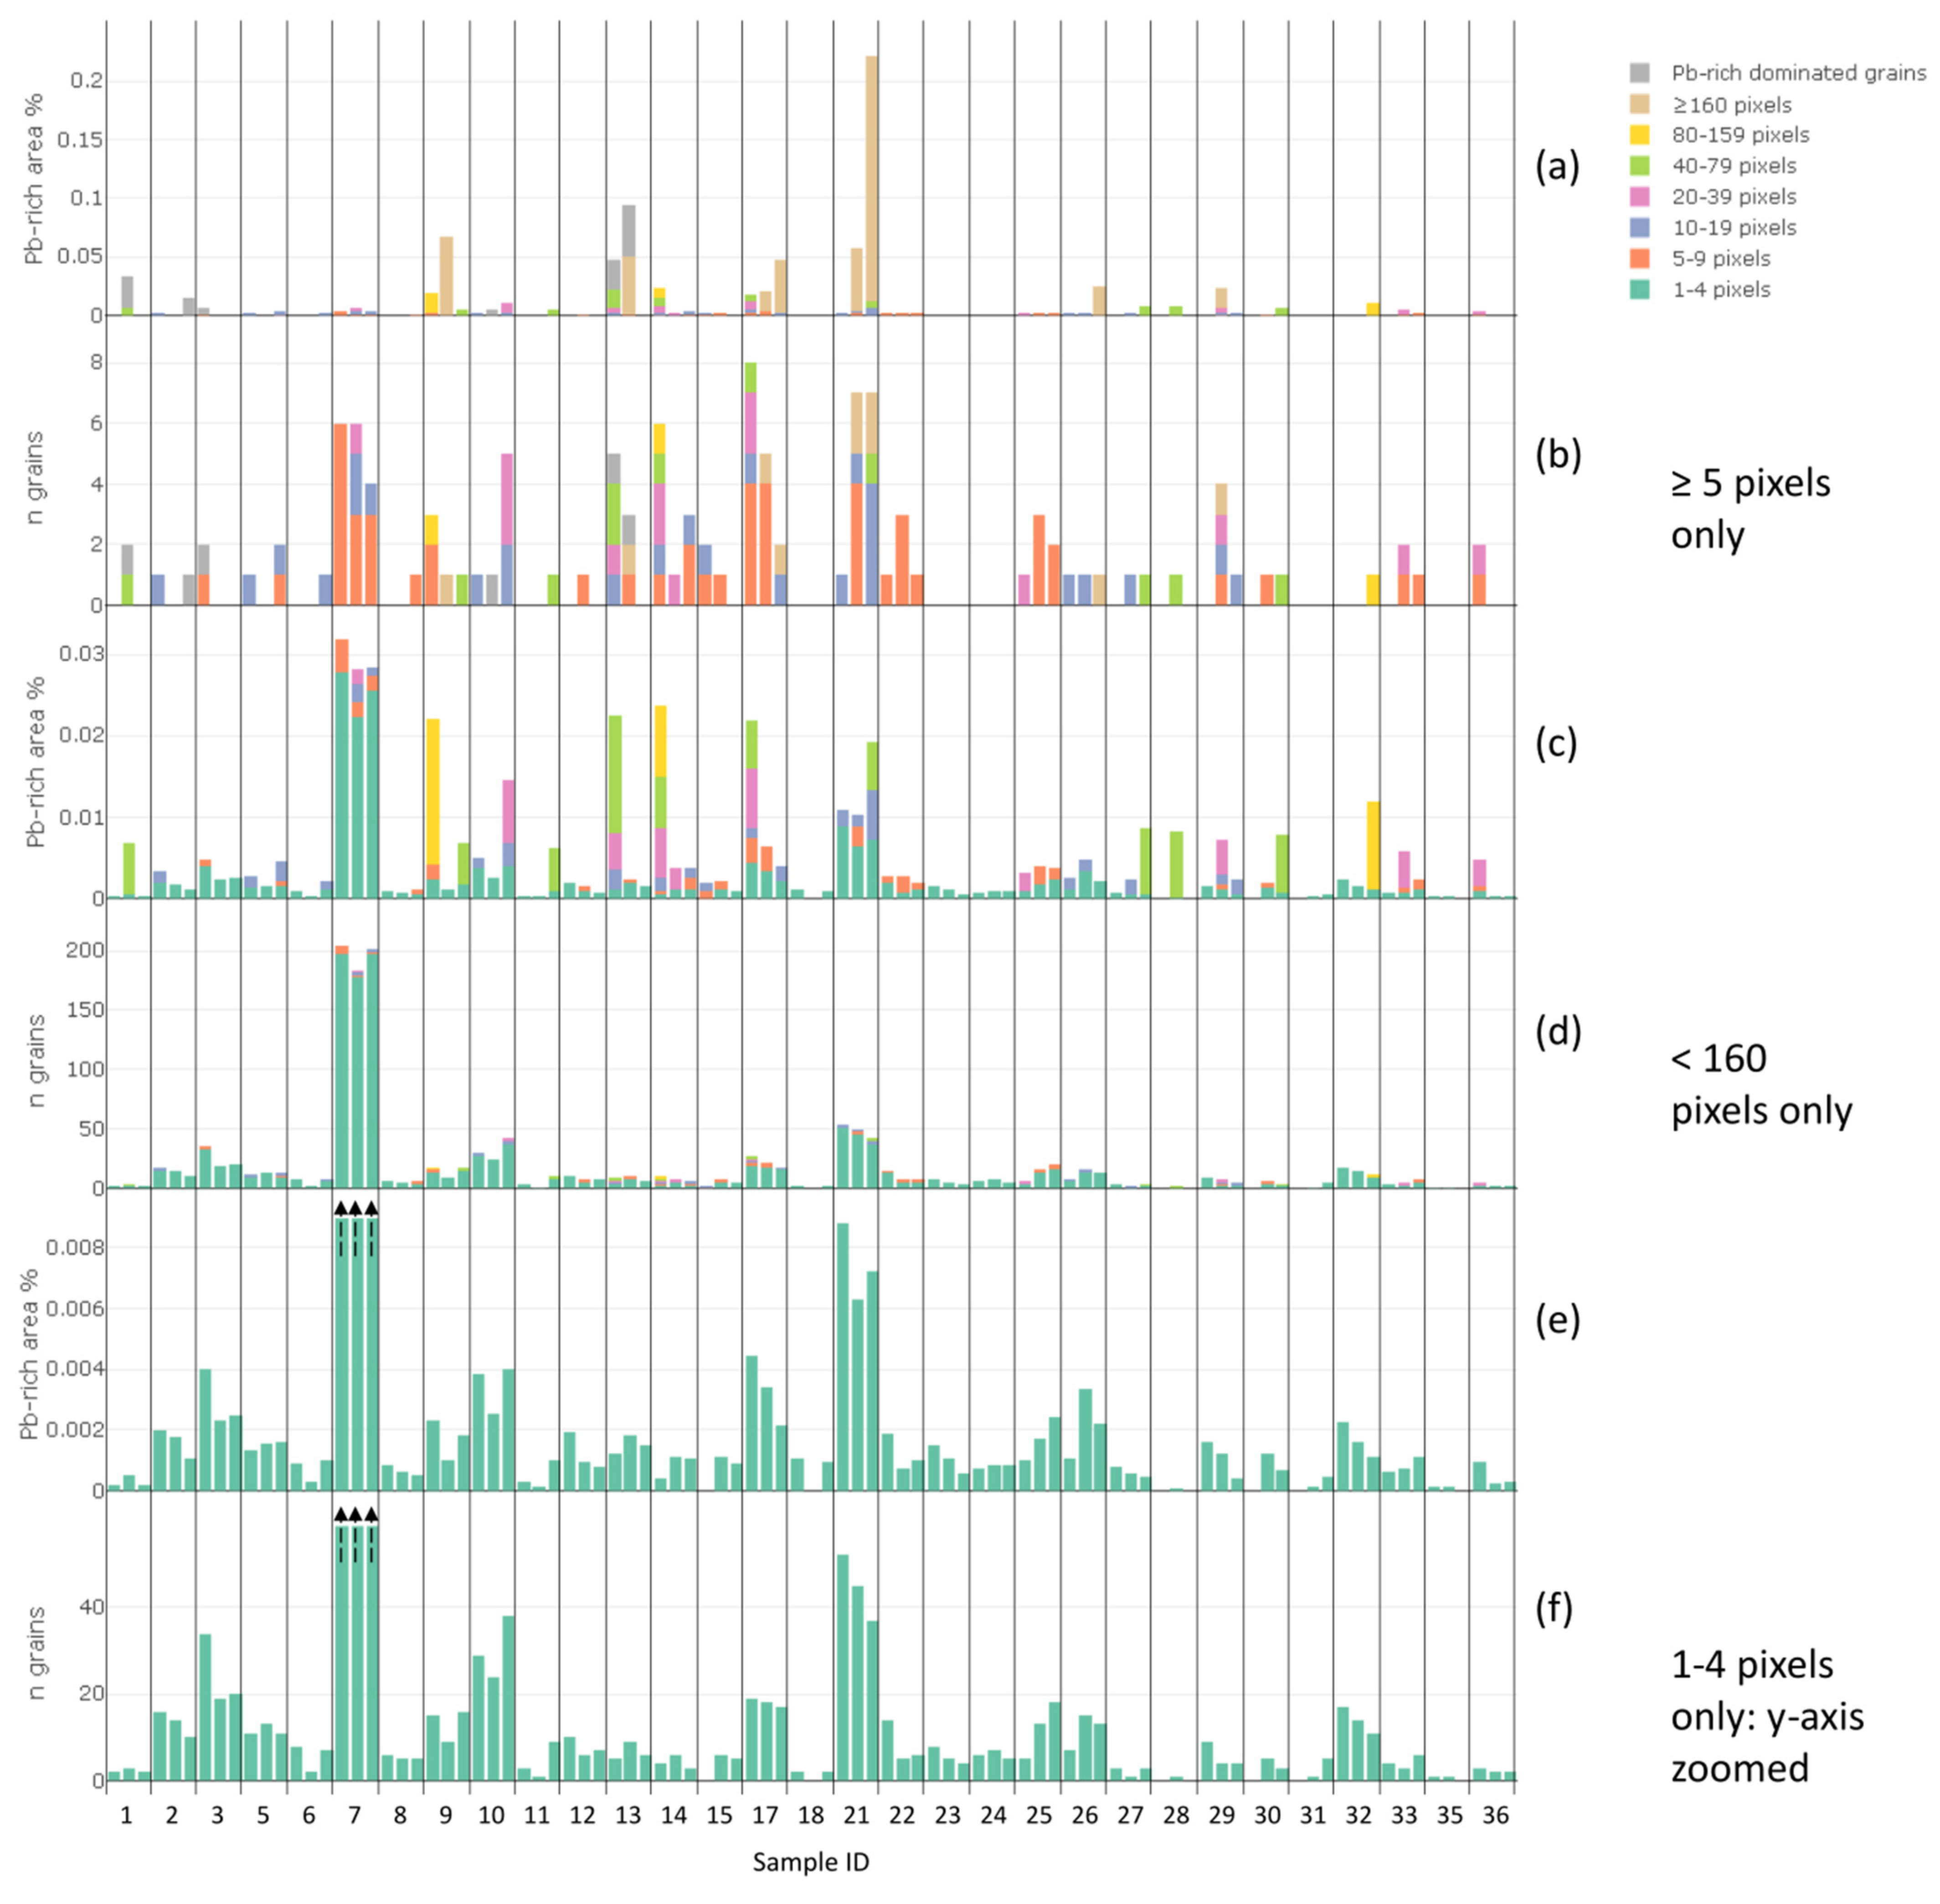
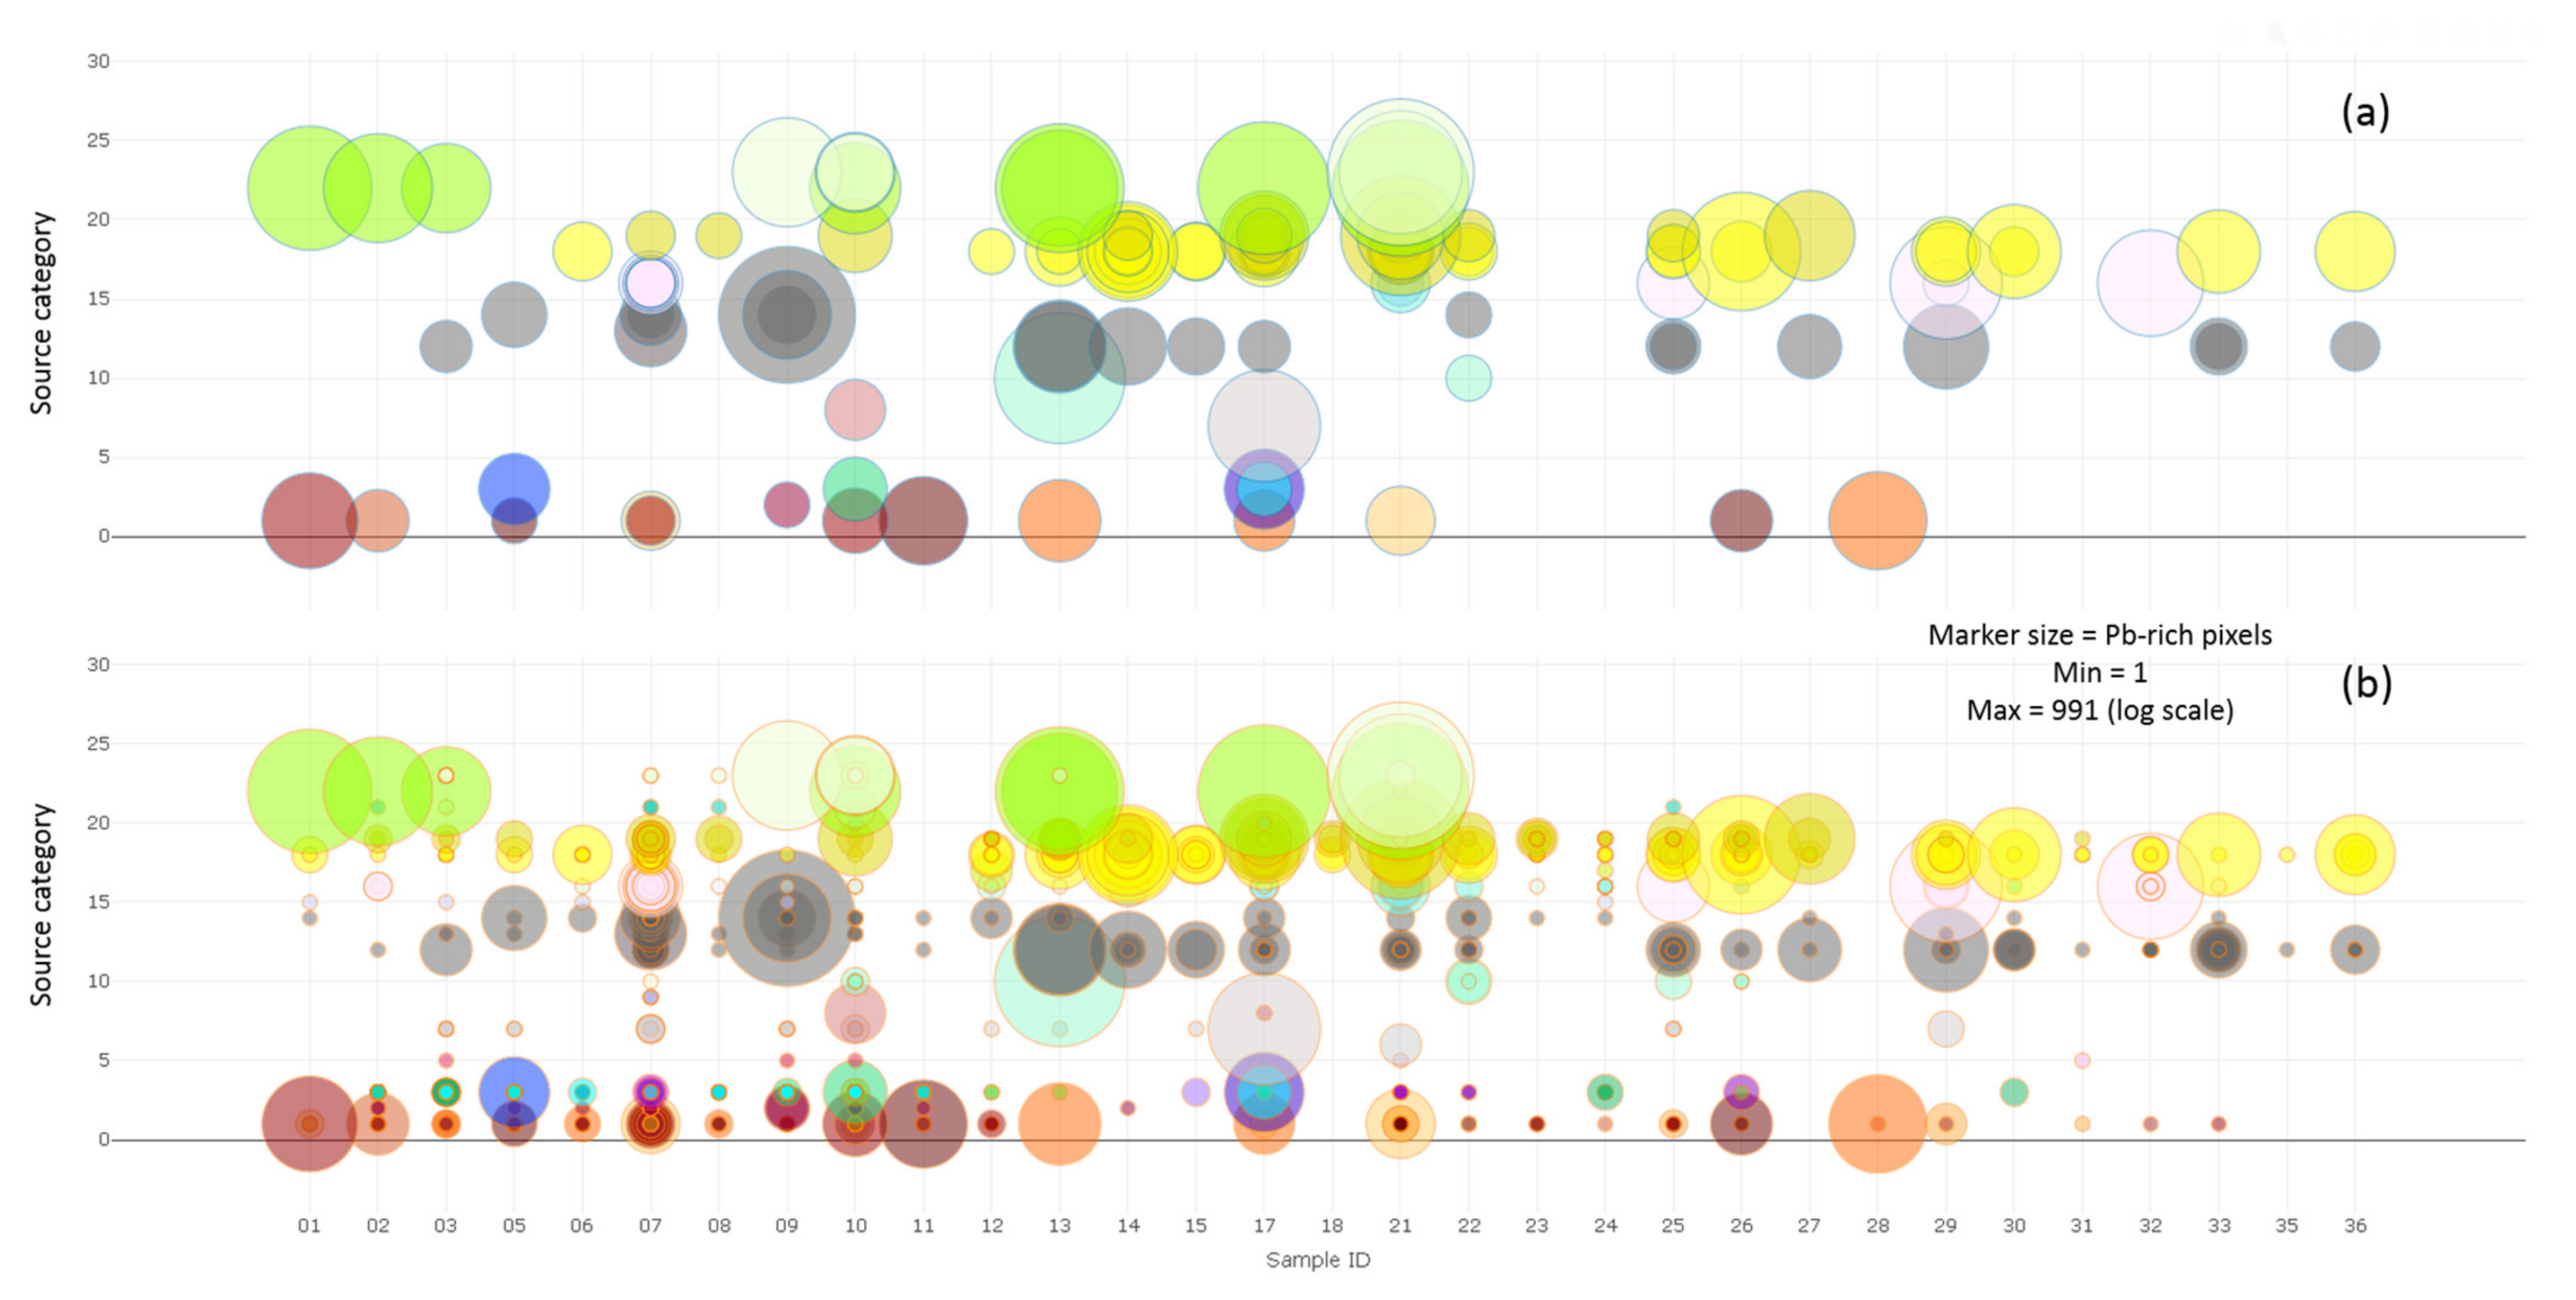
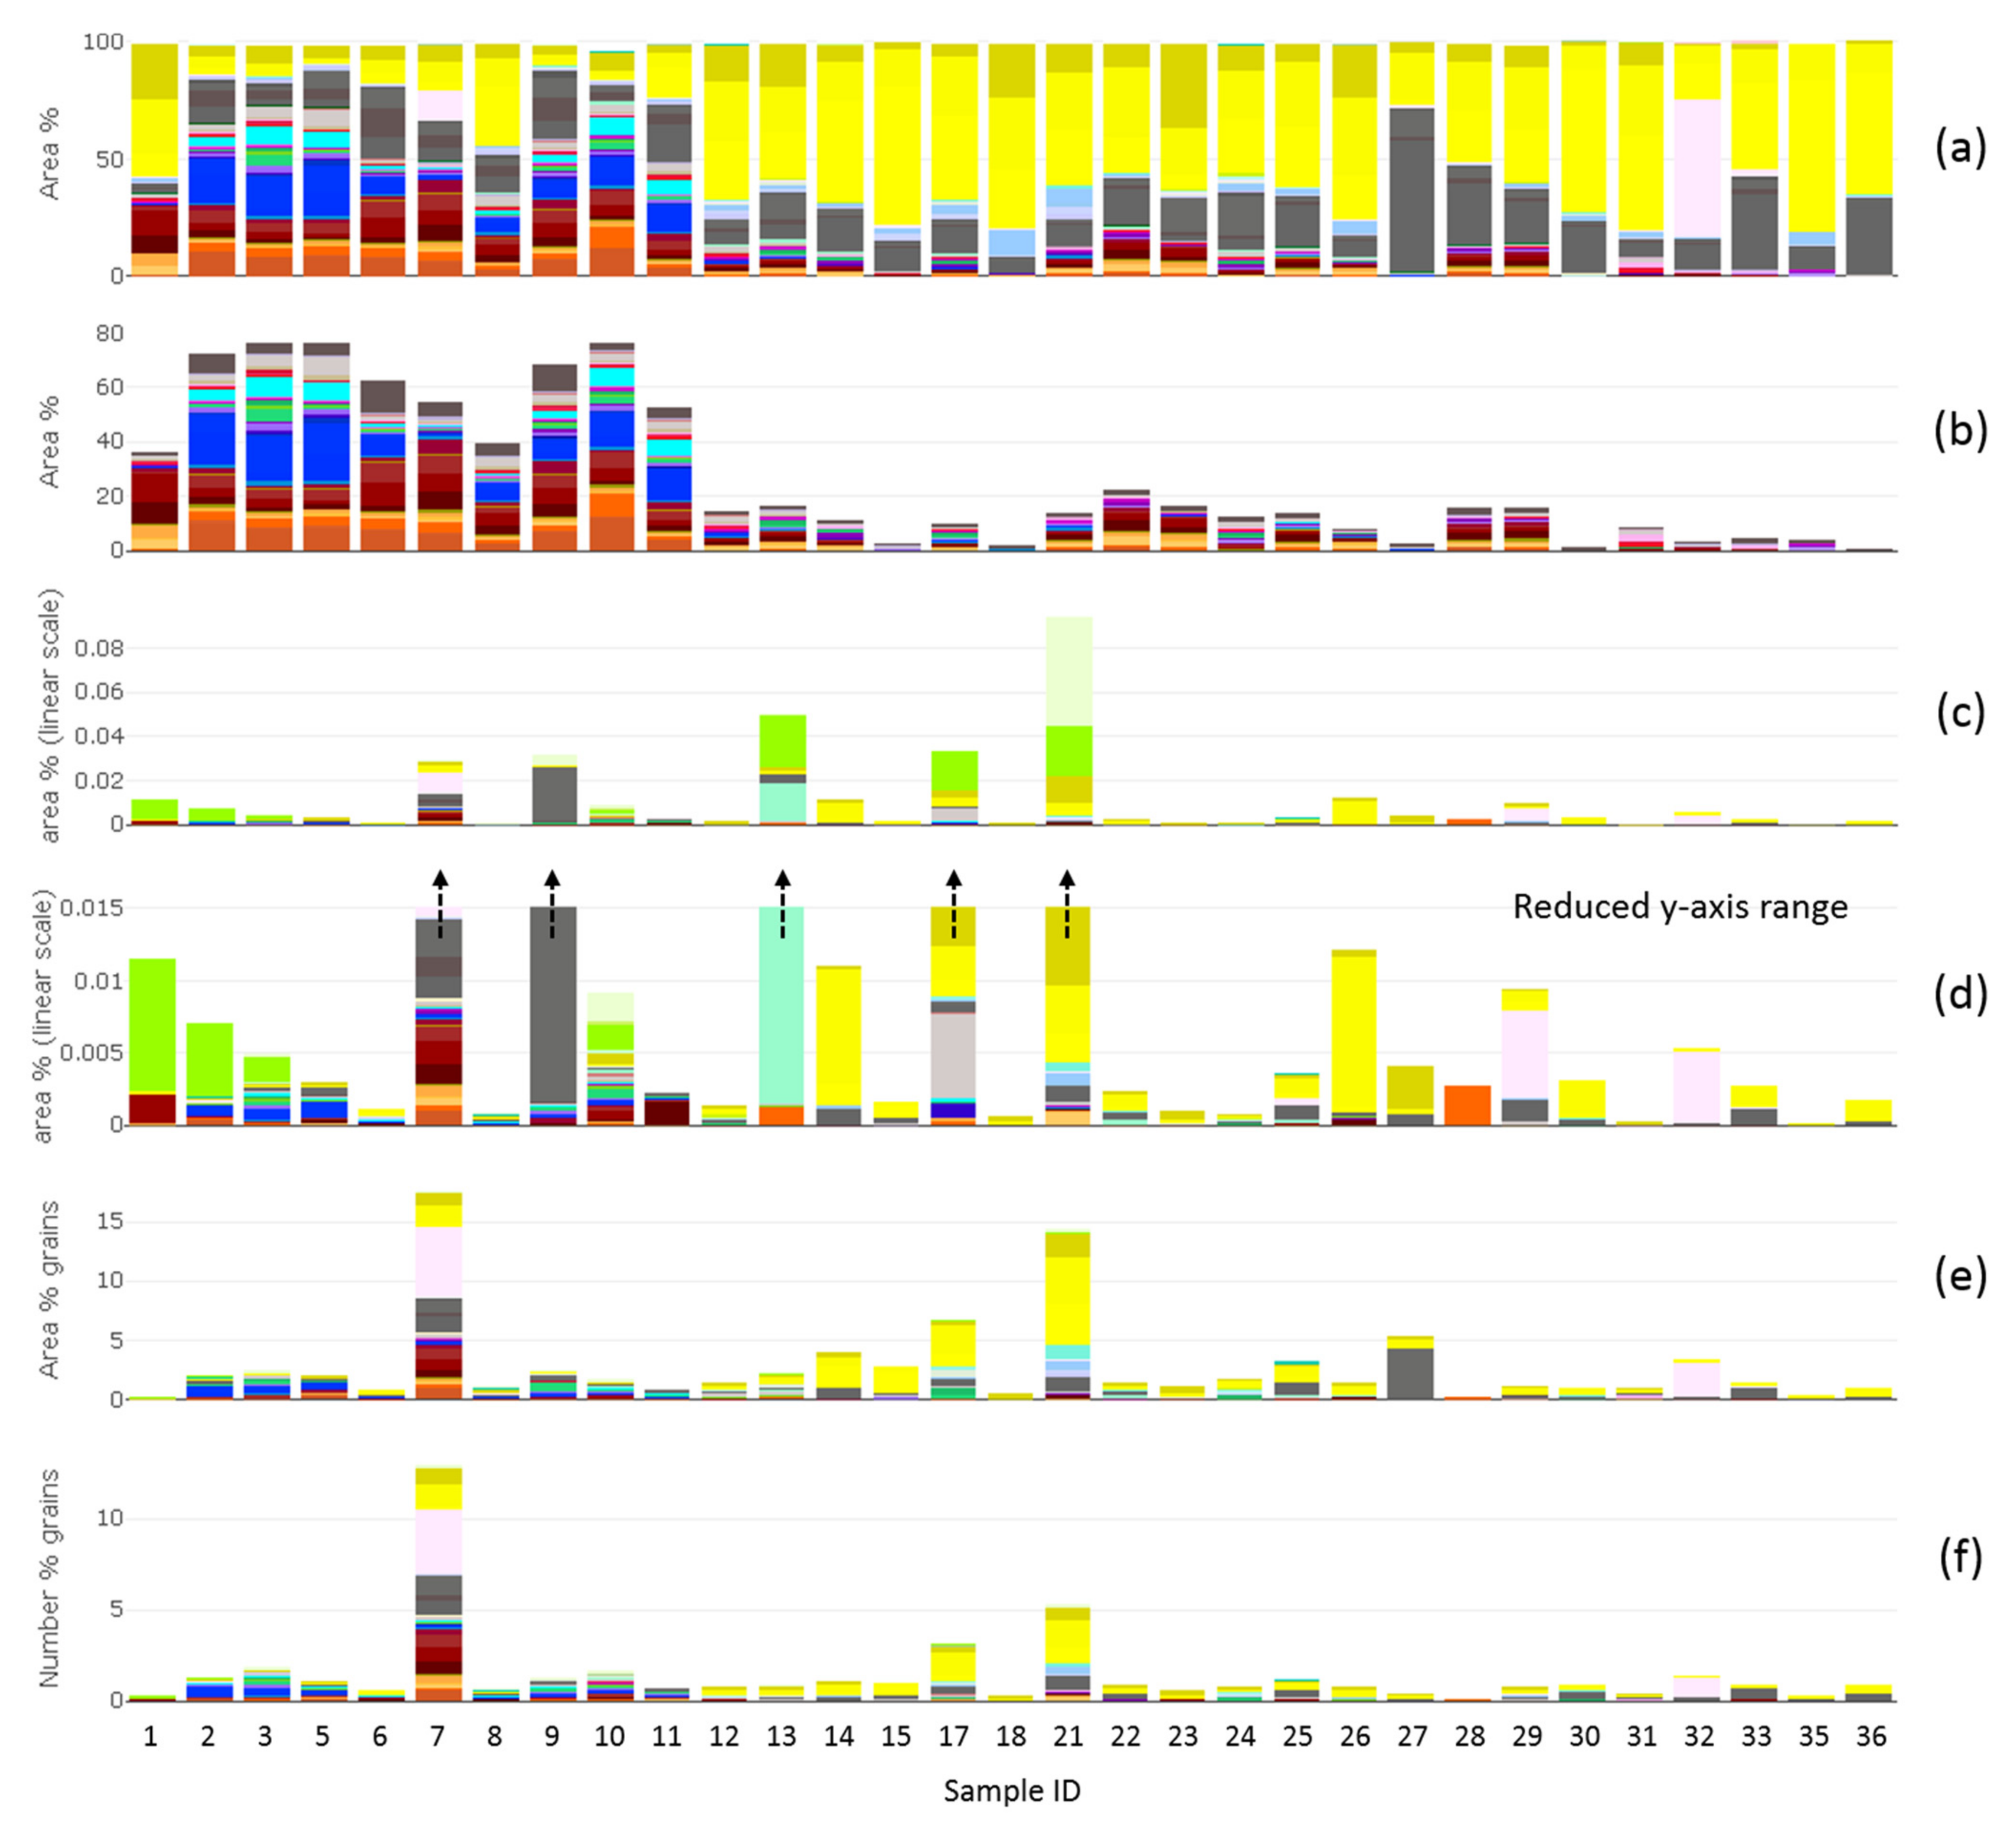
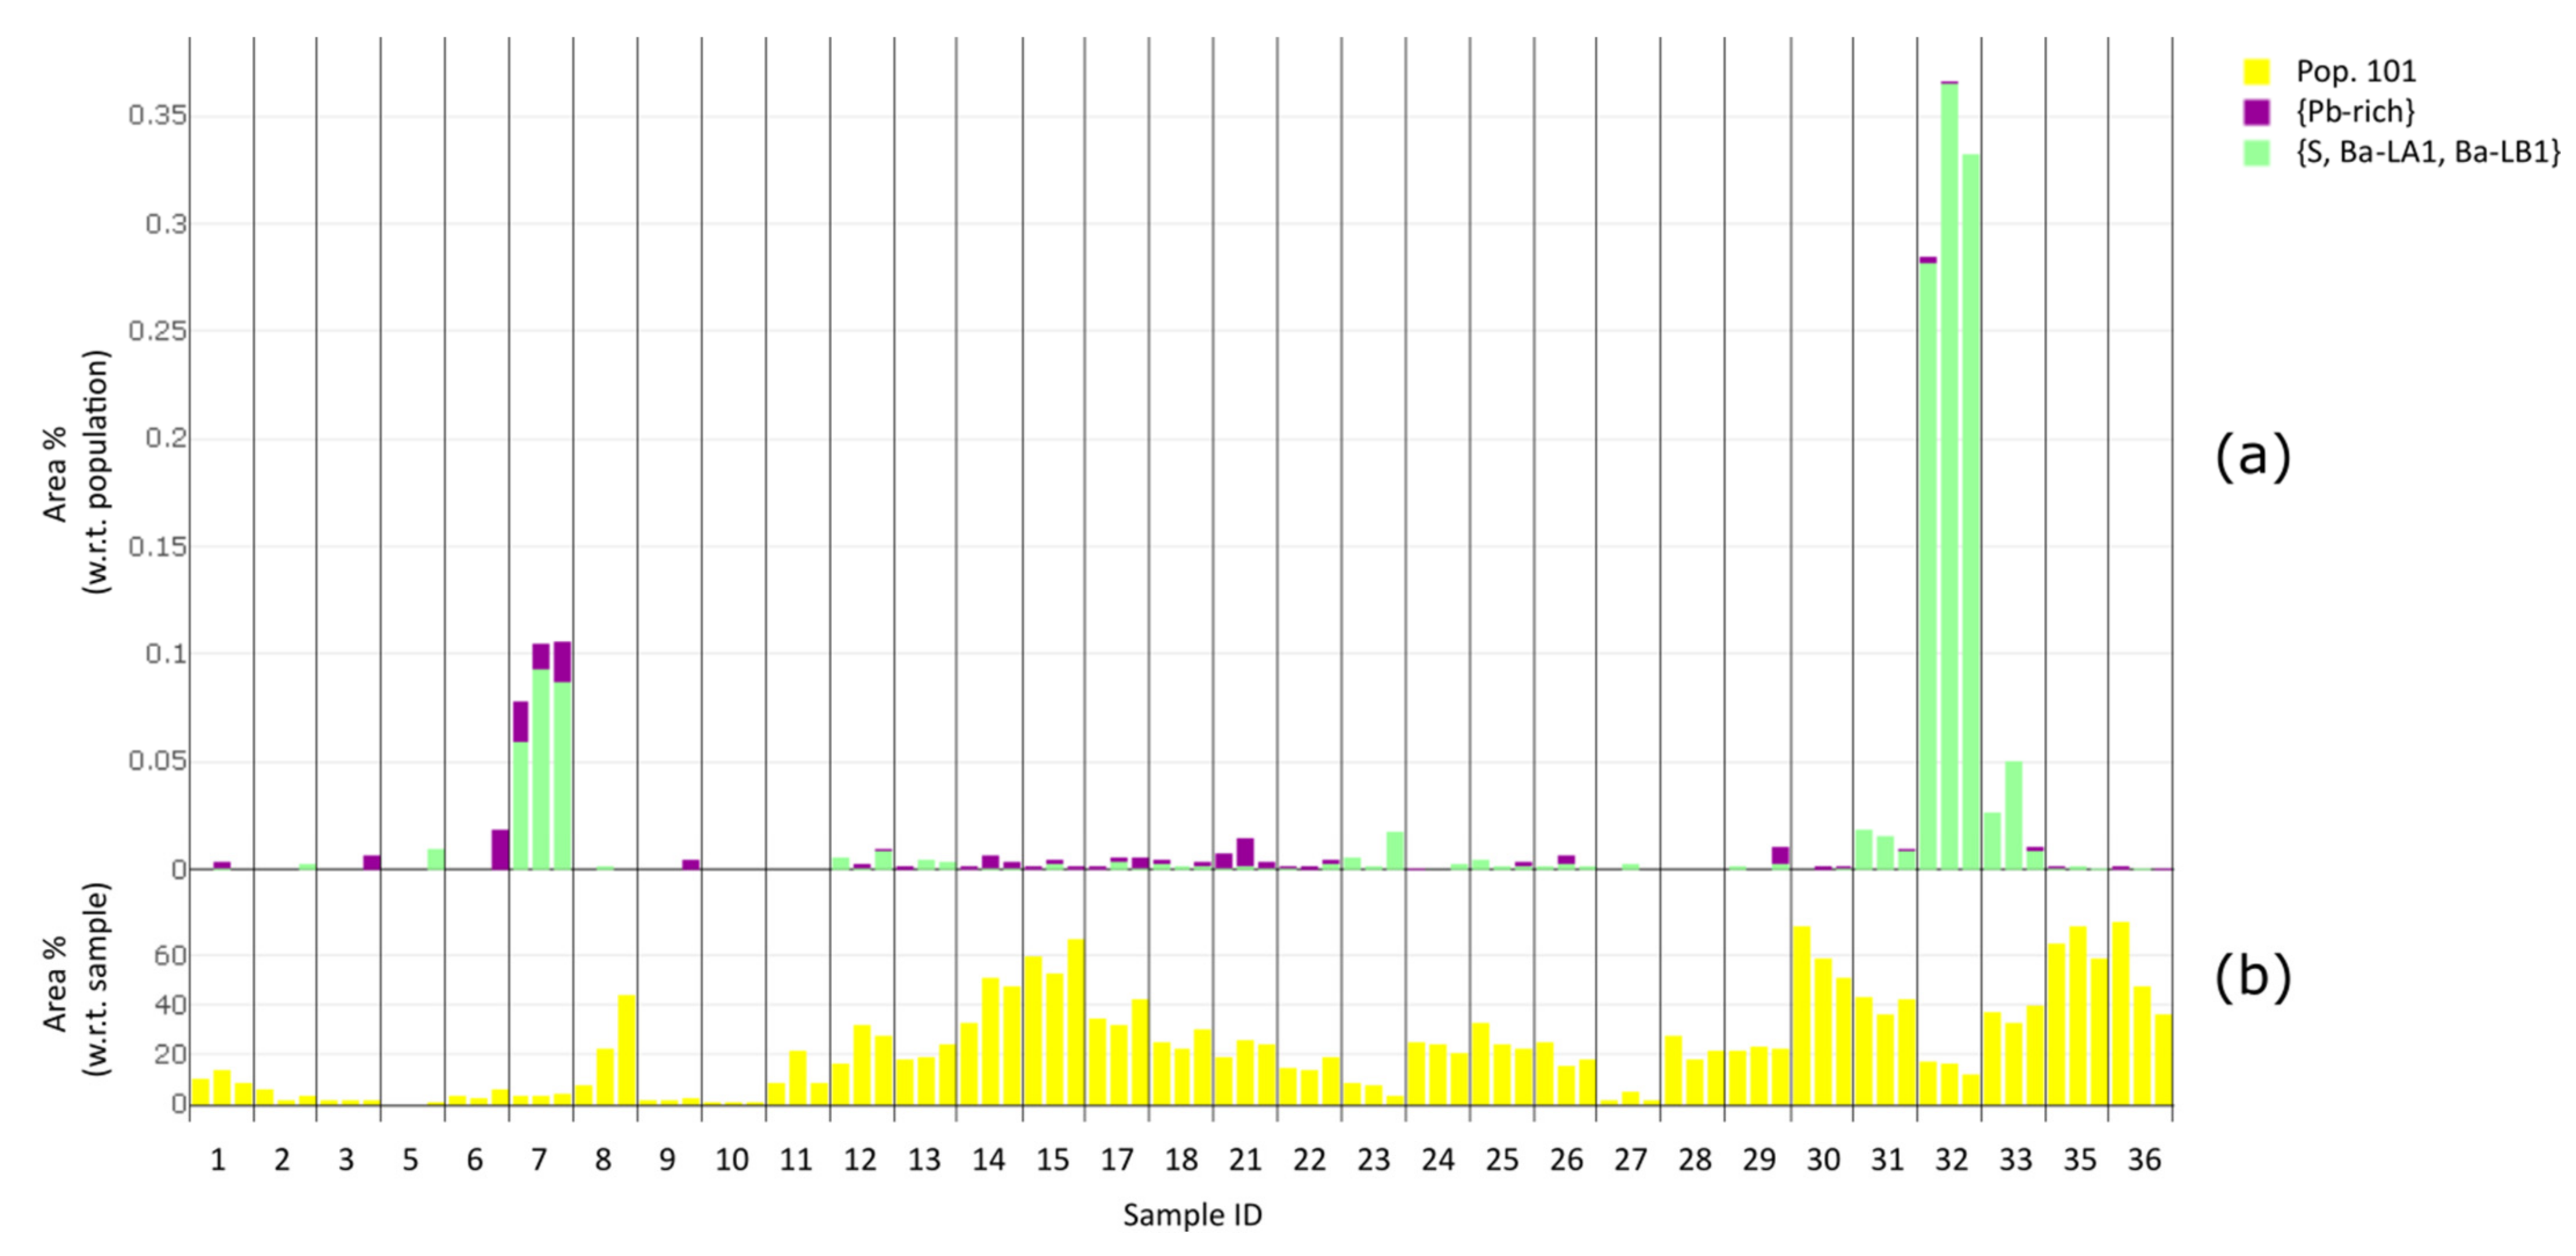
3.3.2. Distribution of Pb-Rich Pixels over Grain Populations
Overview of Grain Populations’ Pb-Rich Contributions Per Sample
Grains with ≥5 Pb-Rich Pixels
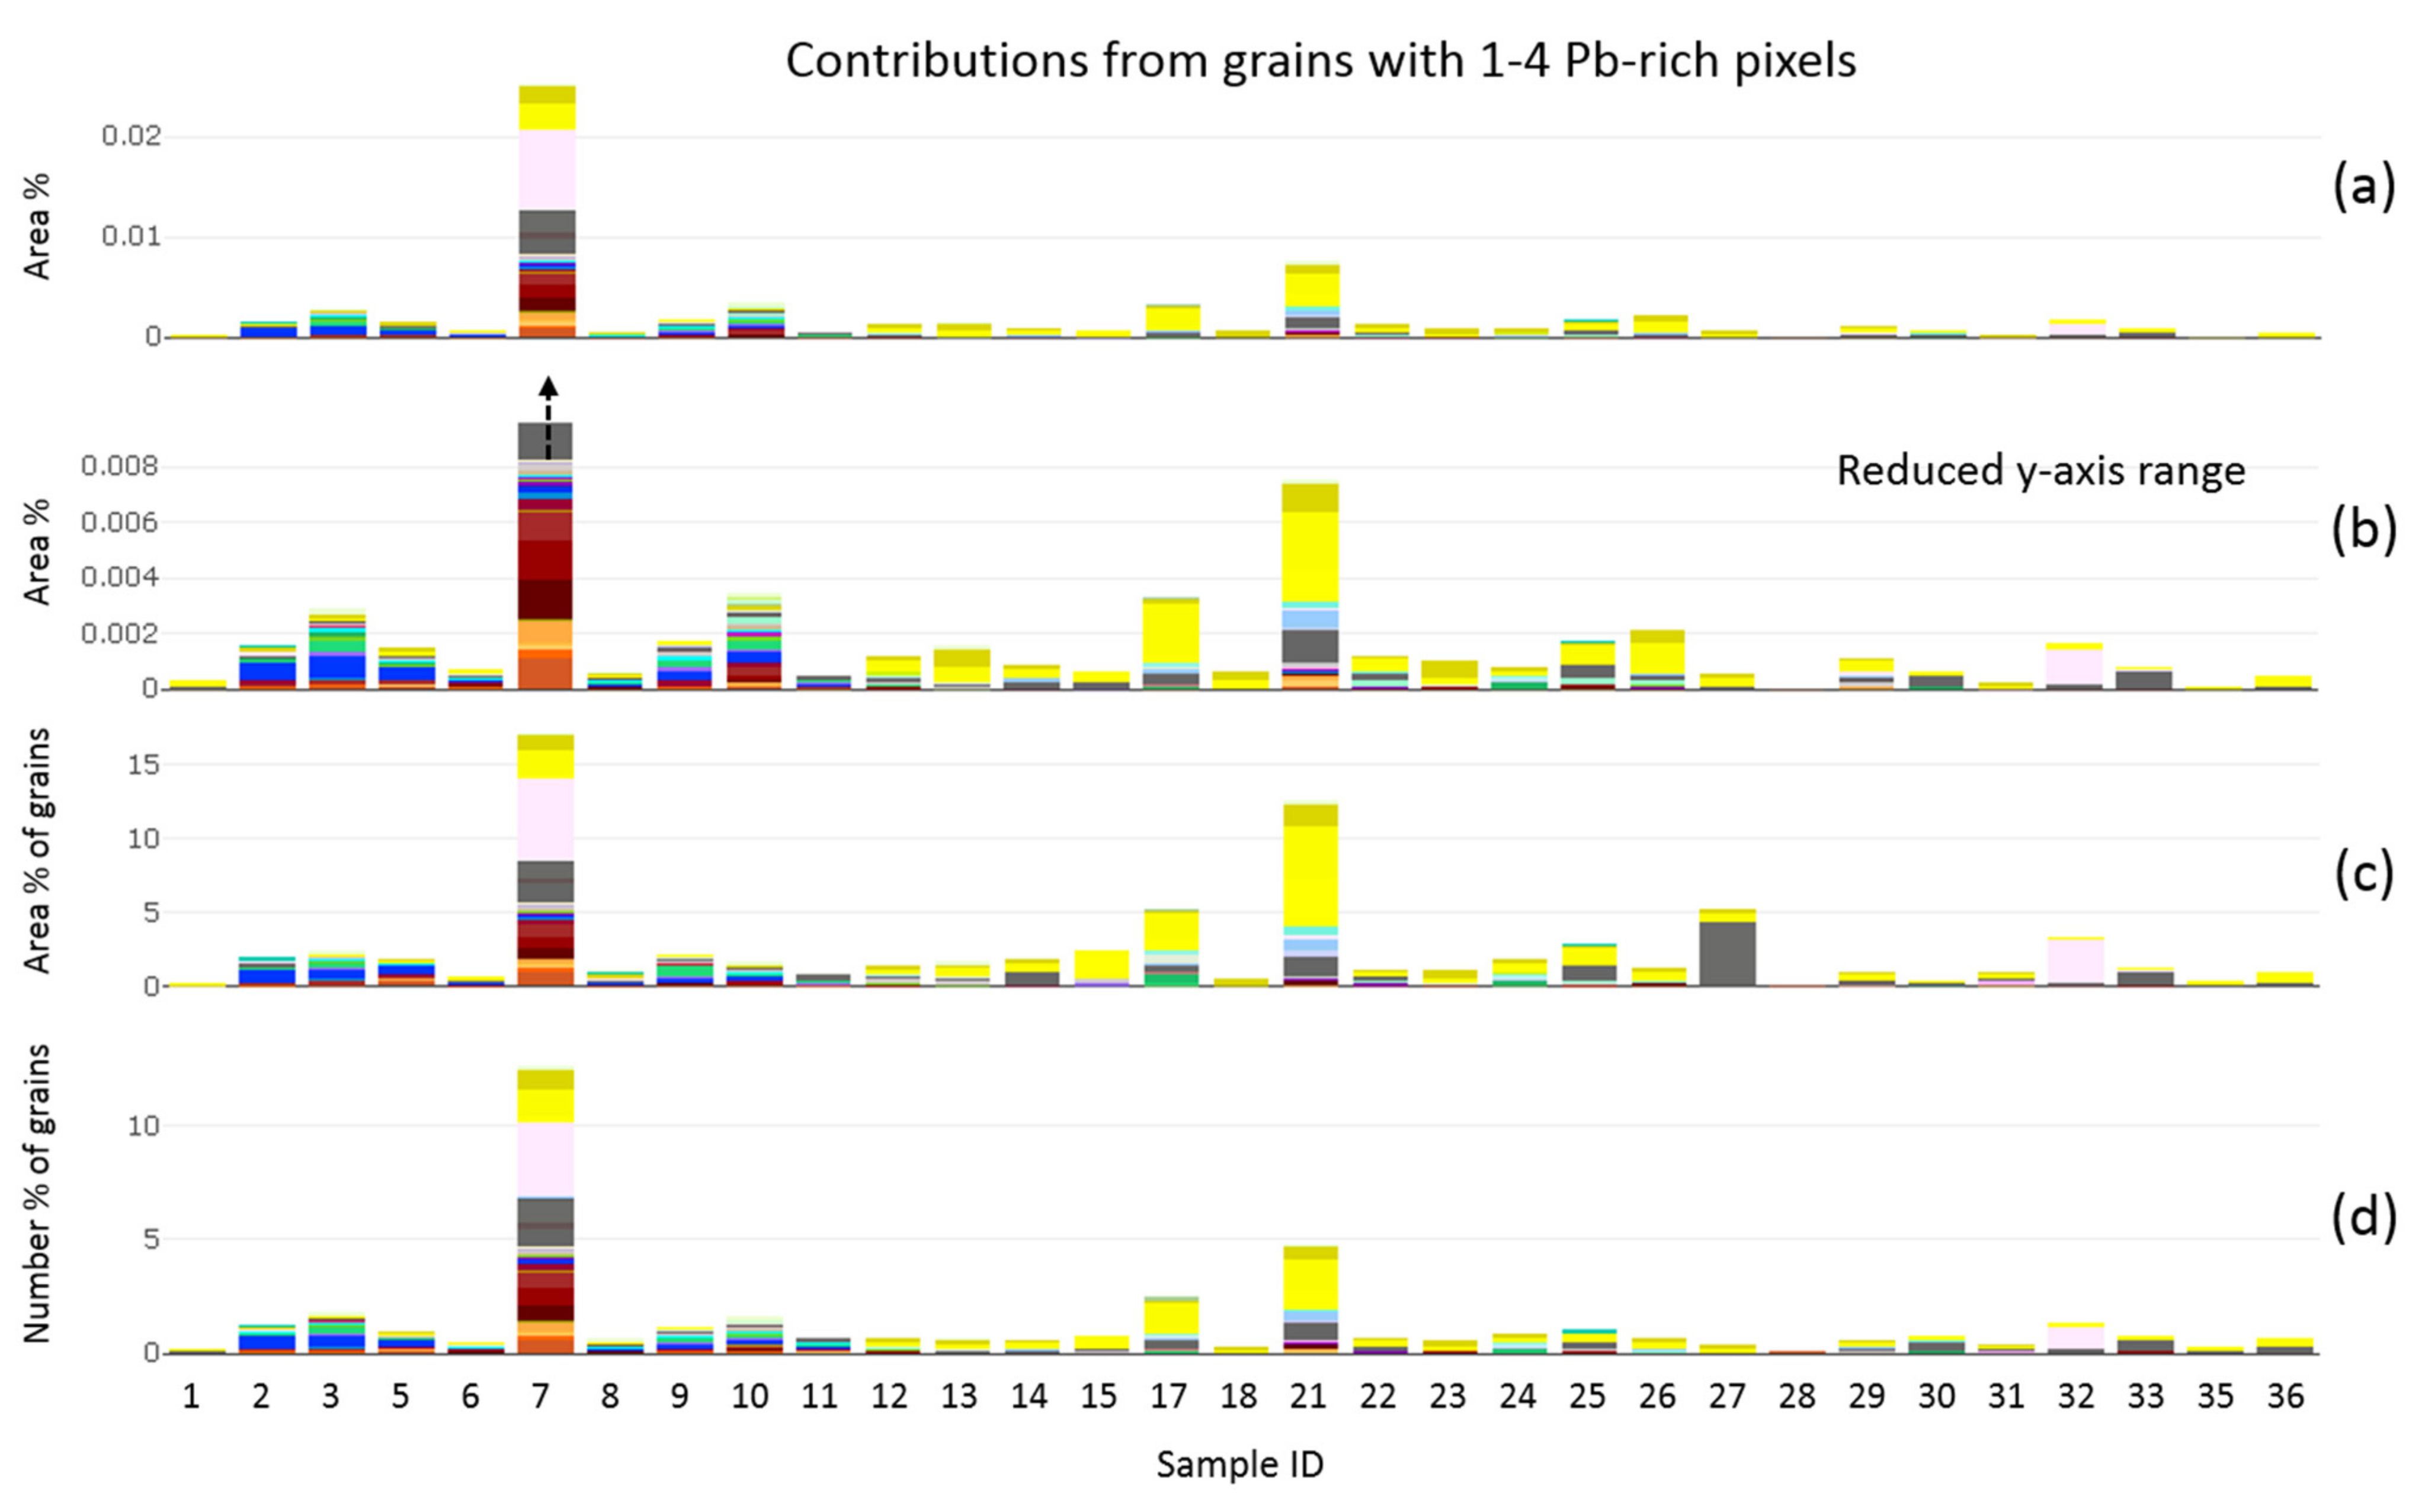
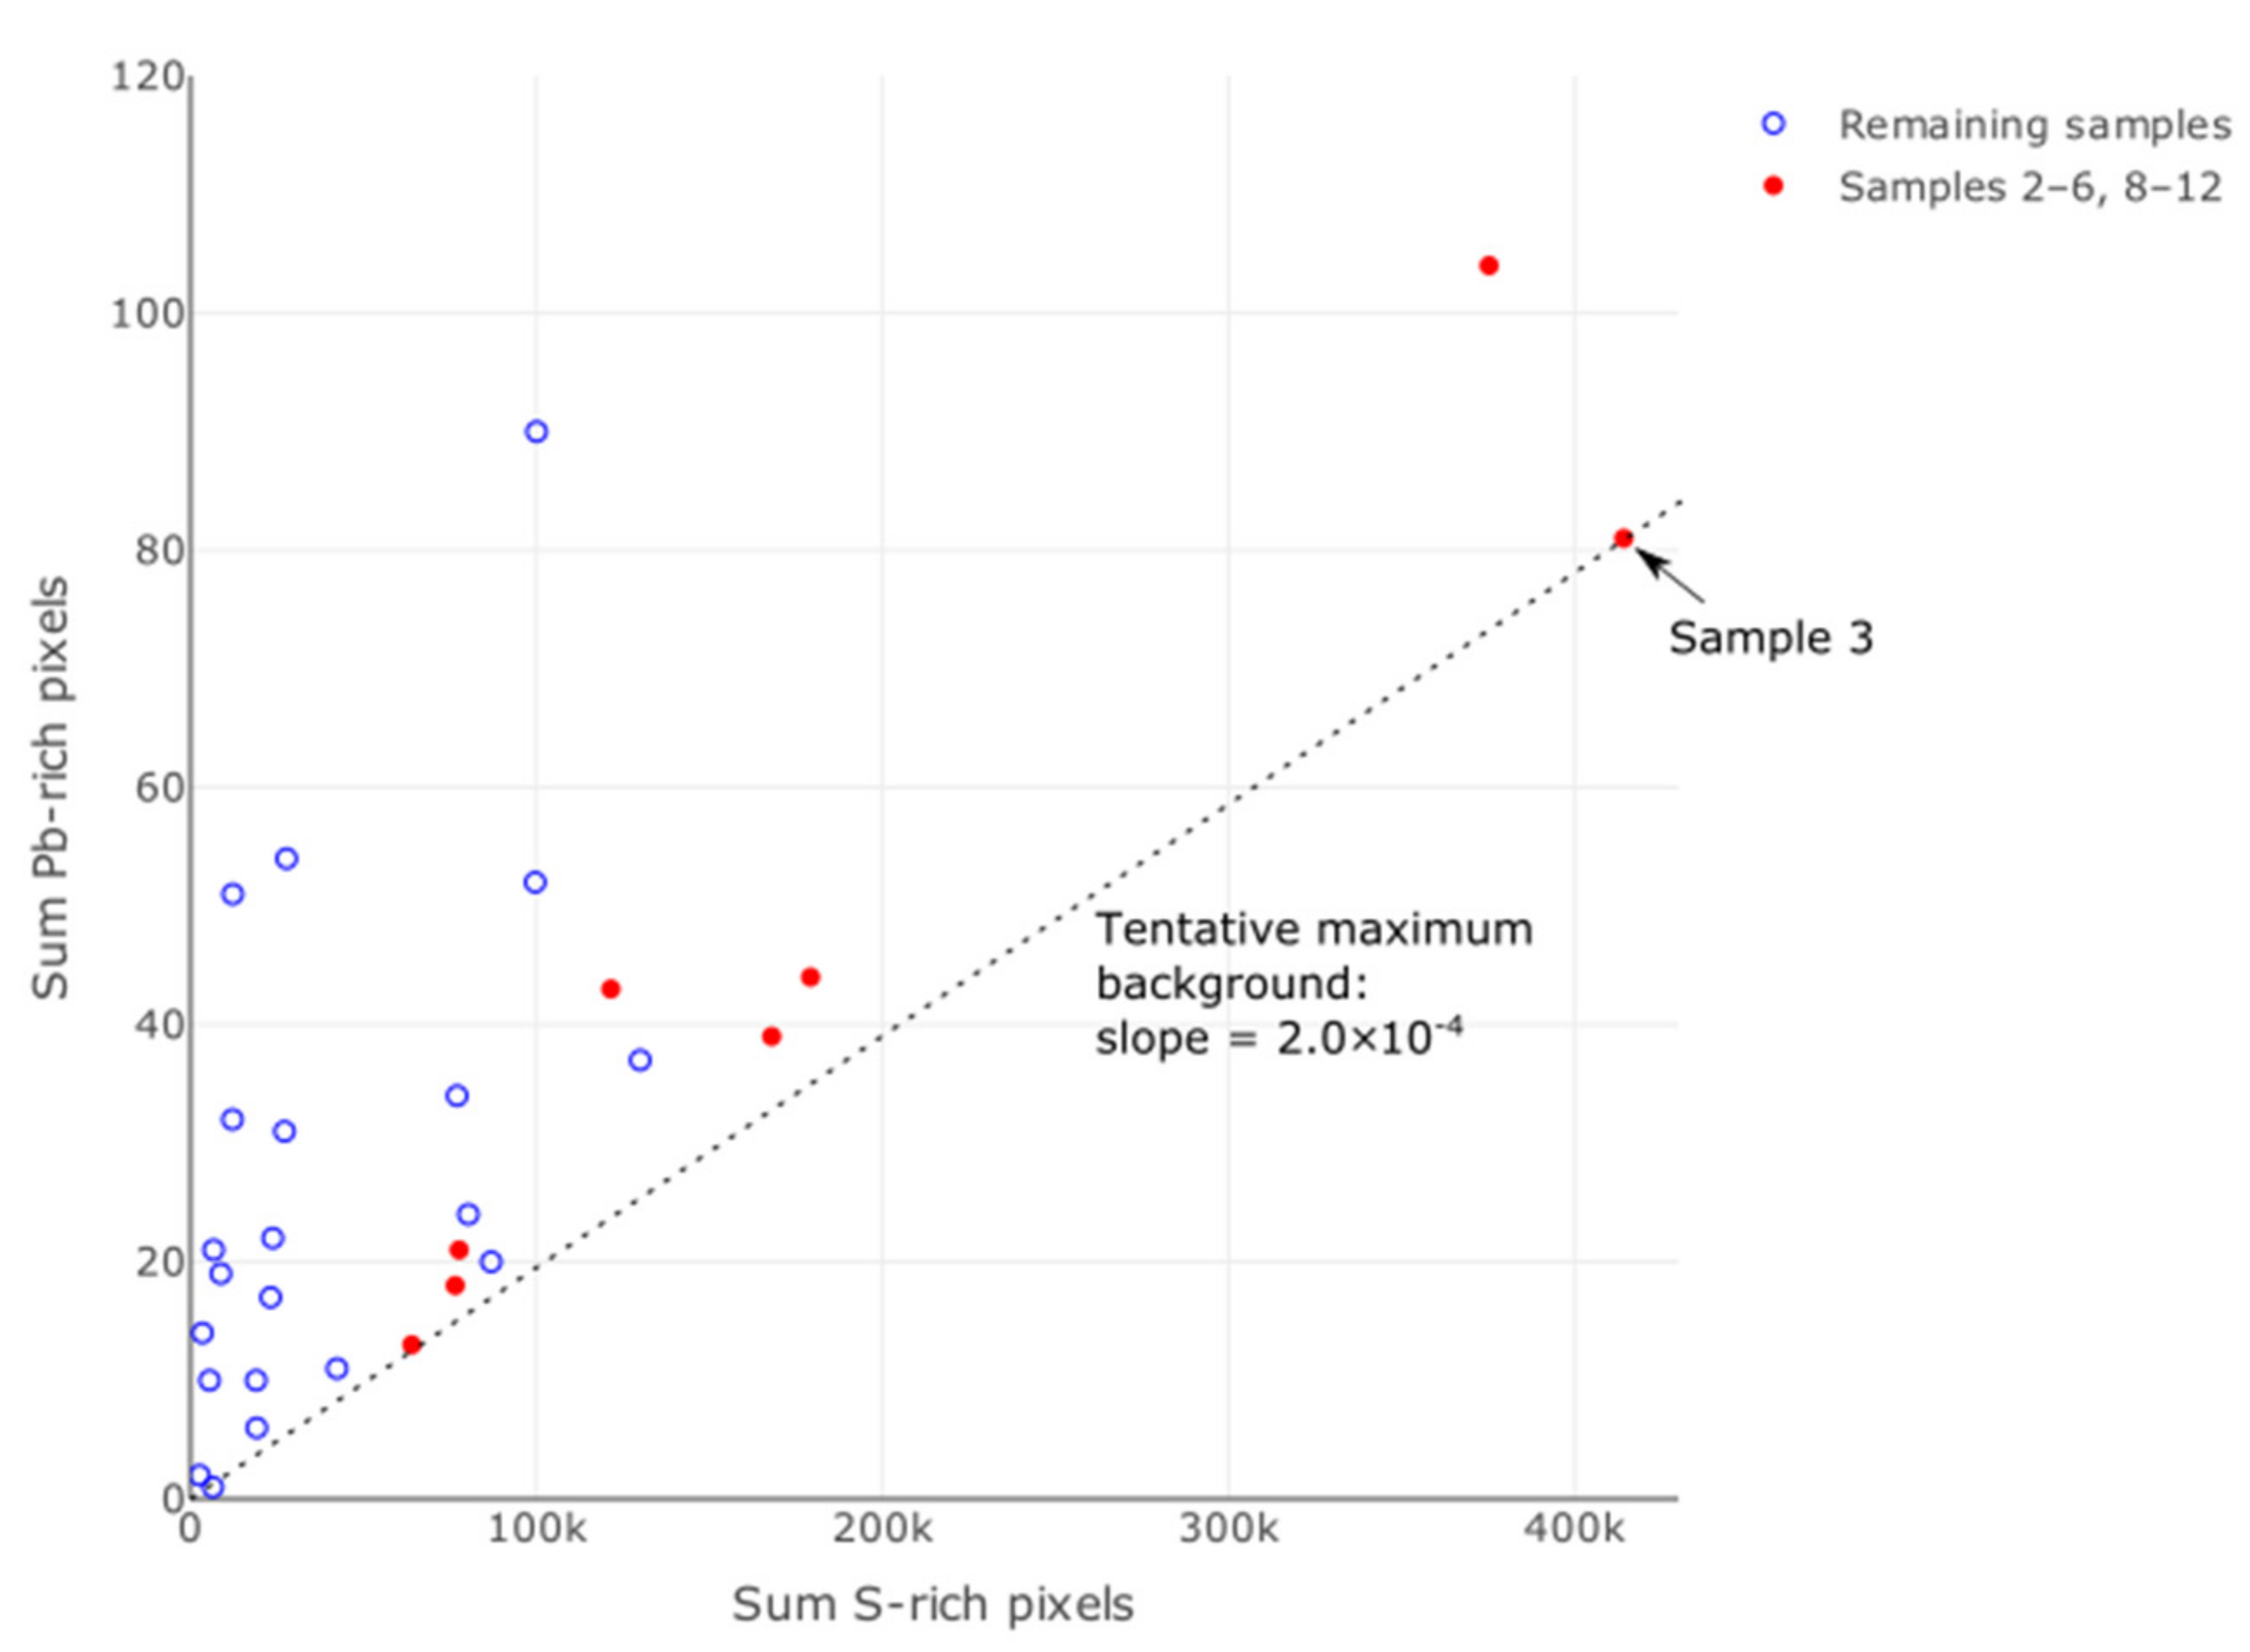
Grains with 1–4 Pb-Rich Pixels
- (1)
- A genuine geochemical association in these samples between S-rich (Pb-poor) and Pb-rich phases, resulting in a certain minimum ratio of Pb-rich pixels to S-rich pixels;
- (2)
3.3.3. Synthesis and Interpretation of Results
Overall Abundances of Detectable Pb-Rich Phases
Distribution of Pb-Rich Phases with Respect to Grains and Grain Populations
Character and Potential Provenance of the Detected Pb-Rich Phase Occurrences
4. Conclusions
Supplementary Materials
Author Contributions
Funding
Data Availability Statement
Acknowledgments
Conflicts of Interest
References
- Geraets, L.; Schulpen, S. RIVM Report: Health Risk Assessment Graphite Rains Wijk Aan Zee (in Dutch: Inschatting Gezondheidsrisico’s Grafietregen Wijk Aan Zee); RIVM: Bilthoven, The Netherlands, 2019; Available online: https://rivm.openrepository.com/handle/10029/623106 (accessed on 9 July 2021). [CrossRef]
- Aguilera, A.; Bautista, F.; Gutiérrez-Ruiz, M.; Ceniceros-Gómez, A.E.; Cejudo, R.; Goguitchaichvili, A. Heavy Metal Pollution of Street Dust in the Largest City of Mexico, Sources and Health Risk Assessment. Environ. Monit. Assess. 2021, 193, 1–16. [Google Scholar] [CrossRef]
- Tessier, A.; Campbell, P.G.C.; Bisson, M. Sequential Extraction Procedure for the Speciation of Particulate Trace Metals. Anal. Chem. 1979, 51, 844–851. [Google Scholar] [CrossRef]
- Lee, P.-K.; Choi, B.-Y.; Kang, M.-J. Assessment of Mobility and Bio-Availability of Heavy Metals in Dry Depositions of Asian Dust and Implications for Environmental Risk. Chemosphere 2015, 119, 1411–1421. [Google Scholar] [CrossRef]
- Han, Z.; Bi, X.; Li, Z.; Yang, W.; Wang, L.; Yang, H.; Li, F.; Ma, Z. Occurrence, Speciation and Bioaccessibility of Lead in Chinese Rural Household Dust and the Associated Health Risk to Children. Atmos. Environ. 2012, 46, 65–70. [Google Scholar] [CrossRef]
- Bardelli, F.; Cattaruzza, E.; Gonella, F.; Rampazzo, G.; Valotto, G. Characterization of Road Dust Collected in Traforo Del San Bernardo Highway Tunnel: Fe and Mn Speciation. Atmos. Environ. 2011, 45, 6459–6468. [Google Scholar] [CrossRef]
- Sammut, M.L.; Noack, Y.; Rose, J.; Hazemann, J.L.; Proux, O.; Depoux, M.; Ziebel, A.; Fiani, E. Speciation of Cd and Pb in Dust Emitted from Sinter Plant. Chemosphere 2010, 78, 445–450. [Google Scholar] [CrossRef]
- Jiang, M.; Nakamatsu, Y.; Jensen, K.A.; Utsunomiya, S. Multi-Scale Analysis of the Occurrence of Pb, Cr and Mn in the NIST Standards: Urban Dust (SRM 1649a) and Indoor Dust (SRM 2584). Atmos. Environ. 2014, 82, 364–374. [Google Scholar] [CrossRef]
- Xing, W.; Yang, H.; Ippolito, J.A.; Zhang, Y.; Scheckel, K.G.; Li, L. Lead Source and Bioaccessibility in Windowsill Dusts within a Pb Smelting-Affected Area. Environ. Pollut. 2020, 266, 115110. [Google Scholar] [CrossRef]
- Lee, P.K.; Yu, S.; Chang, H.J.; Cho, H.Y.; Kang, M.J.; Chae, B.G. Lead Chromate Detected as a Source of Atmospheric Pb and Cr (VI) Pollution. Sci. Rep. 2016, 6, 1–10. [Google Scholar] [CrossRef] [Green Version]
- Choël, M.; Deboudt, K.; Flament, P.; Lecornet, G.; Perdrix, E.; Sobanska, S. Fast Evolution of Tropospheric Pb- and Zn-Rich Particles in the Vicinity of a Lead Smelter. Atmos. Environ. 2006, 40, 4439–4449. [Google Scholar] [CrossRef]
- Brown, R.S.; Millette, J.R.; Mount, M.D. Application of Scanning Electron Microscopy for Pollution Particle Source Determination in Residential Dust and Soil. Scanning 1995, 17, 302–305. [Google Scholar] [CrossRef]
- Small, J.A.; van Hoek, C.J.G.; Schollbach, K.; Moosavi-Khoonsari, E.; van der Does, F.J.L.; Melzer, S.; de Jong, T.P.R.; de Bie, T.; Versfeld, R.A.; de Roo, M.; et al. A Method for Analysis of Nuisance Dust from Integrated Steel Works: Chemical and Mineralogical Characteristics of Contributing Sources. Environ. Sci. Eur. 2020, 32, 1–30. [Google Scholar] [CrossRef]
- Van Hoek, C.; Small, J.; van der Laan, S. Large-Area Phase Mapping Using PhAse Recognition and Characterization (PARC) Software. Micros. Today 2016, 24, 12–21. [Google Scholar] [CrossRef] [Green Version]
- Newbury, D.E. Mistakes Encountered during Automatic Peak Identification of Minor and Trace Constituents in Electron-Excited Energy Dispersive X-Ray Microanalysis. Scanning 2009, 31, 91–101. [Google Scholar] [CrossRef] [PubMed]
- Stanley, C.R. On the Special Application of Thompson-Howarth Error Analysis to Geochemical Variables Exhibiting a Nugget Effect. Geochem. Explor. Environ. Anal. 2006, 6, 357–368. [Google Scholar] [CrossRef]
- National Institute of Standards and Technology. NIST Certificate of Analysis; SRM 1649b; Urban Dust; U.S. Department of Commerce: Gaithersburg, MD, USA, 2016. [Google Scholar]
- National Institute of Standards and Technology. NIST Certificate of Analysis; SRM 2580; Powdered Paint (Nominal Mass Fraction of 4% Lead); U.S. Department of Commerce: Gaithersburg, MD, USA, 2020. [Google Scholar]
- National Institute of Standards and Technology. NIST Certificate of Analysis; SRM 2584; Trace Elements in Indoor Dust (Nominal Mass Fraction of 1% Lead); U.S. Department of Commerce: Gaithersburg, MD, USA, 2016. [Google Scholar]
- National Institute of Standards and Technology. NIST Certificate of Analysis; SRM 2587; Trace Elements in Soil Containing Lead from Paint (Nominal 3000 mg/kg Lead); U.S. Department of Commerce: Gaithersburg, MD, USA, 2003. [Google Scholar]
- Wijesiri, B.; Egodawatta, P.; McGree, J.; Goonetilleke, A. Understanding the Uncertainty Associated with Particle-Bound Pollutant Build-up and Wash-off: A Critical Review. Water Res. 2016, 101, 582–596. [Google Scholar] [CrossRef] [PubMed]
- Ruby, M.V.; Schoof, R.; Brattin, W.; Goldade, M.; Post, G.; Harnois, M.; Mosby, E.; Casteel, S.W.; Berti, W.; Carpenter, M.; et al. Advances in Evaluating the Oral Bioavailability of Inorganics in Soil for Use in Human Health Risk Assessment. Environ. Sci. Technol. 1999, 33, 3697–3705. [Google Scholar] [CrossRef]
- Abel, A.G. 3-Pigments for Paint. In Paint and Surface Coatings; Lambourne, R., Strivens, T.A., Eds.; Woodhead Publishing: Sawston, UK, 1999; pp. 91–165. [Google Scholar] [CrossRef]
- Zarogiannis, P.; Marquart, H. Framework Contract No ECHA/2008/2-Reference Number ECHA/2008/2/SR25: Service Request on Providing Actual Data on the European Market, Uses and Releases/Exposures for Lead Chromate; European Chemicals Agency: Helsinki, Finland, 2010; Available online: https://echa.europa.eu/documents/10162/d5d34d4d-bf57-4fd8-af61-87742f0ff5d8 (accessed on 9 July 2021).
- Pyrotechnic Chemistry. Available online: https://web.archive.org/web/20140508095954/http://www.islandgroup.com/military/pyrotechnic_chemistry.php (accessed on 9 July 2021).
- Kresse, R.; Baudis, U.; Jäger, P.; Riechers, H.; Wagner, H.; Winkler, J.; Wolf, H. Barium and Barium Compounds. In Ullmann’s Encyclopedia of Industrial Chemistry; Wiley-VCH: Weinheim, Germany, 2007. [Google Scholar] [CrossRef] [Green Version]
- National Center for Biotechnology Information; PubChem Compound Summary for CID 24414, Barium Sulfate. Available online: https://pubchem.ncbi.nlm.nih.gov/compound/Barium-sulfate (accessed on 9 July 2021).
- Phenix, A.; Soldano, A.; Van Den Berg, K.J.; Van Driel, B. “The Might of White”: Formulations of Titanium Dioxide-Based Oil Paints as Evidenced in Archives of Two Artists’ Colourmen, Mid-20th Century. Proceedings of ICOM-CC Triennial Conference 2017, Copenhagen, Denmark, 1–8 January 2017. [Google Scholar]
- Walraven, N.; Bakker, M.; Vanos, B.; Klaver, G.; Middelburg, J.J.; Davies, G. Pollution and Oral Bioaccessibility of Pb in Soils of Villages and Cities with a Long Habitation History. Int. J. Environ. Res. Public Health 2016, 13, 221. [Google Scholar] [CrossRef] [Green Version]
- Fasoyinu, F.A.; Weinberg, F. Spangle Formation in Galvanized Sheet Steel Coatings. Metall. Trans. B 1990, 21, 549–558. [Google Scholar] [CrossRef]
- Hickey, C.; Gordon, C.; Galdanes, K.; Blaustein, M.; Horton, L.; Chillrud, S.; Ross, J.; Yinon, L.; Chen, L.C.; Gordon, T. Toxicity of Particles Emitted by Fireworks. Part. Fibre Toxicol. 2020, 17, 1–11. [Google Scholar] [CrossRef]
- Baranyai, E.; Simon, E.; Braun, M.; Tóthmérész, B.; Posta, J.; Fábián, I. The Effect of a Fireworks Event on the Amount and Elemental Concentration of Deposited Dust Collected in the City of Debrecen, Hungary. Air Qual. Atmos. Health 2015, 8, 359–365. [Google Scholar] [CrossRef] [Green Version]
- Mennen, M.G.; Kliest, J.J.G.; van Bruggen, M. RIVM Report 609022 002—Vuurwerkramp Enschede: Metingen van Concentraties, Verspreiding En Depositie van Schadelijke Stoffen: Rapportage van Het Milieuonderzoek. 2001. Available online: https://rivm.openrepository.com/handle/10029/9589 (accessed on 19 April 2001).
- Mustafa, S.; Luo, L.; Zheng, B.T.; Wei, C.X.; Christophe, N. Effect of Lead and Zinc Impurities in Ironmaking and the Corresponding Removal Methods: A Review. Metals 2021, 11, 407. [Google Scholar] [CrossRef]
- Berdowski, J.; van der Most, P.; Slager, J.M.; Mulder, W.; Hlawiczka, S.; Fudala, J.; Bloos, J.P.; Verhoeve, P.; Quass, U.; Pierce, M.; et al. EMEP/EEA Air Pollutant Emission Inventory Guidebook 2016: 2.C.1. Iron and Steel Production; European Environment Agency: Copenhagen, Denmark, 2016; Volume 147. [Google Scholar]
- Rudnick, R.L.; Gao, S. Composition of the Continental Crust, 2nd ed.; Elsevier Ltd: Amsterdam, The Netherlands, 2013; Volume 4. [Google Scholar] [CrossRef]
- Provincie Noord-Holland. Handelingskader Provincie Noord-Holland Voor Diffuus Lood in de Bodem. Inhoudsopgave. 2019. Available online: https://www.google.com.hk/url?sa=t&rct=j&q=&esrc=s&source=web&cd=&ved=2ahUKEwj20o7r7NDyAhWknGoFHVvtCVsQFnoECAMQAQ&url=https%3A%2F%2Fwww.noord-holland.nl%2FOnderwerpen%2FWater_Bodem%2FBodem%2FBeleidsdocumenten%2FHandelingskader_provincie_Noord_Holland_voor_diffuus_lood_in_de_bodem.pdf&usg=AOvVaw0DyigIATvnefmh0eypMCvn (accessed on 24 September 2019).
- Reimann, C.; Fabian, K.; Birke, M.; Filzmoser, P.; Demetriades, A.; Négrel, P.; Oorts, K.; Matschullat, J.; de Caritat, P.; Albanese, S.; et al. GEMAS: Establishing Geochemical Background and Threshold for 53 Chemical Elements in European Agricultural Soil. Appl. Geochem. 2018, 88, 302–318. [Google Scholar] [CrossRef] [Green Version]
- Elshkaki, A.; Van Der Voet, E.; Van Holderbeke, M.; Timmermans, V. The Environmental and Economic Consequences of the Developments of Lead Stocks in the Dutch Economic System. Resour. Conserv. Recycl. 2004, 42, 133–154. [Google Scholar] [CrossRef]
- Elshkaki, A.; van der Voet, E.; Van Holderbeke, M.; Timmermans, V. Long-Term Consequences of Non-Intentional Flows of Substances: Modelling Non-Intentional Flows of Lead in the Dutch Economic System and Evaluating Their Environmental Consequences. Waste Manag. 2009, 29, 1916–1928. [Google Scholar] [CrossRef]
- Factsheet on Lead. Available online: https://omgeving.tatasteel.nl/assets/user/Factsheets/Factsheet_Lood.pdf (accessed on 15 July 2021). (in Dutch).


| Population # | Source Category # | Source Category | Explanation |
|---|---|---|---|
| 1–15 | 1 | Site—ore | Iron-ore and materials related to ore preparation (sintering and pelletising). General mineralogical characteristics: rich in FeOx ± Ca-ferrites ± C2S |
| 16 | 2 | Site—ore/hot metal | Particles overwhelmingly dominated by FeOx or Fe-metal (undistinguished): captures both iron-ore particles and droplets of hot metal (pig iron) |
| 17–53 | 3 | Site—slag | Diverse category of steelmaking process slags, including basic oxygen furnace (BOF) converter, steel ladle treatment and de-sulphurisation slags. General mineralogical characteristics: BOF converter slag is highly calcic material rich in C2S/C3S, C2(A,F) (brownmillerite), magnesio-wustite and oxidation product magnetite, lime/portlandite/calcite and residue after dolomite/doloma. Commonly partially encrusted with sulphate-rich atmospheric weathering products. Steel ladle slag is dominated by Ca-aluminates; de-sulphurisation slag dust by Ca-rich silicates, residue after dolomite and magnesia, and primary sulphates from the process (not weathering products). |
| 54–55 | 4 | Site—slag; + urban | Particles consistent with blast furnace slag mineralogy, noting that granulated blast furnace slag can also have an immediate urban source as cement construction material. General mineralogical characteristics: dominated by Ca-Mg-Al-silicate phases (melilite or glass) |
| 56–65 | 5 | Site—flux | Iron- and steelmaking fluxes: (residue after) burnt lime and limestone, dolomite and olivine (forsteritic) |
| 66 | 6 | Site—flux/slag; + natural | Burnt lime (flux)/limestone (diverse, including flux) /sea-shells (natural): distinguished from the above category by lack of other characteristic steelmaking phases (C2S, Ca-ferrites and FeOx) |
| 67–68 | 7 | Site—flux/slag | Probable limestone flux residue from iron-ore sintering or pelletising with traces of reaction with FeOx |
| 69 | 8 | Site—flux/ refractory | Ambiguous category: MgO ± sulphate phases, variously flux from iron- and steelmaking processes and refractory material |
| 70–72 | 9 | Site— refractory | Likeliest refractory material from steelmaking vessels. General mineralogical characteristics, variously: MgO + spinel; MgO + forsteritic olivine; alumina dominated |
| 73–75 | 10 | Site—scrap | Zinc-rich material, likely galvanised steel scrap from site (potentially also urban) |
| 76–78 | 11 | Urban + site—scrap | Fe-metal bearing particles / metallic slivers |
| 79 | 12 | Site—coal & cokes; + natural + urban | Includes coal/coke material with silicate ash phases, but also organic-rich soil containing the same natural silicate phases. Mineralogical definition: carbon-rich with qz-clay-fsp-mica or FeS or phosphates |
| 80 | 13 | Site— carbon-rich other | Carbon-rich material with steelmaking phases formed during iron-/steelmaking processes, but also captures spuriously segmented grains (mixing of steelworks-related grains with carbon-rich grains or with background) |
| 81–82 | 14 | Site— carbon-rich other; + natural + urban | 82: Material with highest carbon / organic content (>90% empty spectra) and lowest content of non-carbon phases such as ash or steelmaking phases. 81: Remaining undifferentiated carbon-rich material (after classification of 79, 80, and 82): may include graphite flakes, organic carbon-based materials and diverse sources |
| 83–87 | 15 | Urban; rarely site—slag | Particles rich in Ca-silicate (lower P/Si signal ratio) and Ca-(hydr)oxide/carbonate but free of silica: commonly cement/building material, also detected in converter slag reference materials. Ambiguous source category. |
| 88–99 | 16 | Urban | Diverse urban dust sources. For the current sample set, most significant occurring populations: 88–89: building material (cement/concrete) rich in combinations of silica-Ca-carbonate-Ca-silicates (incl. C2S), lacking key diagnostic steelmaking phases and poorer in P than steelmaking slags with otherwise overlapping mineralogy 94: particles bearing >1% Ba-sulphate. Less a coherent grain population than a flag for high level of surface contamination of other particle types with Ba-sulphate. |
| 100 | 17 | Natural salt— immediate | NaCl-dominated grains (95% of surface): most commonly other grains with complete covering of sea-salt from maritime influence (sea spray) |
| 101–103 | 18 | Natural mineral background | Grains with >60% content of natural silicates: quartz, clay, feldspar, mica |
| 104 | 19 | Natural mineral background mixed with site or urban | Grains with 30–60% of the above natural silicates, with or without the presence of typical steelmaking phases (FeOx, C2S). Population captures: composite particles comprising sub-particles with mixed origin (natural/industrial/urban); and spurious artefacts of grain segmentation (steelworks-related particles merged within the same PARC-grain outline as separate natural silicate particles) |
| 105–107 | 20 | Natural source— immediate + via site | Miscellaneous other silicate-rich particles and particles rich in apatite. Natural rock-forming minerals, encountered both in immediately naturally sourced materials and as gangue-phases in iron ores (scarce) |
| 108–110 | 21 | Unknown | Three mineralogically distinctive grain populations of uncertain provenance |
| 111 | 22 | Pb-rich various | Grains with >40% Pb-rich pixels. Captures both a) discrete particles dominated by Pb-phases (throughout their bulk) and b) particles with a large concentration of Pb-rich pixels reflecting only superficial occurrence of Pb-phases (sub-grains/layering). The sub-population (a) has been counted separately for the current sample set by extra filtering in downstream processing of the PARC results, separately from the grain population model (see Section 3.3.1) |
| 112–115 | 23 | Unassigned (w/wo partial chloride cover) | Unassigned grains, with / without partial (Na-)chloride covering. 114: otherwise unassigned grains, where these contain ≥1 Pb-rich pixel (implicitly <40%, which is the threshold for classification under population 111) |
| SRM Number | Description | Certified Mass Fraction of Pb (mg/kg) |
|---|---|---|
| 1649b [17] | Urban dust | 12,864 ± 62 |
| 2580 [18] | Powdered Paint (Nominal Mass Fraction of 4% Pb) | 43,400 ± 100 |
| 2584 [19] | Trace elements in indoor dust (nominal mass fraction of 1% Pb) | 9761 ± 67 |
| 2587 [20] | Trace elements in soil containing Pb from paint (nominal mass fraction of 3000 mg/kg Pb) | 3242 ± 57 |
| SRM Number | 1 | 2 | 3 | Mean | σ | Relative σ (%) | Certified Pb Mass Fraction | |
|---|---|---|---|---|---|---|---|---|
| Area % | mg/kg | wt % | ||||||
| 2580 | 7.04 | 7.06 | 7.20 | 7.10 | 0.09 | 1.29 | 43,400 | 4.34 |
| 1649b | 2.18 | 2.26 | 2.20 | 2.21 | 0.04 | 1.91 | 12,864 | 1.29 |
| 2584 | 1.20 | 1.41 | 1.38 | 1.33 | 0.11 | 8.43 | 9761 | 0.98 |
| 2587 | 0.35 | 0.16 | 0.15 | 0.22 | 0.12 | 52.61 | 3242 | 0.32 |
| Pb-Rich Occurrence Category | Number of Grains | % of All Pb-Hosting Grains | % of All Pb-Hosting Grains by Area | % of Total Pb-Rich Pixels |
|---|---|---|---|---|
| Pb-rich dominated grains | 6 | 0.40 | 0.07 | 12.32 |
| ≥160 pixels | 10 | 0.66 | 1.34 | 45.05 |
| 80–159 pixels | 3 | 0.20 | 0.17 | 3.71 |
| 40–79 pixels | 11 | 0.72 | 0.78 | 6.68 |
| 20–39 pixels | 14 | 0.92 | 0.94 | 4.35 |
| 10–19 pixels | 27 | 1.78 | 4.40 | 3.81 |
| 5–9 pixels | 51 | 3.36 | 4.37 | 3.57 |
| 1–4 pixels | 1398 | 91.91 | 87.93 | 20.51 |
Publisher’s Note: MDPI stays neutral with regard to jurisdictional claims in published maps and institutional affiliations. |
© 2021 by the authors. Licensee MDPI, Basel, Switzerland. This article is an open access article distributed under the terms and conditions of the Creative Commons Attribution (CC BY) license (https://creativecommons.org/licenses/by/4.0/).
Share and Cite
Small, J.; van Hoek, C.; van der Does, F.; Seinen, A.-B.; Melzer, S.; Tromp, P.; van der Laan, S. Screening Coarse Airborne Dust for Lead-Rich Phase Occurrence during Characterisation of Particle Mineralogy, Chemistry and Provenance: Application to Deposits in the Vicinity of an Integrated Steelworks. Minerals 2021, 11, 929. https://doi.org/10.3390/min11090929
Small J, van Hoek C, van der Does F, Seinen A-B, Melzer S, Tromp P, van der Laan S. Screening Coarse Airborne Dust for Lead-Rich Phase Occurrence during Characterisation of Particle Mineralogy, Chemistry and Provenance: Application to Deposits in the Vicinity of an Integrated Steelworks. Minerals. 2021; 11(9):929. https://doi.org/10.3390/min11090929
Chicago/Turabian StyleSmall, James, Corrie van Hoek, Frank van der Does, Anne-Bart Seinen, Stefan Melzer, Peter Tromp, and Sieger van der Laan. 2021. "Screening Coarse Airborne Dust for Lead-Rich Phase Occurrence during Characterisation of Particle Mineralogy, Chemistry and Provenance: Application to Deposits in the Vicinity of an Integrated Steelworks" Minerals 11, no. 9: 929. https://doi.org/10.3390/min11090929
APA StyleSmall, J., van Hoek, C., van der Does, F., Seinen, A.-B., Melzer, S., Tromp, P., & van der Laan, S. (2021). Screening Coarse Airborne Dust for Lead-Rich Phase Occurrence during Characterisation of Particle Mineralogy, Chemistry and Provenance: Application to Deposits in the Vicinity of an Integrated Steelworks. Minerals, 11(9), 929. https://doi.org/10.3390/min11090929