Abstract
In this study, the sequential extraction method was applied to extract selected potentially toxic elements (PTEs) (Cd, Cr, Cu, Fe, Ni, Pb and Zn) in river sediments collected from the Blood River situated in Seshego area, Limpopo Province, South Africa. The study aimed to assess a possible trend of mobilisation of these elements from sediment to water. The accuracy of the sequential extraction method was confirmed by analysing sediment-certified reference material, and quantitative percentage recoveries ranging from 86 to 119%, 81 to 111% and 77 to 119% were achieved for exchangeable, reducible and oxidisable fractions, respectively. The potential risk of the PTEs in sediments was evaluated. The calculated values of contamination factor (CF) as well as risk assessment code (RAC) for Cd, Cu, Ni and Pb revealed the mobility of these elements. The PTEs in river sediments are at a high toxicity-risk level and could therefore cause a threat to organisms dwelling in sediments and humans via consumption of crops irrigated with the polluted river water.
1. Introduction
Potentially toxic elements (PTEs) are known to be adsorbed directly to the sediments of the water system. However, some of these elements may not be permanently bound by the sediments. The changes in environmental conditions, namely acidification, the redox potential or concentrations of organic ligand can initiate leaching of PTEs from sediment to overlying water, which adversely affects the aquatic environment [1]. The sediments are a sink of pollutants, including PTEs that make sediments as key components of water-quality studies [2]. The risks associated with sediments contaminated by PTEs strongly relate to their specific chemical fractions and binding states. Furthermore, factors such as the sediments’ nature, grain size, and properties of adsorbed particles as well as of the element could influence the mobility of PTEs in sediments [3]. The measurement of total elemental concentrations cannot give sufficient information regarding the mobility, bioavailability and toxicity of the PTEs. These properties depend on the chemical forms of the element in the different parts of the sample [4]. Therefore, fractionation of PTEs in sediments by sequential extraction is helpful to understand their source, mode of occurrence, mobility and bioavailability [5].
Sequential extraction methods have been widely used to extract PTEs in solid samples such as soil, sediment, sludge and solid wastes based on their leachability [6,7,8,9,10]. Sequential extraction provides information that helps in identifying the major sites of binding as well as the phase associations of PTEs in river sediment. This could assist us in understanding the processes that govern mobilisation of PTEs and potential risks associated with their mobilisation [1].
In South Africa, rivers, artificial lakes and groundwater are under rising stress due to ongoing pollution caused by industrialisation, urbanisation, mining and agriculture activities as well as electricity generation using coal [11]. Although mining is a substantial contributor to the pollution of water bodies in South Africa [12], contamination from other sources cannot be ruled out. The pollution of the Umtata River in South Africa by PTEs from different sources was reported [13]. These sources include agricultural runoff in the catchment together with contributions from natural and point sources. The coal mine in Lephalale releases dust containing PTEs that could deposit in the Mokolo River as pollutants [14]. This study focused on the Blood River in Seshego, South Africa, which is heavily contaminated by municipal and domestic wastes. Furthermore, runoff from urban areas and wastewater arising from human activities in residential and commercial establishments could be the potential source of PTEs in the Blood River. The aim of this study was to sequentially extract and quantify the levels of selected PTEs (Cd, Cr, Cu, Fe, Ni, Pb and Zn) in river sediments obtained from the Blood River in Limpopo Province, South Africa. Moreover, the contamination factor (CF) and risk assessment code (RAC) were calculated to evaluate the associated risks to the aquatic ecosystem.
2. Materials and Methods
2.1. The Justification of Study Area Selection
The Blood River is located in the Seshego area about 14.5 km away from Polokwane, the capital city of Limpopo Province. The river originates in the west of the Polokwane municipal area. The municipal and domestic wastes, presence of illegal dumping sites close to the river banks, lack of waste removal services and absence of storm water drainage among others contribute to the contamination of the Blood River [15]. During the sampling period, dumping sites near different parts of the Blood River, sand mining activities and direct discharge of effluents into the river were observed and as results, sewage effluents can introduce other chemicals and PTEs into the water system. Therefore, the aforementioned wastes and anthropogenic activities could possibly elevate the levels of PTEs in the Blood River. Sampling sites in the Blood River are shown in Figure 1.
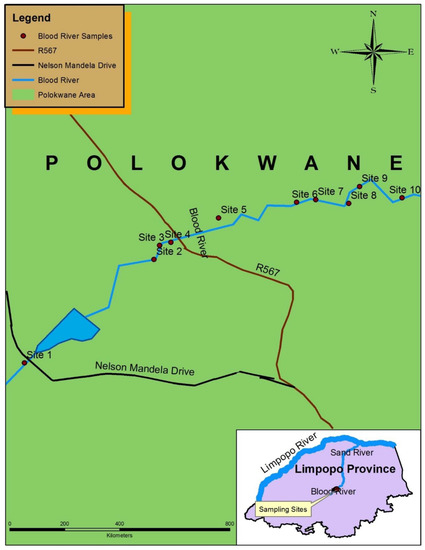
Figure 1.
Map of the Blood River showing 10 sampling sites.
2.2. Reagents, Standard Reference Materials and Standards
Ultrapure deionised water of 18.2 MΩ.cm resistivity, acquired from Milli-Q water purification system (Shanghai Carrex Analytic Instrument Co., Ltd., Shanghai, China) was used for rinsing·glassware and diluting solutions. Reagents of 65% HNO3, 35% H2O2 and 37% HCl purchased from Merck (Darmstadt, Germany) were used for mineralisation of river sediments.
A 1000 mg L−1 standard solution (Sigma-Aldrich® Chemie GmbH, Buchs, Switzerland) was used for preparation of calibration standards. Certified reference materials SRM 8704 Buffalo River sediments and CRM 280R Lake sediments NIST (Gaithersburg, MD, USA) were used to evaluate the accuracy of the method utilised for quantification of pseudo-total concentrations of PTEs in river sediments. A BCR-701 certified reference material of sediment obtained from NIST (Gaithersburg, MD, USA) was used for the validation of the sequential extraction procedure.
Glacial acetic acid (ACS reagent ≥ 99.7%), hydroxylamine hydrochloride (99.999% trace metal basis), hydrogen peroxide (PedrogenTM 30% w/w) and ammonium acetate (Fluka TraceSELECT® ≥ 99.9995 metals basis) purchased from Sigma-Aldrich® (Chemie GmbH, Steinheim, Germany) were used for sequential extraction of PTEs in river sediments. Reagents used during the sequential extraction method were prepared following the protocol by the Community Bureau of Reference (BCR) described elsewhere [16].
2.3. Apparatus and Instrumentation
A mechanical shaker, a centrifuge and an ultrasonic bath purchased from Lenton Furnaces & Scientific Co. (Johannesburg, South Africa) were used to agitate the sediment samples in the centrifuge tubes for extraction of PTEs, for centrifugation of extracts and for agitating the sediment samples along with the supernatant liquid before transferring the liquid to a vial, respectively. A microwave digestion system (CEM Corporation MARS 5, Matthews, NC, USA) was used for mineralisation of the PTEs in river sediments. The measurement of total concentrations of PTEs in river sediments was done by inductively coupled plasma-mass spectrometry (ICP-MS) purchased from PerkinElmer (Elan 6100, Regensburg, Germany). The sequentially extracted PTEs were quantified using inductively coupled plasma-atomic emission spectrometry (ICP-AES) purchased from Shimadzu (ICPE-9000, Columbia, MD, USA). Total concentration of iron in sediment samples was quantified using flame-atomic absorption spectrometry (F-AAS) purchased from PerkinElmer (PinAAcle 500, Syngistix, Singapore).
2.4. Sample Collection and Preservation
Sediment samples were obtained from about a depth of 20 cm from the surface of the sediment at 10 sampling points along the Blood River. A convenience sampling method was followed based on the accessibility of the sampling point. From each sampling point, about 500 g of sample was collected and placed in polyethylene bottles. The sediment samples from each sampling site were air-dried at room temperature. An agate mortar and pestle were used to grind the dried river sediments. The ground samples were sieved using a 100 µm sieve mesh and kept in polyethylene bottles until extraction and mineralisation of PTEs.
2.5. Sample Preparation
2.5.1. Microwave-Assisted Acid Digestion (Method A)
The fine powdered sediment samples of 0.250 g were mineralised using a microwave-assisted acid digestion system for total elemental determination by ICP-MS. A mixture of reagents containing 2 mL HNO3, 2 mL H2O2 and 2 mL HCl yielded complete digestion of sediment samples. The microwave-based digestion conditions included temperature control with maximum temperature of 150 °C, 20 min ramp, 20 min hold, 800 psi pressure and 1600 W power.
2.5.2. A Sequential Extraction Procedure (Method B)
The BCR sequential extraction procedure reported by Castillo et al. [17] was adopted in this study with slight changes. This method entails three extraction stages and is described as follows. During stage 1 of the BCR protocol, 1.0 g of powdered and sieved sediment sample was weighed into a pre-cleaned 50 mL centrifuge tube. A 40 mL of 0.11 mol·L−1 acetic acid was transferred into the centrifuge tube, and the content was shaken for 16 h using the mechanical shaker. The separation of extraction solution from the residue was done by centrifugation at 3000 rpm for 15 min and followed by decantation of the supernatant liquid. This was followed by washing the residue with 4 mL acetic acid (0.11 mol·L−1) and shaking for 15 min at 3000 rpm in the centrifuge. Further washing was performed, and the latter was then removed with a pipette and combined with the extracted fraction. The mixture was finally transferred into a 50 mL centrifuge tube topped to the mark with deionised water and kept in a refrigerator at 4 °C till analysis. The residue was used to proceed with stage 2 of the procedure.
In stage 2, 40 mL hydroxylamine hydrochloride of 0.50 mol·L−1 was added to the residue from stage 1 and shaken for 16 h in a mechanical shaker. Washing was carried out as in stage 1, and the extracted fraction was stored in a refrigerator until analysis while the residue was used in stage 3 for further extraction.
In stage 3, the residue from stage 2 was mixed with 10 mL hydrogen peroxide of 8.8 mol·L−1, and the centrifuge tube was covered and left to react for 1 h at room temperature. Further extraction was done for 1 h at 80 °C in an ultrasonic bath, and the volume was reduced by additional heating of the solution. A 10 mL aliquot of 8.8 mol·L−1 hydrogen peroxide was added and was heated to 80 °C for 1 h while the vial was covered. After removing the cover, the volume was reduced to a further ≈ 2–3 mL by heating. About 40 mL ammonium acetate of 1.0 mol·L−1 was mixed with the cool residue and the PTEs were extracted following stage 1 procedure. A change in the pH of solutions from 2 to 1.5 was implemented after low percent recoveries were observed in the second and third stages of sequential extraction.
An additional fourth stage was added in which the residue was mineralised following the procedure described in method A. The solution was topped to 50 mL with deionised water and stored in a refrigerator until analysis. A flow diagram of the BCR sequential extraction method is shown in Figure 2.
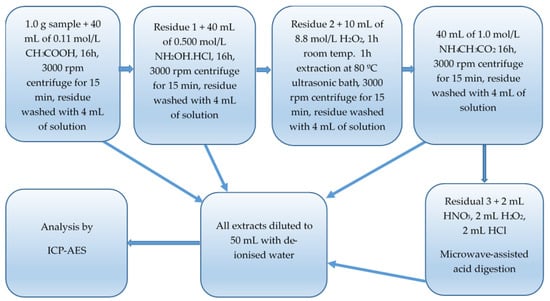
Figure 2.
Flow diagram of BCR sequential extraction method.
2.6. Sample Analysis
Sample analyses were conducted using ICP-MS for measurement of total concentrations of PTEs in sediments, ICP-AES for quantification of sequentially extracted PTEs and F-AAS for determination of total concentration of iron in river sediments. The instrumental conditions are summarised in Table 1.

Table 1.
Operating conditions of ICP-MS, ICP-AES and F-AAS.
2.7. Determination of Limit of Detection and Limit of Quantification
The limit of detection (LOD) and limit of quantification (LOQ) values were determined using six blanks, which were prepared following the same procedures of the analytical methods. The values of LOD and LOQ for each analyte were computed based on three and ten times the standard deviation of the six blank measurements, respectively [14].
2.8. Analytical Data Quality Assurance/Quality Control
Standard reference materials (SRM 8704 Buffalo River sediments and BCR 280R Lake sediments) were used to check the accuracy of PTE concentrations in the river sediments. The BCR-701 certified reference material was used to confirm the accuracy of the method applied for determination of PTEs in sequentially extracted solutions.
2.9. Statistical Analysis
The analytical data were evaluated through a t-test using SPSS software to examine the statistical significance of the differences in the mean concentrations of Cd, Cr, Cu, Ni, Pb, Zn and Fe, determined in river sediments by method A and method B. Comparison of the means obtained by two methods was done at a 5% level of significance.
3. Results and Discussion
3.1. Performance of the Analytical Method
The calculated LOD and LOQ values are presented in Table 2. In this study, the LODs and LOQs for determination of pseudo-total concentrations of PTEs by ICP-MS ranged from 0.030 to 1.77 ng·g−1 and from 0.10 to 5.90 ng·g−1, respectively. Iron in sediment samples was quantified by F-AAS, and its LOD and LOQ values were 0.049 mg·kg−1 and 0.16 mg·kg−1, respectively.
Table 2.
Limits of detection and limits of quantification obtained for determination of PTEs in digested sediments by ICP-MS and limit of detection for the sequential extraction procedure obtained by ICP-AES.
Following the same procedure, with slight variation in the volume of the reagents, Melaku et al. [18] reported LOD values of 0.83, 0.59, 0.08, 0.67, 0.64, 0.03 and 0.15 ng·g−1 for Cr, Fe, Ni, Cu, Zn, Cd and Pb, respectively. These LOD values were comparable with the LODs, in this study, for Cu, Cd and Pb. The LODs were adequate for quantification of PTEs in the analysed sediment samples.
The LODs for the BCR sequential extraction procedure were determined by ICP-AES and presented in Table 2. For the BCR sequential extraction procedure, the LODs for the exchangeable (stage 1), reducible (stage 2), oxidisable (stage 3) and residual (stage 4) ranged from 0.008 to 0.276, 0.004 to 0.169, 0.0064 to 0.503 and 0.003 to 0.125 mg·kg−1, respectively. The LODs reported by Ciceri et al. [19] were 0.066, 0.23, 0.018, 0.41, 0.026 and 0.0059 mg·kg−1 in the first stage; 0.16, 0.18, 0.016, 0.11, 0.0069 and 0.0010 mg·kg−1 in the second stage; and lastly 0.50, 0.14, 0.023, 0.76, 0.0076 and 0.043 mg·kg−1 in the third stage for Cr, Ni, Cu, Zn, Cd and Pb, respectively. These values were found to be higher than the LODs obtained in this study. The low LOD values show that trace levels of these analytes could be measured with confidence.
Two certified reference materials of sediments (SRM 8704 and BCR 280R) were used for checking the accuracy of the method applied for determination of pseudo-total concentrations in the river sediments. The use of two different certified reference materials for the same method of digestion was based on the non-availability of the certified values for some of the analytes in the certified reference material. The certified concentrations available on the SRM 8704 certificate of analysis are for Cd, Cr, Fe, Ni, Pb and Zn, while the available certified values on the BCR 280R certificate of analysis are for Cd, Cu, Cr, Ni and Zn. For this reason, both certified reference materials were analysed by ICP-MS and F-AAS, and the measured concentrations along with the certified values are shown in Table 3. The measured concentrations were in good harmony with the certified concentrations, indicating the accuracy of the method for quantification of PTEs in sediment samples.
Table 3.
Analysis of certified reference materials of sediments (BCR 280R and SRM 8704).
The percentage recoveries for the analytes ranged from 88 to 116%, which showed reliability of the applied method, except for Pb. Comparing the measured values with the certified values for the two certified reference materials, quantitative and comparable percentage recoveries were obtained for most analytes. Although low percentage recovery of 88% was observed for Cr, it was still within the acceptable range of 75 to 125% as established by United States Environmental Protection Agency (U.S. EPA) [20].
The evaluation of sequential extraction procedure was carried out by comparing the measured and certified values for the BCR 701 certified reference material. The percentage recoveries obtained by the analysis of the BCR 701 using ICP-AES are presented in Table 4. The BCR sequential extraction protocol yielded the percentage recoveries of 86 to 119%, 81 to 111% and 77 to 119% for exchangeable fraction (F1), reducible fraction (F2) and oxidisable fraction (F3), respectively. These percentage recoveries of analytes were within the acceptable ranges for all three stages [20].
Table 4.
Concentrations and percentage recoveries of PTEs in BCR 701 certified reference material obtained by ICP-AES.
The sequential extraction methods were further validated by comparing the sum of concentrations of PTEs extracted by four stages in sequential extraction procedure including the residual fraction (F4) with the results of the pseudo-total concentrations of PTEs [9,21]. The percentage recovery of the sequential extraction method compared to the pseudo-total concentrations was calculated as follows:
where F1, F2, F3 and F4 stand for the first, second, third and residual fractions, respectively. The results obtained using sequential extraction procedure showed good harmony with the pseudo-total concentrations. For example, for sample 1 the calculated percentage recoveries ranged from 77 to 104% for sequential extraction protocol.
3.2. Fractionation of Potentially Toxic Elements in River Sediments
In this work, sequential extraction was used to evaluate the abundance and distribution of PTEs in sediments by subjection to different reagents under certain operating conditions. The sequential extraction procedure assisted us in determining the distribution of PTEs in the exchangeable, reducible, oxidisable and residual fractions.
The sequential extraction method gives information that could be associated with the physical and chemical factors that affect the mobilisation, bioavailability and transportation of PTEs [7,22]. The concentrations of the fractions represent the pseudo-total concentrations of PTEs in river sediments, thus suitable for comparison studies.
The concentrations of PTEs in different fractions of sediment samples collected from the Blood River were quantified using ICP-AES. The levels of Cd in sequentially extracted sediment samples are given in Figure 3. Furthermore, the total concentrations that are obtained by adding the concentrations of Cd in F1, F2, F3 and F4 are compared with pseudo-total concentrations determined after microwave-assisted acid digestion (Figure 4).
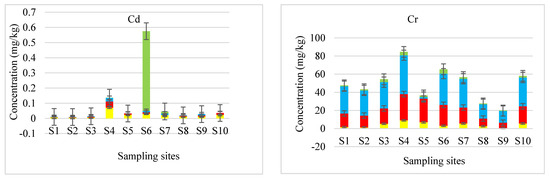
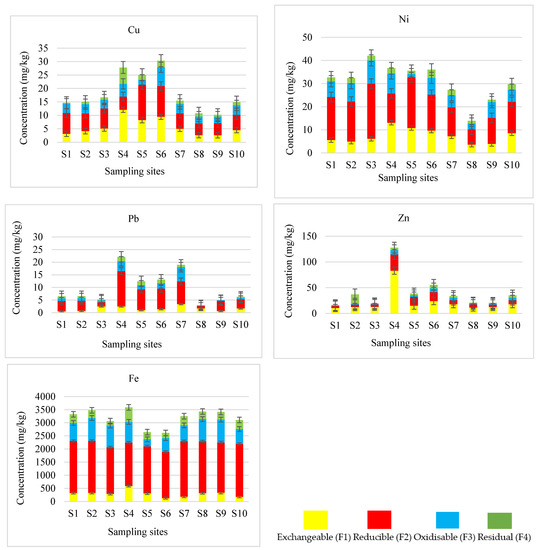
Figure 3.
Concentrations of PTEs in different fractions of sediment samples.
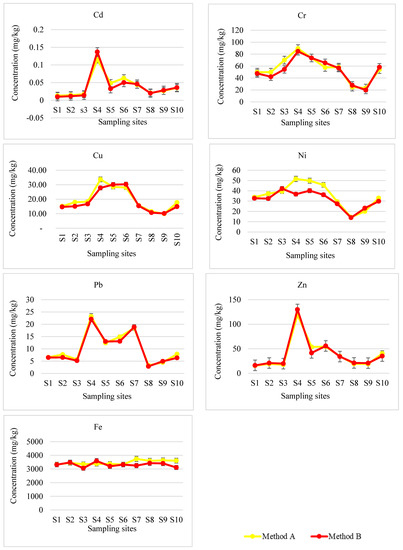
Figure 4.
Comparison of total concentrations of PTEs determined by sequential extraction procedure (method B) with pseudo-total concentrations of PTEs determined by microwave-assisted acid digestion (method A).
The level of Cd in the sequentially extracted sediments needed to be monitored due to its high toxicity since it has been reported as one of predominantly labile elements [21,23]. The partitioning trend of Cd was similar in all sites (Figure 3). The concentrations detected in the sites were highly favourable in the exchangeable stage. A study carried out by Shozi [24] emphasised Cd as a mineral that is not commonly found in the Earth’s crust and associated its existence in water bodies with anthropogenic activities. This could explain the highest level of Cd measured in sediment sample from site 4. Site 4 of the Blood River was found to be adjacent to an illegal dumping site. The domestic wastes could have contributed to the elevated levels of Cd in the river sediment. For most of the sampling sites, Cd in the residual stage was below the LOD value of 0.125 mg·kg−1. The fractionation pattern of Cd followed the order F1 > F2 > F3 > F4. The Cd revealed mobility as its highest portion (44 to 75%) was in the exchangeable fraction in all samples. These findings were in harmony with the studies by Marmolejo-Rodrıguez et al. [23], Díaz-de Alba et al. [25] and Saleem et al. [21], which reported Cd among the most labile elements in their studies. Additionally, Delgado et al. [26] and Kong et al. [27] also reported high percentages of Cd in the first fraction. The highest level of Cd in labile fraction in all sites compared to other fractions might bring risk to the river ecological system and should receive more attention.
A noticeable portion of Cd was detected in reducible fraction (20 to 36%) except at site 7 and the oxidisable fraction (17 to 29%) at sites 1 to 9, excluding sites 5 and 10. Relatively low-to-no Cd measured in the residual fraction except at site 7 (Figure 3). A similar trend was reported by Li et al. [28], in which Cd source was attributed to untreated local waste and runoffs from roadside, agricultural and industrial activities. Such activities could have contributed to the presence of the element in the sediments of the Blood River. Other studies reported Cd to be effectively bound to organic matter [29,30].
Figure 4 shows the trend between the total concentrations of sequentially extracted Cd and pseudo-total Cd concentrations in digested sediment samples. The total concentration of Cd obtained from extraction exceeded the pseudo-total concentrations determined by digestion method at site 4. In most sites, the total concentrations and pseudo-total Cd concentrations are in good agreement. The good harmony between method A and method B was confirmed by the t-test at a 95% confidence level, which demonstrated the accuracy of sequential extraction method for determination of Cd in river sediments.
Similarly, the concentrations of Cr in sequentially extracted sediment samples are presented in Figure 3. Moreover, the total concentrations of Cr are compared with pseudo-total concentrations determined after microwave-assisted acid digestion (Figure 4).
The Cr revealed a similar partitioning pattern in all the samples with the highest detected level in oxidisable fraction (51 to 65%). Similar findings were reported by Passos et al. [31] and Borgese et al. [32]. A noticeable fraction of Cr was found in F2 (30 to 35%), F1 (3 to 11%) and F4 (2 to 7%). However, the content of Cr in F1, F2 and F4 was below 37% at all sites revealing the soil development source of Cr [32]. It was reported by Chaudhary et al. [33] that Cr levels in the exchangeable fraction were more favourable with acidic pH than alkaline levels. However, this is not the case in this study since the exchangeable Cr was higher in sites 4 and 10 than in all the sites, for the basic pH of 9.32 and 9.29 was recorded at sites 4 and 10, respectively. These high concentrations could be from the metal bound to organic matter in sediments, which may elevate the levels of Cr in the water.
A classical study by Martin and Meybeck [34] introduced the need for the fourth stage and classified it as the residual stage. The authors reported the importance of the residual stage in relation to evaluation of contamination factors. In this study, Cr was detected in residual fraction in all the samples (Figure 3). The pattern of Cr levels in different fractions was F3 > F2 > F1 > F4. The analysis of the BCR 701 sediment certified reference material showed the fractionation pattern of Cr in the order of F3 > F2 > F1. This pattern was consistent with the fractionation pattern of Cr obtained in this study for Blood River sediment samples (F3 > F2 > F1 > F4).
Reliability of the results obtained in the sequential extraction (Method B) for Cr in river sediments was checked by comparison with the pseudo-total digestion concentrations (Method A). There was no significant difference observed between the mean values of Cr in river sediments determined through a t-test at a 5% level of significance. A good harmony between the two methods was shown in Figure 4.
The concentrations of Cu in sequentially extracted sediment samples are presented in Figure 3. Furthermore, the total concentrations of Cu in river sediments are compared with pseudo-total concentrations determined after microwave-assisted acid digestion (Figure 4).
The partitioning pattern of Cu in the reducible fraction was highly favourable in all the sites except site 4 (Figure 3). Copper was primarily associated with the reducible fraction (37 to 53%), followed by the exchangeable (21 to 33%), oxidisable (20 to 24%) and lastly, the residual fraction (2 to 11%). A different fractionation pattern was observed in site 4 where Cu was dominant in the exchangeable fraction (44%) followed by the residual fraction (22%), reducible fraction (18%) and finally the oxidisable fraction (17%). Wali et al. [35] and Davutluoglu et al. [36], reported the dominance of Cu in the exchangeable and residual fractions in their studies. Wali et al. [35] reported 39.70% Cu in the exchangeable fraction and 60.30% in the residual fraction.
The sum of Cu concentrations in three fractions plus residual was in good agreement with the pseudo-total concentrations as assessed by a t-test at a 95% confidence level and presented in Figure 4. Reliability of the results obtained, in this study, was shown by the partitioning trend of Cu in the BCR 701 sediment certified reference material. The highest Cu concentration was observed in the reducible fraction as it was the case in river sediments. The fractionation pattern followed the order: F2 > F3 > F1 and an additional stage F4 of this study showed the lowest concentration.
The concentrations of Ni in different extraction fractions of river sediments are shown in Figure 3. The sum of Ni concentrations in different fractions plus residual was compared with pseudo-total concentrations determined after microwave-assisted acid digestion in Figure 4. A good agreement was observed between the mean concentrations of Ni measured by the two methods at a 95% level of confidence.
The second fractionation stage represents the elements, which can easily bind to Fe and Mn oxides. These elements may leach from sediments to the water course when subjected to more reductive conditions [9]. The reducible fraction contained the highest Ni content (43 to 57%). A noticeable amount (17 to 29%) was measured in the exchangeable fraction followed by oxidisable fraction (19 to 24%) and residual fraction, which contained the lowest portion (4 to 10%). The fractionation pattern of Ni followed the order F2 > F1 > F3 > F4. Contrary to the findings of this study, Ni was predominantly found in the reducible fraction. Davutluoglu et al. [36] and Favas et al. [37] reported the dominant presence of Ni in the residual fraction compared to the other fractions. The elements predominant in the residual fraction are possibly contained in alumina-silicates and thus are less likely to be released to pore-water [38].
The total concentration obtained from addition of the extraction fractions plus residual was lower than the pseudo-total concentration determined by the digestion method. These differences were elevated in sites 4, 5 and 6. The reliability of the method B was shown by similarity in the partitioning trend of this method for sediment samples with the trend observed for the BCR 701 extraction (F2 > F1 > F3).
The concentrations of Pb in different extraction fractions of river sediments are presented in Figure 3. The sum of Pb concentrations in different extraction fractions plus residual was compared with pseudo-total concentrations determined after microwave-assisted acid digestion in Figure 4.
In normal environmental conditions, Pb that occurs in nature is not very mobile, which shows that the likely sources of Pb are due to human activities [39]. Elevated Pb concentrations were expected in the Fe–Mn oxyhydroxides (reducible) fraction. The oxyhydroxides of Fe–Mn are principal scavengers of the metal in sediments, and Pb is capable of forming stable complexes with oxyhydroxides of Fe–Mn [40,41]. In this study, elevated Pb concentration was measured in reducible fraction in samples from most sites. The highest percentage of Pb was obtained in F2 (47 to 82%), while less than 30%, 27% and 12% was measured in F3, F1 and F4, respectively. The fractionation pattern of Pb followed the order F2 > F3 > F1 > F4, except in sites 3 and 8. Sites 3 and 8 showed a different trend where Pb was dominant in the exchangeable fraction. The highest level of Pb in labile fraction in these sites compared to other fractions might bring high risk to the aquatic biota due to its mobility from this fraction. Zhao et al. [42] reported the highest amount of Pb in the exchangeable and reducible fractions. In their study, they associated the presence of Pb in the exchangeable fraction with anthropogenic activities. The sampling sites in the middle stream sites 4 to 7 are adjacent to a residential area of Seshego Township, and elevated levels of Pb in sites 4 to 7 could be attributed to domestic waste dumped near these sites. The Blood River is mainly influenced by human activities, and Pb primarily originates from municipal wastes, atmospheric inputs and automobile exhaust [21,28]. These activities in Seshego township could be the predominant source of Pb in river sediments.
The reliability of the method B for fractionation of Pb was evaluated by comparing the sum of the concentrations obtained in four stages with the pseudo-total concentrations obtained by method A. In general, the sum of the Pb concentrations in different fractions and pseudo-total concentrations was in good agreement at a 5% level of significance.
The concentrations of Zn in different extraction fractions of sediment samples are given in Figure 3. The sum of concentrations of Zn in sequentially extracted fractions plus residual was compared with pseudo-total concentrations determined after microwave-assisted acid digestion in Figure 4.
Zinc is weakly bound and easily leachable by soluble salts and ions, thus the high levels observed in the exchangeable fraction in this study. The maximum level of Zn in the exchangeable fraction shows that Zn is very mobile. Complexation of Zn with dissolved organic matter has been reported to increase its solubility and mobility [43]. The high levels of Zn at site 4 could have resulted from the release of exchangeable Zn associated with the illegal dumping near the Blood River. The high levels of Zn in exchangeable fraction could be associated with the low-cost houses roofed with Zn corrugated sheets in the township, which may have been leached out from the roofs into the surrounding environment and the river during acidic conditions [44]. The distribution of Zn in the sediments of the Blood River was maximum in the F1 (43 to 65%), followed by F2 (22 to 31%), F3 (7 to 15%) and lastly, F4 (3 to 12%). Zinc partitioning followed the order F1 > F2 > F3 > F4 except at site 5.
Comparison of the sum of Zn concentrations in different fractions (Method B) and pseudo-total concentrations for digested sediments samples (Method A) was done to further check the reliability of the method. In general, the sum of Zn concentrations in different fractions and pseudo-total concentrations of Zn was in good agreement at a 95% confidence level.
The levels of Fe in different extraction fractions of river sediments are presented in Figure 3. The sum of Fe concentrations in sequentially extracted fractions plus residual was compared with pseudo-total concentrations measured after microwave-assisted acid digestion in Figure 4.
In this study, the highest percentage of Fe was obtained in the reducible fraction (46 to 67%) followed by oxidisable fraction (18 to 27%), whereas less than 15% was recorded in the exchangeable and residual fractions (Figure 3). Generally, the concentrations of Fe in the sediments from different sites followed the order F2 > F3 > F4 > F1. The Fe–Mn oxyhydroxide is the major scavenger of all metals. The maximum concentration of Fe in reducible fraction is in good harmony with its association with Fe–Mn oxyhydroxides. Iron is one of abundant metals in the Earth. The continuous increase in the Fe concentration along the sampling sites may be due to the contribution of anthropogenic factors.
Due to lack of the certified value for Fe in the BCR-701 reference material, validation of the analytical results was done by comparing the sum of sequentially extracted concentrations of Fe with the pseudo-total concentrations determined after digestion using a microwave digestion system. The agreement of the results obtained using two methods at a 95% confidence level confirmed the accuracy of the levels of Fe obtained by the sequential extraction method.
3.3. The Implications of Sequential Extracted Concentrations to the Environment
The extent of risks that PTEs could pose to the environment is estimated by determining the contamination factor of PTEs. A high CF of PTEs indicates a high risk to the environment and low retention time [9]. The application of individual contamination factor (ICF) and the global contamination factor (GCF) for assessment of the risks to the environmental and estimation of possible harm to the aquatic organisms and the environment by polluted sediments and water have been reported elsewhere [9,45]. This is based on the PTEs being able to bind to different sediment fractions that determine the bioavailability of the elements from the sediments to the water and the environment [39].
3.3.1. Determination of Contamination Factor
The ICF was determined following the method by Nemati et al. [46]. The ICFs of PTEs in sediments were calculated by dividing the sum of concentrations in the non-residual fractions (F1 + F2 + F3) by the concentrations in residual fractions (F4) of each sample [21].
ICF = ([F1 + F2 + F3])/F4
The GCF for each site was computed by adding the ICF of all the PTEs determined for the sample [21,47].
GCF = Σ ICF
The classifications of ICF and GCF were discussed following the interpretation by Zhao et al. [42], where ICF < 0 and GCF < 6 indicate low contamination, and 1 < ICF < 3 and 6 < GCF < 12 indicate moderate contamination. Additionally, 3 < ICF < 6 and 12 < GCF < 24 indicate considerable contamination. Lastly, ICF > 6 and GCF > 24 are classified as high contamination. The calculated values of ICF and GCF for the ten studied sites are presented in Table 5.
Table 5.
Individual contamination and global contamination factors of all the sites in the Blood River obtained employing method B.
Based on the calculated values of ICF, there was low contamination by Cd in S1, S2, S3, S5, S6, S8, S9 and S10; S7 showed a moderate contamination by Cd, and site 4 had an ICF value of 108, indicating a high contamination risk of Cd to the environment. This was based on the anthropogenic activities that were dominant at S4. Elevated concentration of Cd in F4 for S6 (Figure 3) and the low ICF index (Table 5) in this sample indicated the natural origin as a likely source of Cd at this site. High concentrations of PTEs in the residual fraction showed that the sediments were relatively unpolluted and the source of PTEs was primarily of geogenic origin [21]. In the residual fraction, PTEs are bound to silicates and as a result, unavailable to the aquatic system [21,38]. The values of ICF for Cr and Cu were above the maximum threshold for high contamination, which shows the risk associated with these elements.
The ICF values of Fe in all the sites were in the high contamination level, except for S3, which was classified as a moderate contaminant. However, with continuous pollution occurring in the area, the Fe level in S3 will likely increase.
The ICF values of Ni in all sites were in the high contamination level. Monitoring the element should be carried out to control possible threats to the aquatic system.
The Pb was classified under high contamination level in all the sites since the ICF values exceeded the ICF of 6 from S1 to S10. The calculated ICF values for Pb in samples from S8 and S9 were also high, which indicated the predominance of anthropogenic origin at these sites. The PTEs from anthropogenic sources are mainly found in the most labile fractions of sediment that are vulnerable to small changes in environmental conditions [21]. Owing to the high toxicity of Pb, the calculated values represent a potential risk of contamination to the water phase, or to the biota, in the sediment samples. Similarly, Zn was also classified as a high contamination risk to the river system based on the ICF values, with an exception in S2, which was under the moderate contamination level.
Overall, the risk assessment showed a high possibility of Cr, Cu, Fe, Ni, Pb, and Zn to be released from the sediments to overlying water with the average ICF values of 29.9, 15.1, 10.3, 15.7, 46.9 and 15.3, respectively. The mean values of ICF followed the order: Pb, Cr, Ni, Zn, Cu, Cd and Fe. Although Cd was under the low classification in most of the sites, it was overall classified under high-risk contamination level based on the average ICF value of 11.2 (Table 5).
The concentration of any element in residual fraction is considered a non-mobile fraction and is an important partition that influences the mobility of the elements, while the non-residual fractions are considered mobile [21]. The results showed Cr, Cu, Fe, Ni, Pb, and Zn have high potential mobility. The mobility of the elements displays the increased potential risk of these elements to the surrounding environment and aquatic organisms.
The GCF values of the PTEs were greater than 24 in all the sites, indicating a high possibility of these elements to be released to water. Thus, the analysed elements in sediments pose high risks to the ecosystem. The GCF values were 152, 82, 118, 191, 112, 61, 93, 269, 283 and 82 from S1 to S10, respectively. The average GCF value was 114, thus classified as high contamination level. The combined effect of the elements along with potential high mobility reveal the likely risks these PTEs could pose to the ecosystem.
3.3.2. The Risk Assessment Code
The risk assessment code (RAC) was first introduced by Perin et al. [48], and was applied to assess the mobility and bioavailability of PTEs in surface sediments [9,49]. The RAC value of each analyte is calculated by the following equation:
RAC = [F1/(ΣF1 − F4)] × 100
The RAC classifications followed the interpretation by Perin et al. [48] where the RAC value of <1 indicates no risk, between 1 and 10 indicates low risk, 11 to 30 is medium risk, 31 to 50 is high risk and finally, >50 is classified very high risk. Table 6 shows the calculated percentage RAC values of the PTEs in the sediments of the Blood River.
Table 6.
Risk assessment code of potentially toxic elements in sediments from the Blood River.
Following the contamination assessment evaluated by ICF and GCF values, the RAC is applied to assess the risk based on the percentage of metal in exchangeable fraction or bound to carbonate [50]. The calculated RAC values in Table 6 showed an average of 52.6% of total Zn in river sediments was either present in exchangeable fraction or bound to carbonate. Thus, it is in the high- to very high-risk category to the aquatic and non-aquatic environment and likely to affect humans via the food chain. The RAC values ranged between 33.2 and 65.45 in the sites, indicating high risk in S2, S5 and S6 and very high risk in S1, S3, S4, S7, S8, S9 and S10.
The RAC values for Cr and Fe revealed that the risks these elements could pose to the aquatic environment are low. The RAC values of Cr ranged from 2.98 to 10.7% with an average value of 7.32%. An average RAC for Fe was 9.01%, ranging from 4.90% in S6 to 16.5% in S4, which falls under the moderate risk category.
Although the concentration of Cd was substantially low in the sediments of the Blood River, the RAC value indicated it as a potential risk to the aquatic and surrounding environment of the river. The average RAC value in the sediments was 25.0% indicating medium risk, while the RAC ranged between 3.81% (low risk) and 89.1% (very high risk). Cadmium in S1, S2, S3, S8 and S9 was classified as high risk and in S6 and S10 as moderate risk.
The average RAC values of Cu (29.4%), Ni (23.4%) and Pb (21.3%) classified the elements as medium risk to the environment. The RAC values of Cu ranged from 21.4% in S1 to 43.5% in S4. Although Cu was classified under the medium-risk category, S3, S4, S6, S7 and S10 were classified under high risk. The presence of Ni in the non-residual fraction categorised its existence in the sediments as medium risk to the environment in the sites with an exception in S4 (35.7%), which was of high risk. Partitioning of Pb in the sediments resulted in the RAC values of Pb ranging from 7.85% in sites 1 and 5 to 58.0% in S8. The presence of this element in S3 and S8 indicates that it poses high risk to the aquatic organisms in the Blood River. Overall, the analyte was classified under the low (S1, S2, S5 and S6) to medium risk (S4, S7, S9 and S10).
These findings indicate potential risks to the human health of residents surrounding the Blood River. These may be caused by direct exposure to the water and indirect exposure via the food chain. The risk assessment of the Blood River followed the decreasing order of Zn > Cu > Cd > Ni > Pb > Fe > Cr. Similar to our findings, Nemati et al. [46] reported Zn and Cd as high-risk elements in river sediments. However, Saleem et al. [21] reported relatively higher mobility of Cd, Ni and Pb, whereas Cu, Fe and Zn were detected predominantly in the residual fractions.
4. Conclusions
Sequential extraction of Cd, Cr, Cu, Fe, Ni, Pb and Zn in river sediments was achieved by employing the BCR sequential extraction procedure. The accuracy of the data was confirmed by analysing the BCR 701 certified reference material of sediment and yielded quantitative percentage recoveries. To assess the retention of PTEs in sediments collected from the Blood River, the contamination factor of each element was calculated. The calculated contamination factors showed the potential of high mobility of PTEs from sediments to the overlaying water. The mobility of the elements shows the increased potential risk of PTEs to the environment and aquatic organisms. Furthermore, the highest concentration of Cd in labile fraction in all the sites compared to other fractions could pose risk to the ecological system of the river. The presence of Cd in water bodies is associated with anthropogenic activities since it is not commonly found in the Earth’s crust. The highest level of Zn in the labile fraction could be associated with the low-cost houses roofed with Zn coated sheets in Seshego Township that could have been leached out from the roofs into the river during acidic conditions. In general, the sources of PTEs in the Blood River is predominantly attributed to untreated local waste and runoffs from the roadside, as well as industrial activities. Currently, no regular monitoring of PTEs is done in the Blood River. The measured high concentrations of PTEs in sediments of the Blood River revealed a clear need for continued monitoring of PTEs in the water and sediments. These findings indicate potential risks to the health of human residents surrounding the Blood River. These may be caused by direct exposure to the water and indirect exposure via the food chain. The evaluation of associated risks of PTEs in analysed sediments based on RAC values revealed the risks of Zn > Cu > Cd > Ni > Pb > Fe > Cr.
Author Contributions
Conceptualization, D.L.M. and A.A.A.; methodology, D.L.M. and A.A.A.; software, D.L.M. and A.A.A.; validation, D.L.M. and A.A.A.; formal analysis, D.L.M.; investigation, D.L.M. and A.A.A.; resources, T.W.G., R.M.M. and A.A.A.; data curation, D.L.M. and A.A.A.; writing—original draft preparation, D.L.M. and A.A.A.; writing—review and editing, D.L.M., T.W.G., R.M.M. and A.A.A.; visualization, D.L.M. and A.A.A.; supervision, T.W.G., R.M.M. and A.A.A.; project administration, A.A.A.; funding acquisition, A.A.A. All authors have read and agreed to the published version of the manuscript.
Funding
Dithobolong L. Matabane received financial support from the Sasol Inzalo Foundation and the National Research Foundation (NRF). This study is supported in part by the NRF of South Africa under the Thuthuka Programme Grant Number 117673 and the Water Research Commission (WRC) of South Africa Project Number K5/2515//1. We would like to acknowledge the University of Johannesburg Research Centre for Synthesis and Catalysis and Spectrum for the facility.
Data Availability Statement
Not applicable.
Conflicts of Interest
No conflict of interest.
References
- Yuan, C.-G.; Shi, J.-B.; He, B.; Liu, J.-F.; Liang, L.-N.; Jiang, G.-B. Speciation of heavy metals in marine sediments from the East China Sea by ICP-MS with sequential extraction. Environ. Int. 2004, 30, 769–783. [Google Scholar] [CrossRef] [PubMed]
- Sarkar, S.K.; Favas, P.J.C.; Rakshit, D.; Satpathy, K.K. Geochemical Speciation and Risk Assessment of Heavy Metals in Soils and Sediments, Environmental Risk Assessment of Soil Contamination, Maria C. Hernandez-Soriano, IntechOpen. 2014. Available online: https://www.intechopen.com/books/environmental-risk-assessment-of-soil-contamination/geochemical-speciation-andrisk-assessment-of-heavy-metals-in-soils-and-sediments (accessed on 29 April 2019).
- Vetrimurugan, E.; Jonathan, M.; Roy, P.D.; Shruti, V.; Ndwandwe, O. Bioavailable metals in tourist beaches of Richards Bay, Kwazulu-Natal, South Africa. Mar. Pollut. Bull. 2016, 105, 430–436. [Google Scholar] [CrossRef]
- Qiao, Y.; Yang, Y.; Gu, J.; Zhao, J. Distribution and geochemical speciation of heavy metals in sediments from coastal area suffered rapid urbanization, a case study of Shantou Bay, China. Mar. Pollut. Bull. 2013, 68, 140–146. [Google Scholar] [CrossRef] [PubMed]
- Yang, J.; Chen, L.; Liu, L.; Shi, W.; Meng, X. Comprehensive risk assessment of heavy metals in lake sediments from public parks in Shanghai. Ecotoxicol. Environ. Saf. 2014, 102, 129–135. [Google Scholar] [CrossRef]
- Bacon, J.R.; Davidson, C. Is there a future for sequential chemical extraction? Analyst 2007, 133, 25–46. [Google Scholar] [CrossRef] [PubMed]
- Hanay, Ö.; Hasar, H.; Kocer, N.N.; Aslan, S. Evaluation for agricultural usage with speciation of heavy metals in a municipal sewage sludge. Bull. Environ. Contam. Toxicol. 2008, 81, 42–46. [Google Scholar] [CrossRef]
- Nemati, K.; Abu Bakar, N.K.; Sobhanzadeh, E.; Abas, M.R. A modification of the BCR sequential extraction procedure to investigate the potential mobility of copper and zinc in shrimp aquaculture sludge. Microchem. J. 2009, 92, 165–169. [Google Scholar] [CrossRef]
- Nemati, K.; Bakar, A.N.K.; Mhd Abas, R.B.; Sobhanzadeh, E.; Hin Low, K.H. Comparison of unmodified and modified BCR sequential extraction schemes for the fractionation of heavy metals in shrimp aquaculture sludge from Selangor, Malaysia. Environ. Monit. Assess. 2011, 176, 313–320. [Google Scholar] [CrossRef]
- Arenas-Lago, D.; Andrade, M.; Lago-Vila, M.; Rodríguez-Seijo, A.; Vega, F. Sequential extraction of heavy metals in soils from a copper mine: Distribution in geochemical fractions. Geoderma 2014, 230–231, 108–118. [Google Scholar] [CrossRef]
- Oberholster, P.J.; Ashton, P.J. State of the nation report: An overview of the current status of water quality and eutrophication in South African Rivers and Reservoirs. Counc. Sci. Ind. Res. 2008, 3, 1–7. [Google Scholar]
- Bologo, V.; Maree, J.; Carlsson, F. Application of magnesium hydroxide and barium hydroxide for the removal of metals and sulphate from mine water. Water SA 2012, 38, 23–28. [Google Scholar] [CrossRef] [Green Version]
- Fatoki, O.; Lujiza, N.; Ogunfowokan, A.; Fatoki, O.; Lujiza, N.; Ogunfowokan, A. Trace metal pollution in Umtata River. Water SA 2002, 28, 183–190. [Google Scholar] [CrossRef] [Green Version]
- Letsoalo, M.R.; Godeto, T.W.; Magadzu, T.; Ambushe, A.A. Selective speciation of inorganic arsenic in water using nanocomposite based solid-phase extraction followed by inductively coupled plasma-mass spectrometry detection. J. Environ. Sci. Health Part A 2019, 54, 924–932. [Google Scholar] [CrossRef] [PubMed]
- Polokwane Municipality Report. Integrated Development Planning (IDP) Report for Polokwane Municipality (2012–2013); Polokwane Municipal Council: Polowane, South Africa, 2012. [Google Scholar]
- Rauret, G.; López Sánchez, J.F.; Sahuquillo, A.; Rubio, R.; Davidson, C.; Ure, A.; Quevauviller, P.H. Improvement of the BCR three step sequential extraction procedure prior to the certification of new sediments and soil reference materials. J. Environ. Monit. 1999, 1, 57–61. [Google Scholar] [CrossRef] [PubMed]
- Castillo, M.L.A.; Alonso, E.V.; Cordero, M.T.S.; Pavon, J.M.C.; De Torres, A.G. Fractionation of heavy metals in sediments by using microwave assisted sequential extraction procedure and determination by inductively coupled plasma mass Spectroscopy. Microchem. J. 2011, 98, 234–239. [Google Scholar] [CrossRef]
- Melaku, S.; Wondimu, T.; Dams, R.; Moens, L. Multi-element analysis of Tinishu river sediments, ethiopia by ICP-MS after microwave assisted digestion. Can. J. Anal. Sci. Spectrosc. 2005, 50, 31–40. [Google Scholar]
- Ciceri, E.; Giussani, B.; Pozzi, A.; Dossi, C.; Recchia, S. Problems in the application of the three-step BCR sequential extraction to low amounts of sediments: An alternative validated route. Talanta 2008, 76, 621–626. [Google Scholar] [CrossRef] [PubMed]
- United States Environmental Protection Agency. Contract Laboratory Program for National Functional Guidelines for Inorganic Data Review; United States EPA: Washington, DC, USA, 2010. [Google Scholar]
- Saleem, M.; Iqbal, J.; Shah, M.H. Geochemical speciation, anthropogenic contamination, risk assessment and source identification of selected metals in freshwater sediments—A case study from Mangla Lake, Pakistan. Environ. Nanotechnol. Monit. Manag. 2015, 4, 27–36. [Google Scholar] [CrossRef] [Green Version]
- Ure, A.M.; Quevauviller, P.; Muntau, H.; Griepink, B. Speciation of heavy metals in soils and sediments. An account of the improvement and harmonization of extraction techniques undertaken under the auspices of the BCR of the commission of the European communities. Int. J. Environ. Anal. Chem. 1993, 51, 135–151. [Google Scholar] [CrossRef]
- Marmolejo-Rodríguez, A.J.; Prego, R.; Meyer-Willerer, A.; Shumilin, E.; Cobelo-Garcia, A. Total and labile metals in surface sediments of the tropical river-estuary system of Marabasco (Pacific coast of Mexico): Influence of an iron mine. Mar. Pollut. Bull. 2007, 55, 459–468. [Google Scholar] [CrossRef]
- Shozi, M. Assessing the Distribution of Sedimentary Heavy Metals in the Msunduzi River Catchment, Kwazulu-Natal, South Africa. Master’s Thesis, University of KwaZulu-Natal, Durban, South Africa, 2015. [Google Scholar]
- Diaz-De Alba, M.; Galindo-Riano, M.D.; Casanueva-Marenco, M.J.; Garcia-Vargas, M.; Kosore, C.M. Assessment of the metal pollution, potential toxicity and speciation of sediments from Algeciras Bay (South of Spain) using chemometric tools. J. Hazard. Mater. 2011, 190, 177–187. [Google Scholar] [CrossRef] [PubMed]
- Delgado, J.; Barba-Brioso, C.; Nieto, J.M.; Boski, T. Speciation and ecological risk of toxic elements in estuarine sediments affected by multiple anthropogenic contributions (Guadiana saltmarshes, SW Iberian Peninsula): I. Surficial sediments. Sci. Total Environ. 2011, 409, 3666–3679. [Google Scholar] [CrossRef]
- Kong, M.; Dong, Z.; Chao, J.; Zhang, Y.; Yin, H. Bioavailability and ecological risk assessment of heavy metals in surface sediments of Lake Chaohu. China Environ. Sci. 2015, 35, 1223–1229. [Google Scholar]
- Li, Q.; Wu, Z.; Chu, B.; Zhang, N.; Cai, S.; Fang, J. Heavy metals in coastal wetland sediments of the Pearl River Estuary, China. Environ. Pollut. 2007, 149, 158–164. [Google Scholar] [CrossRef]
- Sundaray, S.K.; Nayak, B.B.; Lin, S.; Bhatta, D. Geochemical speciation and risk assessment of heavy metals in the river estuarine sediments—A case study: Mahanadi basin, India. J. Hazard. Mater. 2011, 186, 1837–1846. [Google Scholar] [CrossRef] [PubMed]
- Zhang, L.; Liao, Q.; Shao, S.; Zhang, N.; Shen, Q.; Liu, C. Heavy metal pollution, fractionation, and potential ecological risks in sediments from Lake Chaohu (Eastern China) and the surrounding rivers. Int. J. Environ. Res. Public Health 2015, 12, 14115–14131. [Google Scholar] [CrossRef] [Green Version]
- Passos, E.A.; Alves, J.C.; Santos, I.S.; Alves, J.P.; Garcia, C.A.B.; Costa, A.C.S. Assessment of trace metals contamination in estuarine sediments using a sequential extraction technique and principal component analysis. Microchem. J. 2010, 96, 50–57. [Google Scholar] [CrossRef]
- Borgese, L.; Federici, S.; Zacco, A.; Gianoncelli, A.; Rizzo, L.; Smith, D.R.; Donna, F.; Lucchini, R.; Depero, L.E.; Bontempi, E. Metal fractionation in soils and assessment of environmental contamination in Vallecamonica, Italy. Environ. Sci. Pollut. Res. 2013, 20, 5067–5075. [Google Scholar] [CrossRef] [Green Version]
- Chaudhary, S.; Banerjee, D.K. Metal phase association of chromium in contaminated soils from an industrial area in Delhi. Chem. Speciat. Bioavailab. 2004, 16, 145–151. [Google Scholar] [CrossRef]
- Martin, J.; Meybeck, M. Elemental mass-balance of material carried by major world rivers. Mar. Chem. 1979, 7, 178–206. [Google Scholar] [CrossRef]
- Wali, A.; Colinet, G.; Ksibi, M. Speciation of heavy metals by modified BCR sequential extraction in soils contaminated by phosphogypsum in Sfax, Tunisia. Environ. Res. Eng. Manag. 2015, 70, 14–25. [Google Scholar] [CrossRef] [Green Version]
- Davutluoglu, O.I.; Seckin, G.; Ersu, C.B.; Yilmaz, T.; Sari, B. Heavy metal content and distribution in surface sediments of the Seyhan River, Turkey. J. Environ. Manag. 2011, 92, 2250–2259. [Google Scholar] [CrossRef]
- Favas, P.J.C.; Pratas, J.; Gomez, M.; Elisa, P.; Cala, V. Selective chemical extraction of heavy metals in tailings and soils contaminate by mining activity: Environmental implications. J. Geochem. Explor. 2011, 111, 160–171. [Google Scholar] [CrossRef]
- Tuzen, M. Determination of trace metals in the river Yesilirmak Sediments in Tokat, Turkey using sequential extraction procedure. Microchem. J. 2003, 74, 105–110. [Google Scholar] [CrossRef]
- Jain, C. Metal fractionation study on bed sediments of River Yamuna, India. Water Res. 2004, 38, 569–578. [Google Scholar] [CrossRef] [PubMed]
- Li, X.; Shen, Z.; Wai, O.; Li, Y. Chemical forms of Pb, Zn and Cu in the sediments profiles of the Peral River Estuary. Mar. Pollut. Bull. 2001, 42, 215–223. [Google Scholar] [CrossRef]
- Wong, C.S.; Wu, S.; Duzgoren-Aydin, N.S.; Aydin, A.; Wong, M.H. Trace metal contamination of sediments in an e-waste processing village in China. Environ. Pollut. 2007, 145, 434–442. [Google Scholar] [CrossRef] [Green Version]
- Zhao, S.; Feng, C.; Yang, Y.; Niu, J.; Shen, Z. Risk assessment of sedimentary metals in the Yangtze Estuary: New evidence of the relationships between two typical index methods. J. Hazard. Mater. 2012, 241–242, 164–172. [Google Scholar] [CrossRef]
- Houben, D.; Sonnet, P. Zinc mineral weathering as affected by plant roots. Appl. Geochem. 2012, 27, 1587–1592. [Google Scholar] [CrossRef]
- Okonkwo, J.O.; Mothiba, M. Physico-chemical characteristics and pollution levels of heavy metals in the rivers in Thohoyandou, South Africa. J. Hydrol. 2005, 308, 122–127. [Google Scholar] [CrossRef]
- Nasr, S.M.; Okbah, M.A.; El Haddad, H.S.; Soliman, N.F. Fractionation profile and mobility pattern of metals in sediments from the Mediterranean Coast, Libya. Environ. Monit. Assess. 2015, 187, 1–8. [Google Scholar] [CrossRef] [PubMed]
- Nemati, K.; Abu Bakar, N.K.; Abas, M.R.; Sobhanzadeh, E. Speciation of heavy metals by modified BCR sequential extraction procedure in different depths of sediments from Sungai Buloh, Selangor, Malaysia. J. Hazard. Mater. 2011, 192, 402–410. [Google Scholar] [CrossRef] [PubMed]
- Ikem, A.; Egiebor, N.O.; Nyavor, K. Trace elements in water, fish and sediment from Tuskegee Lake, Southeastern USA. Water Air Soil Pollut. 2003, 149, 51–75. [Google Scholar] [CrossRef]
- Perin, G.; Craboleda, L.; Lucchese, M.; Cirillo, R.; Dotta, L.; Zanette, M.L.; Orio, A.A. Heavy metal speciation in the sediments of Northern Adriatic Sea- a new approach for environmental toxicity determination. In Heavy Metal in the Environment; Lakkas, T.D., Ed.; New Age International: Delhi, India, 1985; pp. 454–456. [Google Scholar]
- Mortazavi, S.; Attaeian, B.; Abdolkarimi, S. Risk assessment and environmental geochemistry of Pb, Cu and Fe in surface sediments (case study: Hashilan Wetland, Kermanshah, Iran). Ecopersia 2016, 4, 1411–1424. [Google Scholar] [CrossRef]
- Saeedi, M.; Li, L.Y.; Karbassi, A.; Zanjani, A.J. Sorbed metals fractionation and risk assessment of release in river sediment and particulate matter. Environ. Monit. Assess. 2012, 185, 1737–1754. [Google Scholar] [CrossRef] [PubMed]
Publisher’s Note: MDPI stays neutral with regard to jurisdictional claims in published maps and institutional affiliations. |
© 2021 by the authors. Licensee MDPI, Basel, Switzerland. This article is an open access article distributed under the terms and conditions of the Creative Commons Attribution (CC BY) license (https://creativecommons.org/licenses/by/4.0/).