Article

Freeze–Thaw Damage Model of Polypropylene Fiber Reinforced Cement Stabilized Waste Construction Slurry under Uniaxial Action

1
School of Civil Engineering, Shaoxing University, Shaoxing 312000, China
2
Tongchuang Engineering Design Co. Ltd., Shaoxing 312000, China
*
Author to whom correspondence should be addressed.
Minerals 2021, 11(7), 743; https://doi.org/10.3390/min11070743
Submission received: 10 June 2021 / Revised: 3 July 2021 / Accepted: 6 July 2021 / Published: 8 July 2021
(This article belongs to the Special Issue Alkali-Activated Cements and Concretes)

Abstract

:
In order to apply the fiber reinforced cement stabilized waste construction slurry more widely, it is crucial to evaluate its mechanical behavior under freeze and thaw (F–T) cycles. The mechanical properties of fiber cement-modified waste construction slurry (FCMS) under five different F–T cycles were studied using unconfined compressive strength tests. One fixed cement sample with five different types of polypropylene fiber was used in the FCMS. Using the meso random damage model, the two-stage damage stress–strain relationship of FCMS was established using particle swarm optimization (PSO). The results were as follows: (1) The mechanical properties of FCMS at room temperature and in an F–T environment were significantly improved by fiber; (2) The elastic modulus of FCMS decreased in the form of a power function with the increase of F–T cycles; (3) The fitting results of the two-stage F–T damage model based on meso random damage theory were in agreement with the measured data.

1. Introduction

In the construction of bored piles, diaphragm walls and shields, a large volume of waste construction slurry is produced. Shaoxing, China, for example, produces about 4000 cubic meters of construction waste mud every week. The existing treatment method for this type of slurry is to use it separately after air drying; however, due to its low strength after air drying, it does not meet engineering requirements. Therefore, developing effective reinforcement methods, verifying a curing mechanism and mastering the mechanical properties of modified construction slurry is crucial. At present, the chemical curing method is considered to be one of the better construction slurry treatment methods. In civil engineering, inorganic materials, such as lime, cement and fly ash, are often used to modify construction slurry. Cement is used as a common chemical curing agent in engineering construction because of its ease of access and high cost performance [1,2,3,4,5,6], and an appropriate amount of fiber can effectively improve the mechanical properties of cement-modified construction slurry [7,8,9,10,11,12,13,14].
In practical construction engineering, a freezing technique is sometimes used to improve construction safety. In areas that are frozen for part of the year, engineering materials need to endure freeze-thaw (F–T) cycles. In order to be able to apply modified construction slurry more widely, it is important to evaluate its mechanical behavior during F–T cycles. Liu [15] studied the improvement effect of cement and lime-modified soil during F–T cycles by using a dynamic triaxial test. Results showed that the improvement effect of the cement soil was better than that of lime soil and had a certain degree of resistance to F–T. Jahandari confirmed that compressive strength can be directly used to evaluate the F–T durability of lime soil [16], and Shihata’s research shows that it is possible to use unconfined compressive strength (UCS) as an index to judge the F–T durability of cement soil [17]. Boz [18] added 0%, 0.5% and 1% polypropylene fiber into concrete to test its F–T resistance. The data show that the unconfined compressive strengths of PF reinforced samples are 76 kPa, 127 kPa and 134 kPa, respectively. The addition of fiber can improve the strength of the samples, but the variation of fiber content has little effect on the strength improvement. In addition, adding polypropylene can improve the F–T resistance of concrete; the decreasing trend slows down with the increase of content with the freeze–thaw cycle. Ding [19] showed that fiber can effectively enhance the UCS of clay, as well as reduce the frost heave of clay.
The mechanical properties of cement soil exposed to F–T cycles are increased when adding polypropylene fiber, and most current research in this area is in the qualitative stage. Moreover, construction slurry is a special material. Through mechanical experimentation, the mechanical properties present during F–T cycles are demonstrated quantitatively, particularly in research performed on the stress–strain relationship seen during F–T cycles.
In 1958, Kachanov [20] was the first person to apply continuity factor and effective stress as methods to reflect the extent of internal damage of materials. In 1963, Robotnov [21] introduced the concept of a damage factor based on Kachanov’s work. Lemaitre, Krajcinovic and other scholars have also contributed to research on damage theory and established the damage mechanics approach in the 1970s [21,22,23,24,25]. When establishing the meso random damage model, the parameters of the model need to be identified according to experimental data. The particle swarm optimization (PSO) algorithm is a commonly used parameter identification calculation method [26], which has application for retaining wall, concrete and bridge engineering, and can obtain better calculation results [27,28,29,30]. According to the no free lunch theorem [31], when an algorithm is optimized to solve a class of problems, it will inevitably reduce the effect on other problems. However, PSO is used to establish the damage stress–strain model of fiber cement-modified waste construction slurry (FCMS) by using parameter identification based on experimental data. The problems are a type of model parameter identification in the field of civil engineering. Therefore, this is a significant attempt to apply PSO to the parameter identification of the meso random damage model.
The above research demonstrates that fiber can improve the mechanical properties of cement soil, and that research on the stress–strain relationship during FCMS F–T strongly supports the use of slurry resources. The PSO algorithm is suitable for model parameter identification, and it is a significant attempt to apply it to stochastic damage model parameter identification and establish a damage stress–strain relationship for FCMS under F–T cycles. Based on the meso random damage model, this paper explores the change rule of FCMS compression strength by using the unconfined compression strength test after F–T cycles occur, and combines PSO to establish the damage model to reveal the F–T cycle rule and the fiber action mechanism to provide a theoretical basis for the use of construction slurry resources.

2. Unconfined Compression Test of F–T Cycles
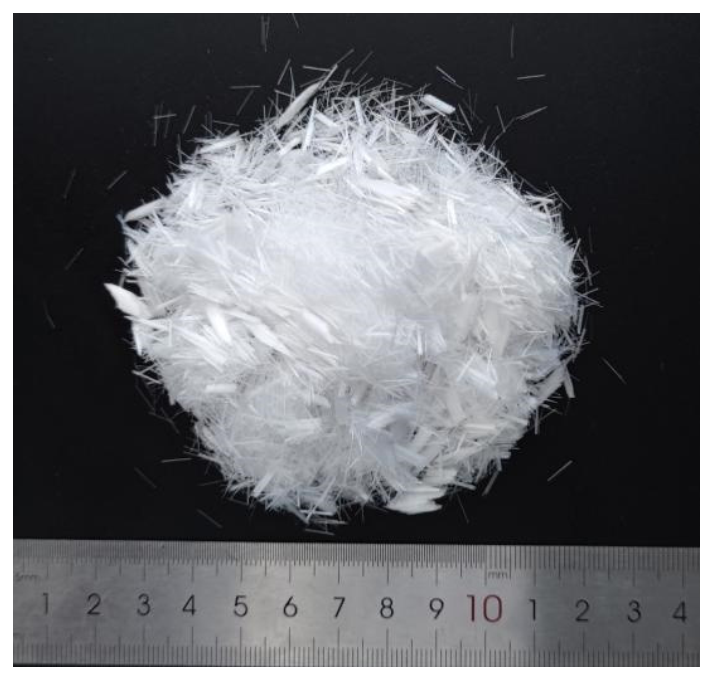
2.1. Materials

The materials used in the test were construction slurry, cement, fiber and water. The construction slurry originated at a construction site in Shaoxing, China. The primary components of the construction slurry were water, silt and clay particles. The basic form of the construction slurry is shown in Figure 1. Its specific gravity, plastic limit, liquid limit and water content are 2.65%, 23.1%, 43.5% and 100%, respectively. Water content refers to the mass ratio of water to dry construction slurry.
The cement was P•O 32.5R Portland cement produced by Anhui Conch Cement Co., Ltd. (Wuhu, China). The fiber was polypropylene fiber, with a length of 6 mm and a diameter of 25–30 μm. The basic morphology of the fiber is shown in Figure 2.

2.2. Test Scheme

2.2.1. UCS Test

The proportion of each component in the FCMS was as follows. The cement content was 20% and the fiber ratios were 0%, 0.25%, 0.5%, 0.75% and 1%. Admixture content of each material was the ratio of its mass to the mass of dry construction slurry. The design scheme of the UCS test in the F–T environment is shown in Table 1.
According to the UCS test scheme in Table 1, five samples were taken for each ratio. The test sample was a cylinder with a diameter of 39.1 mm and a height of 80 mm. After curing in water for 28 days, demolding was performed.
The F–T cycle equipment used in the test was a DM-40 low temperature test chamber. The F–T cycle conditions were −20 °C for 24 h and 20 °C for 24 h.
The UCS test was performed with a full-automatic UCS meter. According to the Chinese geotechnical testing method code standard (GB/T 50123-2019) [32], the UCS test was performed with strain-controlled loading, and the loading rate was 1 mm/min.

2.2.2. SEM Test

The SEM (scanning electron microscope) was tested by JSM-6360LV high and low vacuum scanning electron microscope. Due to the poor conductivity of FCMS geotechnical materials, it is necessary to spray plating on the surface of the sample, otherwise the charge will accumulate during the test, which will affect the stability of observation. In this experiment, a platinum film was plated on the surface of the sample by ion diffraction technique. The SEM tests of FCMS with 0%, 0.5% and 1% fiber content under 0, 5 and 10 F–T cycles were carried out.

2.2.3. Meso Random Damage Model

In order to further explore the mechanical properties of the FCMS during F–T cycles, a stress–strain model must be established. According to the UCS test results of the FCMS after various F–T cycles, it can be concluded that the specimen experienced a shear failure and its stress–strain curve was a softening curve. Therefore, the meso damage model could be used to explore the damage changes produced by F–T cycles. The calculation principle is shown in Figure 3 [33,34].
The meso random damage theory assumes that a uniaxial compression specimen consists of a series of meso springs, as shown in Figure 3. When the specimen is subjected to external force, the micro spring will deform. When the deformation value exceeds the spring limit, the spring will break and shear slip, which will produce a damage effect in the specimen.
From Figure 3, the stress–strain relationship of F–T damage can be established, as shown in Equation (1) [33,34]:
σ = ( 1 D ) E ε ,
where D is the compression damage variable, E is the elastic modulus and ε is the compressive strain.
Considering the randomness of damage, the mean and variance of stress can be further obtained, as shown in Equations (2) and (3) [33,34]:
μ σ = ( 1 μ D ) E ε ,
V σ = V D E ε ,
where μ D is the mean value of compression damage variables and V D is the variable variance of compression damage; their expressions are shown in Equations (4) and (5), respectively:
μ D = ( 1 β 1 ) μ D s 1 β 1 μ D s ,
V D 2 = d D d D s 2 V D s 2 .
From Equation (4), the expression of β is shown in Equation (6) [33,34]:
β = 1 1 + μ 2 sin 2 2 α ,
where μ is Poisson’s ratio and α is the shear failure angle.
Because the unconfined compression failure of the FCMS was a typical shear failure, the mean value of the shear damage variable was as shown in Equation (4), where Ds is the shear damage variable. Three important parameters λ, ζ and ω in Ds can be solved according to [35].

2.3. Analysis of UCS Test Results

After the F–T cycles occurred during the UCS test, the failure mode of the FCMS was determined, as shown in Figure 4.
From Figure 4, the failure mode of the sample was a typical shear failure and the shear angle caused by the failure was 35°. Figure 5 shows the stress–strain curve of the FCMS during various F–T cycles and with various fiber content.
Figure 5 also shows that the stress–strain curves have noticeable peaks, which are softening curves. The change trends of the stress–strain curves of the FCMS remained approximately the same during different F–T cycles. During the same F–T cycles, the stress of the modified construction slurry with different fiber content appeared to have a noticeable peak value, and the stress decreased after the peak. The peak stress of the modified construction slurry with 0% fiber content was noticeable before five F–T cycles, but not after 10 cycles. An increase in the number of F–T cycles changed the peak strain of all fiber content modified slurries. During the 10th F–T cycle, peak strain clearly increased and the tangent slope of the stress–strain curve gradually decreased. At this time, the curve gradually flattened, the brittleness of soil is improved, and its elastic modulus also decreased.
According to the stress–strain curves in Figure 5, UCS q of the FCMS with different fiber content and different F–T cycles was obtained, as shown in Figure 6.
Figure 6 shows that, with the increase of F–T cycles, the maximum stress of the FCMS with different fiber content first decreased and then increased. When the F–T cycles changed from 1 to 5, q decreased, and the modified construction slurry with 0% and 1% fiber content decreased the most rapidly. When the fiber content was 0% and the F–T cycles increased from 3 to 5, the strength loss was 34%. The strength loss was 28% when the fiber content was 1% and the F–T cycles increased from 1 to 3. In the early stage of the F–T cycle, the internal damage of the sample noticeably changed, which led to the continuous reduction of UCS.
When the F–T cycles increased from 5 to 10, the strength q increases with the increase of fiber content. When the number of F–T cycles was 10, the curing age of the FCMS increased to 20 days, which led to a more complete hydration of the cement, increased the cross-section effect between fiber and cement-modified construction slurry and improved the strength of the FCMS to a certain extent. When fiber content was 0.75%, the strength improvement effect was the highest. The strength q increased to 38%. When fiber content was 0.25%, the strength improvement effect was the lowest, but the strength q also increased by 11%. In general, the addition of fiber improved the frost resistance of the FCMS.
According to the stress–strain curve in Figure 5, taking the tangent slope of the rising phase of the stress–strain curve as the elastic modulus of FCMS, the values are shown in Table 2.
Table 2 shows that, with the same F–T cycles, the elastic modulus of the FCMS gradually increased when fiber content increased. With the increase of F–T cycles, the elastic modulus of the FCMS with the same fiber content gradually decreased. At 0–5 F–T cycles, the elastic modulus of the FCMS decreased by 80%.

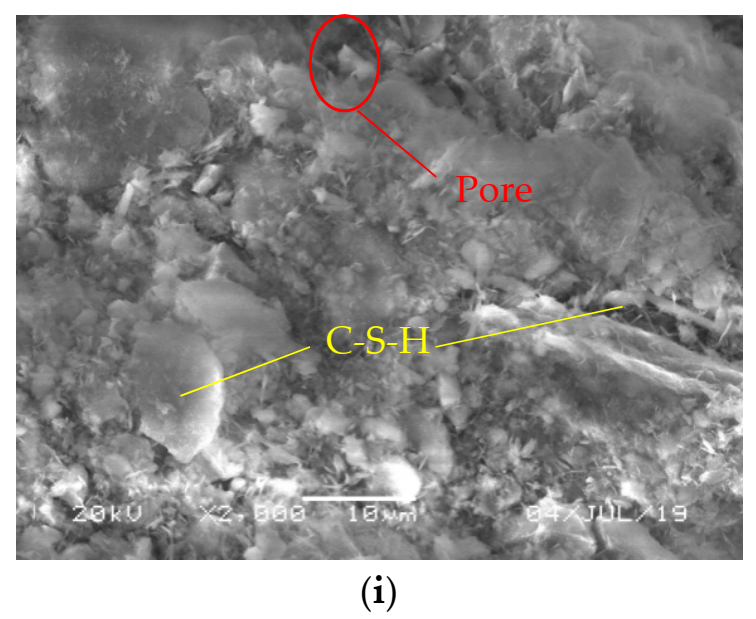
2.4. SEM Test Results

The mechanical properties of a material are affected by its microstructure [5,8]. A scanning electron microscope (SEM) is a common tool used for material microstructure analysis [9]. The influence of F–T cycles on the microstructure of the FCMS is shown in Figure 7 below.
Figure 7a,d,g show that with the increase of fiber content, the pores on the microstructure surface of the sample decrease, and more structural aggregate and milky white cementitious material C-H-S are accumulated. Polypropylene fiber plays the role of skeleton in the sample structure, which mainly improves the internal cementation and compactness of the structure. Due to the high water content in the FCMS, the water in the sample was transformed into ice by freezing, which led to the volume of the sample expanding, and the water content migrating and producing tensile stress. However, when the ice melted into water, the strength of the sample decreased, resulting in damage to the sample. Figure 7b,e,h show several pores present in the SEM images. Due to the interface strength between the fiber and the matrix material, the fiber was able to absorb an amount of energy during the F–T process, so that after adding fiber, the influence of the F–T cycle was reduced. In addition, due to the continual hydration of cement during F–T cycles, fibrous silicate cementitious material (C-S-H) was produced in the sample after 5 F–T cycles. With the increase in F–T cycles, the amount of C-S-H continued to increase and form a group that can be seen in Figure 7c,f,i. The C-S-H was able to fill the pores created by the F–T cycle to an extent, which slightly increased the strength of the FCMS, and the elastic modulus tended to be stable.

3. F–T Damage Model of FCMS

3.1. Two-Stage F–T Damage Model of the FCMS

According to the FCMS unconfined compression test results, the damage process of the sample can be summarized as follows. The first stage is the F–T damage caused by the F–T cycles and the specific change rule can be expressed by the change of elastic modulus according to Table 2. The second stage is the uniaxial compression damage caused by the unconfined compression test, which can be defined by the damage variable in Equation (1).
According to the unconfined compressive stress–strain curve characteristics of the FCMS, the power function can be used to establish the relationship between F–T damage and F–T cycles, as shown in Equation (7):
E = a N b ,
where N is the number of F–T cycles, and a and b are F–T damage factors.
The damage effect of F–T cycles on the FCMS can be obtained as shown in Figure 8.
Figure 8 shows that the elastic modulus noticeably decreased during 0–5 F–T cycles and tended to decrease slowly with the increase of F–T cycles. During the same F–T cycles, the elastic modulus increased with the increase of fiber content. The relationship between the elastic modulus of the FCMS and the number of F–T cycles satisfied the power function (their R2 was all greater than 0.85).

3.2. Particle Swarm Optimization

In order to determine the values of λ, ζ and ω, the interval discretization of the strain values corresponding to the stress–strain curve was performed according to the unconfined compression test results of the F–T cycles, and the stress mean value and variance corresponding to each point of strain were calculated. Thus, we established the objective function as shown in Equation (8):
( μ σ μ σ j ) 2 min ( V σ V σ j ) 2 min .
Constraints of Equation (8) are shown in Equation (9),
λ < 0 ζ > 0 ω > 0 max ( μ σ ) max ( μ σ j ) max ( μ σ j ) 5 % .
Because it was challenging to calculate λ, ζ and ω in Equation (8), PSO was used to solve them. PSO was proposed by Kennedy and Eberhart in 1995 and is a theory that uses biological intelligence and an evolutionary algorithm based on the simulation of the foraging behavior of birds [36]. It has the advantages of fast convergence speed, few setting parameters and easy operation. According to reference [27], the penalty function can be used to introduce constraints into the objective function, so the fitness function of the PSO algorithm can be established as in Equation (10).
z = j = 1 m ( μ σ μ σ j ) 2 m + l q i r ,
where m is the number of data points obtained from the UCS test and l q i r is the penalty function. According to reference [27], the values set for l and r were 1000 and 2, and qi can be calculated using Equation (11).
q 1 = max ( 0 , λ ) q 2 = max ( 0 , ζ ) > 0 q 3 = max ( 0 , ω ) > 0 q 4 = max ( max ( μ σ ) max ( μ σ j ) 5 % max ( μ σ j ) , 0 ) .
The specific flow chart of PSO is shown in Figure 9, where pbest is the best position of the particle [29]. In any evolution process, each particle will produce the calculation result of the objective function, which is called the fitness value. The current fitness value of the particle is compared with the fitness value obtained in the previous evolution process, and the minimum value is selected as the optimal pbest.
The main parameters in PSO are population size, evolution times, particle velocity V and parameters c1 and c2. Parameters c1 and c2 and particle velocity V were determined by reference [29].
Values of the parameters of PSO are shown in Table 3. If the fitness function value is less than or equal to 2 kPa, which corresponds to the test accuracy of the instrument, PSO will stop running; otherwise, it will run during each evolution time.
The calculation results of the elastic modulus in Equation (7) were substituted into Equations (2) and (3). Taking Equation (8) as the objective function and using the PSO algorithm for the fitting calculation, the parameters λ, ζ and ω in the F–T damage model can be obtained. The results are shown in Table 4.
The data in Table 4 are substituted into Equations (2) and (3) and compared with the stress–strain curve obtained from the UCS test after F–T cycles. Some comparison results are shown in Figure 10.
Table 4 and Figure 10 show that the primary test points of the FCMS are distributed within the range of the mean stress plus and minus one times the variance, and the maximum average error was 54 kPa. This shows that the meso random damage model can characterize the stress–strain relationship of the FCMS in the process of uniaxial compression after F–T cycles.

4. Mechanism Analysis of F–T Damage

According to the parameter calculation results in Table 4, the damage variables of different fiber content and different F–T cycles could be calculated according to Equation (4), and the calculation results are shown in Figure 11.
Figure 11 shows the following. (1) The damage variable of the FCMS increases when the strain increases, and a region exists where the damage increases rapidly. With the increase of F–T cycles, the strain corresponding to the initial damage increases, which is primarily due to the transverse cracks in the specimen caused by F–T cycles. When axial pressure is applied, a larger strain is required to close cracks and damage stress is generated in the specimen. (2) Under the same strain conditions, the damage variable value decreases with the increase in the number of F–T cycles. After 0–5 F–T cycles, the increase of fiber causes the damage mean curve to become more concentrated and the damage variable increases when the strain is equal to 4%. After 10 F–T cycles, the pore structure of the sample is widened, and a larger strain is required to damage the sample. This shows that the addition of fiber stabilizes the sample structure and also increases its frost resistance.

5. Conclusions and Discussion

The strength and stiffness characteristics of the FCMS were studied using UCS after generating a number of F–T cycles. The parameters of the meso random damage model were identified using the penalty function of the PSO algorithm so as to establish the two-stage F–T damage stress–strain relationship of the FCMS and determine the quantitative evaluation of the mechanical indexes of the FCMS. The damage mechanism was analyzed by combining the change of the damage variable, and the following conclusions were obtained.
(1)
The mechanical properties of the FCMS at room temperature and in the F–T environment were significantly improved by the presence of fiber content. Undergoing the same number of F–T cycles, the strength of the FCMS increased when fiber content was increased. When the fiber content was 1%, the strength increased to 17.9% higher than that of modified construction slurry with 0.75% fiber content. The UCS of the FCMS decreased continually when the number of F–T cycles increased from 0 to 5. When the number of F–T cycles increased from 5 to 10, the UCS of the modified construction slurry was improved by adding fiber. When the fiber content was between 0.5% and 0.75%, the loss of UCS of the FCMS decreased with the increase of F–T cycles, which indicates that the addition of fiber can significantly improve the frost resistance of modified construction slurry.
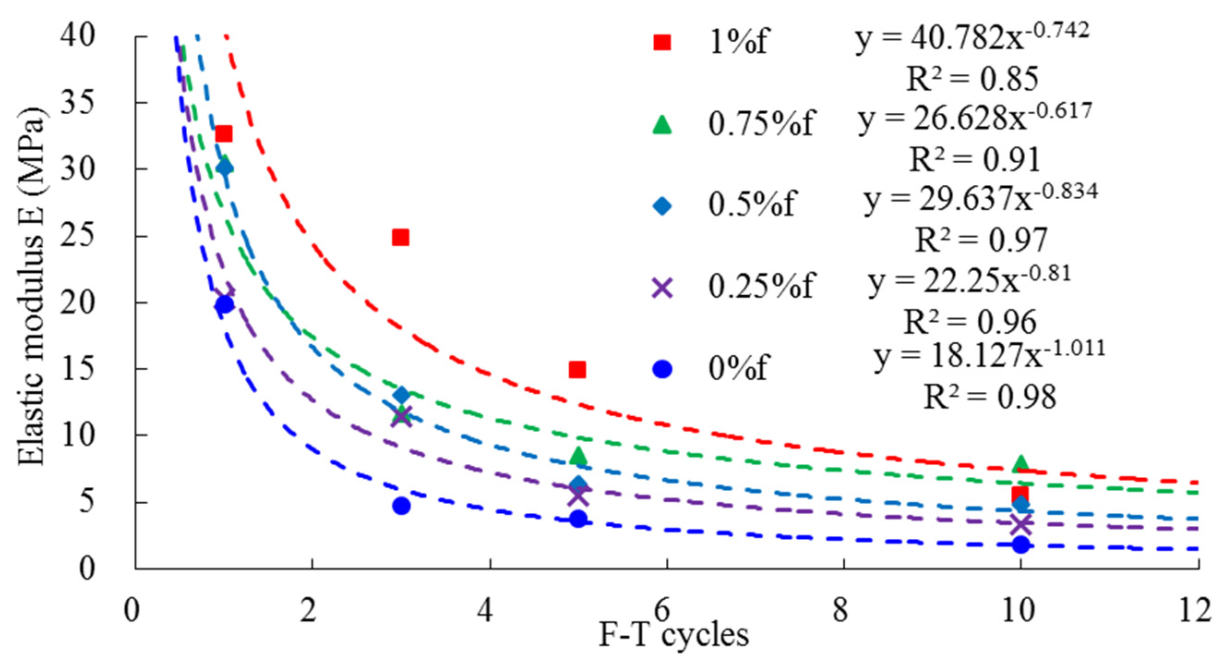
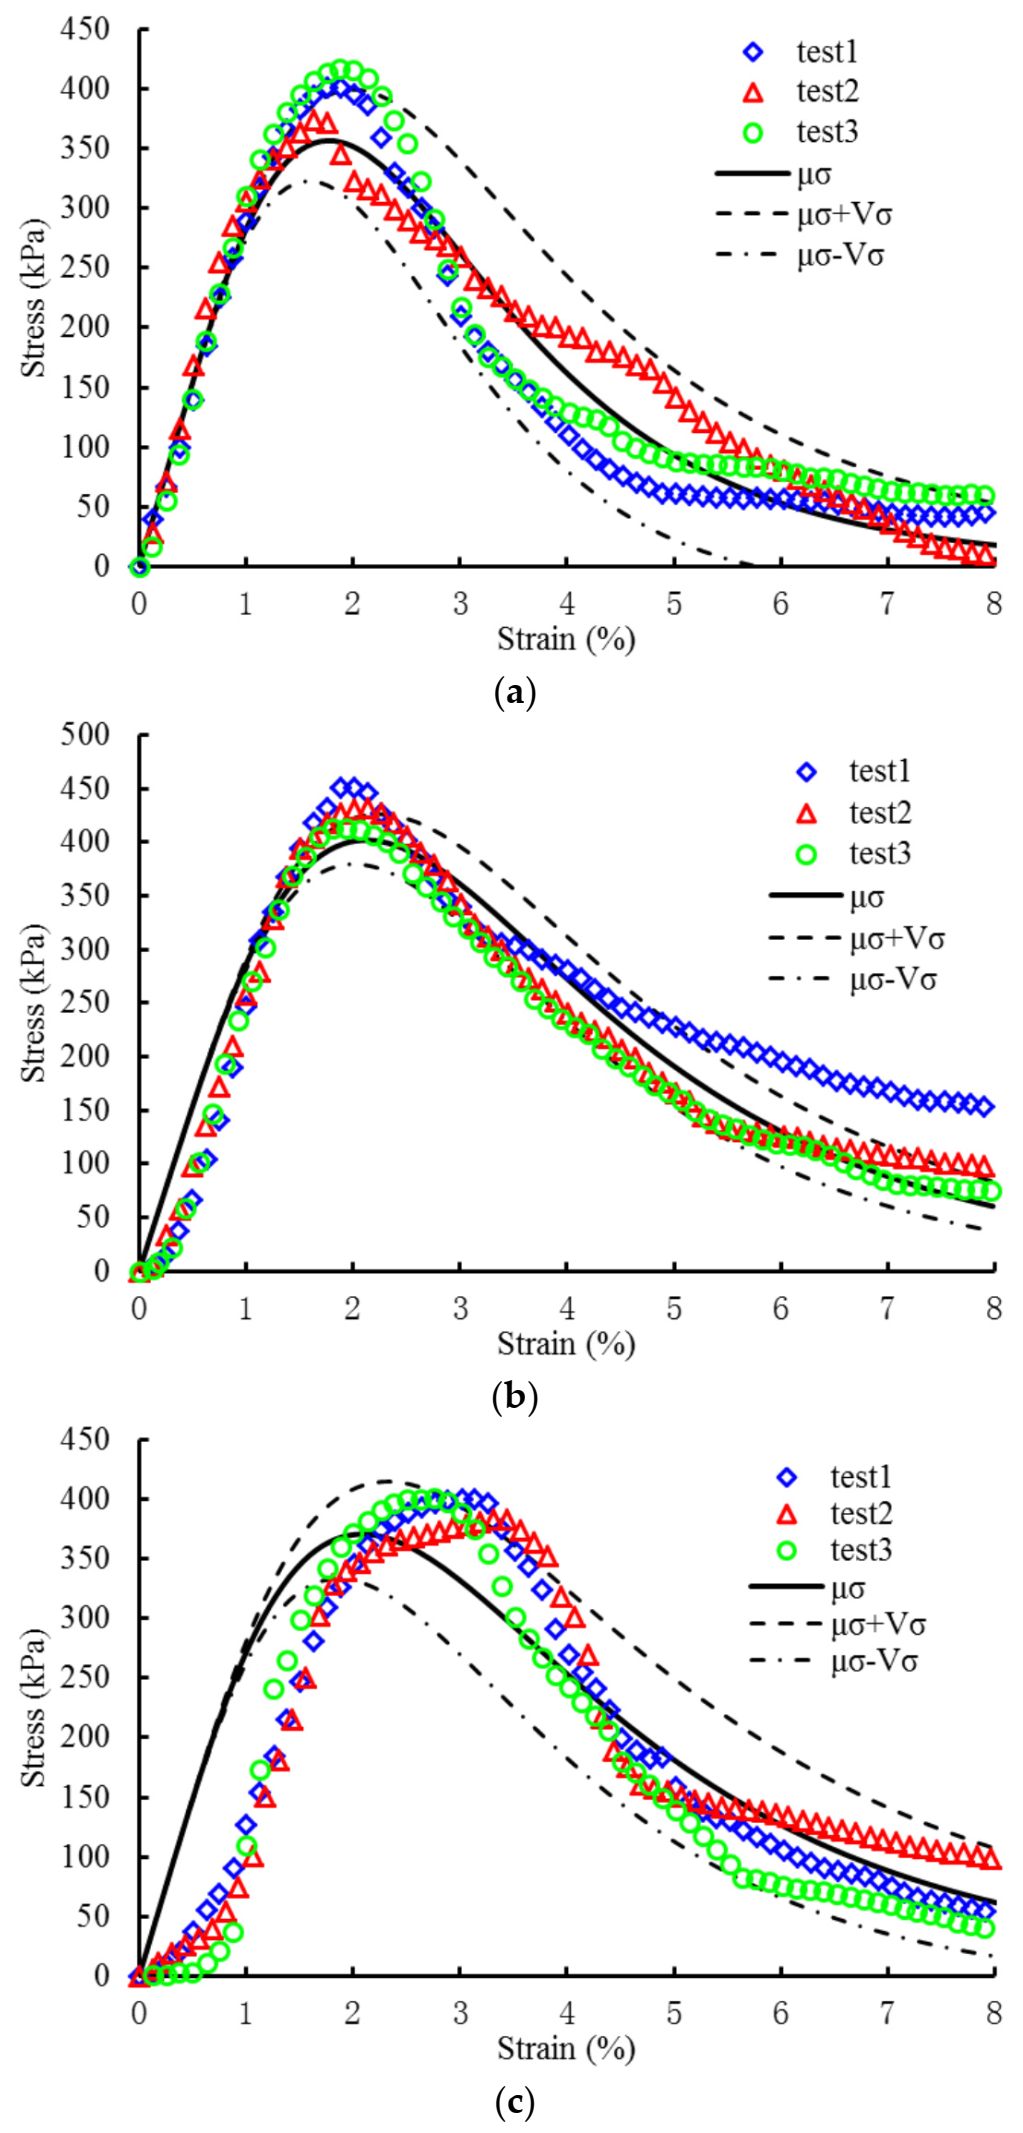
(2)
With the increase of F–T cycles, the elastic modulus of the FCMS gradually decreased and satisfied the power function. The parameters of the meso random damage model were then obtained using the PSO algorithm to establish the stress–strain relationship of the FCMS. Compared with the test results, the mean value of the experimental stress could be in the range of plus and minus one times the variance of the fitting curve. These results show that the two-stage damage model proposed in this paper can better characterize the stress–strain characteristics of the FCMS uniaxial compression F–T damage.
(3)
The damage variable of the FCMS with the same fiber content decreased with the increase of F–T cycles. The addition of fiber can improve the frost resistance of the FCMS. When the content of fiber is 0.75%, frost resistance was highest.
The two-stage stress–strain model of the FCMS was established using the UCS test during F–T cycles. It should be noted that:
(1)
PSO was successfully used to identify parameters of the meso random damage model for the FCMS during F–T cycles, retaining wall design [27], concrete frame design [28] and bridge engineering [29,30]. However, civil engineering materials are polyphase materials [37,38,39] and are based on the no free lunch theorem [31]. Whether PSO theory is suitable for other fields of civil engineering remains to be studied.
(2)
In addition to PSO, other algorithms exist, such as the genetic algorithm [40], simulated annealing algorithm [41] and ant colony algorithm [42], which can identify model parameters. Although PSO can produce satisfactory results, the parameter identification algorithm used to investigate the most suitable meso random damage model of the FCMS during F–T cycles needs further study.
(3)
This study discusses only the mechanical properties of the FCMS during F–T cycles with water content of construction slurry at 100%. Additional research on the water content of construction slurry, such as optimal water content, plastic limit and liquid limit need further study.
(4)
As nano materials can improve the mechanical properties of soil [43,44], it is necessary to study their application in slurry modification.

Author Contributions

Conceptualization, W.W. and B.Q.; investigation, N.L., P.J. and Y.W.; writing—original draft preparation, P.J.; writing—review and editing, L.Z. and F.Z. All authors have read and agreed to the published version of the manuscript.

Funding

This research was funded by the National Natural Science Foundation of China (Grant number [41772311]), the Zhejiang Provincial Natural Science Foundation of China (Grant number [Q20E080042]), the Open Research Fund of Key Laboratory of Ministry of Education for Geomechanics and Embankment Engineering of Hohai University (Grant number [2019020]) and the Open Research Fund of State Key Laboratory of Geomechanics and Geotechnical Engineering, Institute of Rock and Soil Mechanics, Chinese Academy of Science (Grant number [Z017013]).

Conflicts of Interest

The authors declare no conflict of interest.

References

  1. Biswal, D.R.; Sahoo, U.C.; Dash, S.R. Durability and shrinkage studies of cement stabilized granular lateritic soils. Int. J. Pavement Eng. 2019, 20, 1451–1462. [Google Scholar] [CrossRef]
  2. Abdellatif, E.; Mostafa, B.; Bruno, B.; Thomas, G. In situ effectiveness of alkaline and cementitious amendments to stabilize oxidized acid-generating tailings. Minerals 2019, 9, 314. [Google Scholar]
  3. Ke, R.; Wang, H.X.; Tan, Y.Z.; Wang, L.H. Solidification of high organic matter content sludge by cement, lime and metakaolin. Period. Polytech. Civ. 2019, 63, 53–62. [Google Scholar]
  4. Tobias, D.; Ulla, H.J.; Mette, R.G. Mineralogical sequence of self-healing products in cracked marine concrete. Minerals. 2019, 9, 284. [Google Scholar]
  5. Liu, Y.; Jiang, Y.; Xiao, H.; Lee, F.H. Determination of representative strength of deep cement-mixed clay from core strength data. Géotechnique 2017, 67, 350–364. [Google Scholar] [CrossRef]
  6. Yao, K.; Chen, Q.S.; Ho, J.H.; Xiao, H.W.; Lee, F.H. Strain-dependent shear stiffness of cement-treated marine clay. J. Mater. Civ. Eng. 2018, 30, 04018255. [Google Scholar] [CrossRef]
  7. Jiang, P.; Qiu, L.Q.; Li, N.; Wang, W.; Zhou, A.Z.; Xiao, J.P. Shearing performance of lime reinforced iron tailing powder based on energy dissipationl. Adv. Civ. Eng. 2018, 2018, 4748526. [Google Scholar]
  8. Wang, W.; Li, N.; Zhang, F.; Zhou, A.Z.; Chi, S. Experimental and mathematical investigations on unconfined compressive behavior of coastal soft soil under complicated freezing processes. Pol. Marit. Res. 2016, 23, 112–116. [Google Scholar] [CrossRef] [Green Version]
  9. Yao, K.; Li, N.; Chen, D.H.; Wang, W. Generalized hyperbolic formula capturing curing period effect on strength and stiffness of cemented clay. Constr. Build. Mater. 2019, 199, 63–71. [Google Scholar] [CrossRef]
  10. Wang, W.; Zhang, C.; Li, N.; Tao, F.F.; Yao, K. Characterisation of nano magnesia-cement-reinforced seashore soft soil by direct-shear test. Mar. Georesour. Geotec. 2019, 37, 989–998. [Google Scholar] [CrossRef]
  11. Wang, Y.X.; Guo, P.P.; Li, X.; Lin, H.; Liu, Y.; Yuan, H.P. Behavior of fiber-reinforced and lime-stabilized clayey soil in triaxial tests. Appl. Sci. 2019, 9, 900. [Google Scholar] [CrossRef] [Green Version]
  12. Ma, Q.Y.; Gao, C.H. Effect of basalt fiber on the dynamic mechanical properties of cement-soil in SHPB test. J. Mater. Civ. Eng. 2018, 30, 04018185. [Google Scholar] [CrossRef]
  13. Tran, K.Q.; Satomi, T.; Takahashi, H. Effect of waste cornsilk fiber reinforcement on mechanical properties of soft soils. Transp. Geotech. 2018, 16, 76–84. [Google Scholar] [CrossRef]
  14. Tajdini, M.; Bonab, M.H.; Golmohamadi, S. An experimental investigation on effect of adding natural and synthetic fibres on mechanical and behavioural parameters of soil-cement materials. Int. J. Civ. Eng. 2018, 16, 353–370. [Google Scholar] [CrossRef]
  15. Liu, J.K.; Wang, T.L.; Tian, Y.H. Experimental study of the dynamic properties of cement- and lime-modified clay soils subjected to freeze-thaw cycles. Cold Reg. Sci. Technol. 2010, 61, 29–33. [Google Scholar] [CrossRef]
  16. Jahandari, S.; Saberian, M.; Tao, Z.; Mojtahedi, S.F.; Li, J.; Ghasemi, M.; Li, W.G. Effects of saturation degrees, freezing-thawing, and curing on geotechnical properties of lime and lime-cement concretes. Cold Reg. Sci. Technol. 2019, 160, 242–251. [Google Scholar] [CrossRef]
  17. Shihata, S.A.; Baghdadi, Z.A. Simplified method to asses freeze-thaw durability of soil cement. J. Mater. Civ. Eng. 2001, 13, 243–247. [Google Scholar] [CrossRef]
  18. Boz, A.; Sezer, A. Influence of fiber type and content on freeze-thaw resistance of fiber reinforced lime stabilized clay. Cold Reg. Sci. Technol. 2018, 151, 359–366. [Google Scholar] [CrossRef]
  19. Ding, M.T.; Zhang, F.; Ling, X.Z.; Lin, B. Effects of freeze-thaw cycles on mechanical properties of polypropylene Fiber and cement stabilized clay. Cold Reg. Sci. Technol. 2018, 154, 155–165. [Google Scholar] [CrossRef]
  20. Kachanov, L.M. Time of the rupture process under creep conditions, Izv Akad. Nauk USS R Otd Techn Nauk. 1958, 8, 26–31. [Google Scholar]
  21. Rabotnov, Y.N. On the equations of state for creep. Prog. Appl. Mech. 1963, 178, 307–315. [Google Scholar]
  22. Engelbrecht-Wiggans, A.; Phoenix, S.L. A stochastic model based on fiber breakage and matrix creep for the stress-rupture failure of unidirectional continuous fiber composites. Int. J. Fract. 2019, 217, 1–34. [Google Scholar] [CrossRef] [Green Version]
  23. Magri, M.; Lemoine, G.; Adam, L.; Segurado, J. A coupled model of diffusional creep of polycrystalline solids based on climb of dislocations at grain boundaries. J. Mech. Phys. Solids 2020, 135, 103786. [Google Scholar] [CrossRef] [Green Version]
  24. Lemaitre, J. Application of damage concepts to predict creep-fatigue failure. J. Eng. Mater. Technol. 1979, 101, 202–209. [Google Scholar] [CrossRef]
  25. Kajcinovic, D. Continuum damage theory of brittlematerials. J. Appl. Mech. 1981, 48, 809–824. [Google Scholar]
  26. Zheng, Y.; Liao, Y. Parameter identification of nonlinear dynamic systems using an improved particle swarm optimization. Optik 2016, 127, 7865–7874. [Google Scholar] [CrossRef]
  27. Khajehzadeh, M.; Raihan, T.M.; El-Shafie, A.; Eslami, M. Modified particle swarm optimization for optimum design of spread footing and retaining wall. J. Zhejiang Univ. Sci. A 2011, 6, 3–15. [Google Scholar] [CrossRef]
  28. Kaveh, A.; Sabzi, O.A. Comparative study of two meta-heuristic algorithms for optimum design of reinforced concrete frames. Int. J. Civ. Eng. 2011, 9, 193–206. [Google Scholar]
  29. Galvan-Nunez, S.; Attoh-Okine, N. Hybrid particle swarm optimization and K-Means analysis for bridge clustering based on national bridge inventory data. J. Risk Uncertain. Eng. Syst. Part A Civ. Eng. 2017, 3, F4016001. [Google Scholar] [CrossRef]
  30. You, T.; Jin, H.; Li, P. Optimal placement of wireless sensor nodes for bridge dynamic monitoring based on improved particle swarm algorithm. Int. J. Distrib. Sens. Netw. 2013, 9, 390936. [Google Scholar] [CrossRef]
  31. Wolpert, D.H.; Macready, W.G. No free lunch theorems for optimization. IEEE Trans. Evol. Comput. 1997, 1, 67–82. [Google Scholar] [CrossRef] [Green Version]
  32. Chinese Code. Standard for Geotechnical Testing Method (GB/T 50123-2019); China Planning Press: Beijing, China, 2019. [Google Scholar]
  33. Li, J. A review on the constitutive model for static and dynamic damage of concrete. Adv. Mech. 2010, 40, 284–297. [Google Scholar]
  34. Kandarpa, S.; Kirkner, D.J.; Spencer, B.F. Stochastic damage model for brittle materials subjected to monotonic loading. J. Eng. Mech. ASCE 1996, 8, 788–795. [Google Scholar] [CrossRef]
  35. Li, J.; Ren, X. Recent developments on stochastic damage mechanics for concrete. J. Build. Struct. 2014, 35, 20–29. [Google Scholar]
  36. Kennedy, J.; Eberhart, R. Particle swarm optimization. In Proceedings of the ICNN’95-International Conference on Neural Networks (IEEE 2002), Perth, WA, Australia, 27 November–1 December 1995. [Google Scholar] [CrossRef]
  37. Paya-Zaforteza, I.; Yepes, V.; Gonzalez-Vidosa, F.; Hospitaler, A. On the Weibull cost estimation of building frames designed by simulated annealing. Meccanica 2010, 45, 693–704. [Google Scholar] [CrossRef]
  38. Li, K.Q.; Li, D.Q.; Liu, Y. Meso-scale investigations on the effective thermal conductivity of multi-phase materials using the finite element method. Int. J. Heat Mass Tran. 2020, 151, 119383. [Google Scholar] [CrossRef]
  39. Yao, K.; An, D.L.; Wang, W.; Li, N.; Zhang, C.; Zhou, A.Z. Effect of nano-mgo on mechanical performance of cement stabilized silty clay. Mar. Georesour. Geotec. 2020, 20, 250–255. [Google Scholar] [CrossRef]
  40. Phutthananon, C.; Jongpradist, P.; Jongpradist, P.; Dias, D.; Baroth, J. Parametric analysis and optimization of T-shaped and conventional deep cement mixing column-supported embankments. Comput. Geotech. 2020, 122, 103555. [Google Scholar] [CrossRef]
  41. Wang, L.; Liu, Y.Q. Application of simulated annealing particle swarm optimization based on correlation in parameter identification of induction motor. Math. Probl. Eng. 2018, 2018, 1869232. [Google Scholar] [CrossRef]
  42. Koopialipoor, M.; Murlidhar, B.R.; Hedayat, A.; Armaghani, D.J.; Gordan, B.; Mohamad, E.T. The use of new intelligent techniques in designing retaining walls. Eng. Comput. 2020, 36, 283–294. [Google Scholar] [CrossRef]
  43. Li, N.; Lv, S.W.; Wang, W.; Guo, J.; Jiang, P.; Liu, Y. Experimental investigations on the mechanical behavior of iron tailings powder with compound admixture of cement and nano-clay. Constr. Build. Mater. 2020, 254, 119259. [Google Scholar] [CrossRef]
  44. Wang, W.; Li, Y.; Yao, K.; Li, N.; Zhou, A.Z.; Zhang, C. Strength properties of nano-MgO and cement stabilized coastal silty clay subjected to sulfuric acid attack. Mar. Georesour. Geotec. 2019. [Google Scholar] [CrossRef]
Figure 1. Form of test construction slurry.
Minerals 11 00743 g001
Figure 2. Polypropylene fiber.
Minerals 11 00743 g002
Figure 3. Schematic diagram of the UCS test micro spring system.
Minerals 11 00743 g003
Figure 4. Failure diagram of sample after UCS test.
Minerals 11 00743 g004
Figure 5. Stress–strain curves of different F–T cycles. (a) 0% fiber; (b) 0.25% fiber; (c) 0.5% fiber; (d) 0.75% fiber; (e) 1% fiber.
Minerals 11 00743 g005aMinerals 11 00743 g005b
Figure 6. UCS of different fiber content after F–T cycles.
Minerals 11 00743 g006
Figure 7. SEM images of the FCMS with different fiber content after several different F–T cycles. (a) 0% fiber content 0 F–T cycles; (b) 0% fiber content 5 F–T cycles; (c) 0% fiber content 10 F–T cycles; (d) 0.5% fiber content 0 F–T cycles; (e) 0.5% fiber content 5 F–T cycles; (f) 0.5% fiber content 10 F–T cycles; (g) 1% fiber content 0 F–T cycles; (h) 1% fiber content 5 F–T cycles; (i) 1% fiber content 10 F–T cycles.
Minerals 11 00743 g007aMinerals 11 00743 g007b
Figure 8. Elastic modulus of the FCMS under F–T cycles.
Minerals 11 00743 g008
Figure 9. Flow chart of particle swarm optimization.
Minerals 11 00743 g009
Figure 10. Fitting analysis diagram of F–T damage. (a) 0% fiber 0 F–T cycle; (b) 0.25% fiber 0 F–T cycle; (c) 0.5% fiber 1 F–T cycle.
Minerals 11 00743 g010
Figure 11. Damage evolution curves of the FCMS. (a) Damage evolution curves of FCMS with 0% fiber content; (b) Damage evolution curves of FCMS with 0.25% fiber content; (c) Damage evolution curves of FCMS with 0.5% fiber content; (d) Damage evolution curves of FCMS with 0.75% fiber content; (e) Damage evolution curves of FCMS with 1% fiber content.
Minerals 11 00743 g011aMinerals 11 00743 g011b
Table 1. UCS test scheme of fiber cement-modified construction slurry tested during F–T cycles.
Cement Content (%)Fiber Content (%)Curing Age (Days)F–T Cycles
200, 0.25, 0.5, 0.75, 1280, 1, 3, 5, 10
Table 2. Elastic modulus of the FCMS obtained in F–T cycles (MPa).
F–T CyclesFiber Content (%)
00.250.50.751
03131324448
12020303033
34.812131225
53.85.56.38.415
101.93.34.87.85.6
Table 3. Parameters in PSO.
Population SizeEvolution TimesParticle Velocity VmaxParticle Velocity VminC1C2
1002001−11.51.5
Table 4. Fitting table of F–T damage variables.
Fiber Content (%)F–T CyclesλζωAverage Error (kPa)
00−3.760.565022
1−3.400.3920017
3−2.530.225025
5−2.70.21513
10−2.120.141013
0.250−3.640.6226030
1−3.330.4212533
3−2.870.291554
5−2.540.268.535
10−2.110.091810
0.50−3.530.5716518
1−3.690.657535
3−3.070.5215021
5−2.630.3110027
10−2.280.181029
0.750−3.870.6250039
1−3.720.7542525
3−3.080.345530
5−2.930.412023
10−2.560.352538
10−3.780.718829
1−3.680.556038
3−3.710.6319040
5−3.30.5915031
10−2.170.322751
Publisher’s Note: MDPI stays neutral with regard to jurisdictional claims in published maps and institutional affiliations.

