Article

Production Technologies of Ancient Bricks from Padua, Italy: Changing Colors and Resistance over Time

by
Elena Mercedes Pérez-Monserrat
1,*,
Lara Maritan
1,
Enrico Garbin
2 and
Giuseppe Cultrone
3
1
Department of Geosciences, University of Padua, 35131 Padua, Italy
2
Inter-Departmental Research Centre for the Study of Cement Materials and Hydraulic Binders (CIRCe Centre), University of Padua, 35131 Padua, Italy
3
Department of Mineralogy and Petrology, Faculty of Sciences, University of Granada, 18071 Granada, Spain
*
Author to whom correspondence should be addressed.
Minerals 2021, 11(7), 744; https://doi.org/10.3390/min11070744
Submission received: 18 June 2021 / Revised: 6 July 2021 / Accepted: 7 July 2021 / Published: 9 July 2021
(This article belongs to the Special Issue Colours in Minerals and Rocks)

Abstract

:
Representative and very uneven texturally bricks having yellow/beige or pale or dark red colors from the Renaissance walls (16th century) of Padua, Northeast Italy, were studied by means of colorimetric, petrographic (MOP), chemical (XRF), mineralogical (PXRD) and microstructural analysis (FESEM-EDS). Starting from the color measurements of the ceramic bodies, the manufacturing technologies and their influence on the physical behavior and durability of the bricks were established. The porous system was characterized by means of hygric tests and mercury intrusion porosimetry; the compactness and structural anisotropy were defined through ultrasound velocity; the uniaxial compressive strength was determined; and durability to salt crystallization and frost action of the bricks was assessed. Mg- and Ca-rich illitic clays fired at temperatures ≥900 °C were used to manufacture the beige hue bodies, while the pale red bricks were made out with Ca- and Fe-rich illitic clays fired at 850–900 °C. A lower carbonate content on the base clays and a lower firing temperature were the main causes responsible for the changing colors from beige to red hue. The increase of the red color was associated to higher silicate inclusions content and lower development of reaction rims around grains. The low sintering degree achieved yielded highly porous bodies with diverse porous systems, leading to differential physical performance and durability of the bricks that may turn out beneficial for the conservation of the historic walls.

1. Introduction

When production technologies of ancient bricks are addressed, the color represents a macroscopic feature that provides approximative information of firing dynamics and compositional dynamics [1]. The final color of the ceramic bodies depends on the raw clays’ composition and on the degree of ceramic transformation during firing, which is mainly conditioned by temperature, time and redox environment inside the furnaces [2]. The colors of the ceramics may vary from white/off-white hue, indicating that Fe-free raw clays were fired in oxidizing conditions, to grey and black hues if the raw materials contained iron oxides and hydroxides or organic and/or Fe-bearing base clays fired in reducing conditions [3,4,5].
Between these two extremes, ceramic materials may display a wide range of colors and hues (from yellow, beige and red to dark brown and purple colors). Yellow/beige ceramic bodies result when carbonate rich clays (defined also as calcareous clays) are fired between 700 to 1000 °C, yielding calcium pyroxenes and melilite phases [6,7]. To obtain light hue pastes, Al-species must be present, and a significant Si-rich glassy phase should have developed [8].
On the other hand, even in low concentrations, hematite might be responsible for the red colors of ceramic pastes [9]. Iron oxides, present in the raw materials and/or developed during firing from the breakdown of Fe-bearing minerals within illitic and/or chloritic clays, dye the ceramic bodies in red [10,11].
When texturally very heterogeneous ceramic bodies are studied, the color may represent the only primary common feature and its quantitative measurement can be suitable for performing a preliminary classification to state some analogies on the manufacturing processes [12]. Moreover, when ancient bricks are intended to be reproduced, the knowledge of the color range that adjusts with the aesthetical features of the original bricks entails a useful quality check tool [13]. Besides the searching of a specific aesthetical result in order to shape the urban coloring, the final color of ancient bricks may be likewise the consequence of intentional practices. For instance, the use of carbonate-rich clays or the addition of powdered carbonates to lower the starting sintering temperatures [14], the adding of non-plastic materials (tempers) to improve the properties of the ceramics products [15] or the mix of different clayey materials, a technique used to achieve more workable paste or specific aesthetic results [16,17].
Brick manufacturing technologies were largely conditioned by the typology of construction [18]. Defensive structures were usually built quite urgently and had to be highly resistant [19]. Raw clays from the close vicinity were normally used and, due to the significant number of necessary bricks, several brickworks were involved. Conversely, historical defensive walls were normally built with quite heterogeneous materials and have been largely exposed to decay agents. Hence, these constructions can be considered as outdoor laboratories that may allow a better understanding of the physical behavior and durability of their constitutive materials.
As the color largely depends on the composition of the raw material and the development of high-temperature phases, that together with the sintering of the groundmass provides strength to the bodies, the link between the color and the physical behavior and durability of bricks can be established. Therefore, with increasing temperature, newly crystalized mineral phases are formed and a glassy phase that reduces pores interconnectivity is developed [20]. The porosity is the main factor that controls the mechanical resistance and hygric behavior of bricks and there is normally an inverse correlation between porosity and durability [21]. Hence, the decrease of porosity with increasing temperature leads to more compact and texturally uniform bodies, as porosity and anisotropy are gradually decreased [22]. Thus, the fluids circulation inside the porous system, representing the main cause involved in the majority of the decay processes, is reduced [23].
Starting from the color measurement of historic bricks from the Renaissance walls of Padua (Northeast Italy), the main aim of the present research is to establish the production technologies of such a type of materials by a multi-analytical approach and to define their influence on the physical performance (interpreted both as hygric and mechanical behavior) and durability of the bricks.
The preliminary grouping, based on color measurements, represented the starting point for deepening the knowledge concerning some common production technologies of historic bricks with very different textures. The main conclusions are: (i) the values of the chromatic coordinates (a* and b*) represent markers of the mineralogical phases formed during the firing process, hence of the approximative base clays composition and firing temperatures, (ii) the very heterogeneous textures of the bricks (both within each sample and among all the bricks) are the result of different production processes, this is an expected issue considering that bricks were manufactured for a defensive construction, (iii) when considering the physical performance and durability of yellow/beige bricks, obtained from the firing at high temperatures of carbonate-rich clays, the compactness may be lower than expected. Therefore, the link between the color and their hygric, mechanical properties and their resistance over time cannot be always clearly defined.
The study of the historic bricks from the Renaissance walls of Padua has been addressed with an interdisciplinary approach that has comprised the collection of some general data, on-site works and the performing of a multi-analytical study (Figure 1). This study aims to highlight the important role of clay bricks in the built heritage of the city and to be part of the citizen awareness for the preservation of such a defensive complex and its immediate surroundings.

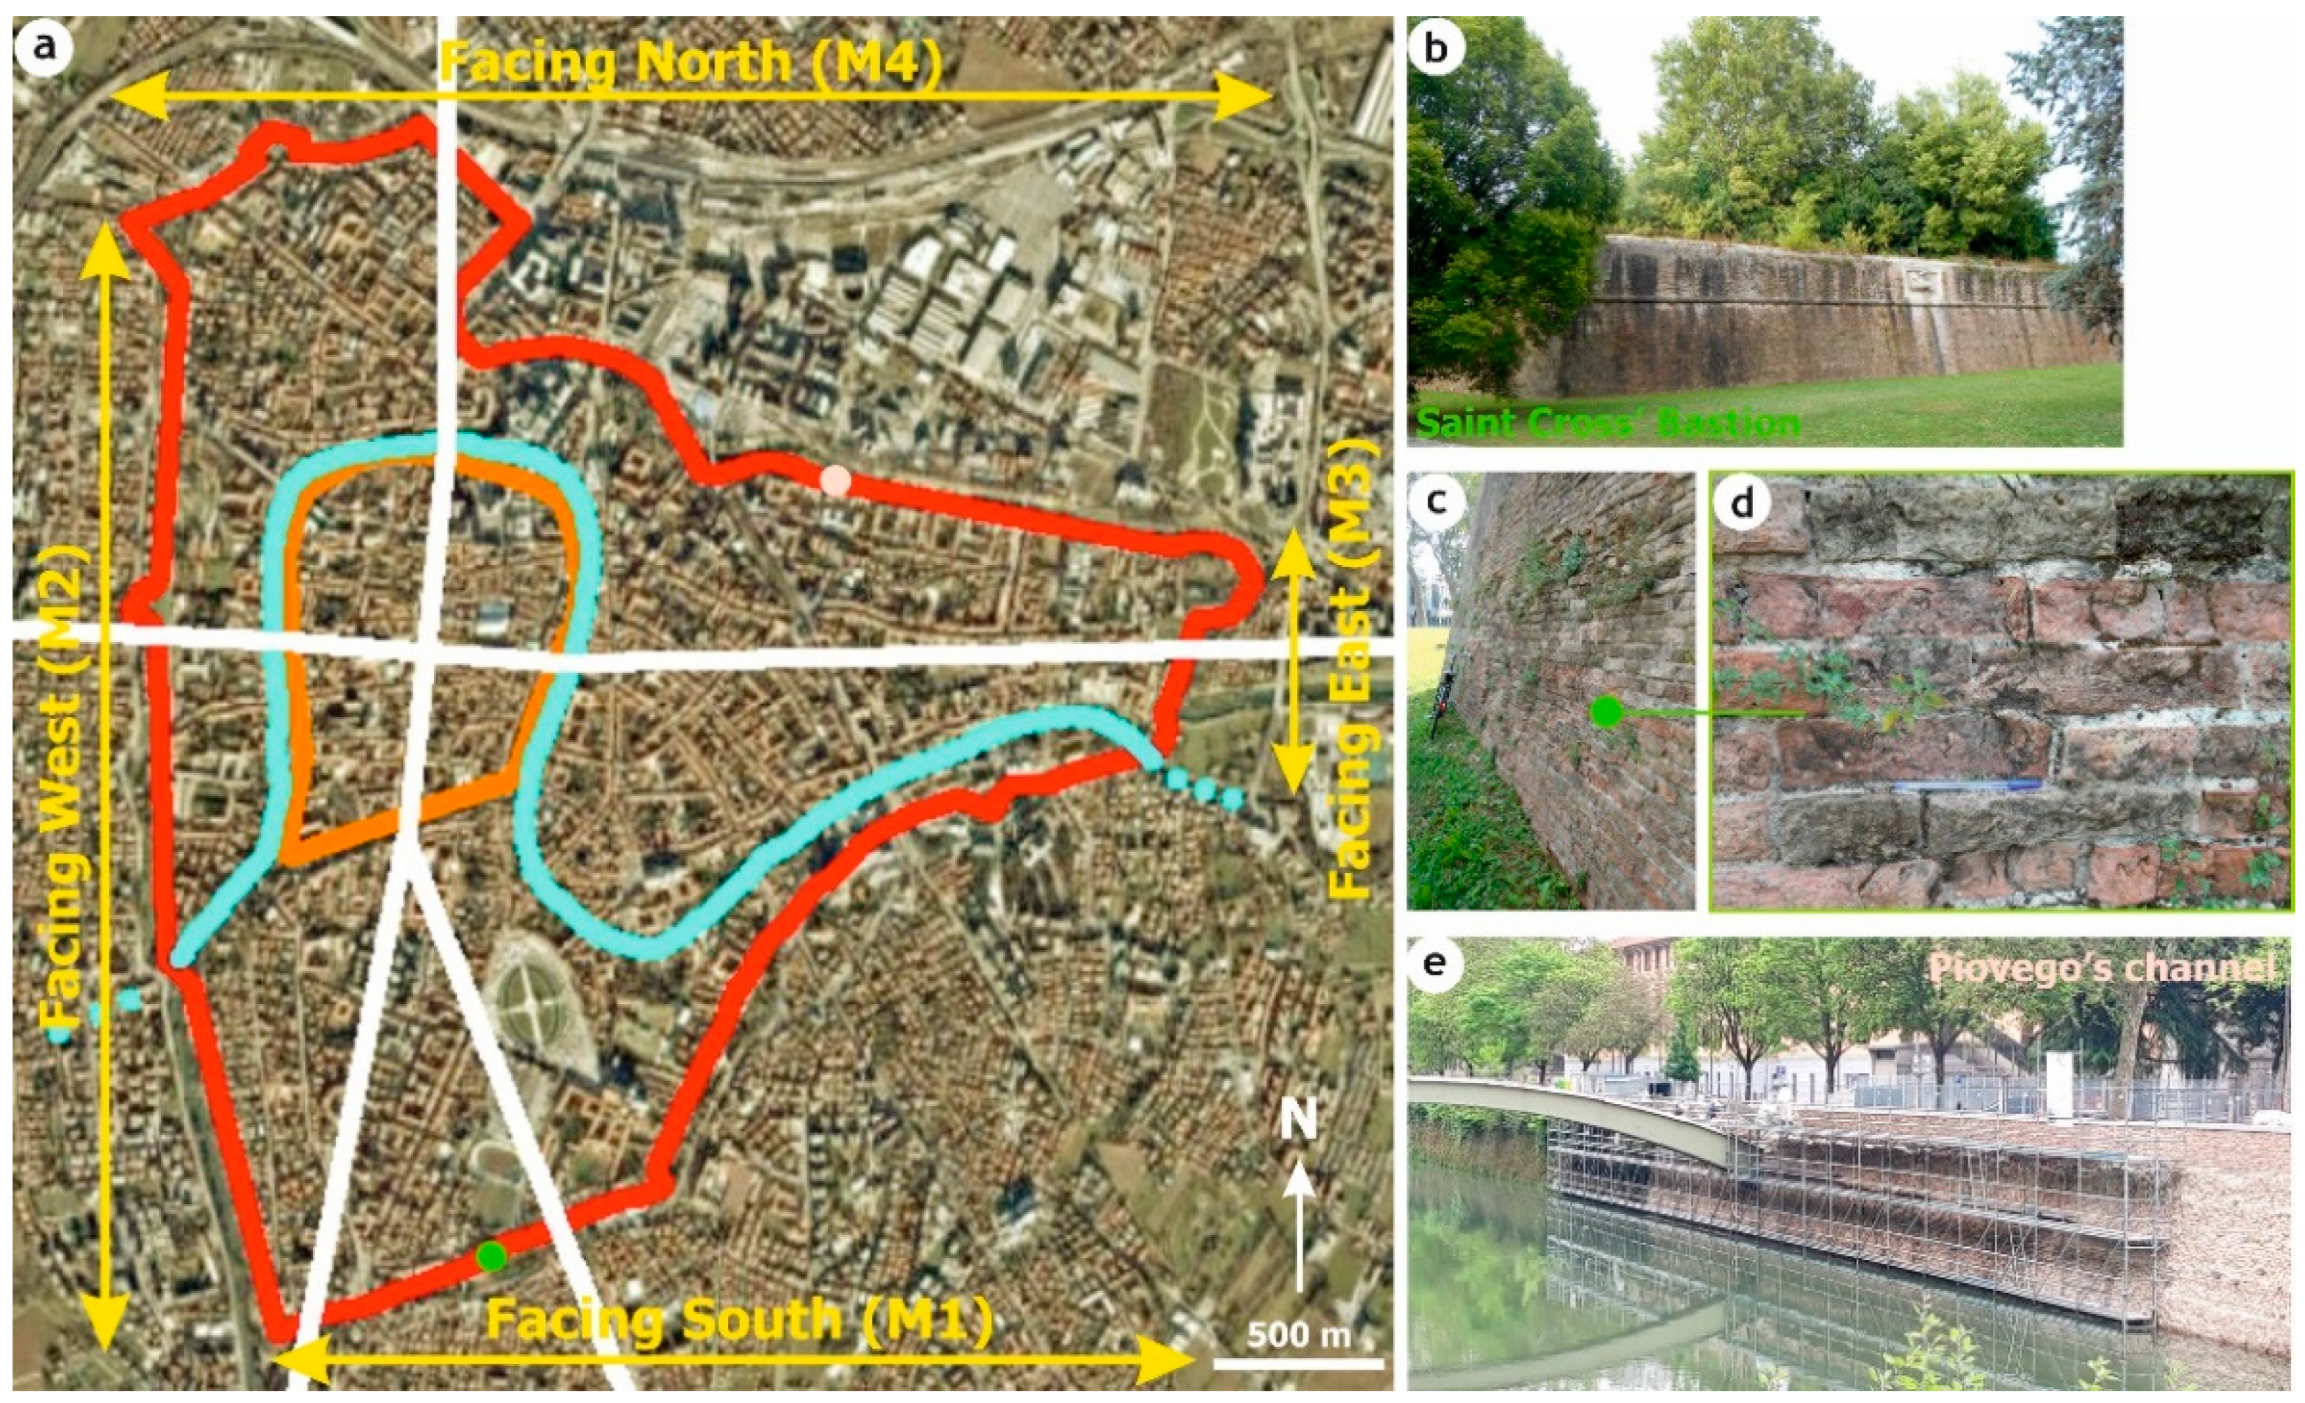
The Renaissance Walls of Padua: Construction and Environs

The city walls were built under the Venetian Republic between 1523 and 1544, initially as a strengthening of the pre-existing medieval walls and later as a defensive system that provided a new urban design to the city [24]. The layout of the walls was largely coupled to the fluvial system of the city, hence the irregular shape of the perimeter (Figure 2a). The system consisted of walls (curtain wall, bastions, gates and bridges), water pipes and cleared areas (Figure 2b), shaping a construction that was never surpassed [25]. Very wide walls were built [26] and provided with an external reinforced cladding made of a double-thickness of bricks (Figure 2c) and further strengthened in some areas with the use of the Istria limestone and the trachyte from the nearby Euganean hills [27]. After the fall of the Republic of Venice (1797), the walls lost their military importance but retained their taxation usefulness. Although some modifications were accomplished since the unification of Italy (1866), the original layout was almost conserved and nowadays is the largest and best-preserved Renaissance wall in Europe [28]. Since the 1970s, a collective awareness for the enhancement and conservation of the cultural and landscape heritage of such Venetian defensive systems has emerged among the citizens of Padua. During 2020–2021, a comprehensive recovery plan of the walls was undertaken, which comprised interventions both on the brick fabrics and on the immediately environs (Figure 2e).
The city of Padua is located in the eastern side of the Po Valley, characterized by a continental climate with very frequent mists phenomena due to high humidity conditions. The average temperature is about 15 °C and the average annual relative humidity is about 75% (according to the regional agency for the protection of the environment, ARPAV). The city is just settled down on the Quaternary alluvial deposits of the Brenta and Bacchiglione rivers. The main mineral components of the sands transported by those rivers are silicate products (mainly quartz), calcite and dolomite as individual grain minerals, massive texture grains aggregated with clayey materials and crystalline rock fragments, and metamorphic and volcanic rock fragments. Iron-manganese nodules, hematite, Ti-bearing minerals, apatite and zircon accessories are frequent [29].

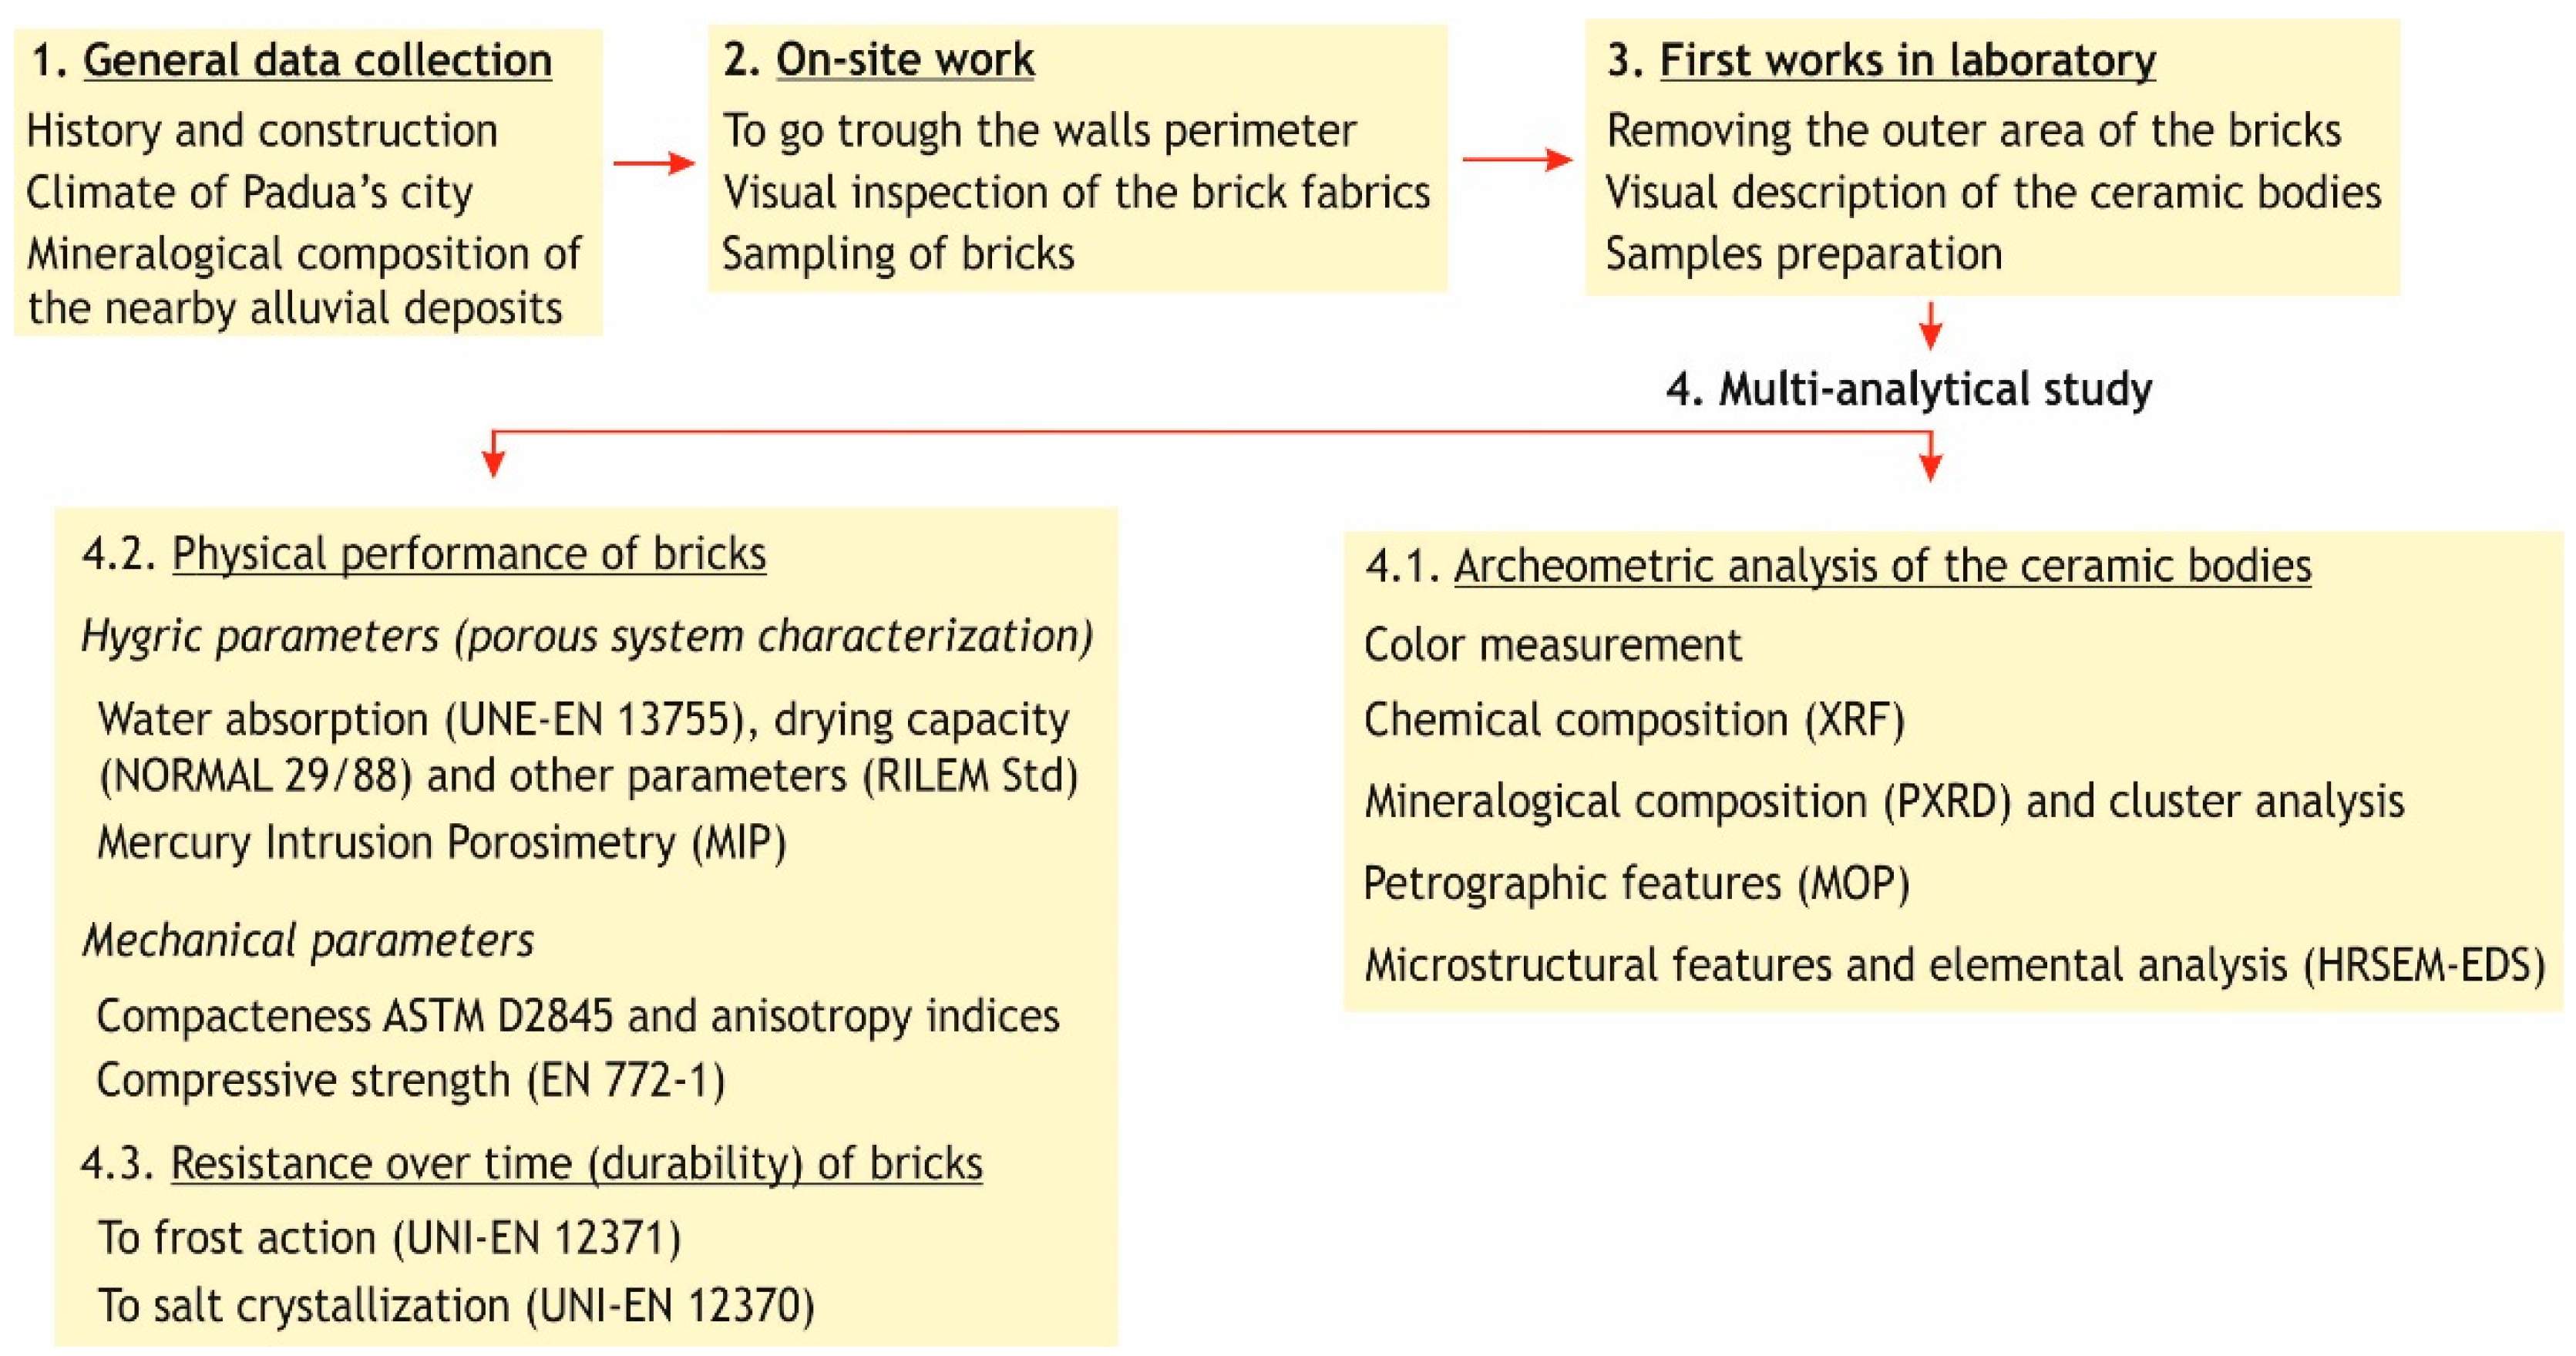
2. Materials and Methods

2.1. Ceramic Bricks from the Renaissance Walls

To carry out the visual inspection of the fabrics, four sections termed M1, M2, M3 and M4 according to the cardinal points were considered on the walls. Such sections were quite diverse in length due to the very irregular shape of the perimeter (Figure 2a). The original bricks chiefly display beige and red colors. Overall, the bricks are quite well-preserved, except in some North facings close to the channels, where significant bio-colonization can be observed, and in specific areas such as the corners of the fortifications, where many pieces are broken. Mortar joints (mainly made with lime binder) were largely lost in many areas of the walls, both at the external and internal facings. The 2020–2021 interventions focused on the cleaning of the brick surfaces, reintegration of fragmented bricks and on the entire repointing of the mortar joints (Figure 2e).
Fifteen original bricks were taken from inconspicuous areas and where entire pieces could be easily sampled, following the next criteria: (i) to be representative of the main colors observed on the walls, (ii) to display a good conservation state and (iii) to be collected from the various parts of the perimeter of the walls as far as possible from each other. On fresh surfaces, obtained by the removing of an external thin slice by a tile-saw, the appearance of the ceramic bodies is highly diverse and displays yellow/beige, pale and dark red colors (Figure 3). Some bodies show a quite uniform texture, containing fine-grained and homogeneous in size inclusions (M2_4.3, M3_3.1, M4_5.2 and M3_5.3).
Other samples display abundant rounded and sub-rounded heterometric in size clay lumps (with dark hue) and carbonate (with bright hue) inclusions that occasionally reached centimetric sizes. Dark and light clayey materials shaping flux textures corresponding both to clayey and carbonate materials are also observed in some bricks (M2_4.6, M3_2.1 or M4_4.3). The bodies display a moderate compact appearance with some elongated quite oriented pores (M1_4.7, M3_1.4, M4_5.2), although some friable textures were noted (M1_4.8 and M4_4.1). Some clay lumps show porous rims (M2_1.1, M3_4.0 and M4_3.1) and the detachment of some of them determined the high porosity of brick M3_4.0. Occasionally, secondary crystallizations inside pores and fissures were observed.
The colors of the ceramic bodies reveal the use of at least two types of raw clays and the significantly different texture and macroscopic features were mainly the consequence of the diverse manufacturing processes, suggesting that clayey materials from diverse areas were used and different preparations were adopted. The flux textures can be due to the heterogeneity of the base clay or may suggest the intentional mixing of clays, also for the optimization of the available raw clays. Moreover, the presence of clay lumps indicates that the clayey materials were not properly kneaded and/or seasoned [30].

2.2. Analytical Techniques

Once the visual features of the ceramic bodies were described, the performed multi-analytical study was based on archaeometry methodologies, in order to define the color, composition and texture of the ceramic bodies, and on testing carried out to state the physical performance and resistant over time (namely as durability) of clay bricks (Figure 1). The physical behavior has been assessed, on the one hand, by the characterization of the porous system by means of the determination of several hygric parameters and of the pore-size distribution. On the other, by the determination of the compactness, anisotropy indices and compressive strength parameters, that provides information about the mechanical performance of bricks.

2.2.1. Color, Composition and Texture

The color was measured with the portable 3nh NS800 Spectrophotometer (Shenzhen Threenh Technology Co., Ltd., Shenzhen, China), following the UNE-EN 15886 standard [31] and using the CIELab and CIELCh spaces color. On a circular measurement area of 8 mm diameter, D65 illuminant and 10° vision angle were selected to measure the lightness (L*), chromatic coordinates (a* and b*), chroma or color saturation (C*) and hue or tone (h°). The measured values range in the following intervals: lightness from 0 (pure black) to 100 (pure white), coordinate a* from +60 (red) to −60 (green) and b* from +60 (yellow) to −60 (blue). The chroma values (C* = (a*2 + b*2)1/2) range from 0 (dullness) to 100 (vividness) and the hue angle (h° = arctan (b*/a*)) from 0° to 360°. Ten measurements per brick were performed and inclusions or clay pellets larger than 5 cm were avoided to not distort the mean and deviation values.
The chemical composition of the bodies in terms of major and minor oxides (SiO2, Al2O3, Fe2O3, MnO, MgO, CaO, Na2O, K2O, TiO2 and P2O5 in wt %) was determined by X-Ray Fluorescence (XRF) with a Wavelength Dispersive (WD) system using a PANalytical Zetium compact spectrometer with a Rh anode and 4 kV X-ray generator (Malvern Panalytical Ltd., United Kingdom). Traces elements (Zr, Sc, V, Cr, Co, Ni Cu, Zn, Ga, Rb, Sr, Y, Nb, Mo, Sn, Ba, La, Ce, Nd, Pb, Th, U and Cs in ppm) were also determined. However, considering the approach of this study and the occurrence of zircon as accessory mineral within the sands transported by the rivers that run through the city of Padua [29], only Zr contents were considered (see Section 3.1.2). Before the analysis, 7 g per sample were ground into powder in an agate mortar.
Loss on ignition was determined gravimetrically as the weight loss recorded between 110 and 1000 °C. By comparison with certified values of reference materials, the precision of the analytical results was assessed [32] and XRF intensities were converted into concentrations according to the De Jongh model [33].
The mineralogical composition was determined by Powder X-Ray Diffraction (PXRD) with a PANalytical X’Pert PRO diffractometer in Bragg-Brentano geometry equipped with a cobalt X-ray tube and a X’Celerator detector (Malvern Panalytical Ltd., Malvern, UK). Powder samples were micronized following the indications proposed by Locock et al. [34]. The working conditions were CoKα radiation, 40 kV voltage, 30 mÅ current, 3–70° 2θ range, step size 0.02° and 1 s counts per step. Mineral phases were identified using the X’Pert HighScore Plus software (developed by Malvern Panalytical Ltd., Malvern, UK) and PXRD data were statistically treated by cluster analysis according to the procedure proposed by Maritan et al. [35].
The petrographic and textural features of the ceramic bodies were examined in thin sections by Polarizing Optical Microscopy (POM), using a Nikon Eclipse E660 microscope (Nikon Instruments Inc., New York, NY, USA) equipped with a CANON 650 digital camera and the Camera EOS digital microphotography system. Descriptions for ceramic materials proposed by Whitbread [36] modified by Quinn [37] were used. Moreover, the microstructure and the chemical composition of the ceramic bodies at a site level (specific parts) were studied by High-Resolution Scanning Electron Microscopy coupled with a microanalysis of Energy Dispersive X-Ray Spectroscopy (HRSEM-EDS). The AURIGA of Carl Zeiss SMT field emission scanning electron microscope with a focused Gallium ion beam (FIB-FESEM) was used, with an acceleration voltage of 0.2 to 40 kV, a current of 6 × 10⁻¹⁰ Å, vacuum conditions of 10−5 Torr, a resolution of 35 Å and a working distance of 8 mm and 35 kV (Carl Zeiss Microscopy Co., Jena, Germany). Polished thin sections coated with graphite were observed and the images were acquired in back-scattered electron mode at an acceleration voltage of 20 kV. Microchemical analysis were performed using an Oxford Inca EDS system with a nominal resolution of 133 eV at 5.39 kV.

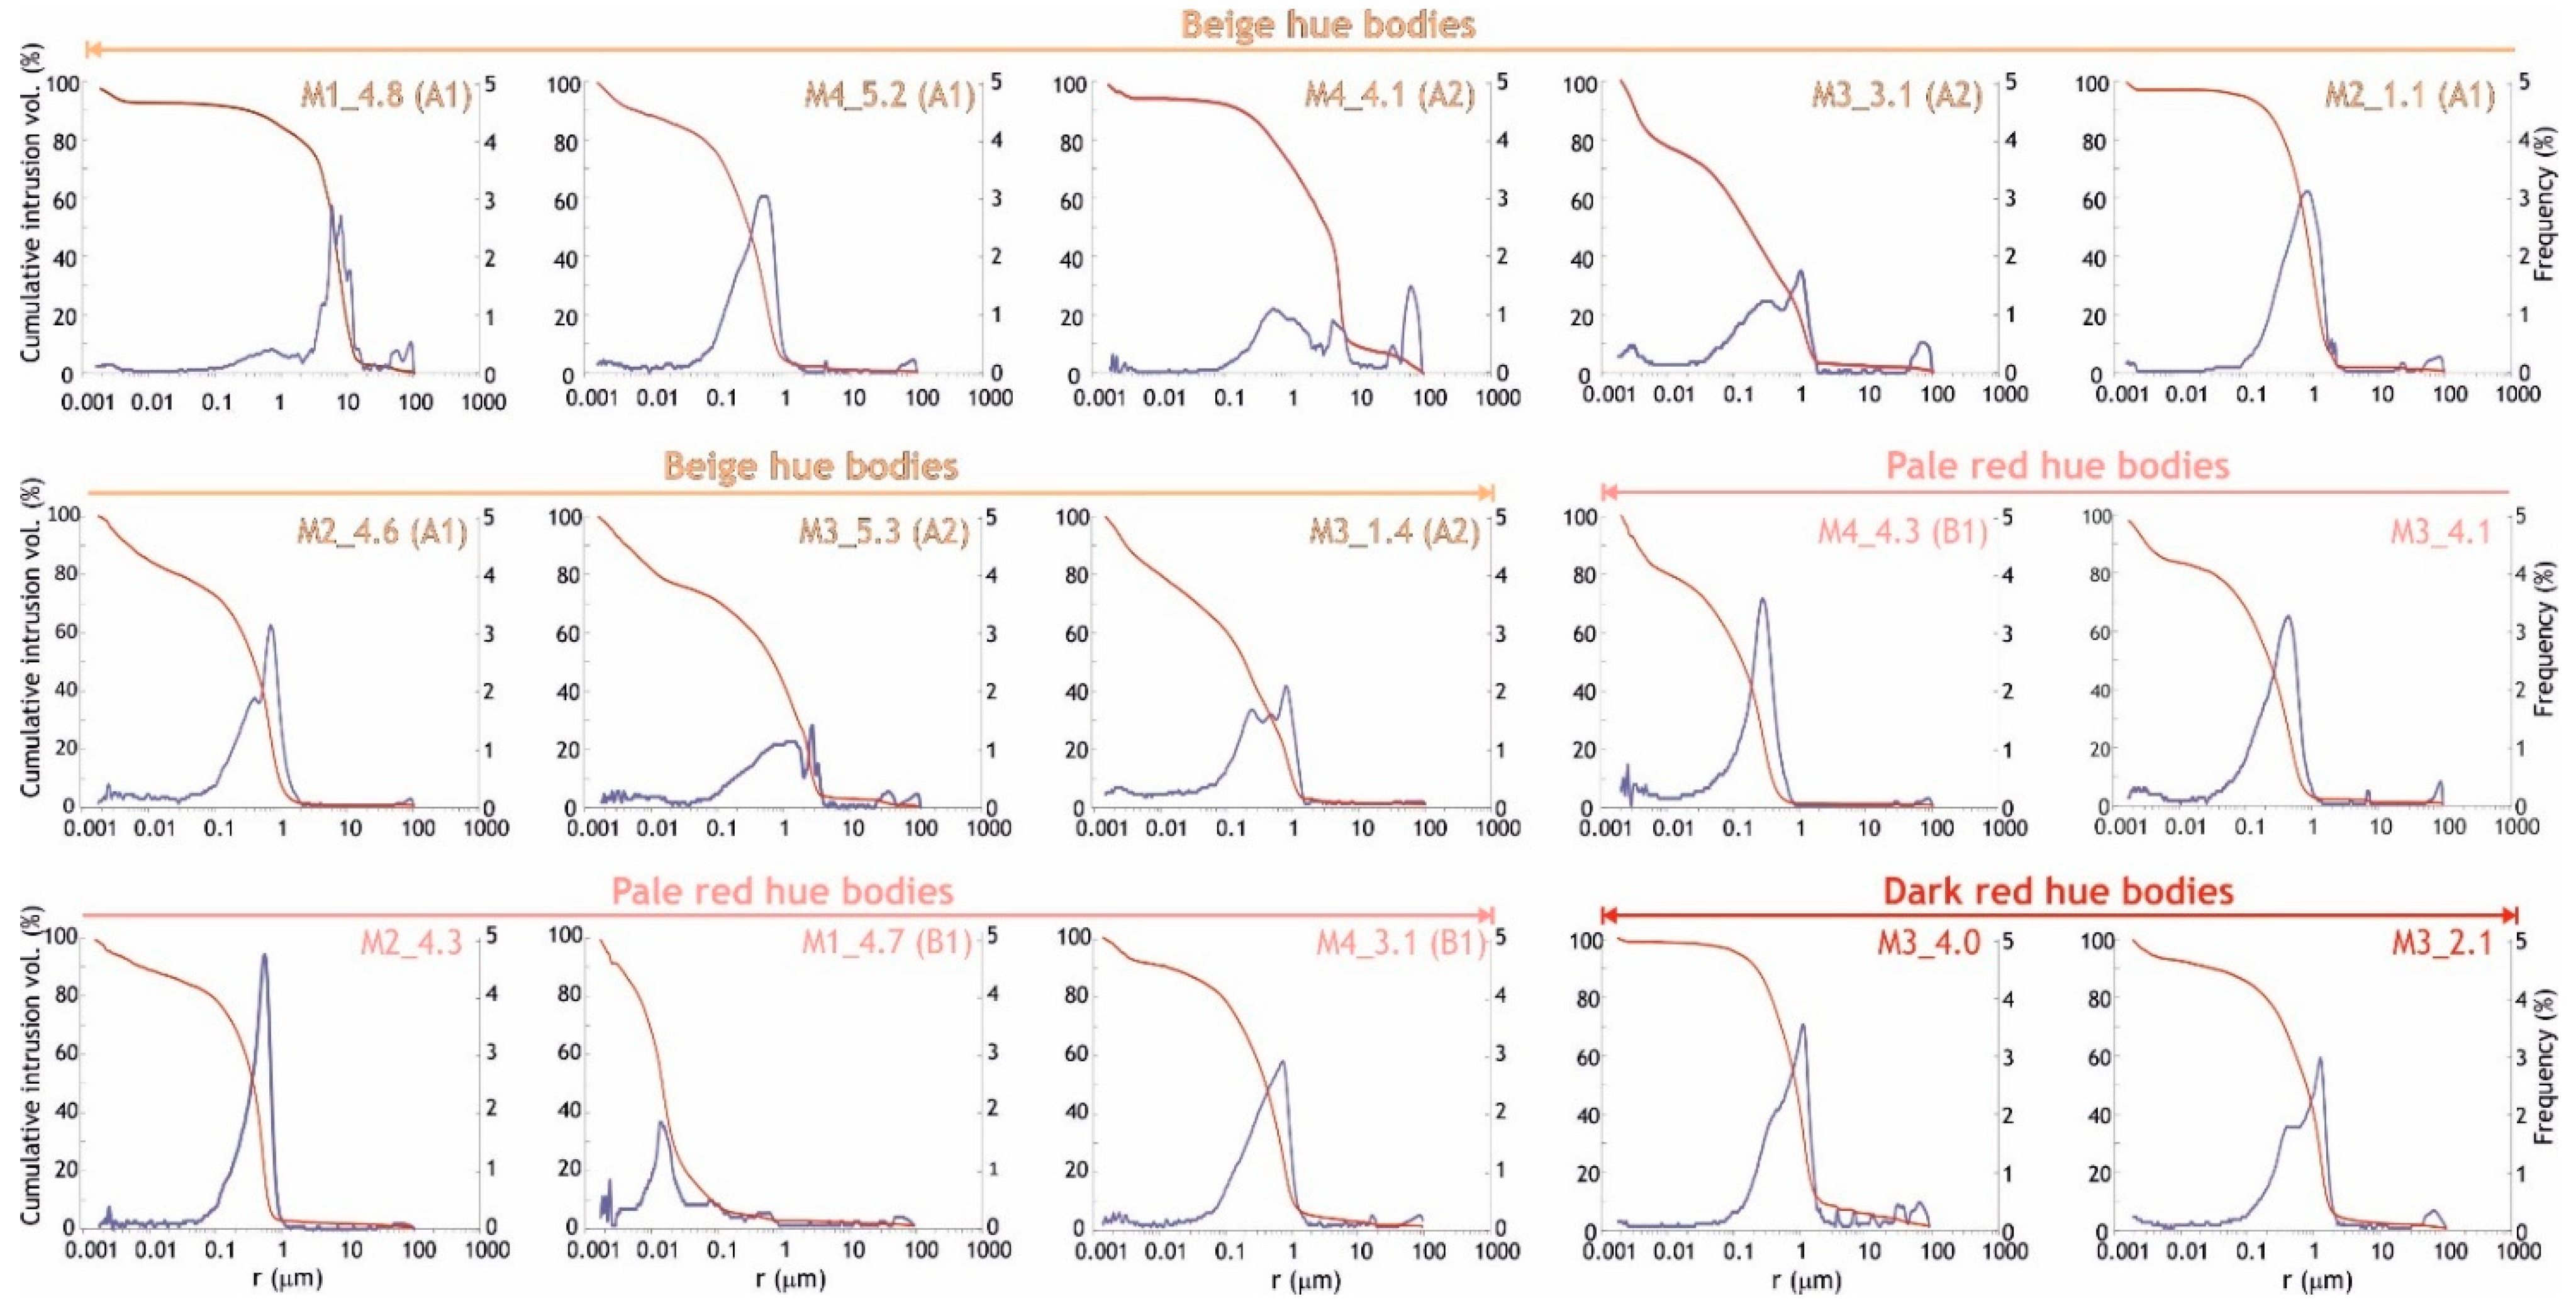
2.2.2. The Porous System

The hygric behavior of the bricks, interpreted as their fluids absorption and drying capacity, was quantified by hygric tests performance. According to the UNE-EN 13755 [38] and NORMAL 29/88 [39] standards, free (Ab)/forced water absorption (Af) and the drying index (Di) were determined, respectively. These tests also allowed calculating the degree of pore interconnection (Ax) [40], the saturation coefficient (S), the apparent (ρa) and real densities (ρr) and the open porosity (Po) according to the RILEM standard [41]. The tests were performed under controlled thermo-hygrometric conditions (18 °C and 35% RH). Two cubic samples (edge: 40 mm) per each brick were tested. The characterization of the porous system was completed through Mercury Intrusion Porosimetry (MIP), using a Micromeritics Autopore IV 9500 porosimeter. The pore-size distribution was analyzed within a radius range comprised between 0.001 and 1000 μm. The specific surface area (SSA), open porosity (PoMIP) apparent and real densities (ρaMIP and ρrMIP) were also determined. The pore-size distribution was defined, a very important data as the pression exerted by decay agents such as frost and salts crystallization within capillary pores (pores < 1 μm) may cause significant damage [42]. One freshly cut chip of about 1 cm3 per brick was dried at 70 ± 5 °C for 8 h before being analyzed.

2.2.3. Compactness, Anisotropy Indices and Compressive Strength

The compactness of bricks was assessed through the measurement of the velocity of the ultrasonic waves (compressional pulses, Vp), structural (ΔM) and relative (Δm) anisotropies. Ultrasound measurements were carried out using a Controls 58-E4800 ultrasonic pulse velocity tester with 54 kHz transducers. An ultrasound eco-gel was used for a suitable coupling between the surfaces of the bricks and the surfaces of the transducers.
The ASTM D2845 [43] standard was followed, and the formulae proposed by Guydader and Denis [44] were used to calculate the structural (∆M) and relative (∆m) anisotropies. Three cubic samples (edge: 40 mm) per each brick were measured.
The compression tests were performed according to EN 772-1 [45] and with a universal testing machine (Galdabini, Varese, Italy) with a full-scale of 600 kN and an accuracy of 0.03%. The tests were run in force control with a loading speed of 400 N/s, corresponding to a nominal 0.25 N/(mm2·s). The normalized compressive strength (fb) was computed as the cubic compressive strength (fc) multiplied by the shape factor (d) of 0.8 provided by EN 772-1 [45]. Three cubic samples (edge: 40 mm) per brick type (beige and pale red hue bricks were considered) were prepared. The two surfaces of the cubes corresponding to the flat surfaces of the bricks were pinpointed to be loaded in the compression tests. The cubic brick samples were capped with a commercial high strength cement grout. The dimensions and the weights were measured before preparing the samples with the cement capping. The thickness of the capping on each of the two loading surfaces was in between 0.5 and 1 mm. The excess of grout on the unloaded sides was trimmed via grinding. The capped specimens were cured in moist conditions at ambient temperature of T = 22 ± 2 °C and relative humidity of RH = 95% for 2 weeks. Afterwards, the specimens were cured in laboratory conditions at T = 22 ± 2 °C and RH = 65% until reaching a constant mass before the mechanical testing.

2.2.4. Durability

The resistance of bricks to frost and salts actions over time was evaluated performing the freeze-thaw [46] and the salt crystallization tests [47], respectively. Frost resistance was evaluated on two cubic samples (edge: 50 mm) for each brick through 20 cycles of 24 h, comprised of 8 h at −12 °C (freeze period) and 16 h at 20 °C (thaw period). The samples were dried at 60 ± 5 °C until constant mass and were submerged in water for 48 h before the starting of the cycles. Resistance to salt crystallization was assessed on two cubic samples (edge: 40 mm) for each brick subjected to 15 cycles of 24 h using a 14% Na2SO4 × 10H2O solution that may exert a crystallization pressure of 14 MPa in narrowed spaces [48]. Before being tested, the samples were dried at 105 ± 5 °C until reaching constant mass. The tests were performed under controlled thermo-hygrometric conditions (18 °C and 35% RH). The gradual decay of the bricks was evaluated by visual inspection and daily weight measurement.

3. Results and Discussion

3.1. Bricks Manufacturing Technologies
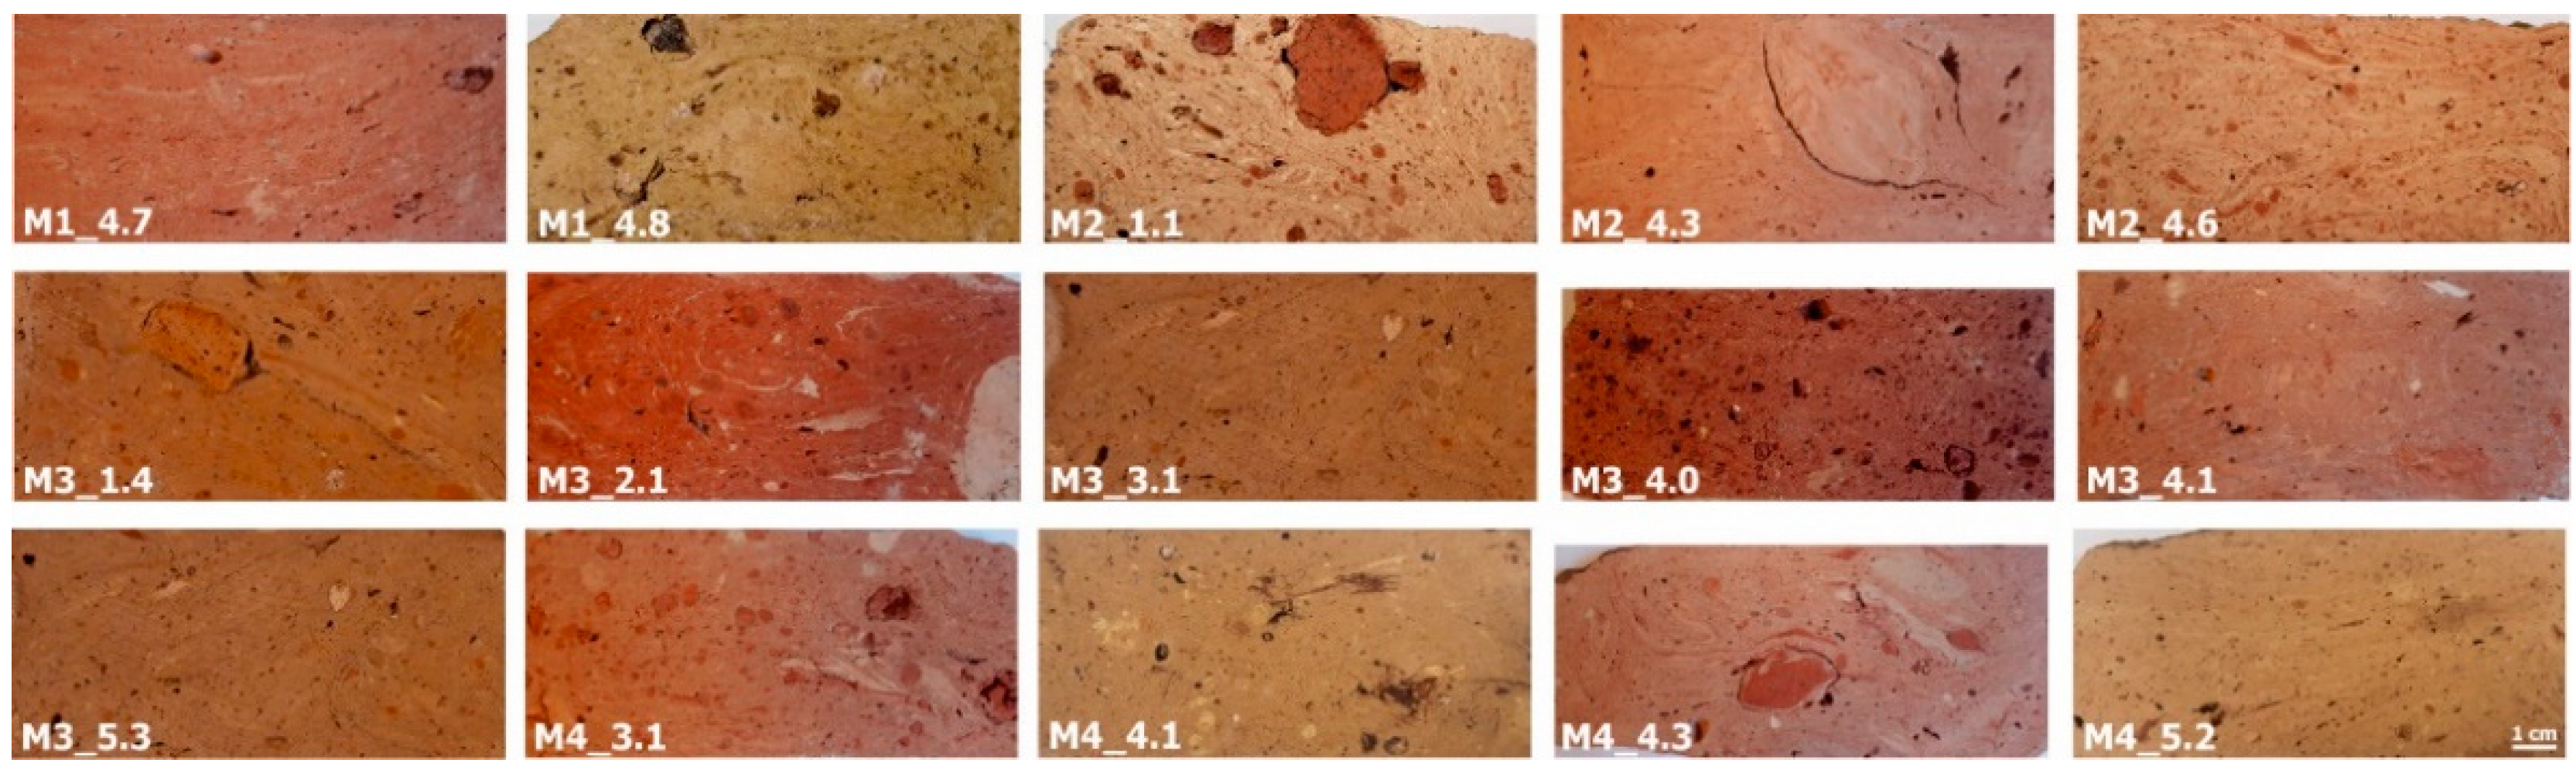
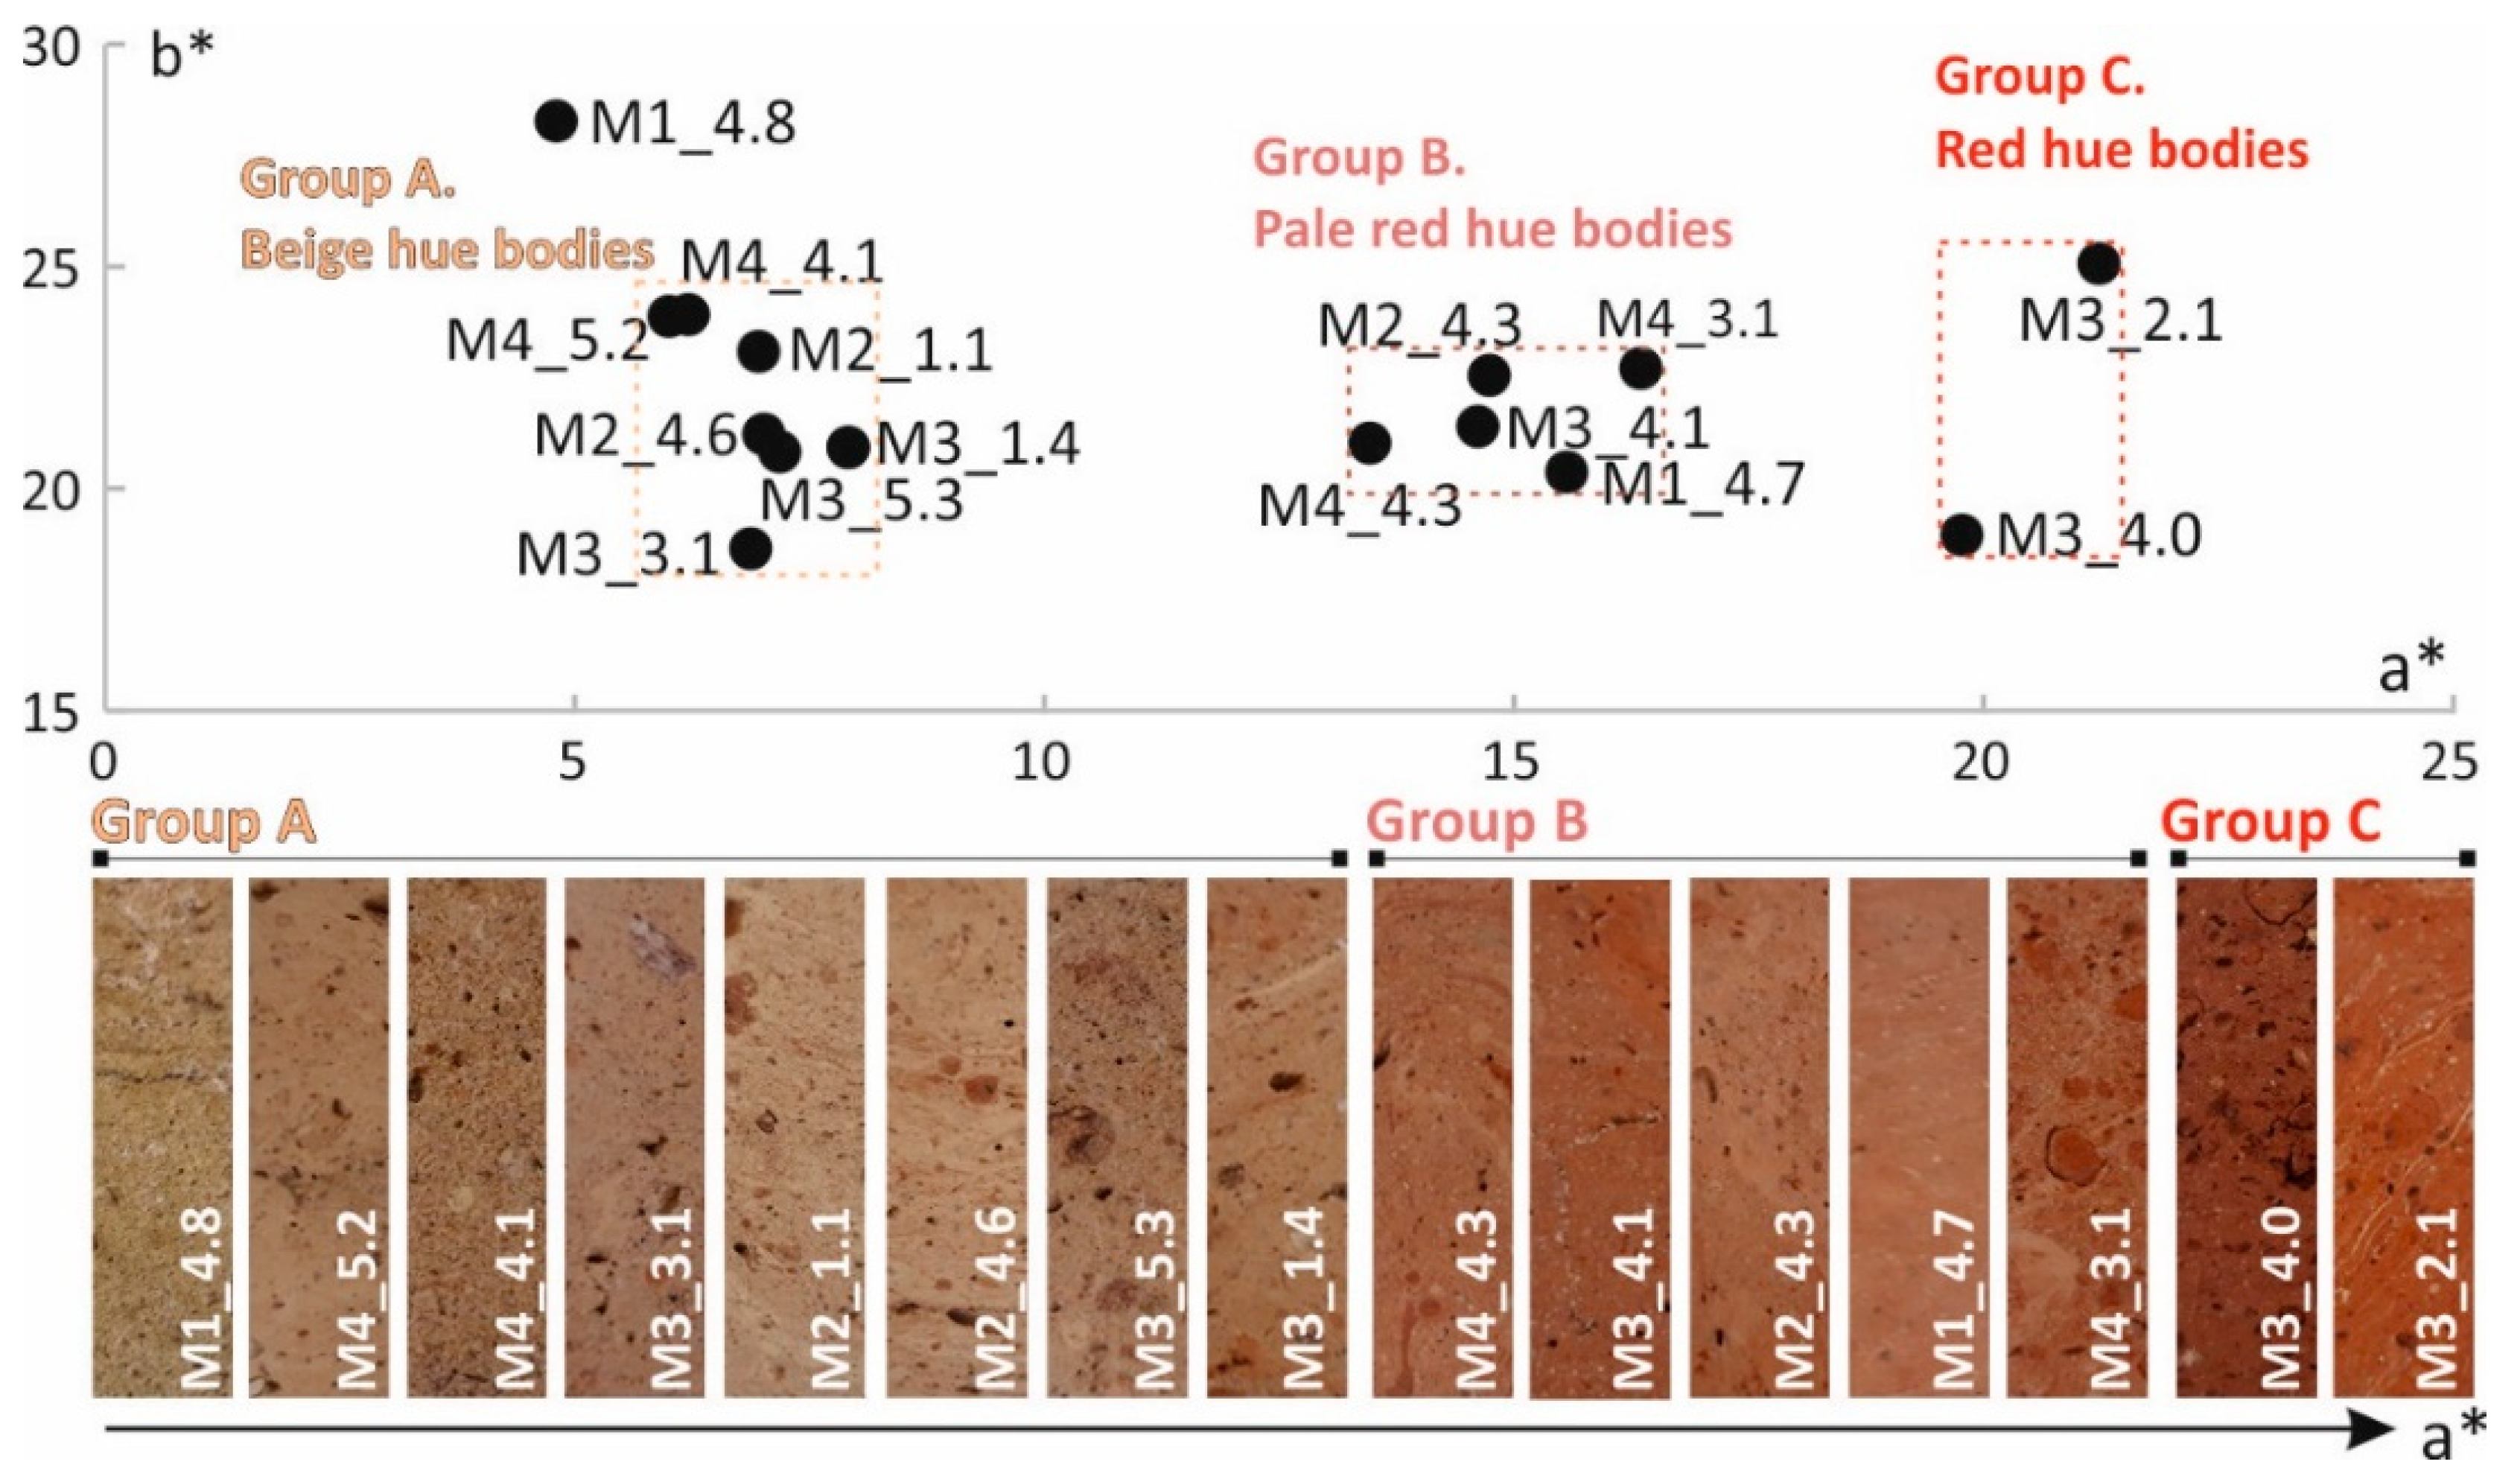
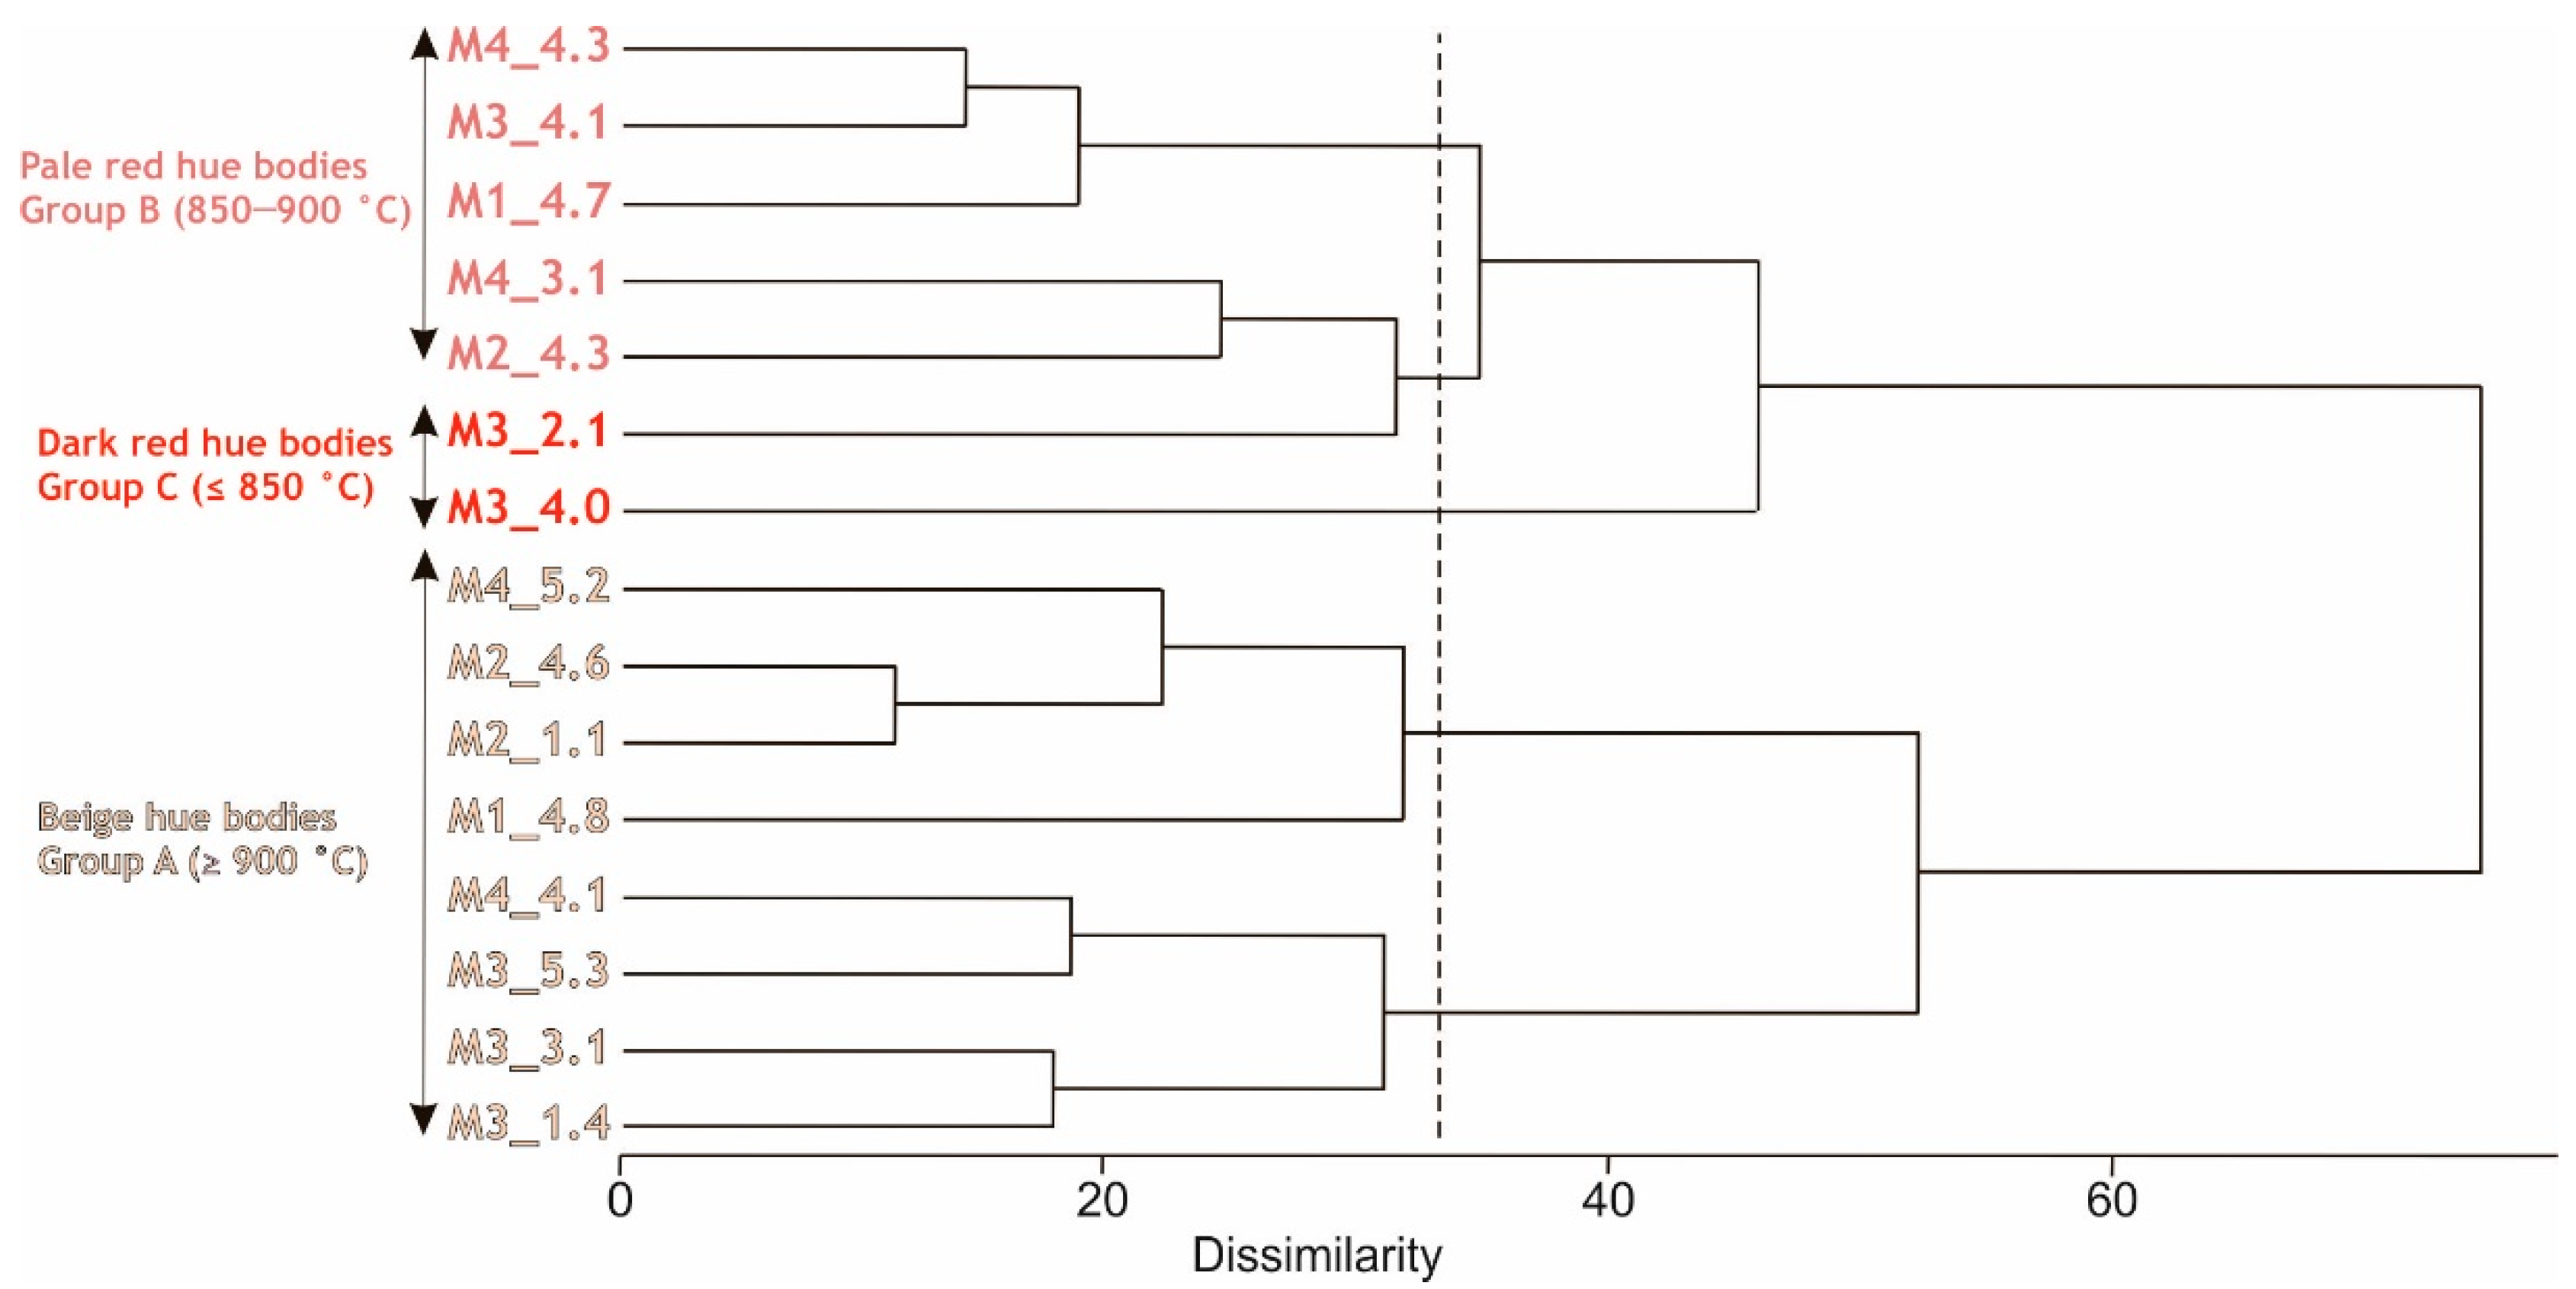
3.1.1. Bricks Color

The color measurements of the bodies are reported in Table 1 according to the a* coordinate values ordered from the smallest to the biggest. In the beige hue pastes (group A) the red component varies from 6 to almost 8, in the pale red ones (group B) between 13.5 and 16.4 and the dark red bodies (group C) show values higher than 19. Overall, the increase of the red component is accompanied by the decrease of the lightness and by the general increasing trend on the chroma, turning the pastes darker and more saturated. The beige and the pale red bodies display a slight decrease on the b* values with the increase of the a* coordinate. The higher standard deviation (Std) values mainly correspond to the more uneven textural bodies, with a significant amount of inclusions visible with the naked eye. The lesser lightness values (L* < 65) of the beige hue bodies M1_4.8, M4_4.1 and M3_5.3 are mainly due to the more porous texture they show. The brick M1_4.8 displays rather different values, yielding the highest b* and the lowest a* values, highlighting a more yellow hue ceramic body. The dark red hue bodies display similar a* values (about of 20) and important difference regarding the b* values.
The three-color groups are better distinguished by the a* values (Figure 4). For similar dispersion of the a* and b* values, the variation on the red component leads to a more pronounced color change. For instance, the bodies of bricks M3_3.1 and M4_4.1 (belonging to group A) are separated by 5.27 points on the b* values. The bodies of M3_1.4 and M4_4.3 are separated by 5.5 points on the a* values and belonged to two different groups. Consequently, the a* coordinate may represent the best chromatic parameter for defining the color changes of such ceramic bodies.

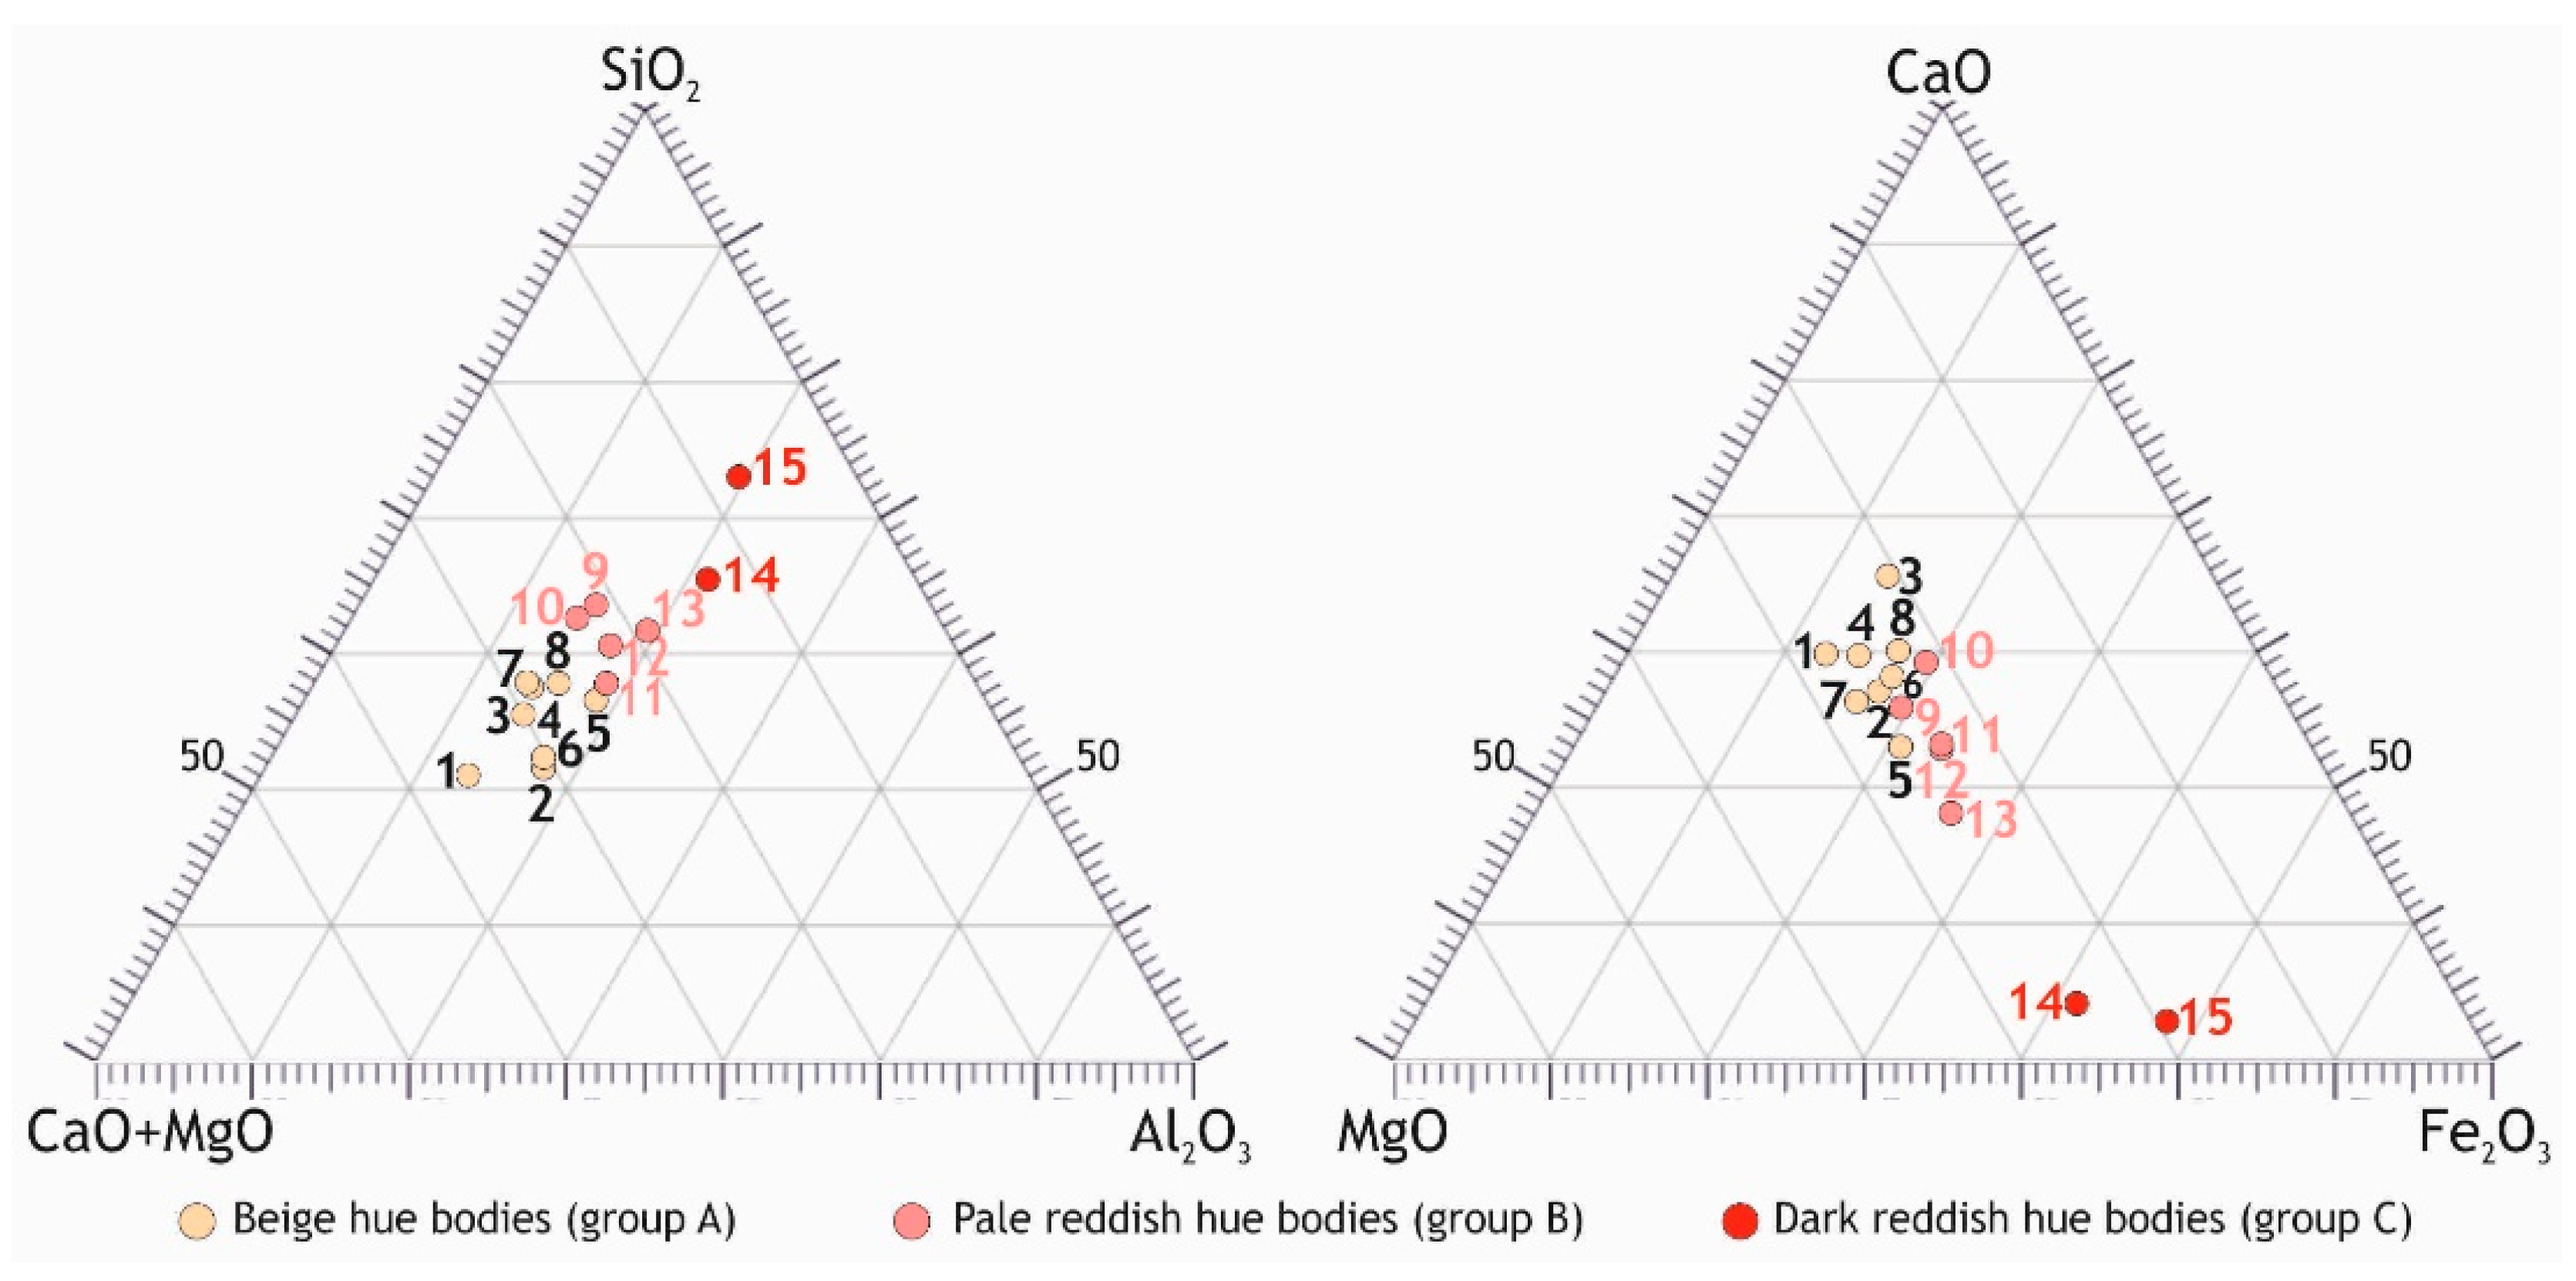
3.1.2. Chemical Composition of the Ceramic Bodies

Based on the chemical analyses (Table 2), the bricks show a high content of silica (40–60%), alumina (11–19%) and alkaline-earth metals (CaO + MgO > 16%) and are moderately rich in iron oxide (Fe2O3 ≈ 4–8%). Alkaline metals K2O and Na2O are rather moderate (1.7% to 3.5%) and low (0.8% to 1.5%), respectively. TiO2 and P2O5 are generally lower than 1% and MnO is lower than 0.1%.
The beige hue bricks display the lowest silica and iron contents and the highest calcium and magnesium oxides contents. On the pale red hue ceramic bodies, the amounts of silica are higher, the alumina and Fe2O3 are slightly higher, and the calcium and magnesium oxides are lower. On the red hue bodies, the largest silica, alumina and iron quantities are detected, as well as the minor contents of calcium and magnesium oxides and a major presence of K2O and Na2O.
High SiO2 and Al2O3 values may point out the significant presence of quartz and feldspars within the bodies [49]. MgO values may be related to the presence of pristine dolomitic inclusions and Mg-rich mineral phases nucleated during the firing process. The high CaO contents might correspond mainly to Ca-bearing inclusions contained in the base clays and calcium phases formed during firing. The content of K2O suggests the presence of illite/muscovite on the raw clays, as well as that of K-feldspar.
The data achieved point out that base clays were silica rich, with an important clay-mineral content and rich in carbonates, both limestone and dolostone. Such overall contents are in concordance with the loss on ignition data, as greater values of LOI are mainly due to a higher content of carbonates (loss of CO2) and clay minerals (loss of OH) in bricks rich in calcium and magnesium, which underwent the same firing temperature [50].
TiO2 and Zr contents generally rise with the increasing of the red component, except for the yellow brick M1_4.8. Besides being traced in the clay minerals, the TiO2 and Zr detected might be also related with the presence of accessory minerals such as rutile and anatase (TiO2), titanite (CaTiSiO5) and zircon (ZrSiO4). P2O5 contents might be probably related to the occurrence of apatite (PO4Ca) accessory mineral and/or with some secondary phase. In fact, the formation of Ca and/or Fe phosphates as a secondary hydration phases within the ceramic bodies might take place [51,52,53]. This is coherent with the high relative humidity of the city of Padua and the significant CaO and Fe2O3 contents detected (Table 2).
When the chemical composition is considered within the ternary diagrams SiO2–Al2O3–CaO + MgO and CaO–Fe2O3–MgO (Figure 5), the bricks clearly clustered according to their colors. Based on the oxides content represented, it was observed that the beige and pale red bodies display rather similar chemical composition. As previously noted, silica and iron oxide contents raise with the increasing of the red component while calcium and magnesium contents decline.

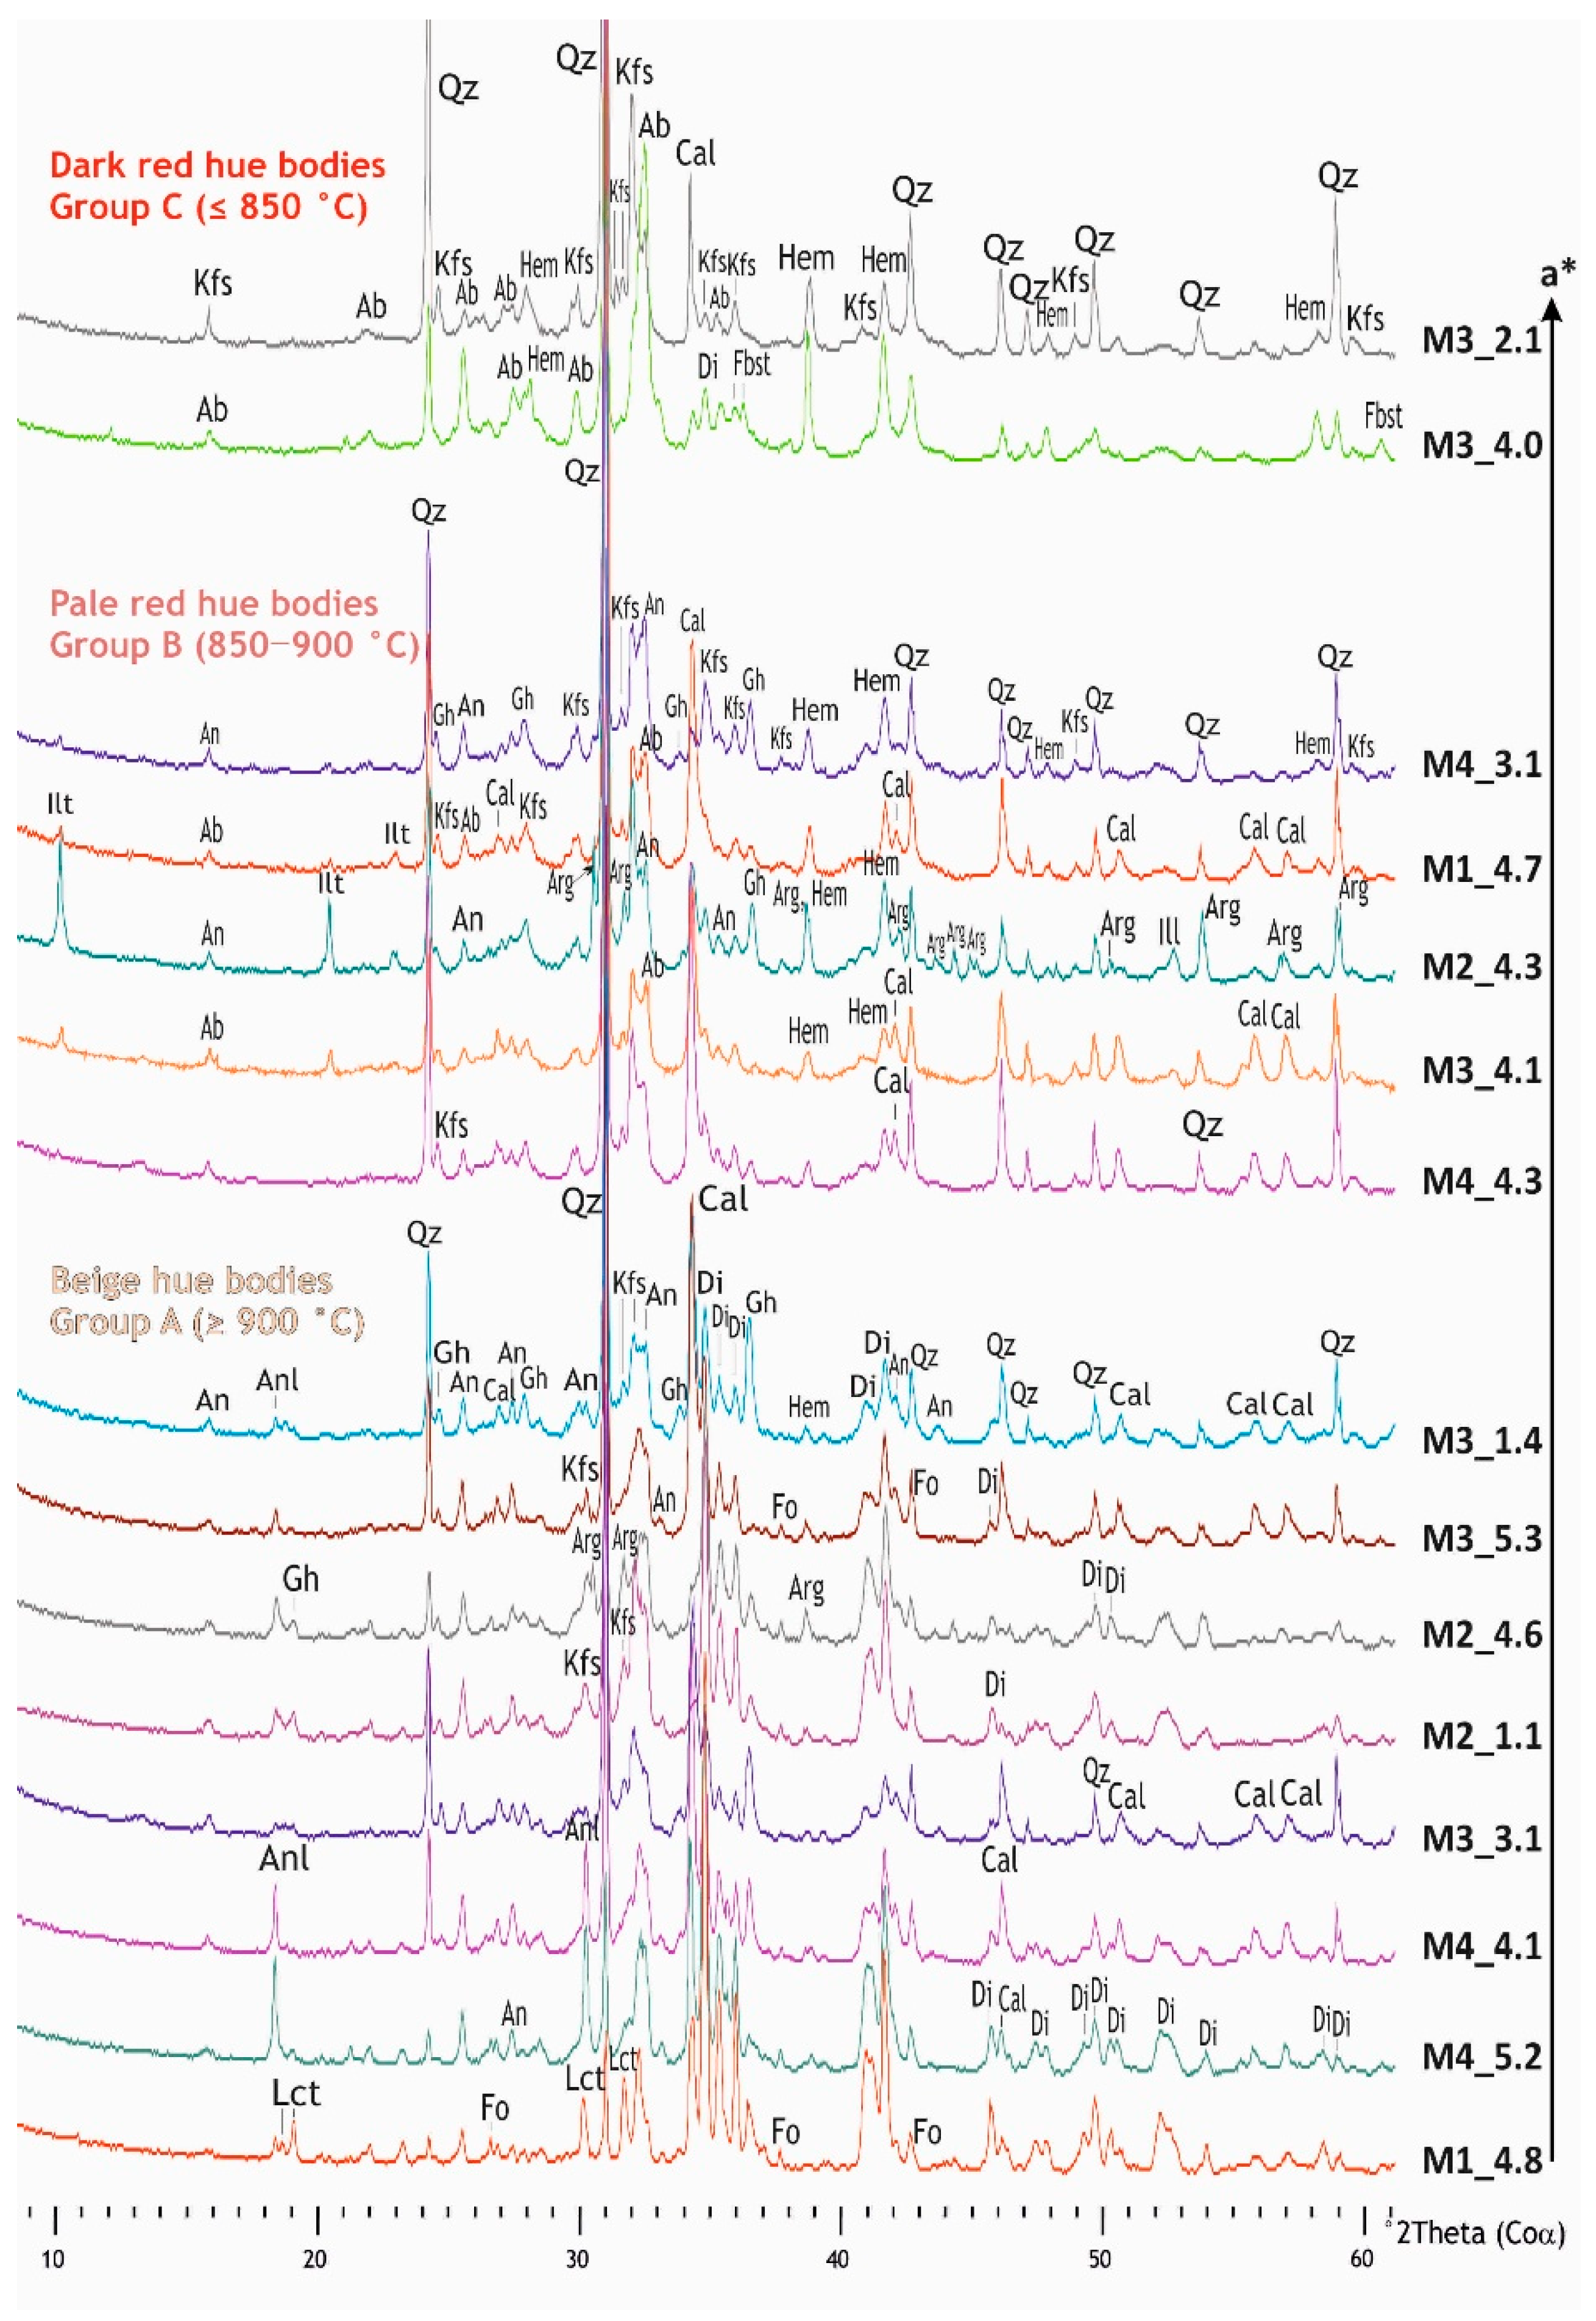
3.1.3. Mineralogical Composition of the Ceramic Bodies

Regarding the mineralogical phases identified by PXRD (Figure 6), quartz, K-feldspars, albite and illite represent the residual/relict component of the base clays, while anorthite, diopside, gehlenite and hematite those crystallized at high temperature during firing. Calcite, aragonite and zeolites (analcime and leucite) can be considered as secondary phases formed after the firing and due to environmental transformation of the bricks after its setting in the walls. The diffraction patterns mainly show the significant presence of calcium aluminum-silicates and calcium/magnesium silicates on the beige hue pastes, whereas silicate mineral phases and hematite are higher with the increasing of the red component. In the beige hue bricks (group A), anorthite, diopside and calcite are the predominant phases, gehlenite and quartz are abundant in almost all samples, whereas forsterite is detected in several samples and K-feldspar is occasionally present. In the yellow body M1_4.8, there is a marked presence of diopside, quartz is significantly low, and the concentrations of leucite are high. In bricks M4_5.2 and M4_4.1, with lower a* values, a significant presence of analcime is observed. Aragonite is identified only in sample M2_4.6, the only one where calcite is lacking. On the two bodies with higher a* values (bricks M3_5.3 and M3_1.4), hematite is clearly detected.
A more heterogeneous scenario is observed among the mineralogical assemblages detected on the pale red hue bodies (group B), where the predominant phases are quartz, K-feldspar, albite and calcite, associated to hematite, and with gehlenite occurring only in some samples (where anorthite instead of albite is noted), as well as illite and aragonite present only in brick M2_4.3 (where illite is more abundant than in other samples). The red hue bricks (group C) display high contents of quartz, the highest hematite concentration and rather variable mineralogical assemblage. Hence, while in sample M3_2.1 K-feldspar is abundant, high albite and associated diopside and ferrobustamite are present in brick M3_4.0. The phases observed in the bricks are important indicators of the firing dynamics. More in detail, quartz and K-feldspars, originally present in the base clay, may remain up to 1000 °C [50] and both are involved in high-temperature phases formation [7].
The chemical mechanism of illite/muscovite dehydroxylation (1) occurs between 450 and 780 °C [54], being the dehydroxylated phase almost unchanged up to 850–950 °C [55].
KAl2(Si3Al)O10(OH)2 → H2O + KAl2(Si3Al)O11
     muscovite   dehydroxylated phase
The dolomite decomposition into calcite and periclase (2) occurs around 750–800 °C [4] and the decarbonation of calcite into lime (3) is completed up to 900 °C, although in pure systems such temperatures are lower [56,57,58].
CaMg(CO3)2 → CaCO3 + MgO + CO2
dolomite   calcite periclase
CaCO3 → CaO + CO2
calcite   lime
From the reaction of lime with free silica and/or alumina, derived from the dehydroxilation of illite (4), and between K-feldspar and calcite (5), gehlenite forms at about 800–850 °C [59].
2KAl2(Si3Al)O10(OH)2 + 6CaCO3 → 3Ca2Al2SiO7 + 3SiO2 + K2O + 2H2O + 6CO2
illite    calcite  gehelenite        
2KAlSi3O8 + 2CaCO3 → Ca2Al2SiO7 + 5SiO2 + K2O + 2CO2
K-feldspar  calcite   gehelenite         
The presence of gehlenite, that causes dingy colors, denotes that reactions were not completed during firing [60], thus it normally behaves as an intermediate phase that reacts with quartz and alumina giving rise to anorthite (6) at around 900 °C [61]. Anorthite may also form by the reaction of calcite with quartz and K-feldspar (7) [62], and with quartz and alumina (8).
Ca2Al2SiO7 + 3SiO2 + Al2O3 → 2CaAl2Si2O8
gehelenite          anorthite
CaCO3 + 2SiO2 + 2KAlSi3O8 → CaAl2Si2O8 + K2O + 6SiO2 + CO2
calcite    K-feldspar   anorthite        
2Al2O3 + 4SiO2 + 2CaCO3 → 2CaAl2Si2O8 + 2CO2
     calcite  anorthite
The high anorthite content indicates temperature exceeding 900 °C [63], although the fine grain of the raw clays may enhance its crystallization at lower temperatures [2]. At around 900 °C diopside may be formed by the reaction of silica and dolomite (9) [59].
CaMg(CO3)2 + 2SiO2 → CaMgSi2O6 + 2CO2
dolomite      diopside  
It should be considered that the PXRD technique normally reveals the peaks of a generic clinopyroxene [64] and that ceramic pyroxenes are generally mentioned in the literature as diopside [65], despite that in many cases it corresponds to fassaite [2]. The detection of the high temperature phase ferrobustamite Ca(Fe2+,Ca,Mn)Si2O6 in brick M3_4.0 points out the use of Fe-rich and Mn-bearing clayey materials. Therefore, the use of the nearby lenses of alluvial clays rich in iron-manganese nodules [29] might be confirmed.
As the diffusion rate of lime is higher than that of periclase, the consumption of lime is faster than periclase. Consequently, from the excess of periclase, Mg-silicates like forsterite (Mg-olivine phase) can be nucleated with increasing temperature both at expense of Ca–Mg silicates (10) [66] and by periclase reaction with silica (11).
CaMgSi2O6 + 3MgO → 2Mg2SiO4 + CaO
diopside periclase forsterite  
SiO2 + 2MgO → Mg2SiO4
   periclase forsterite
During firing, both dehydration of the iron oxy-hydroxides of the base clays and the recrystallisation of iron released from phyllosilicates breakdown, may generate hematite [10]. Well-crystallized hematite is a significant component only after heating at 900 °C [66], although the firing of carbonate-rich clays may lead to the formation of hematite at about 750–850 °C [67]. Moreover, hematite nucleation points out oxidizing conditions, at least at the end of the firing process [68]. The increase of hematite crystals scattered throughout the matrix may lead to the darkening of the bodies [11].
Such results are in concordance with the data derived from the chemical and mineralogical composition of the sands transported by the Brenta and Bacchiglione rivers [29]. In the beige hue bodies, the high content of gehlenite, anorthite and diopside, as well as the presence of forsterite, point out that dolomite- and calcite-rich illitic clays were used and that firing temperatures exceeded 900 °C. The intensities of diopside main diffraction peaks suggest that bricks M1_4.8, M4_5.2, M2_1.1 and M2_4.6 were fired at higher temperatures than the other ones. In the pale red bodies, the absence of diopside, the very low quantity of gehlenite (except in bricks M2_4.3 and M4_3.1) and the rather significative presence of hematite suggest firing temperatures around 850–900 °C and the use of clays less rich in carbonates.
It is interesting to observe that, when PXRD data are statistically treated by cluster analysis (Figure 7), bricks grouped according to their color. Those with beige color clearly separated from the others and the differences observed among them (group A) were related to slightly different firing temperature (as described above). Moreover, brick M3_4.0, containing ferrobustamite, clearly isolates from all the others.
Taking into consideration the chemical data, the higher the a* values measured, the lower Ca and Mg aluminum-silicate and the higher silica inclusions and hematite are detected. The lower quantity of carbonates in the base clays, the lower firing temperature as well as a possible shorter permanence inside the furnaces (especially the soaking time), are suggested as the main causes responsible of the different colors of the bodies. Therefore, with increasing temperature, the red component of the ceramic pastes become lower due to the iron entrapment by the structure of gehlenite and Ca-pyroxenes, so the hematite resulted to be less [8].
As high temperature silicates and carbonates cannot appear together [69], the calcite detected probably corresponds to secondary calcite crystallized after the bricks were laid, from the carbonation of the lime produced during firing and/or of the portlandite possibly formed if the bricks were soaked in water to avoid lime blowing [70]. It is suggested that, besides the lime from the mortar joints and the nearby aqueous solutions, the own carbonate-rich clays might provide another source of the lime required for secondary calcite precipitation. It should be considered that calcite decarbonation may extend up to 1000 °C in calcite rich systems if the raw clays contained coarse calcite grains and/or if the heating rate was rapid [66]. Therefore, the simultaneous presence of neo-formed phases and primary calcite might take place during firing. The occurrence of aragonite in brick M2_4.6 could be related to the presence of humic acids [71] in the environment surrounding where it was settled the brick.
Due to the low sodium as well as to the high aluminum and calcium contents determined in the ceramic bodies (Table 2), analcime Na(Si2Al)O6H2O detected by PXRD in some beige hue bricks probably corresponds to wairakite (CaAl2Si4O122H2O), a zeolite with almost the same diffraction pattern of analcime. The high humidity conditions of the placement of the bricks may have fostered the formation of the zeolite from the amorphous glassy phase produced during firing, a secondary product that was detected in other historic bricks that shape the built heritage of the city of Padua [72]. As those products were only detected in the beige hue bodies, the use of Ca-rich base clays seems to boost the nucleation of these types of zeolites. Thus, the high contents of amorphous phase promoted by high-fired carbonate-rich clays may enhance zeolites nucleation [53,73]. Wairakite can also be derived from the transformation of gehlenite in humid environments [53,69,74]. In the yellow body M1_4.8, the leaching of potassium from the alteration of the glassy phase might yield to leucite (KAlSi2O6) precipitation. Therefore, zeolite formation also points out the important presence of calcium carbonate in the base clays and may induce some color changes, turning the pastes lighter.

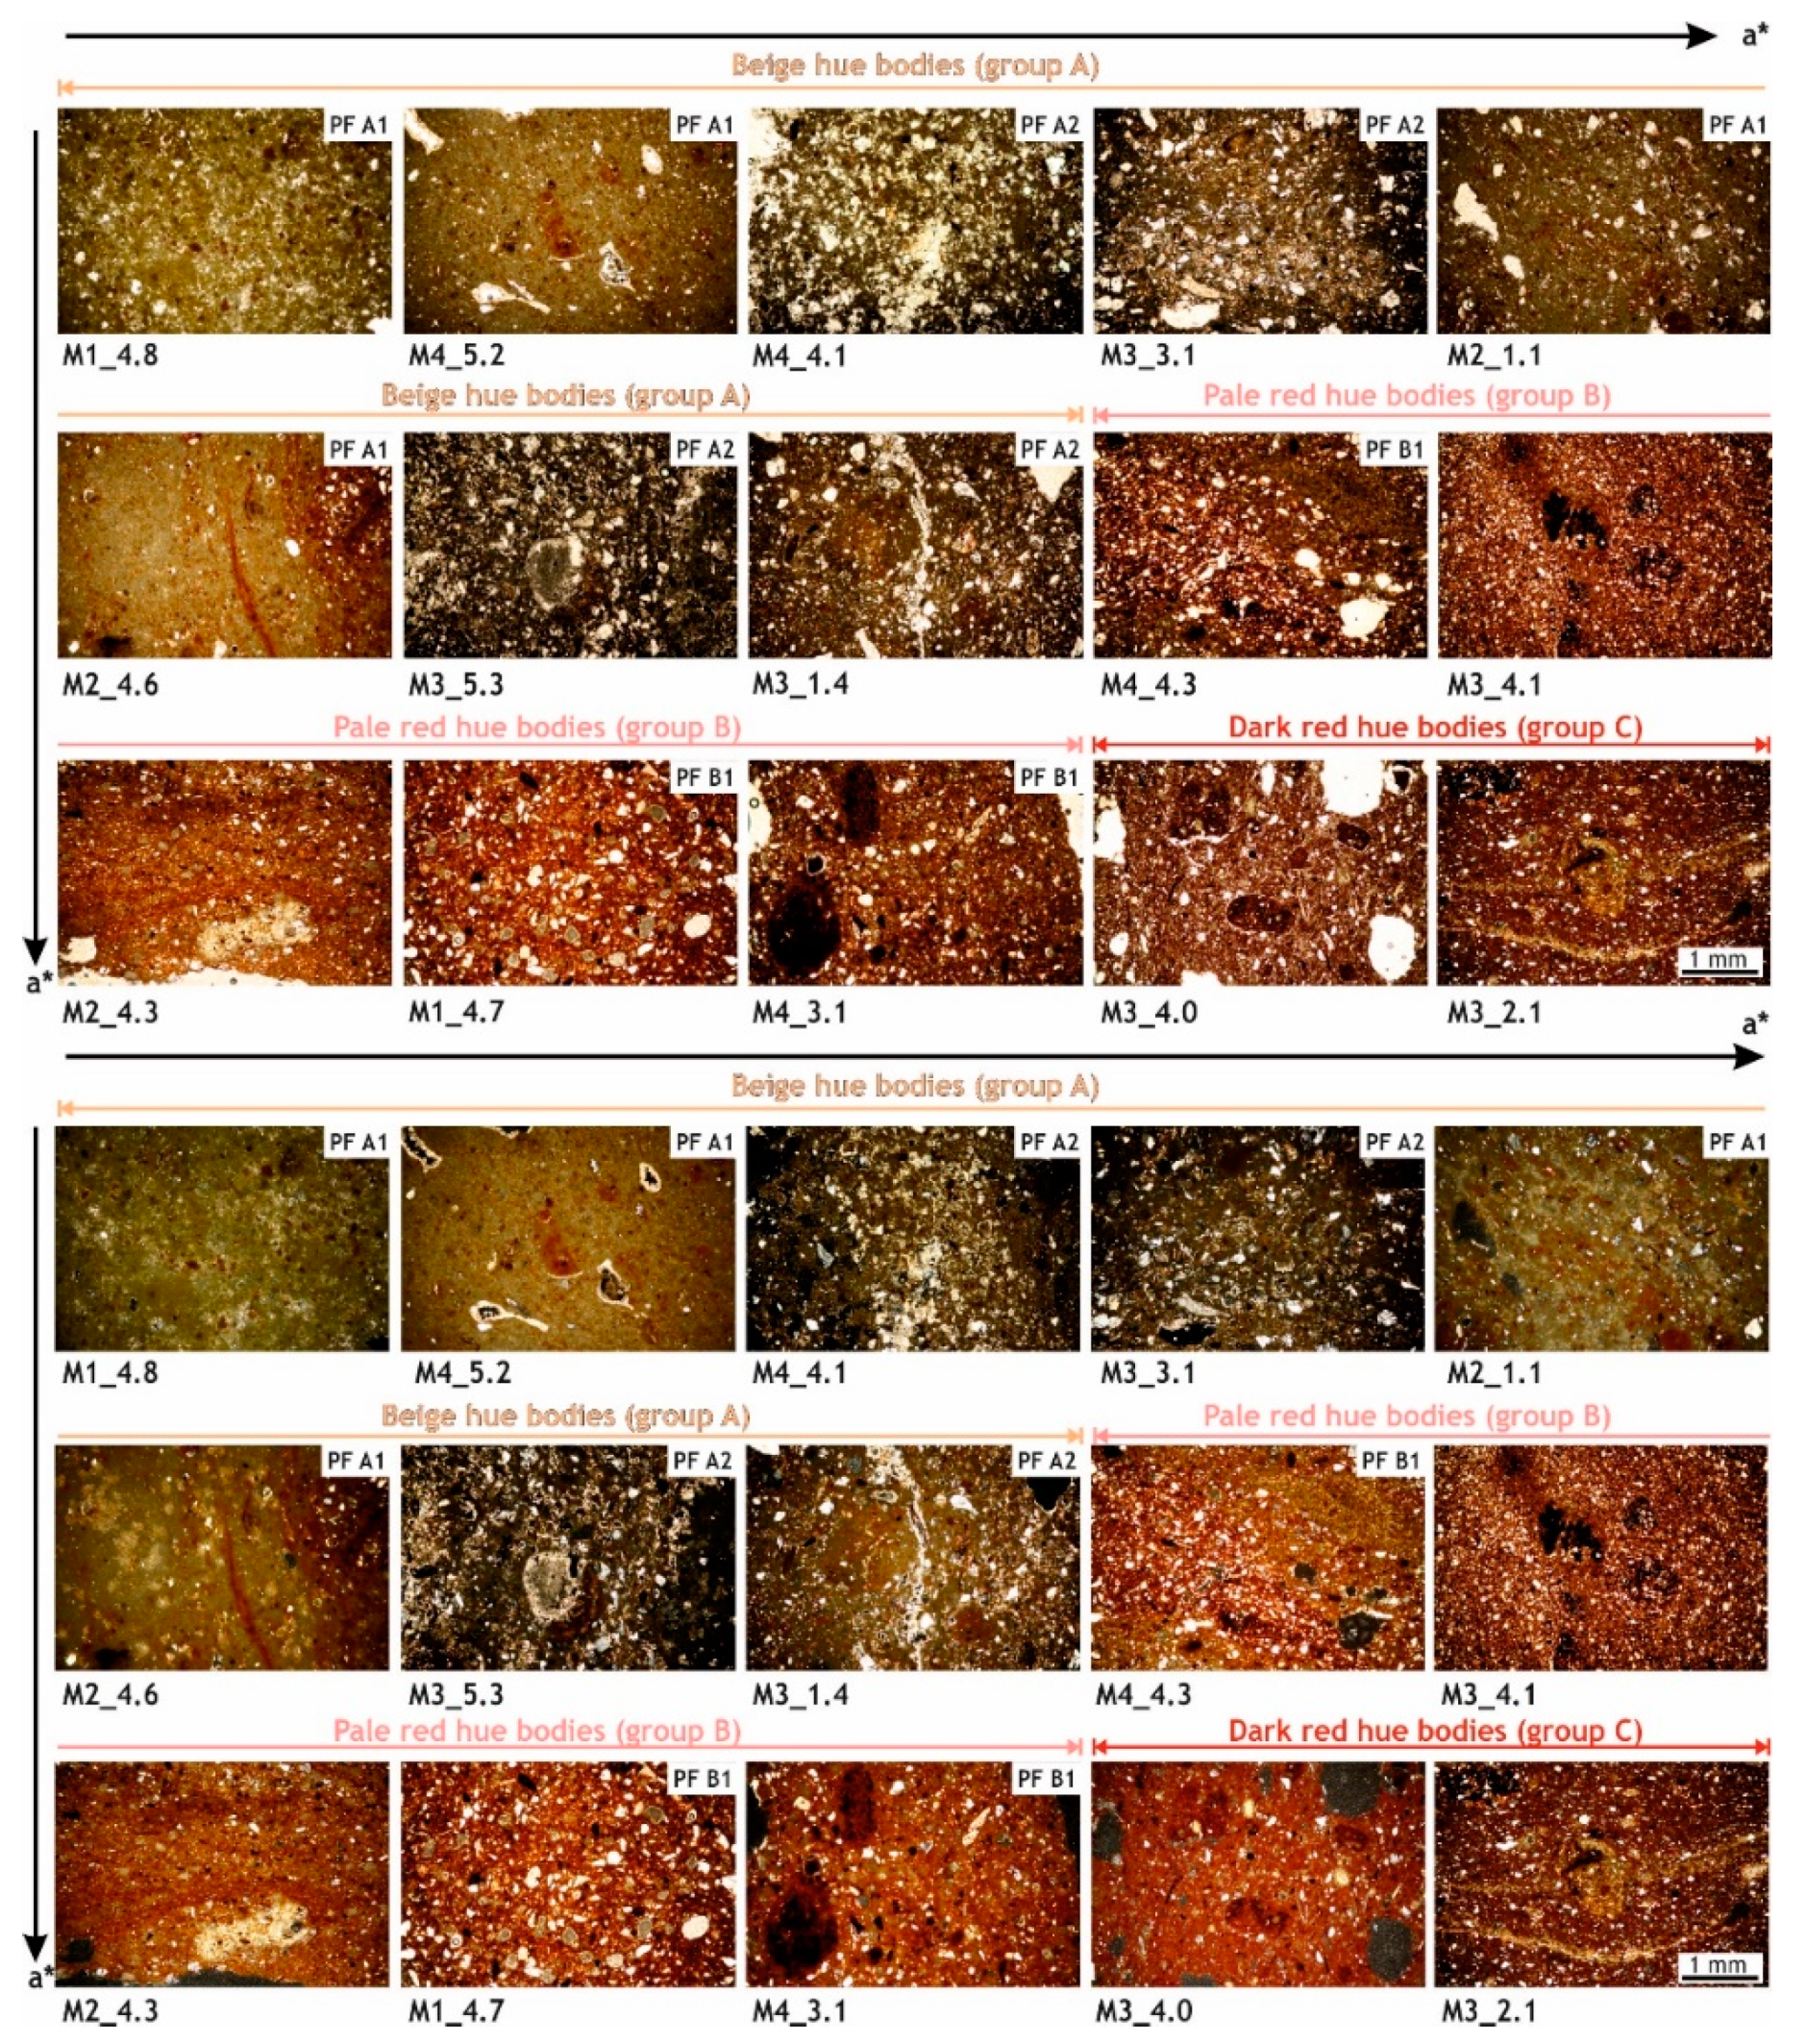
3.1.4. Petrographic Description of the Ceramic Bodies

Under the polarized optical microscope, the ceramic micromass of the various bricks displays colors from yellow–beige to dark brown–red hue (Figure 8). Despite the high heterogeneity of the ceramic bodies, on the basis of the texture of the groundmass and quantity of inclusions, samples show some common petrological features. Consequently, three petro-fabrics (A1, A2 and B1) could be distinguished.
  • Beige hue bodies (group A): petro-fabrics A1 and A2
    • Petro-fabric A1 (M1_4.8, M4_5.2, M2_1.1 and M2_4.6 samples) is characterized by a homogeneous, bright yellow-brown hue and optically slightly active matrix. High birefringence and clustered crystals—corresponding mainly to secondary calcite—are extended through the groundmass. A low content of inclusions (5–10%) are noted, mainly represented by greyish carbonate fragments with reaction rims, heterometric in size with sub-rounded and sub-angular shapes, which underwent decomposition during the firing process, so that they have lost their birefringence and have developed dark halos. About 5% of the mass is formed by fine-grained (silty in size) inclusions of sub-rounded monocrystalline quartz. In some bricks, quartz occurs also with angular crystals of medium sand-size, mainly due to its lower consumption during firing. Isolate K-feldspar cystals rather altered, heterometric and sub-angular in shape, and plagioclase are observed. Dark mica flakes and very fine grain-sized clay pellets with unimodal distribution are evenly distributed within the matrix. About 5% of porosity is noted, quite higher in brick M1_4.8, being represented by rounded and sub-rounded pores (vesicles), homogeneous in size and by shrinkage rims developed around inclusions, partially filled by secondary calcite.
    • Petro-fabric A2 (M4_4.1, M3_3.1, M3_5.3 and M3_1.4 samples) shows a slightly optically active and quite heterogenous groundmass, where dark brownish and bright yellow areas as well as micritic domains can be observed. Secondary calcite is pervasively crystallized in some areas, increasing the birefringence of the micromass. About 15–20% of inclusions are present and represented by predominant carbonate grains in orange and dark brown colors, with unimodal grain-size distrubution—occasionally up to 2 mm and with dark halos, sub-angular shapes and with the development of intense reaction rims. About 1% of the groundmass is formed by quartz inclusions, overall as single crystals with angular and sub-angular shapes and seriate grain-size distribution. K-feldspar highly altered is frequent, displays seriate grain-size distribution and sub-angular shapes. Sub-millimetric clayey pellets with unimodal distribution—occasionally up to 2 mm—and dark lamellae of biotite with very marked exfoliation—where secondary calcite is likewise formed—are common. Scattered hematite crystals and some metamorfphic rock fragments (MFR)—quartzite and gneiss—and argillaceous rock fragments (ARF) are detected. The micromass shows about 10% of porosity and secondary calcite crystals overlays the inner walls of pores, with irregular and sub-rounded morphologies (vughs and vesicles), and almost fill the porous rims.
  • Pale red hue bodies (group B): three samples show analogous microscopic features (petro-fabric B1), while other two set apart (M2_4.3 and M3_4.1).
    • Petro-fabric B1 (M1_4.7, M4_3.1 and M4_4.3 samples) is characterized by a uniform, brown-red and slightly optically active groundmass—with a Fe-rich composition—where portions with bright color and high birefringence—with a calcareous composition—were embedded. Inclusions are abundant (40–50%), mainly sub-rounded and sub-angular with bimodal grain-size distribution. Carbonate inclusions are rather altered and some display reaction rims, single crystals of quartz are angular and sub-angular in shape, K-feldspar also shows a high alteration degree and coarser grains are occasionally observed, and plagioclase crystals and mica flakes are often oriented. Sub-millimetric in size Fe-rich clay pellets—sometimes over 1 mm, ARF with unfilled porous rims, opaque and scarce MFR are also present. Porosity is quite low (less than 5%), corresponding with rounded and sub-rounded pores (vesicles) with inner rims slightly covered by secondary calcite crystals.
    • Brick M2_4.3 is petrografically quite similar to petro-fabric B1, but is characterized by Fe-rich and Ca-rich domains segregated as flux textures.
    • Brick M3_4.1 shows a red color groundmass with speckled birefringent areas where some bright crystallitic portions with secondary calcite are present. Inclusions are very abundant (70–80%), overall quartz and K-feldspar, in sub-angular shapes and mainly homogenous in size. Oriented plagioclase and biotite flakes, millimetric and irregular in shape carbonate grains, very dark areas that may correspond to relict of manganese nodules from the base clay and dispersed hematite crystals are also detected. Clay pellets and ARF—occasionally with porous rims, in some cases filled by secondary calcite—are also observed. Porosity is low, being represented by irregular and elongated pores (vughs and channels) with secondary calcite in the inner rims.
  • Dark red bodies (group C): M3_4.0 and M3_2.1 samples
    • Brick M3_4.0 displays an intense red hue and high porous groundmass with low optical activity. The inclusions content is high (40–50%) and represented by carbonate grains rather altered but without evident reaction rims, quartz and K-feldspar with unimodal grain-size distribution and angular and sub-angular shapes. Plagioclase and mica flakes are often oriented. Fe-rich clay pellets are frequent and ARFs normally display unfilled porous rims. Isolate hematite crystals, opaque—mainly oxide minerals- and very dark portions—probably also related with the high manganese content of the clayey earth—are detected. Millimetric in size empty pores with sub-rounded morphologies are abundant.
    • Brick M3_2.1 shows a red-brown hue and slightly optically active groundmass with speckled birefringent flux fabric. Carbonate grains, both fine grained within the flux textures and very coarse highly transformed, can be observed. It is suggested that decomposition of carbonate grains has provided abundant free lime that has then crystallised as secondary calcite, in the border of the coarse grains and in the adjacent micromass. Indeed, such secondary crystals are formed within the fissures extending throughout the groundmass. Quartz and K-feldspar inclusions with unimodal distribution and angular shapes are highly abundant (60–70%). Frequent plagioclase and mica flakes are often oriented to the brick walls. Dispersed clay pellets, hematite crystals, opaque, dark nodules, ARFs with no porous rims and high altered trachyte fragments with phenocrystals of biotite and hematite crystals are also present.
The microscopic analysis of the bricks clearly indicates the use of at least two different types of clayey materials. The base clays might contain both clayey materials compositionally different or, as it has already suggested, such clays could be intentionally mixed in order to improve the behavior of the bricks and/or for the better use of the available materials. It is suggested that: (i) the carbonate-rich type of clay was predominantly used to manufacture the beige hue bricks, that jointly with the higher firing temperatures yielded more uniform textures; (ii) quartz grains might be intentionally ground and added to some bodies (from their high content, angular/sub-angular shapes and homogenous size); and (iii) secondary calcite formation may enhance the cementation and the lightening of the bodies. Bricks with a higher red color component were produced owing to the major use of Fe-rich clays. With the increasing of the red component a higher silicate inclusion content—mainly quartz and K-feldspars—is noted, in concomitance with sharper morphologies and lower border alteration. Reaction rims were developed in a lesser extent, also in relation to lower firing temperatures.

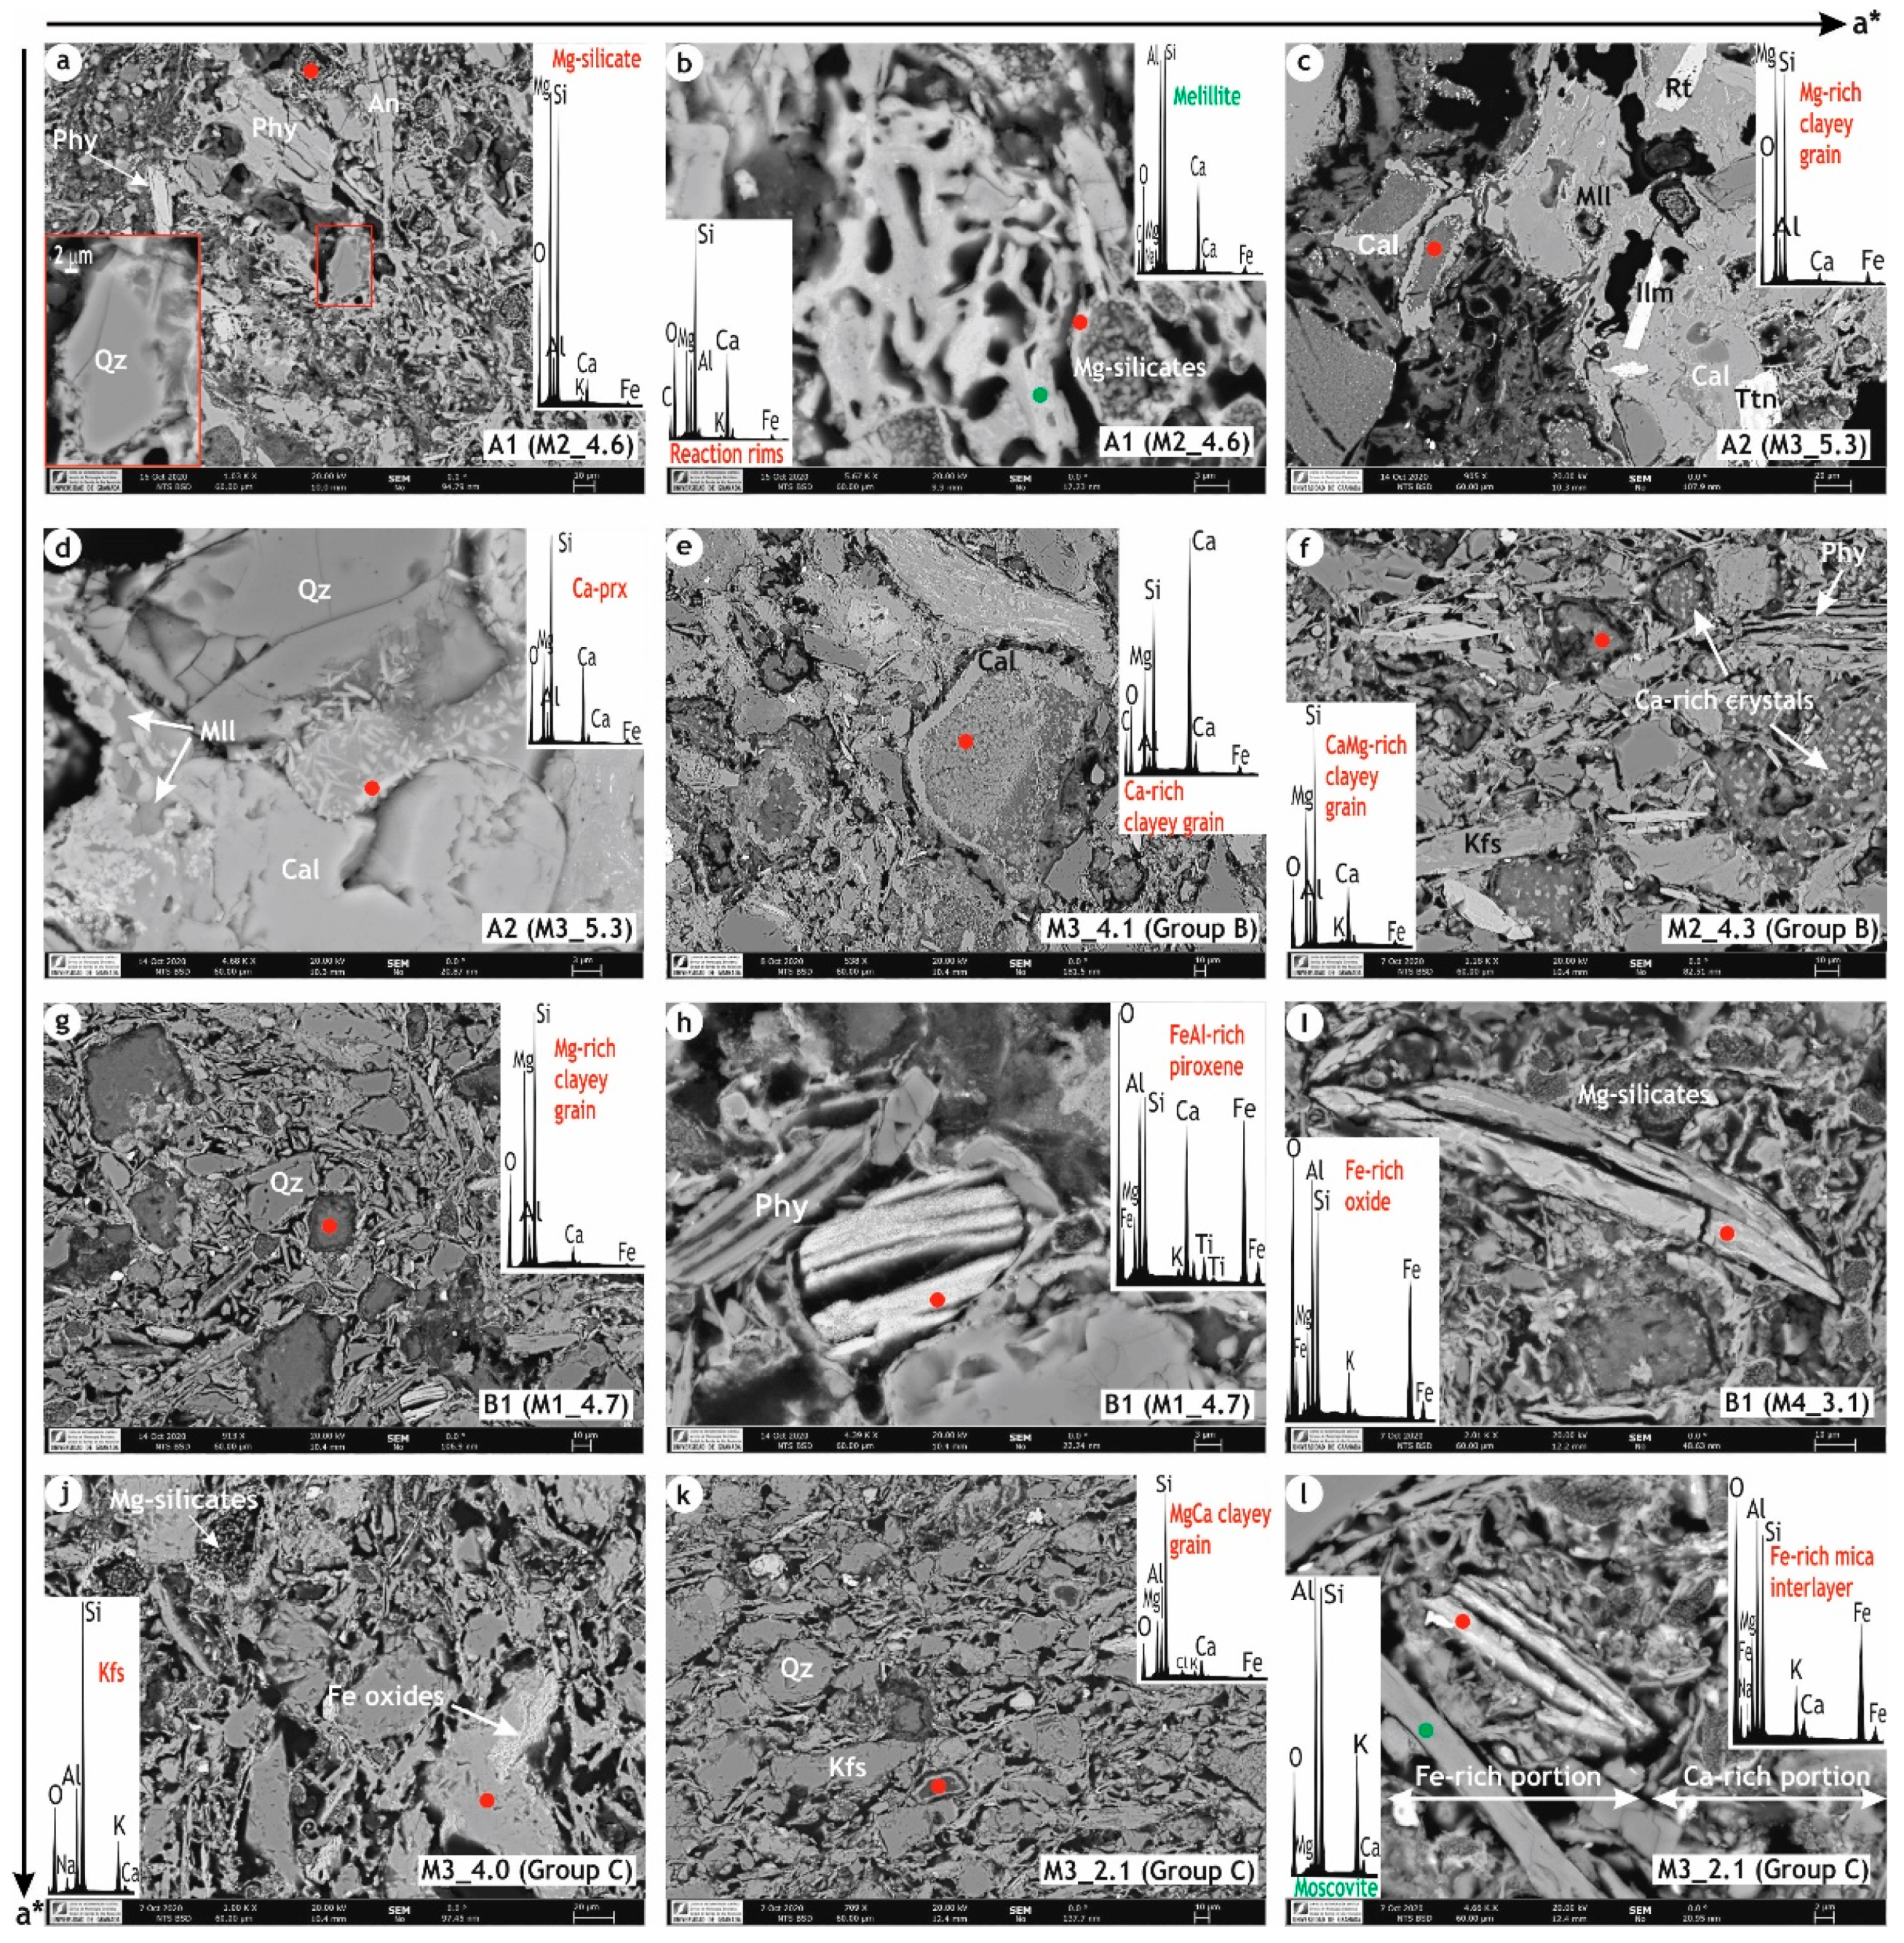
3.1.5. Microstructure of the Ceramic Bodies

The beige hue bodies were achieved an early stage of sintering (Figure 9a,c) despite the high temperatures reached (≥900 °C). As silicon, aluminum, calcium and magnesium were incorporated into the high-temperature phases, the melting process was blocked [76]. In fact, the micromass was found rather porous than the expected after MOP observations. It is important to highlight that although the carbonates induce the blocking of the sintering at high temperatures, they foster the development of a very stable microtexture [77]. Dark particles with a melilite composition reaction rims and composed by Mg-rich silicate crystals, more abundant in petro-fabric A1 (Figure 9a,b), can be noted. A Ca-Al-silicate matrix is extended through some areas of the micromass, and Ca-pyroxene crystals are crystalized within (Figure 9c,d).
Mg-rich silicate grains with massive texture and porous rims can be also observed in petro-fabric A2 (Figure 9c). Such grains, that may be considered both as carbonate grains aggregated with clayey materials and clayey grains cemented by carbonates, are probably related with the carbonate reprecipitation within the clayey sediments, a pedogenic process quite common in the formation of the soils nearby the city of Padua, which makes such carbonates act as a cementing agent [78]. Anorthite and phyllosilicate pseudomorphs can be also observed, as during firing the primary plagioclase has progressively achieved an anorthitic composition [79] and pristine illite was enriched in iron. In some areas of the ceramic bodies of the samples assigned to petro-fabric A1, secondary porosity due to the partial melting of phyllosilicates and the interconnection of pores with the formation of bridging structures is also present (Figure 9b), suggesting the formation of intermediate members of the åkermanite-gehlenite series from illite/muscovite, as stated elsewhere [80]. Secondary calcite precipitated through the bodies and within the shrinkage rims, overall in A2 bodies, and Ti-bearing accessory minerals such as titanite, ilmenite and rutile are detected (Figure 9c).
The microstructure of the pale red bodies (group B) also shows a low sintering degree, reflected by the limited bridging among particles and the occurrence of abundant isolated inclusions (Figure 9e–i). In some bricks, phyllosilicates still maintained the laminar structure and the exfoliation along the basal planes due to dehydroxylation [22,81,82]. The quartz and K-feldspars residual grains are rather abundant, displaying angular and sub-angular morphologies, and almost no reactions with the evolving surrounding micromass are observed. The dark inclusions composed of Mg-rich silicate crystals are observed in a lower extent, mainly within the Ca-rich portions of the matrix (Figure 9i). A high content of CaMg-rich clayey grains with porous rims occasionally filled by secondary calcite are also observed (Figure 9e). Mg-rich clayey grains with a massive texture, slightly altered boundaries and with differential calcium content are abundant (Figure 9e–g). Hematite crystals occur, both scattered in the matrix and developed along phyllosilicate flakes (Figure 9g,i).
The dark red hue bodies (group C) display similar microstructural features. Quartz and K-feldspars grains are angular in shape and the tabular structure of phyllosilicate—partially deformed—is preserved (Figure 9k). Scarce Mg-rich silicate crystals with rims are present. The growth of Fe-rich oxides is noted within K-feldspar grains (Figure 9j).
These features are also in concordance with the MOP observations and with the temperature data provided by PXRD results, especially for the beige hue ceramic bodies (≥900 °C). Moreover, some pale red bodies did not exceed 850 °C, as during the firing of the dark red hue pastes. To an increase of the red component color, the micromass displays a lower degree of sintering. While the early sintering stage of the beige hue bodies was inhibited by the formation of the high-temperature phases, in the red bodies was mainly due to the lower temperatures reached during firing. It is suggested that both Mg-rich clayey grains with massive texture and dark particles composed by Mg-rich silicate crystals were derived from the differential transformation of the pristine impure carbonate fragments aggregated with clayey materials/clayey grains cemented by carbonates of the raw clays. As these observations may correspond to diverse transformation stages, both the alteration degree of such inclusions and the development of reaction rims around them may represent markers of the firing temperatures and of the base clay composition. That is, inclusions composed by Mg-silicates crystals and with melilite composition rims were formed over 900 °C, enhanced by a higher content of Mg-rich calcareous clays. Moreover, the presence of such Mg-rich inclusions can represent a provenance marker.

3.2. Bricks Physical Performance and Durability

Due to the high textural difference of the ceramic bodies, largely induced by the diverse inclusions content and the composition of the micromass, the results achieved were mainly analyzed considering the bodies belonging to petro-fabrics A1, A2 and B1, as some trends can be stated chiefly due to their common petrological features. As samples M3_4.0 and M3_2.1 (belonging to group C) do not belong to any of the three identified general petro-fabrics, their physical behavior and durability were not assessed.

3.2.1. The Porous System

Bricks are characterized by a high open porosity values, between 35% and 52% (Table 3), being those with beige hue the most porous (Po > 40%), especially belonging to petro-fabric A1, with an average of open porosity of about 48%. A1 bricks tend to absorb water faster at the beginning of the test, reaching after the first hour a weight variation from 0.18 up to 0.23, while more time it would be needed to reach the maximum free water absorption (Figure 10). The open porosity values of the red hue bodies (overall around 35%) are in concordance with the porosities usually shown by traditional bricks [70] and are mainly related to the low sintering achieved. In the beige hue bodies, produced from carbonate-rich clays, the early sintering stage might yield bodies more prone to water decay action. Hence, porosity due to decay process appears to be also included in the results. Moreover, the porosity generated from CO2 release—a normal process during the firing of carbonate-rich clays [83]—and generated by the contraction of inclusions during the cooling process (especially for quartz, with the characteristic shrinkage rims) should be also considered, although both porosities were partially filled by secondary calcite, as microstructurally pointed out.
Real density values are quite similar in all the samples (from 2.5 to 2.8 g/cm3) and mainly related with silicates and carbonates occurrence (quartz = 2.7 g/cm3, k-feldspar = 2.6 g/cm3, calcite = 2.7 g/cm3 and dolomite = 2.9 g/cm3). The larger real densities of the beige hue bodies may correspond to the high-temperature phases, with greater densities (melilite = 2.9 g/cm3, anorthite = 2.8 g/cm3 and diopside = 3.3 g/cm3). The more porous are the bodies the higher is the difference between both density values. In fact, samples M1_4.8 and M2_1.1, having the highest open porosity values (Po > 50%), display the lowest apparent density values.
The greater the difference between water absorption at atmospheric pressure (Ab) and water absorption under vacuum (Af), the more tortuous is the porous system, so the communication between the pores (Ax) become more difficult [20]. The lowest interconnectivity resulted on the A2 bodies, with the highest Ax values (average Ax = 10.7), where more water was absorbed by means of forced saturation (Figure 10). This suggests that the inclusions content may increase the tortuousness of the pore system. The low Ax values (<0.8) showed by samples M1_4.8 and M2_1.1, which are highly porous, point out a decrease of the tortuosity corresponding to an increased porosity. On the other hand, from the overall interconnectivity of the red hue bodies (Ax < 4.6, except for M3_4.0) it is suggested that phyllosilicates orientation might likewise reduce the tortuousness. The bodies with better connection between the pores (i.e., with lower Ax values) should display the higher saturation coefficients [84]. However, the very high porosity values and the important textural heterogeneity of the bodies might change such a trend in some samples. It is interesting to note that as tortuosity reduces the bodies saturation, may somehow enhance bricks durability as might minimize the entrance of water.
The more time the water remains inside the bodies, the more exposed are the bricks to its decay action, so when the bricks durability is assessed, it is important to determine the drying index (Di) [85]. The lower the index, the faster the drying, depending the speed at which the brick dries out mainly on the porosity, pore interconnection and pore-size. Regarding the drying capacity of the bodies, all show quite similar Di values (1.5–1.6) and, in overall, a fast-drying rate in the first stages. Nevertheless, diverse behaviors are observed in the drying curves slopes (Figure 10). The A1 bricks tend to dry faster, mainly due to their higher porosity values, in particular the sample M1_4.8 (with the lowest Di and the highest Po). Drying is longer for A2 bricks, no common trend is showed by the curves and water remains entrapped within the bodies at the end of the test, largely because of the high tortuosity of the porous system. The first stage is quite short in B1 bricks that gradually dries out in a similar manner and still retains water at the end of the test. In this case, this effect is mainly related with the high percentage of pores with a size <0.1 μm (Table 3), that are the last ones to lose water due to their small size.
The open porosity values achieved by MIP tests are in concordance with those determined after the hygric test performance (Table 3). Hence, the highest porosities are measured in the A1 bodies (average PoMIP = 45%) and the lowest in the B1 bodies (average PoMIP ≈ 32%). The variable and high specific surface area values (SSA from 6 to 37 m2/g) are largely due to the low sintering of the bodies as well as to their textural heterogeneity. Higher SSA values are measured in bodies with the larger number of smallest pores (i.e., those under 1 μm, see Table 3), being more exposed to decay agents [86]. Bricks M2_1.1, M3_5.3 and M3_4.0 show a quiet similar percentage of microporosity under and over 1 μm, while the rest of the bricks display a predominant microporosity under 1 μm. This is mainly related to the different manufacturing processes of the bricks. Such a trend is just modified in the beige hue bodies of M1_4.8 and M2_1.1 (which were made with very carbonate-rich clays) and is related to their higher porosity values.
Despite the rather diverse porosimetric curves (Figure 11), many bricks show a unimodal pore-size distribution, where a high quantity of pores lies within the 0.1–1 μm range and with the maximum frequency between 0.4 and 1.3 μm. The width and height of this peak are according with the open porosity variation—PoMIP from 26% (M1_4.7) to 49% (M1_4.8)—and rather similarities display the curves of the samples belonging to each petro-fabric. The displacement towards larger pore-sizes of the main peak for brick M1_4.8 (>60% within 1–10 μm interval) is mainly related to its larger open porosity (49%) and according to the friable texture noted on the fresh surface, as also observed for brick M4_4.1. Just these two bodies (M1_4.8 and M4_4.1) show the largest number of pores with size over 1 μm. The similar trend but with a wider and lower peak of M3_3.1 and M3_1.4 bodies (A2 petro-fabric) maybe related with the seriate grain-size distribution of the inclusions they contain. It interesting to note that the highly uniform textured M2_4.3 body displays the narrowest peak. The step towards smaller pores in the curves of M2_4.6 and M3_2.1 bodies might be related with the flux textures shown by such bricks, as it could define the characteristic pore-size of the segregate portions texturally different within the groundmass. Therefore, such flux textures may induce a differential behavior within the bodies against the entrance of water and its transfer inside.

3.2.2. Compactness, Anisotropy Indices and Compressive Strength
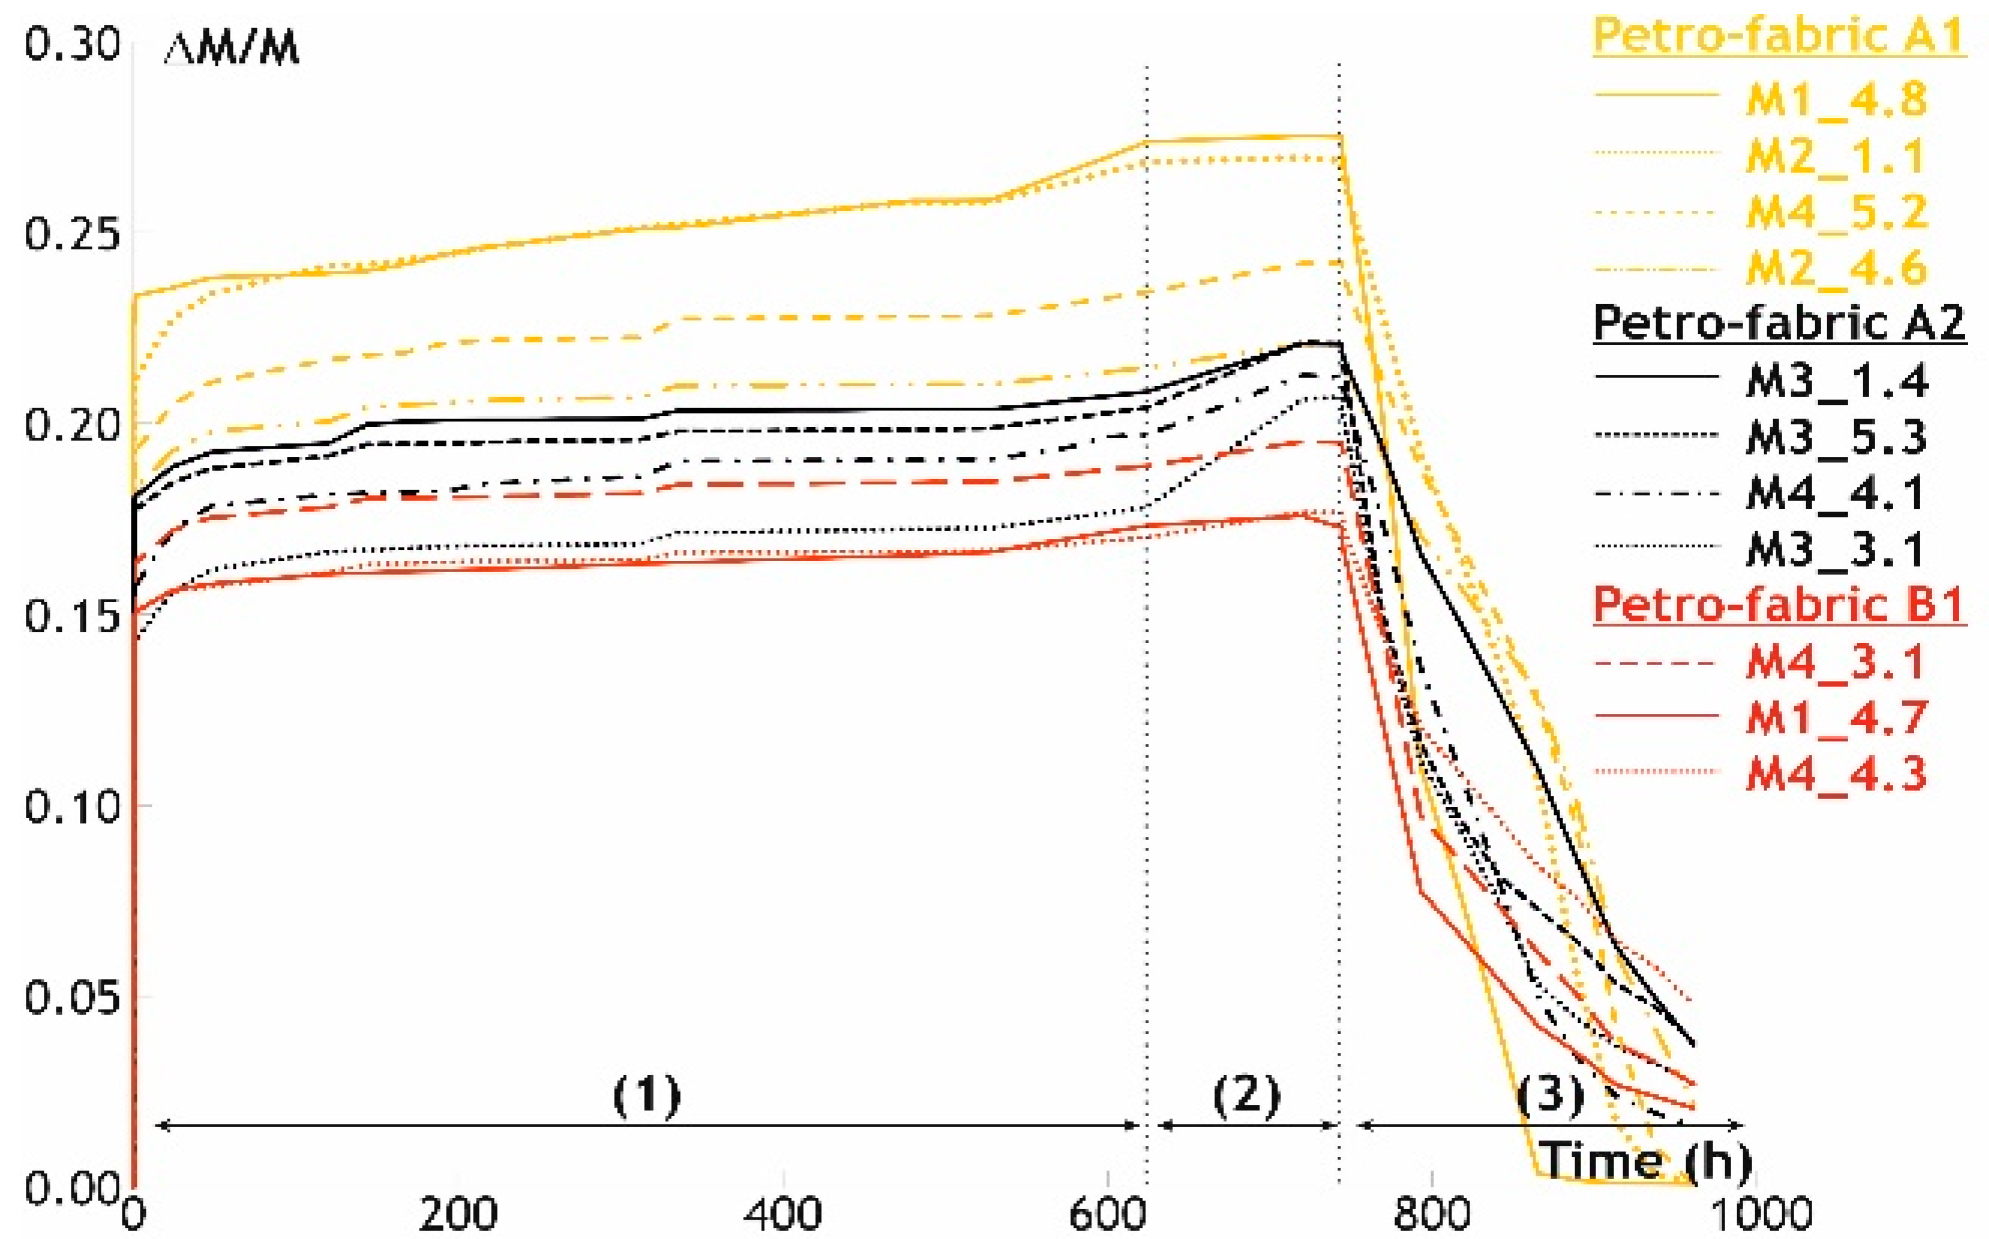
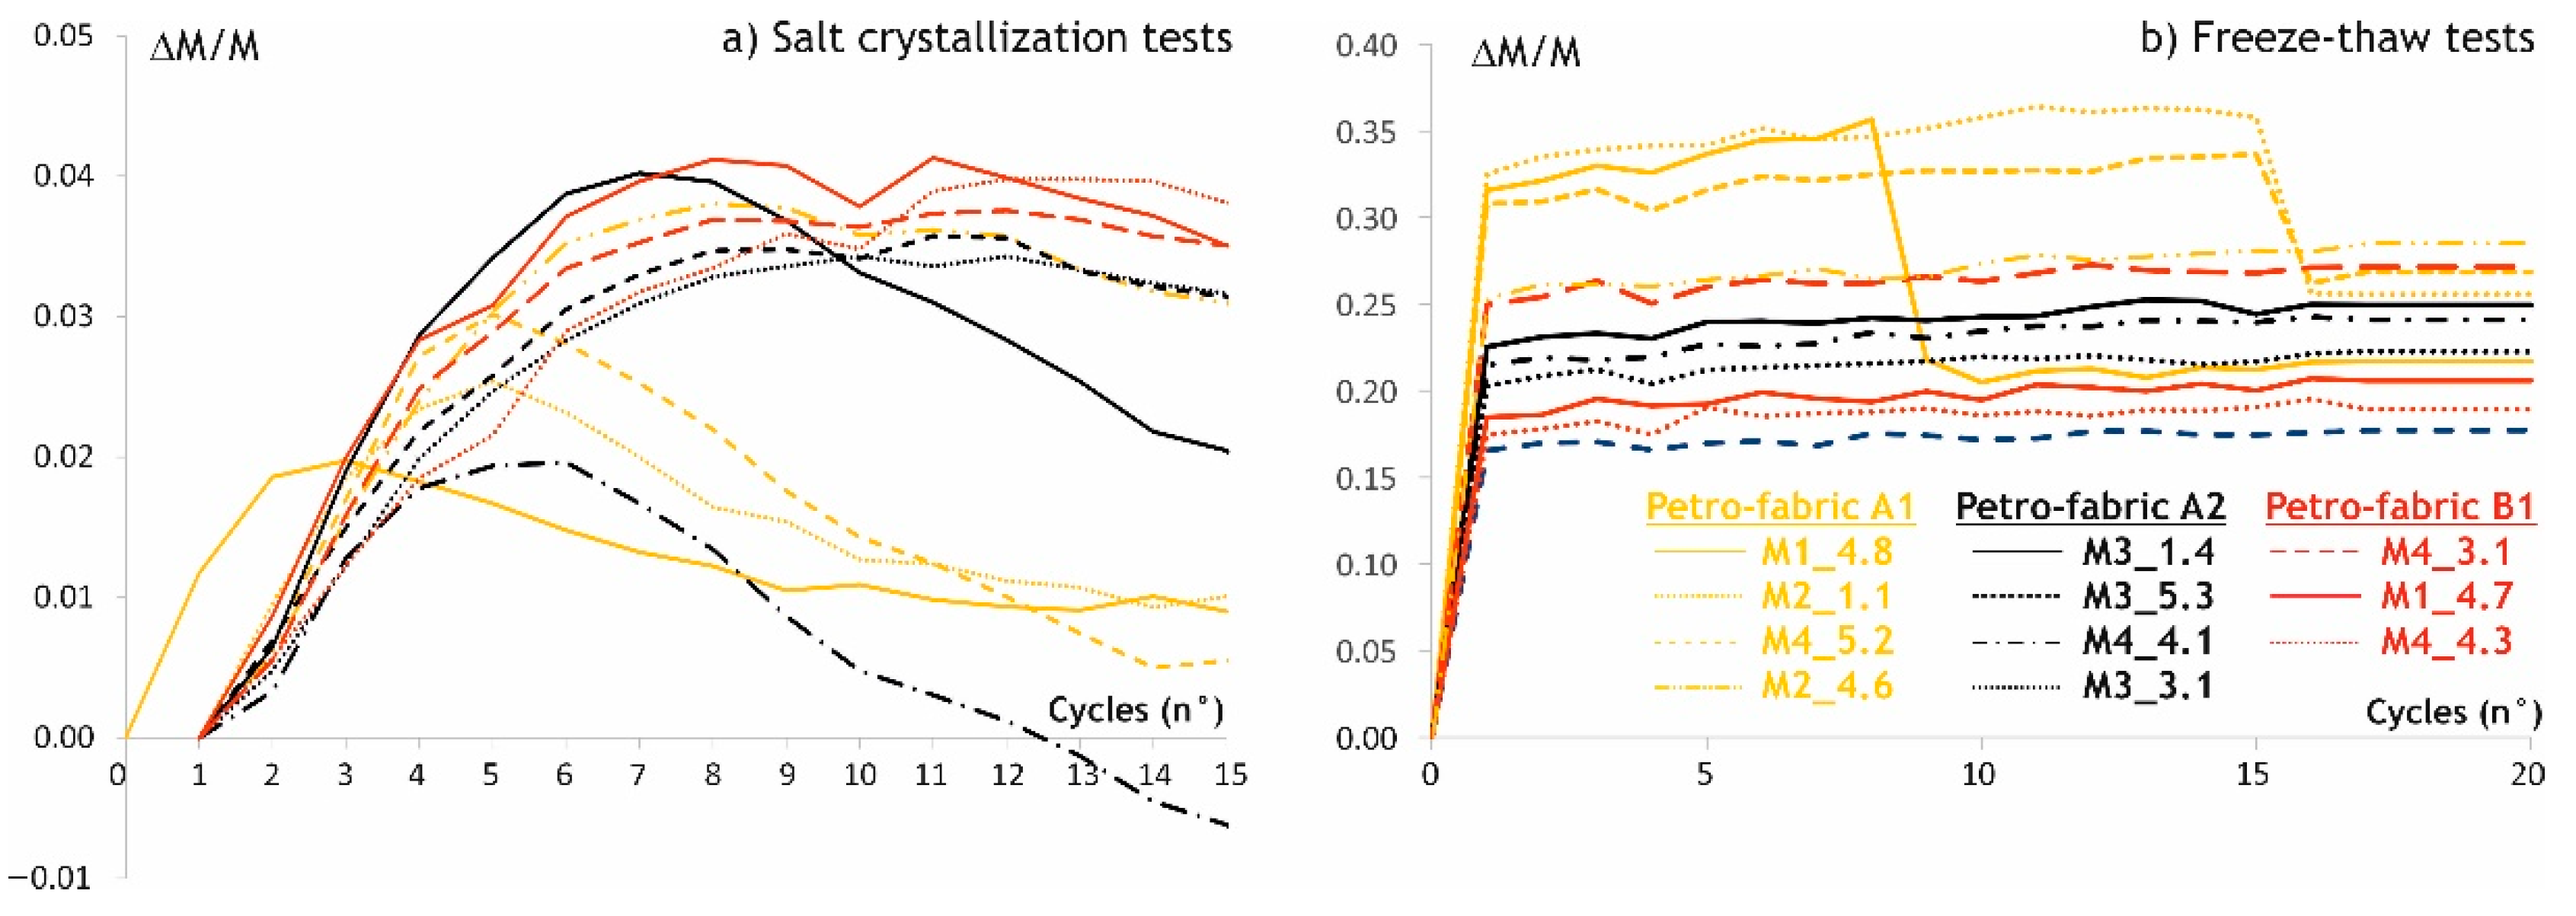
Overall, the red hue bricks show high ultrasound velocities, in particular those belonging to petro-fabric B1 (average Vp = 2408 m/s) and rather high anisotropy values (Table 4). Although the beige bodies were fired at higher temperatures than the red ones, the higher open porosity (Po > 40%, Table 3) has turned out in less compact bodies than expected, so smaller ultrasound velocities were measured. To a great extent, the formation of high-temperatures phases with higher densities and the precipitation of secondary calcite have influenced the peak velocity values measured in some beige hue bodies (M2_4.6 and M3_1.4). The lower velocities of bricks M1_4.8 and M4_4.1 (average Vp = 2025 and 1550 m/s, respectively) are consistent with the hygric parameters and, likewise, related with the friable texture of such bricks, that yielded a weaker union among constituents of the ceramic body. As the wave transmission decreases when inclusions content increases, due to multiple reflections and refractions [87], the higher percentage of inclusions in the A2 bodies may have led to a lower average velocity than for the A1 bodies. Nevertheless, the higher amount of secondary calcite precipitated into A2 bodies and the high porosity of A1 bodies—that has significantly reduced P-wave transmission—have yielded opposite values than expected (average Vp = 2217 m/s and 2360 m/s for petro-fabric A1 and A2, respectively).
The P-wave velocities are somewhat different in the three orthogonal directions, in particular in the beige hue bodies, again because of the uneven textures and their high porosity. Hence, almost all the bricks are highly anisotropic and especially in terms of structural anisotropy (∆M), as it considers the velocity in the three directions of space, whereas the relative anisotropy (∆m) is calculated from the two directions lying parallel to VP1. Except for bricks M1_4.8 and M4_4.1, in the A1, A2 and B1 bodies, the decrease of the ∆M and ∆m anisotropies is observed, as well as the difference between both values, in concordance with the progressive decline of the open porosity.
In concordance with the ultrasound velocities values, on the pale red bodies a higher cubic compressive strength (fc ≈ 25 N/mm2) than on the beige hue bricks (fc = 23.4 N/mm2) is measured. These values of strength approximately correspond with the upper range of compressive strength found in literature concerning historic bricks [88,89,90,91]. Interestingly, the compressive strengths are within the mechanical range of contemporary soft mud solid clay bricks [92]. Both types of bricks show normalized compressive strength values higher than 5 N/mm2 (fb = 18.7 and 23.2 N/mm2 for beige and red hue bricks, respectively), which is the minimum compressive strength required for masonry units in the design of masonry structures in seismic regions [93]. Moreover, according to [88,94], the data achieved point out also the high resistance of both types of bricks to main decay agents.

3.2.3. Durability

After the salt crystallization test, some material loss is visually observed, mainly in the A1 bodies and mostly located in the corners and edges of the cubic samples. The lower increase of weight is recorded in the A1 bodies and some A2 bodies, and the B1 bodies display rather similar weight rising (Figure 12a). The weight increasing between cycles 2 and 9 chiefly corresponds with the salts crystallized within the pores. Then, the weight began to fall, primarily due to material loss—or it was almost stabilized with a very subtle decline—mostly because of the crystallized salts that remain inside the bodies.
Despite that high porous bodies are more susceptible to decay by salts action [42], the stop in weight increasing already in cycle 2 and the small material loss in sample M1_4.8, which has the highest open porosity (PO ≈ 52%) and the largest amounts of pores over 1 μm (≈86%), suggest that these characteristics may allow a better salt solution circulation with a reduced entrapped content within the pore system of the bodies. Hence, a better resistance against salt crystallization may be achieved, as a lower weight increment and material loss occurred. However, the higher porosity caused a greater cracking and/or material loss. The loss of material in sample M4_4.1 is consistent with its hygric and mechanical behavior (Table 3 and Table 4), again due to the weaker union of their components.
The increase of weight in bricks M1_4.7 and M4_4.3 drops at cycle 10—due to material loss caused by crystallized salts—and raises afterwards, as salts were likewise crystallized in new fissures. The larger increase of weight in the B1 bodies is mainly due to the significant percentage of pores under 1 μm, where the salt solution is retained in a higher amount, with the potential crystallization of salts [88]. As for frost resistance, the A1 bricks show a quite different behavior than A2 and B1 (Figure 12b), as the former—which lost mass in the salt crystallization tests—display the highest increase of weight and were broken down during the freeze-thaw test. Pervasive fissures due to frost action formed around the larger clayey lumps, pervading the whole M2_1.1 body. The other samples show a lower increase of weight and did not lost material. Nevertheless, significant fissures due to frost action were formed in M3_2.1 and M2_4.6. Low porosities and pore-size distribution with many large pores enhance resistance to frost action of bricks [88]. Hence, the high porosity values and the low sintering degree of the A1 bodies have induced overall weight loss and damage in the M1_4.8 sample that displays approximately 85% of pores over 1 μm and that has an open porosity of about 52% (Table 3). On the other hand, A2 and B1 bodies show a resistance to frost action rather better than expected, as they have also high porosity values and, in most of the bodies, the pore-size under 1 μm is predominant. In the case of bricks B1, both the lower porosity and connectivity of the bodies might yield more durable bricks.
It should be highlighted that the different pore-size and amount of sample analyzed by means of hygric tests and MIP technique may provide not correlated data, especially if high texturally heterogenous ceramic bodies are studied. Overall, a high porosity value led to ceramic bodies being less resistant to both stress conditions, and it is suggested that a low interconnectivity may increase bricks durability.

4. Discussion

The preliminary grouping based on color measurements of historic bricks rather well-preserved sampled from the Renaissance walls of the city of Padua has entailed the starting point for the knowledge of some common production technologies. Despite the highly uneven texture of the studied bricks—both within and among the bricks—beige hue, pale and dark red ceramic bodies were primary identified. From the compositional and textural analysis performed:
(i)
Mg- and Ca- (carbonate)-rich illitic clays fired at temperatures of over 900 °C were used to manufacture the beige hue bodies, while the pale red ones were made using carbonate illitic clays rich in Fe and fired at 850–900 °C.
(ii)
the beige hue was partly provided by the formation of calcium-aluminosilicates and calcium/magnesium silicates (high-temperature phases), which progressive decreasing yields to red hues, as more iron remains free and may crystallize as hematite. The values of the chromatic coordinates (a* and b*) may entail markers of the mineralogical phases formed during the firing process, hence of the approximative base clays composition and firing temperatures.
(iii)
an early sintering stage was achieved for the beige hue bricks, as the melting process was blocked by the formation of the high-temperature phases, while for the red bodies it was due to the lower firing temperatures reached.
Considering the high firing temperatures of the beige hue bricks, rather more compact bricks were produced. The trend was changed mainly because of the early sintering stage achieved that yielded bodies more porous than the expected, and because of the high carbonate content of the used raw materials that shaped bodies more prone to water decay action. This occurred especially in M1_4.8 and M2_1.1 bricks, where the initial micro-porosity might have been increased due to dissolution processes. Hence, the physical performance and durability of bricks were influenced by the larger pores formed because of the dissolution of the carbonate-rich bodies rather than by the high temperatures reached. In the pale red hue bodies, it is interesting to note that besides the lower water entrance due to the lower porosity, the higher silicate content reduced the susceptibility of the bodies to water decay action. However, the higher micro-porosity under 1 μm increased the vulnerability of the bodies to salts and frost action, which in turn may be partly reduced due to the lower tortuousness of the pore system.
Despite the high open porosity values measured, the diverse pore-size distribution of the bodies may enhance the conservation of the bricks. Firstly, the two main pore-size distributions yielded by the different production processes followed the manufacturing of the bricks, one with a quite similar percentage of pores under and over 1 μm and the other with a predominant micro-porosity of under 1 μm. Secondly, there is the earlier micro-porosity inversion that might have taken place over time within the more Ca-rich bricks and that raised the number of the larger pores. That diverse pore-size distributions might lead a differential physical behavior and durability of the bricks that, acting jointly in the fabrics, might counteract the damage caused in bricks by the main decay agents and by the own passing of time.
It could be stated that the beige hue bodies displayed a rather good physical performance and durability in the medium time, fostered by the high-density mineral phases formed during firing and by secondary calcite precipitation, while the pale red in the long time. To date, it is suggested that such differences probably turned out beneficial for the conservation of the brick fabrics of the wall. Moreover, as drying takes place only when vapor is diffused from the wet surfaces of materials into the environment [95], it is suggested that the high humidity of Padua might enhance the conservation of the bricks, as has been observed in other historic bricks of the built heritage of the city [72]. That is, the high open porosity of the bodies facilities the entrance of water inside the bricks and, due to the surrounding humidity, a rather low moisture gradient between bricks surface and the nearby environment might take place, so the humid conditions within the bricks may remain fairly constant. As building materials suffer more decay when they are exposed to changing environmental conditions [96], such a pretty equilibrium might foster a better preservation of the bricks.
When historic brick production technologies are addressed, the relation of the color pastes with the chemical and mineralogical composition of the ceramic bodies could be normally defined. Nevertheless, although the color of the pastes largely depends on the development of high-temperature phases that, together with the sintering of the groundmass, yields more compact ceramic bodies, the link between such colors and the physical performance and durability of bricks cannot always be clearly established.

5. Conclusions

While the color of the ceramic bodies has provided an identifier of the manufacturing technologies of the historic bricks of the Renaissance walls of the city of Padua, the sintering degree could be used as a quality marker of their physical performance and durability. The achieved data build the foundation for future comprehensive studies of ancient bricks towards the understanding of their physical behavior and resistance over time from the manufacturing process. The attained knowledge strongly relies on the importance in considering historic bricks as systems within an entire structure that are continuously interacting with the surrounding environment. However, further work should be conducted. Primarily, it would be advisable to frame the results achieved in a broader context, comprising a higher quantity of bricks both from the walls or other heritage constructions of the city. Moreover, considering the rather good conservation state of the studied bricks, further research should point towards the definition of the moisture gradient between the bricks surface and the nearby humid environment as well as the differential distribution of loads and efforts that may take place inside the brick fabrics due to the diverse porosity and porous system of the bricks constituting the walls.
On the other hand, if ancient bricks were intended to be reproduced, both for restoration and new construction purposes, the original aesthetical features would be ensured by means of color measurements. Moreover, the sintering degree would be used as a quality marker of the bricks physical performance and durability. Hence, the achieved knowledge provides significant data to produce new quality bricks that would increase the conservation of the built heritage. Considering the extensive use of clay bricks worldwide and that the largest part of world heritage sites is exposed to environmental changes and natural hazards, the potential transfer of the approach proposed by this type of multi-analytical study is of key relevance. Lastly, the performed study was focused on highly uneven textured ancient bricks within an historical structure that is interacting with aerial and partially aquatic environs. Certainly, such an approach might be also addressed towards, for instance, new bricks used in contemporary constructions or buried ancient ceramics. In both cases, rather more uniform results would be expected, in that present-day bricks are normally produced under highly standardized processes and quite stable climatic changes take place in buried environments.

Author Contributions

E.M.P.-M. conceived the research, collected the samples, carried out the analysis, interpreted the results, wrote and supervised the manuscript; L.M. conceived the research, wrote and revised the manuscript; E.G. performed the uniaxial compressive strength tests, prepared the cubic samples and revised the manuscript; G.C. coordinated the XRF and FESEM-EDS analysis as well as physical and durability tests, interpreted the results and revised the manuscript. All authors have read and agreed to the published version of the manuscript.

Funding

This research was funded by The European Union’s Horizon 2020 Research and Innovation Programme, under the Marie Sklodowska-Curie grant agreement No 836122 framed on the CLAYONRISK Project, and by the Research Group of the Junta de Andalucía RNM179. The APC was funded by such MSC Action.

Acknowledgments

The sampling authorization by Edi Pezzetta and Monica Pregnolato—from the Archaeology, Fine Arts and Landscape Surveillance of Venice’s metropolitan area and Belluno, Padua and Treviso provinces—and by Domenico Lo Bosco from the City Hall of Padua, is gratefully acknowledged. The bibliography supplied by Marie-Ange Causarano, from the Cultural Heritage Department of Padua University, and her support during the on-site inspection of the walls are deeply appreciated. The courtesy of Arch. Alessandro Campioni, president of the Association Piovego’s Friends, during the visit of Saint Maximo’s floodplain is acknowledged. Special thanks are given to Elisa Pagan, also from the City Hall of Padua, for her invaluable help during the sampling operations. The authors are also grateful to the staff of the Geosciences Department of Padua University Chiara Dalconi, Federico Zorzi and Marco Favero for the support provided with the PXRD analysis and Leonardo Tauro for the thin sections preparation; to David Benavente, from the Department of Earth and Environmental Sciences of the University of Alicante (Spain), for the support provided with the Mercury Intrusion Porosimetry analysis; and to the staff of the Scientific Instrumentation Centre of Granada University (Spain), José Damián Montes Rueda for the graphite coating of the thin sections, Isabel Moreno Vida for the XRF chemical analysis performing and Alicia Gonzalez Segura for the support provided during the Scanning Electron Microscopy observations. Finally, the comments and suggestions provided by the anonymous reviewers are deeply appreciated, as have improved the quality of the paper.

Conflicts of Interest

The authors declare no conflict of interest. The funders had no role in the design of the study; in the collection, analyses, or interpretation of data; in the writing of the manuscript, or in the decision to publish the results.

References

  1. Molera, J.; Pradell, T.; Vendrell-Saz, M. The colors of Ca-rich ceramic pastes: Origin and characterization. Appl. Clay Sci. 1998, 13, 187–202. [Google Scholar] [CrossRef]
  2. Rathossi, C.; Pontikes, Y. Effect of firing temperature and atmosphere on ceramics made of NW Peloponnese clay sediments. Part I: Reaction paths, crystalline phases, microstructure and color. J. Eur. Ceram. Soc. 2010, 30, 1841–1851. [Google Scholar] [CrossRef]
  3. Maritan, L.; Mazzoli, C.; Nodari, L.; Russo, U. Second Iron Age grey pottery from Este (north-eastern Italy): Study of provenance and technology. Appl. Clay Sci. 2005, 29, 31–44. [Google Scholar] [CrossRef]
  4. Maritan, L.; Nodari, L.; Mazzoli, C.; Milano, A.; Russo, U. Influence of firing conditions on ceramic products: Experimental study on clay rich in organic matter. Appl. Clay Sci. 2006, 31, 1–15. [Google Scholar] [CrossRef]
  5. Nodari, L.; Maritan, L.; Mazzoli, C.; Russo, U. Sandwich structures in the Etruscan-Padan type pottery. Appl. Clay Sci. 2004, 27, 119–128. [Google Scholar] [CrossRef]
  6. Valanciene, V.; Siauciunas, R.; Baltusnikaite, J. The influence of mineralogical composition on the color of clay body. J. Eur. Ceram. Soc. 2010, 30, 609–1617. [Google Scholar] [CrossRef]
  7. Riccardi, M.P.; Messiga, B.; Duminuco, P. An approach to the dynamics of clay firing. Appl. Clay. Sci. 1999, 15, 393–409. [Google Scholar] [CrossRef]
  8. Klaarenbeeck, W. The development of yellow calcareous bricks. Trans. J. Br. Ceram. Soc. 1961, 60, 738–772. [Google Scholar]
  9. Kreimeyer, R. Some notes on the firing color of clay bricks. Appl. Clay Sci. 1987, 2, 175–183. [Google Scholar] [CrossRef]
  10. Nodari, L.; Marcuz, E.; Maritan, L.; Mazzoli, C.; Russo, U. Hematite nucleation and growth in the firing of carbonate-rich clay for pottery production. J. Eur. Ceram. Soc. 2007, 27, 4665–4673. [Google Scholar] [CrossRef]
  11. De Bonis, A.; Cultrone, G.; Grifa, C.; Langella, A.; Leone, A.P.; Mercurio, M.; Morra, V. Different shades of red: The complexity of mineralogical and physico-chemical factors influencing the color of ceramics. Ceram. Int. 2017, 43, 8065–8074. [Google Scholar] [CrossRef]
  12. Mirti, P.; Davit, P. New developments in the study of ancient pottery by color measurement. J. Archaeol. Sci. 2004, 31, 741–751. [Google Scholar] [CrossRef]
  13. Pérez-Monserrat, E.M.; Agua, F.; Fort, R.; Alvarez de Buergo, M.; Conde, J.F.; Garcia-Heras, M. Effect of manufacturing methods on the decay of ceramic materials: A case study of bricks in modern architecture of Madrid (Spain). Appl. Clay Sci. 2017, 135, 136–149. [Google Scholar] [CrossRef]
  14. Segnit, E.R.; Anderson, C.A. Scanning electron microscopy of fired illite. Trans. Br. Ceram. Soc. 1972, 71, 85–88. [Google Scholar]
  15. Rice, P.M. Pottery Analysis. A Sourcebook; University of Chicago Press: Chicago, IL, USA, 1987. [Google Scholar]
  16. Cairo, A.; Messiga, B.; Riccardi, M.P. Technological features of the ‘Cotto Variegato’: A petrological approach. J. Cult. Herit. 2001, 2, 133–142. [Google Scholar] [CrossRef]
  17. Eramo, G. Ceramic technology. How to recognize clay processing. Archaeol. Anthropol. Sci. 2020, 12, 164. [Google Scholar] [CrossRef]
  18. Adell, J.M. 19th century brick architecture: Rationality and modernity. Inf. Constr. 1992, 55, 5–15. [Google Scholar]
  19. Galindo Diez, J. La construcción de murallas: Un aspecto del saber constructivo presente en los tratados de arquitectura militar (Siglo XV al XVIII). In Proceedings of the Actas 1er Congreso Nacional de Historia de la Construcción, Madrid, España, 19–21 September 1996; de las Casas, A., Huerta, S., Rabasa, E., Eds.; Instituto Juan de Herrera CEHOPU: Madrid, España, 1996; pp. 217–222. [Google Scholar]
  20. Cultrone, G.; Sebastián, E.; Elert, K.; de la Torre, M.J.; Cazalla, O.; Rodríguez Navarro, C. Influence of mineralogy and firing temperature on the porosity of bricks. J. Eur. Ceram. Soc. 2004, 24, 547–564. [Google Scholar] [CrossRef]
  21. Molina, E.; Cultrone, G.; Sebastián, E.; Alonso, F.J.; Carrizo, L.; Gisbert, J.; Buj, O. The pore system of sedimentary rocks as a key factor in the durability of building materials. Eng. Geol. 2011, 118, 110–121. [Google Scholar] [CrossRef]
  22. Coletti, C.; Maritan, L.; Cultrone, G.; Dalconi, M.C.; Hein, A.; Molina, E.; Mazzoli, C. Recycling trachyte waste from the quarry to the brick industry: Effects on physical and mechanical properties, and durability of new bricks. Constr. Build. Mater. 2018, 166, 792–807. [Google Scholar] [CrossRef]
  23. Charola, A.E.; Wendler, E. An overview of the water-porous building materials interactions. Restor. Build. Monum. 2015, 21, 55–65. [Google Scholar] [CrossRef]
  24. Mazzi, G.; Verdi, A.; Dal Piaz, V. Le mura di Padova; Il Poligrafo Editore: Padova, Italia, 2002. [Google Scholar]
  25. Fadini, U.; Bordignon, F.; Dal Zotto, P. Mura di Padova—Guida al Sistema Bastionato Rinascimentale; Edibus: Vicenza, Italia, 2013. [Google Scholar]
  26. Donvito, V.C.; Fadini, U. (Eds.) Padova è le sue Mura. Cinquecento Anni di Storia 1513–2013 Catalogo Della Mostra (Padova, Musei Civici agli Eremitani, 28 Marzo—20 Luglio 2014); Biblos: Cittadella, Padova, Italia, 2014. [Google Scholar]
  27. Germinario, L.; Siegesmund, S.; Maritan, L.; Simon, K.; Mazzoli, C. Trachyte weathering in the urban built environment related to air quality. Herit. Sci. 2017, 5, 44. [Google Scholar] [CrossRef]
  28. Piaser, S. (Ed.) Padova Sotterranea. Nel Cuore dell Mura Rinascimentali Esistenti piu Estese d’Europa; Edizioni Chartesis, Concomitato di Mure di Padova: Padova, Italia, 2018. [Google Scholar]
  29. Jobstraibitzer, P.; Mallesani, P. I sedimenti dei fiumi veneti. Mem. Soc. Geo. Ital. 1973, 12, 411–452. [Google Scholar]
  30. Maritan, L. Archaeometric study of Etruscan-Padan type pottery from the Veneto region: Petrographic, mineralogical and geochemical-physical characterization. Eu. J. Mineral. 2004, 16, 297–307. [Google Scholar] [CrossRef]
  31. UNE-EN 15886. Conservation of Cultural Property. Test Methods. Color Measurement of Surfaces; AENOR: Madrid, Spain, 2011. [Google Scholar]
  32. Govindaraju, K. Compilation of working values and sample description for 383 geostandards. Geostandard. Newsl. 1994, 18, 1–158. [Google Scholar] [CrossRef]
  33. De Jongh, W.K. X-ray fluorescence analysis applying theoretical matrix corrections. Stainless steel. X-ray Spectrom. 1973, 2, 151–158. [Google Scholar] [CrossRef]
  34. Locock, A.J.; Chesterman, D.; Caird, D.; Duke, M.J.M. Miniaturization of mechanical milling for powder X-ray diffraction. Powder Diff. 2012, 27, 189–193. [Google Scholar] [CrossRef] [Green Version]
  35. Maritan, L.; Holakooei, P.; Mazzoli, C. Cluster analysis of XRPD data in ancient ceramics: What for? Appl. Clay Sci. 2015, 114, 540–549. [Google Scholar] [CrossRef]
  36. Whitbread, I.K. A proposal for the systematic description of thin sections towards the study of ancient ceramic technology. In Proceedings of the 25th International Symposium on Archaeometry, Athens, Greece, 19–23 May 1986; Maniatis, Y., Ed.; Elsevier: Amsterdam, The Netherlands, 1989; pp. 127–138. [Google Scholar]
  37. Quinn, P.S. Ceramic Petrography: The Interpretation of Archaeological Pottery and Related Artefacts in Thin Sections; Archaeopress: Oxford, UK, 2013. [Google Scholar]
  38. UNE-EN 13755. Natural Stone Test Methods. Determination of Water Absorption at Atmospheric Pressure; AENOR: Madrid, Spain, 2008. [Google Scholar]
  39. NORMAL 29/88. Misura Dell’indice di Asciugamento (Drying Index); CNR-ICR: Rome, Italy, 1988. [Google Scholar]
  40. Cultrone, G.; de la Torre, M.J.; Sebastián, E.; Cazalla, O. Evaluation of bricks durability using destructive and non-destructive methods (DT and NDT). Mater. Constr. 2003, 53, 41–59. [Google Scholar] [CrossRef] [Green Version]
  41. RILEM. Recommended test to measure the deterioration of stone and to assess the differences of treatment methods. Mater. Struct. 1980, 13, 175–253. [Google Scholar]
  42. Benavente, D.; Linares-Fernández, L.; Cultrone, G.; Sebastián, E. Influence of microstructure on the resistance to salt crystallization damage in bricks. Mater. Struct. 2006, 39, 105–113. [Google Scholar] [CrossRef]
  43. ASTM D2845. Standard Test. Method for Laboratory Determination of Pulse Velocities and Ultrasonic Elastic Constant of Rock; American Society for Testing and Materials: West Conshohocken, PA, USA, 2005. [Google Scholar]
  44. Guydader, J.; Denis, A. Propagation des ondes dans les roches anisotropies sous contrainte évaluation de la qualité des schistes ardoisers. Bull. Eng. Geol. 1986, 33, 49–55. [Google Scholar] [CrossRef]
  45. EN 772-1. Methods of Test for Masonry Units—Part 1: Determination of Compressive Strength; European Committee for Standardization: Brussels, Belgium, 2015. [Google Scholar]
  46. UNI EN 12371. Natural Stone Test Methods—Determination of Frost Resistance; CNR-ICR: Rome, Italy, 2010. [Google Scholar]
  47. UNI EN 12370. Natural Stone Test Methods—Determination of Resistance to Salt Crystallization; CNR-ICR: Rome, Italy, 2001. [Google Scholar]
  48. Espinosa Marzal, R.M.; Hamilton, A.; McNall, M.; Whitaker, K.; Scherer, G.W. The chemomehanics of crystallization during rewetting of limestone impregnated with sodium sulfate. J. Mater. Res. 2011, 26, 1472–1481. [Google Scholar] [CrossRef] [Green Version]
  49. Kramar, S.; Lux, J.; Mladenović, A.; Pristacz, H.; Mirtič, B.; Sagadin, M.; Rogan-Šmuc, N. Mineralogical and geochemical characteristics of Roman pottery from an archaeological site near Mošnje (Slovenia). Appl. Clay Sci. 2012, 57, 39–48. [Google Scholar] [CrossRef]
  50. Iordanidis, A.; Garcia-Guinea, J.; Karamitrou-Mentessidic, G. Analytical study of ancient pottery from the archaeological site of Aiani, northern Greece. Mater. Charact. 2009, 60, 292–302. [Google Scholar] [CrossRef]
  51. Maritan, L.; Mazzoli, C. Phosphates in archaeological finds: Implications for environmental conditions of burial. Archaeometry 2004, 46, 673–683. [Google Scholar] [CrossRef]
  52. Maritan, L.; Angelini, I.; Artioli, G.; Mazzoli, C.; Saracino, M. Secondary phosphates in the ceramic materials from Frattesina (Rovigo, North-Eastern Italy). J. Cult. Herit. 2009, 10, 144–151. [Google Scholar] [CrossRef]
  53. Maritan, L. Ceramic abandonment. How to recognize post-depositional transformations. Archaeol. Anthropol. Sci. 2020, 12, 199. [Google Scholar] [CrossRef]
  54. Wang, G.; Wang, H.; Zhang. N. In situ high temperature X-ray diffraction study of illite. Appl. Clay Sci. 2017, 146, 254–263. [Google Scholar] [CrossRef]
  55. Khalfaoui, A.; Hajjaji, M. A chloritic-illitic clay from Morocco: Temperature-time transformation and neoformation. Appl. Clay Sci. 2009, 45, 83–89. [Google Scholar] [CrossRef]
  56. Rodriguez-Navarro, C.; Ruiz-Agudo, E.; Luque, A.; Rodriguez-Navarro, A.B.; Ortega-Huertas, M. Thermal decomposition of calcite: Mechanisms of formation and textural evolution of CaO nanocrystals. Am. Mineral. 2009, 94, 578–593. [Google Scholar] [CrossRef]
  57. Rodriguez-Navarro, C.; Kudlacz, K.; Ruiz-Agudo, E. The mechanism of thermal decomposition of dolomite: New insights from 2D-XRD and TEM analyses. Am. Mineral. 2012, 97, 38–51. [Google Scholar] [CrossRef]
  58. Maritan, L.; Ganzarolli, G.; Antonelli, F.; Rigo, M.; Kapatza, A.; Bajnok, K.; Coletti, C.; Mazzoli, C.; Lazzarini, L.; Vedovetto, P.; et al. What kind of calcite? Disclosing the origin of sparry calcite temper in ancient ceramics. J. Archaeol. Sci. 2021, 129, 105358. [Google Scholar] [CrossRef]
  59. Cultrone, G.; Rodriguez-Navarro, C.; Sebastian, E.; Cazalla, O.; de la Torre, M.J. Carbonate and silicate phase reactions during ceramic firing. Eur. J. Mineral. 2001, 13, 621–634. [Google Scholar] [CrossRef] [Green Version]
  60. Jordán, M.M.; Sanfeliu, T.; de la Fuente, C. Firing transformations of Tertiary clays used in the manufacturing of ceramic tile bodies. Appl. Clay Sci. 2001, 20, 87–95. [Google Scholar] [CrossRef]
  61. Traoré, K.; Kabre, T.S.; Blanchart, P. Low temperature sintering of a clay for pottery from Burkina Faso. Appl. Clay Sci. 2000, 17, 279–292. [Google Scholar] [CrossRef]
  62. Elias, M.L.; Cultrone, G. On the Use of Sodium Chloride and Calcined Diatomite Sludge as Additives to Improve the Engineering Properties of Bricks Made with a Clay Earth from Jun (Granada, Spain). Minerals 2019, 9, 64. [Google Scholar] [CrossRef] [Green Version]
  63. Daghmehchi, M.; Omrani, H.; Emami, M.; Nokandeh, J. Mineralogical and thermo-chemical characteristics of the Hellenistic ceramics and raw clay from Qizlar Qal’eh (northeastern Iran). Mater. Charact. 2016, 120, 143–151. [Google Scholar] [CrossRef]
  64. Dondi, M.; Ercolani, G.; Fabbri, B.; Mars Igli, M. An approach to the chemistry of pyroxenes formed during the firing of Ca-rich silicate ceramics. Clay Miner. 1998, 33, 443–452. [Google Scholar] [CrossRef]
  65. Shoval, S. Mineralogical changes upon heating calcitic and dolomitic marl rocks. Thermochim. Acta 1988, 135, 243–252. [Google Scholar] [CrossRef]
  66. Trindade, M.J.; Dias, M.I.; Coroado, J.; Rocha, F. Mineralogical transformations of calcareous rich clays with firing: A comparative study between calcite and dolomite rich clays from Algarve, Portugal. Appl. Clay Sci. 2009, 42, 345–355. [Google Scholar] [CrossRef]
  67. Tenconi, M.; Maritan, L.; Leonardi, G.; Prosdocimi, B.; Mazzoli, C. Ceramic production and distribution in north-east Italy: Study of a possible trade network between Friuli Venezia Giulia and Veneto regions during the final Bronze Age and early Iron Age through analysis of peculiar ‘flared rim and flat lip’ pottery. Appl. Clay. Sci. 2013, 82, 121–134. [Google Scholar] [CrossRef]
  68. Issi, A.; Kara, A. An investigation of pottery production technology for the West Slope wares from Dorylaion (Eskişehir/Turkey). Bol. Soc. Esp. Ceram. Vidr. 2013, 52, 42–47. [Google Scholar] [CrossRef]
  69. Fabbri, B.; Gualtieri, S.; Shoval, S. The presence of calcite in archaeological ceramics. J. Eur. Ceram. Soc. 2014, 34, 1899–1911. [Google Scholar] [CrossRef]
  70. Saenz, N.; Sebastián, E.; Cultrone, G. Analysis of tempered bricks: From raw materials and additives to fired bricks for use in construction and heritage conservation. Eur. J. Mineral. 2019, 31, 301–312. [Google Scholar] [CrossRef]
  71. Sondi, I.; Juracic, M. Whiting events and the formation of aragonite in the Mediterranean Karstic Marine Lakes: New evidence on its biologically induced organic origin. Sedimentology 2010, 57, 85–95. [Google Scholar] [CrossRef]
  72. Pérez-Monserrat, E.M.; Maritan, L.; Causarano, M.A.; Chavarría, A.; Brogiolo, G.P. Ancient bricks technologies: Improving the built heritage conservation at high humidity areas. In Proceedings of the International Conference on Metrology for Archaeology and Cultural Heritage, Trento, Italy, 22–24 October 2020; pp. 522–526. [Google Scholar]
  73. Buxeda i Garrigos, J.; Mommsen, H.; Tsolakidou, A. Alterations of Na, K and Rb concentrations in Mycenean pottery and a proposed explanation using X-Ray Diffraction. Archaeometry 2002, 44, 187–198. [Google Scholar] [CrossRef] [Green Version]
  74. Heimann, R.B.; Maggetti, M. Experiments on simulated burial of calcareous terra sigillata: Mineralogical changes-preliminary results. In Scientific Studies in Ancient Ceramics; Hughes, M.J., Ed.; British Museum, Occasional Paper 19: London, UK, 1981; pp. 163–177. [Google Scholar]
  75. Whitney, D.L.; Evans, B.W. Abbreviations for names of rock-forming minerals. Am. Mineral. 2010, 95, 185–187. [Google Scholar] [CrossRef]
  76. Everhart, J.O. Use of auxiliary fluxes to improve structural clay bodies. Am. Ceram. Soc. Bull. 1957, 36, 268–271. [Google Scholar]
  77. Tite, M.S.; Maniatis, Y. Examination of ancient pottery using the scanning electron microscope. Nature 1975, 257, 122–123. [Google Scholar] [CrossRef]
  78. Cucato, M.; de Vecchi, G.P.; Mozzi, P.; Abbà, T.; Paiero, G.; Sedea, R. (Eds.) CARG Progetto. Note illustrative della Carta Geologica d’Italia alla scalla 1:50.000. Foglio 147. Padova Sud.; Istituto Superiore per la Protezione e la Ricerca Ambientale (ISPRA): Regione del Veneto, Italia, 2008; p. 224. [Google Scholar]
  79. Cultrone, G.; Molina, E.; Arizzi, A. The combined use of petrographic, chemical and physical techniques to define the technological features of Iberian ceramics from the Canto Tortoso area (Granada, Spain). Ceram. Int. 2014, 40, 10803–10816. [Google Scholar] [CrossRef]
  80. Cultrone, G.; Carrillo Rosua, F.J. Growth of metastable phases during brick firing: Mineralogical and microtextural changes induced by the composition of the raw material and the presence of additives. Appl. Clay Sci. 2020, 185, 105419. [Google Scholar] [CrossRef]
  81. Rodriguez-Navarro, C.; Cultrone, G.; Sanchez-Navas, A.; Sebastian, E. TEM study of mullite growth after muscovite breakdown. Am. Mineral. 2003, 88, 713–724. [Google Scholar] [CrossRef]
  82. Coletti, C.; Mazzoli, C.; Maritan, L.; Cultrone, G. Combined multi-analytical approach for study of pore system in bricks: How much porosity is there? Mater. Charact. 2016, 121, 82–92. [Google Scholar] [CrossRef]
  83. Toledo, R.; dos Santos, D.R.; Faria, R.T., Jr.; Carrio, J.G.; Auler, L.T.; Vargas, H. Gas release during clay firing and evolution of ceramic properties. Appl. Clay Sci. 2004, 27, 151–157. [Google Scholar] [CrossRef]
  84. Cultrone, G.; Aurrekoetxea, I.; Casado, C.; Arizzi, A. Sawdust recycling in the production of lightweight bricks: How the amount of additive and the firing temperature influence the physical properties of the bricks. Constr. Build. Mater. 2020, 235, 117436. [Google Scholar] [CrossRef]
  85. Karagiannis, N.; Karoglou, M.; Bakolas, A.; Krokida, M.; Moropoulou, A. Drying kinetics of building materials capillary moisture. Constr. Build. Mater. 2017, 137, 441–449. [Google Scholar] [CrossRef]
  86. Whiteley, P.; Russman, H.D.; Bishop, J.D. Porosity of building materials. A collection of published results. J. Oil Color. Chem. Assoc. 1977, 60, 142–150. [Google Scholar]
  87. Martínez-Martínez, J.; Benavente, D.; Ordóñez, S.; García del Cura, M.A. Multivariate statistical techniques for evaluating the effects of brecciated rock fabric on ultrasonic wave propagation. Int. J. Rock Mech. Min. Sci. 2008, 45, 609–620. [Google Scholar] [CrossRef]
  88. Elert, K.; Cultrone, G.; Rodriguez-Navarro, C.; Sebastian Pardo, E. Durability of bricks used in the conservation of historic buildings. Influence of composition and microstructure. J. Cult. Herit. 2003, 4, 91–99. [Google Scholar] [CrossRef]
  89. Fernandes, F.; Lourenço, P.B. Evaluation of the Compressive Strength of Ancient Clay Bricks Using Microdrilling. J. Mater. Civ. Eng. ASCE 2007, 19, 791–800. [Google Scholar] [CrossRef] [Green Version]
  90. Stefanidou, M.; Papayianni, I.; Pachta, V. Analysis and characterization of Roman and Byzantine fired bricks from Greece. Mater. Struct. 2015, 48, 2251–2260. [Google Scholar] [CrossRef]
  91. Matysek, P.; Witkowski, M. A Comparative Study on the Compressive Strength of Bricks from Different Historical Periods. Int. J. Archit. Herit. 2016, 10, 396–405. [Google Scholar] [CrossRef]
  92. Garbin, E.; Panizza, M.; Valluzzi, M.R. Experimental characterization of solid clay bricks: Correlations among mechanical properties. In Structural Analysis of Historical Constructions; Aguilar, R., Torrealva, D., Moreira, S., Pando, M.A., Ramos, L.F., Eds.; RILEM Bookseries; Springer: Cham, Switzerland, 2019; Volume 18, pp. 634–643. [Google Scholar] [CrossRef]
  93. EN 1998-1. Eurocode 8: Design of Structures for Earthquake Resistance—Part 1: General Rules, Seismic Actions and Rules for Buildings; European Committee for Standardization: Brussels, Belgium, 2008. [Google Scholar]
  94. ASTM C62-05. Standard Specification for Building Brick (Solid Masonry Units Made From Clay or Shale); American Society for Testing and Materials: West Conshohocken, PA, USA, 2005. [Google Scholar]
  95. Scherer, G.W. Crystallization in pores. Cem. Concr. Res. 1999, 29, 1347–1358. [Google Scholar] [CrossRef]
  96. Goudie, A.S. Laboratory simulation of ‘the wick effect’ in salt weathering of rock. Earth Surf. Proc. Land. 1986, 11, 275–285. [Google Scholar] [CrossRef]
Figure 1. Flow chart of the interdisciplinary and multi-analytical study carried out on the original bricks that shape the Renaissance walls (16th century) of the city of Padua, Northeast Italy.
Minerals 11 00744 g001
Figure 2. Padua’s Renaissance walls. (a) The irregular perimeter of the Renaissance walls (red) included the Medieval walls (orange)—today largely disappeared—and the fluvial system that crossed the city (light blue)—nowadays somewhat changed-. The white lines are the main passageways that articulated the Medieval city according to the corresponding Medieval gates; (bd) brick fabrics on the facing South in 2019; (e) intervention on the wall accomplished during 2020–2021.
Minerals 11 00744 g002
Figure 3. Appearance of the bricks on fresh surface. Very diverse textures and three main colors—yellow/beige, pale and dark red- were observed.
Minerals 11 00744 g003
Figure 4. Ceramic bodies hue from the plotting of the chromatic coordinates (a* and b*) and changing colors with increasing of the red component.
Minerals 11 00744 g004
Figure 5. Ternary diagrams SiO2–Al2O3–CaO + MgO (left) and CaO—Fe2O3–MgO (right) with the plot of the composition of the bricks, identified according to their color. Sample numbered according to Table 1 and Table 2.
Minerals 11 00744 g005
Figure 6. PXRD patterns of the beige, pale red and dark red hue ceramic bodies, according to the increasing of the red component (a* chromatic coordinate). Mineral abbreviations: quartz (Qz), k-feldspars (Kfs), illite (Ilt), albite (Ab), anorthite (An), diopside (Di), gehlenite (Gh), forsterite (Fo), hematite (Hem), ferrobustamite (Fbst), calcite (Cal), aragonite (Arg), analcime (Anl) and leucite (Lct), after Whitney and Evans [75].
Minerals 11 00744 g006
Figure 7. Dendrogram obtained from the cluster analysis of PXRD data according to Euclidean distance and average linkage method on position of peaks. Firing temperature, determined according to the mineralogical association, is also reported, as well as the color of the ceramic bodies.
Minerals 11 00744 g007
Figure 8. Photomicrographs in plain-polarized light (above) and crossed-polarized light (below) of the beige, pale and dark red hue ceramic bodies, ordered according to the increase of the red component (a* chromatic coordinate). Three general petro-fabrics were stated: A1 (M1_4.8, M4_5.2, M2_1.1 and M2_4.6), A2 (M4_4.1, M3_3.1, M3_5.3 and M3_1.4) and B1 (M4_4.3, M1_4.7 and M4_3.1). Samples M3_4.1, M2_4.3, M3_4.0 and M3_2.1 do not belong to any of these general petro-fabrics. Images were taken at the same magnification.
Minerals 11 00744 g008
Figure 9. HRSEM-BSE images and EDX spectra performed on the beige hue (A1 and A2 petro-fabrics), pale red (B1 petro-fabric) and dark red bodies. (a) General view of the microstructure of petro-fabric A1, with Mg-rich dark particles and phase transformations at quartz grain boundaries; (b) Melilite rims around dark particles composed by Mg-rich silicate crystals and partially-melted phyllosilicate in A1 bodies; (c) Melilite matrix and secondary calcite extended through petro-fabric A2, secondary calcite likewise filling the shrinkage rims around Mg-rich clayey grains; (d) Detail of Ca-pyroxene crystals developed within the melilite-rich matrix; (e) High Ca-rich clayey grains with shrinkage rims cemented by secondary calcite; (f) Preferred orientation of elongated inclusions and Ca-rich crystals within carbonate rich clayey fragments; (g) Microstructure with scarce melting evidence of petro-fabric B1 where Mg-rich clayey inclusions slightly altered at boundaries are noted; (h) Detail of phyllosilicate with marked exfoliation along (001) planes and possible fassaite-type pyroxene; (i) Fe-rich crystals (possibly hematite) growth along illite flake; (j) General view of the microstructure, Fe-oxides also growth within K-feldspar grains; (k) Very low vitrified matrix in which pristine phyllosilicates—partially oriented— are still recognizable and angular shapes of silica inclusions are still remained, and (l) Pristine illite/muscovite and Ca-rich mixed clays. Legend: phyllosilicates (Phy), quartz (Qz), An (anorthite), melilite (Mll), rutile (Rt), ilmenite (Ilm), titanite (Ttn), calcite (Cal) and k-feldspar (Kfs). After Whitney and Evans [75].
Minerals 11 00744 g009
Figure 10. Free water absorption (1), forced water absorption (2) and drying (3) of bricks belonging to petro-fabrics A1, A2 and B1. Weight variation (∆M/M) versus time (in h). Each curve represents the mean of two measurements.
Minerals 11 00744 g010
Figure 11. Mercury intrusion porosimetry curves, accumulative (in red) and pore-size distribution (blue) of the beige, pale red and dark red hue ceramic bodies, expressed as volume intrusion of mercury, versus pore radius (in micrometers).
Minerals 11 00744 g011
Figure 12. Variation of weight in bricks belonging to petro-fabrics A1, A2 and B1 during durability tests. (a) Salt crystallization and (b) Freeze-thaw. Weight variation (∆M/M) versus time (in number of cycles, each cycle corresponds to 24 h). Each curve represents the mean of two measurements.
Minerals 11 00744 g012
Table 1. Average and Std of lightness (L*), chromatic coordinates (a* and b*), chroma (C*) and hue angle (h°) of the ceramic bodies.
HueBrickL*a*b*C*
Beige
Group A
1. M1_4.8 162.33 ± 1.784.81 ± 0.1628.29 ± 1.9028.69 ± 1.8680.31 ± 0.87
2. M4_5.274.18 ± 1.926.00 ± 0.2423.88 ± 0.4724.63 ± 0.4575.88 ± 0.61
3. M4_4.167.22 ± 1.366.20 ± 0.3023.93 ± 0.5124.72 ± 0.4475.35 ± 0.91
4. M3_3.170.52 ± 1.106.87 ± 0.2018.66 ± 0.5919.89 ± 0.5869.77 ± 0.68
5. M2_1.171.13 ± 1.616.96 ± 0.4623.09 ± 0.1724.12 ± 0.2073.23 ± 1.10
6. M2_4.672.27 ± 1.117.01 ± 1.0021.23 ± 0.7822.38 ± 0.9071.72 ± 2.31
7. M3_5.364.79 ± 1.737.18 ± 0.4520.82 ± 0.7322.03 ± 0.7270.97 ± 1.20
8. M3_1.469.71 ± 1.247.91 ± 0.5820.93 ± 0.7622.39 ± 0.8269.29 ± 1.27
Pale red
Group B
9. M4_4.361.50 ± 1.6613.46 ± 1.0621.04 ± 0.4524.99 ± 0.8757.43 ± 1.71
10. M3_4.160.62 ± 0.8914.63 ± 0.6520.93 ± 0.7125.54 ± 0.9255.04 ± 0.63
11. M2_4.362.99 ± 1.5814.73 ± 0.4522.56 ± 0.3826.95 ± 0.5356.83 ± 0.56
12. M1_4.759.22 ± 0.3115.56 ± 0.3620.37 ± 0.5525.63 ± 0.6352.50 ± 0.40
13. M4_3.158.10 ± 1.7716.35 ± 0.7822.72 ± 0.5627.99 ± 0.8354.27 ± 1.20
Dark red
Group C
14. M3_4.046.23 ± 1.0519.80 ± 0.4718.68 ± 0.6225.56 ± 0.4846.97 ± 1.37
15. M3_2.152.17 ± 0.9121.23 ± 0.6225.06 ± 0.4432.84 ± 0.7149.74 ± 0.49
1 Despite the yellow hue shown by the brick M1_4.8, this sample was considered belonging to the beige hue bodies (group A) throughout the results and discussion section.
Table 2. Chemical analysis of the major and minor oxides (in wt %) and zircon trace element (in ppm) of the ceramic bodies determined by XRF.
HueBrickSiO2Al2O3Fe2O3MnOMgOCaONa2OK2OTiO2P2O5ZrLOI 1SUM
Beige
Group A
1. M1_4.843.611.24.540.099.5920.91.052.040.860.27202.84.8598.9
2. M4_5.243.515.05.640.107.9917.81.511.730.740.18153.15.3599.7
3. M4_4.145.911.83.980.075.9218.51.521.770.640.24165.19.5299.9
4. M3_3.147.311.74.040.077.0916.60.982.000.670.15155.29.2999.8
5. M2_1.148.715.95.610.107.0813.91.282.940.660.17162.53.2499.6
6. M2_4.642.814.45.420.107.3217.31.092.580.670.19146.38.0499.9
7. M3_5.346.711.34.590.087.5715.51.102.230.830.27174.09.8199.9
8. M3_1.449.413.24.830.096.4216.51.012.110.650.25161.27.39101.9
Pale red
Group B
9. M4_4.352.512.54.360.075.4312.10.972.390.710.14188.88.8199.9
10. M3_4.150.511.74.310.074.9313.31.022.610.770.15176.810.6799.9
11. M2_4.347.015.45.920.095.9213.00.873.290.680.17182.58.03100.3
12. M1_4.750.214.75.560.105.5312.20.812.360.740.19157.58.61100.9
13. M4_3.152.716.55.930.105.5710.60.922.920.820.17201.23.7499.9
Dark red
(group C)
14. M3_4.055.218.38.070.104.726.61.433.171.120.30190.31.0199.9
15. M3_2.162.416.56.070.082.444.11.203.460.750.09232.22.3899.5
1 LOI = loss on ignition.
Table 3. Hygric parameters and MIP results on the brick tested. Open porosity (%) and apparent and real density (g/cm3) determined both by hygric tests and MIP (Po and PoMIP, ρr and ρrMIP, ρa and ρaMIP). Ab (%) = free water absorption; Af (%) = forced water absorption; Ax = degree of pore interconnection; Di = drying index; S (%) = saturation coefficient. SSA (m2/g) = specific surface area, percentage of pores comprised between 10 μm and 100 μm, 1–10 μm, 0.1–1 and lower than 0.1 μm determined by MIP. Means values of these parameters for petro-fabrics (PF) A1, A2 and B1 are also reported.
Hygric TestsMIP Performance
HuePFBricksPo ρrρaAbAfAxDiSPoMIP ρrMIP ρaMIP SSA 10–1001–100.1–1<0.1
Beige
Group A
A1M1_4.851.72.81.437.738.00.81.582.349.02.91.512.617.868.77.55.9
M4_5.246.42.71.530.631.94.11.683.744.12.71.523.50.84.671.423.1
M2_1.150.32.71.436.736.90.61.682.844.42.71.58.51.442.651.54.5
M2_4.642.92.71.527.328.33.61.687.042.42.71.625.30.26.565.727.7
Mean47.82.71.433.133.82.21.683.945.02.81.517.45.130.649.015.3
A2M4_4.142.12.71.624.527.09.21.680.439.92.71.69.79.262.621.86.4
M3_3.140.32.61.621.726.016.71.674.237.02.61.636.61.814.440.443.4
M3_5.342.12.61.525.728.49.81.681.635.02.61.721.42.940.927.828.5
M3_1.442.32.61.526.328.47.21.684.039.12.61.631.40.311.849.638.3
Mean41.72.61.524.527.510.71.680.137.82.61.624.83.632.434.929.1
Pale red
Group B
B1M4_4.334.62.51.620.521.54.61.686.930.02.51.825.80.50.052.746.6
M1_4.735.42.61.721.021.31.81.688.026.12.51.830.51.10.65.692.8
M4_3.138.42.61.623.324.34.01.687.639.12.61.616.32.015.663.219.4
Mean36.22.51.621.622.43.51.687.531.72.51.724.21.25.440.552.9
M3_4.134.12.51.719.920.63.51.690.431.52.61.819.00.62.266.430.5
M2_4.343.02.61.528.628.80.71.687.736.52.61.715.20.91.177.719.7
Dark red
Group C
M3_4.043.32.61.526.429.08.71.682.039.82.71.66.34.541.848.84.0
M3_2.135.42.71.719.820.63.81.684.334.62.61.712.21.636.247.114.9
Table 4. VP1, VP2 and VP3 = velocities of ultrasonic wave propagation in the three orthogonal directions (m/s), Vp = mean velocity (m/s), structural (∆M) and relative (∆m) anisotropies (%) of the bricks. Mean values for the petro-fabric are also reported.
Hue BricksVP1 (m/s)VP2 (m/s)VP3 (m/s)Vp (m/s)∆M (%)∆m (%)
Beige
Group A
A1M1_4.8 19781996210220253.55.2
M4_5.2201421782333217510.76.9
M2_1.1187520882246207013.57.3
M2_4.6222324412551240510.94.4
Mean 1203722362377221711.76.2
A2M4_4.1 128715811779154923.511.8
M3_3.122212384245923558.23.1
M3_5.3 21562303242022938.75.0
M3_1.423302454251424336.22.4
Mean 122362380246423607.73.5
Pale red
Group B
B1M4_4.3 23262460258324567.74.9
M1_4.723232412254124256.25.2
M4_3.122692446254824219.24.1
Mean22532424254724089.45.0
M2_4.3 201622462387221612.86.1
M3_4.1233525572676252310.74.6
Dark red
Group C
M3_4.0200123152420224515.54.5
M3_2.123912446254124594.13.8
1 As values measured in M1_4.8 and M4_4.1 bodies have resulted rather different than those from the other samples belonging to the corresponding petro-fabrics (A1 and A2), in order to not distort the average such values have been excluded from the calculi.
Publisher’s Note: MDPI stays neutral with regard to jurisdictional claims in published maps and institutional affiliations.

