Article

Composition of the Primordial Ocean Just after Its Formation: Constraints from the Reactions between the Primitive Crust and a Strongly Acidic, CO2-Rich Fluid at Elevated Temperatures and Pressures

Super-Cutting-Edge Grand and Advanced Research (SUGAR) Program, Institute for Extra-Cutting-Edge Science and Technology Avant-Garde Research (X-Star), Japan Agency for Marine-Earth Science and Technology (JAMSTEC), 2-15, Natsushima-cho, Yokosuka 237-0061, Japan
*
Author to whom correspondence should be addressed.
Minerals 2021, 11(4), 389; https://doi.org/10.3390/min11040389
Submission received: 29 January 2021 / Revised: 24 March 2021 / Accepted: 27 March 2021 / Published: 6 April 2021

Abstract

:
The Hadean was an enigmatic period in the Earth’s history when ocean formation and the emergence of life may have occurred. However, minimal geological evidence is left from this period. To understand the primordial ocean’s composition, we focused on the ocean’s formation processes from CO2- and HCl-bearing water vapor in the high-temperature atmosphere. When the temperature of the lower atmosphere fell below the critical point, high-temperature rain reached the ground surface. Then, hydrothermal reactions between the subcritical fluid and primordial crust started. Eventually, a liquid ocean emerged on the completely altered crust as the temperature decreased to approximately 25 °C. Here, we conducted two experiments and modeling to simulate the reactions of hypothetical primordial crustal rock (basalt or komatiite). The results indicate that the primordial ocean was mildly acidic and rich in CO2, Mg, and Ca relative to Na, irrespective of the rock type, which is different from the modern equivalents. Therefore, unlike the present seawater, the primordial seawater could have been carbonic, bitter, and harsh rather than salty.

1. Introduction

The Hadean was an enigmatic period in the Earth’s history when ocean formation and the emergence of life occurred [1,2,3]. However, minimal geological evidence is left from this period. The oldest zircon grains with ages extending to ~4.4 Ga [4] were found from the clastic rocks in Australia. Their oxygen isotopic evidence indicates the incorporation of low-temperature weathering products under liquid water at ~4.3 Ga (e.g., [5]), indicating that the Earth’s surface temperature had cooled down enough to stabilize the liquid ocean at this age.
Regarding the ocean in the early Earth, previous research indicates that seawater had weak acidity (pH 4–7) because the carbon dioxide concentration in the atmosphere was high compared to today [6,7,8,9,10], or it was strongly acidic (pH 1–2) because a large amount of halogen substance in the high-temperature vapor atmosphere eventually dissolved into seawater [11]. Previously, pH levels, and concentrations of CO2 and other elements were considered [6], but these estimations did not provide information about the quantitative chemical compositions of seawater. Furthermore, the specific compositions of the ocean have not been reported from experiments or thermodynamic calculations simulating fluid–rock reactions.
The entire surface of the Hadean Earth was covered by a magma ocean in the late stage of accretion (e.g., moon-forming impact event) [12,13,14,15]. After Earth’s cooling, the solidified proto-crust was formed. The continuous cooling of the Earth’s surface led to the condensation of atmospheric water steam and subsequent formation of the earliest ocean [16,17,18]. On the other hand, proto-plate tectonics probably started after the magma ocean, which was different from modern plate tectonics [19,20,21].
H2O and CO2 dominate present volcanic gases, consistent with the mantle oxygen fugacity, such as a quartz–fayalite–magnetite (QFM) buffer. Although recent studies have indicated that fO2 of the upper mantle has slightly increased since 3.0 Ga [22,23], the mantle fO2 in Hadean (~4.4 Ga) and Archean periods roughly placed them close to the present fugacity [24,25,26]. Therefore, previous studies indicated that the Hadean atmosphere likely consisted of mainly H2O and CO2, along with a small number of other species such as CO and H2 [7,17,27,28] after the magma ocean, whereas H2O cooling and condensation would have led to an atmosphere composed of CO2 [29]. In our experiments and models, therefore, we assumed that the magmatic degassing process was dominant just after the magma ocean stage, and consequently the proto-atmosphere predominantly consisted of CO2 and H2O when the primordial ocean formed.
In addition to CO2, halogen compounds should have been also considerably contained in the proto-atmosphere, as the modern ocean is enriched in NaCl. Although NaCl and KCl could be present as the main halogen compounds in the atmosphere at temperatures higher than 2000 K, the halogen compound likely existed as HCl at <~1000 °C (e.g, [30]). This is consistent with the dominance of HCl in halogen gases contained in the modern volcanic gases (e.g., [31,32,33]). Thus, it can be assumed that the halogen compounds in the proto-atmosphere were dominated by HCl just before the primordial ocean was formed.
Here, we focused on the ocean’s formation process from water vapor, then assumed the following conditions. When the primitive crust was formed from the magma ocean, it was covered with a supercritical atmosphere containing HCl, H2O, and CO2. Afterward, the single-phase supercritical atmosphere separated into the atmosphere and the ocean as the temperature decreased below the critical point, whereby CO2 was distributed into both the atmosphere and ocean (e.g., [28]). Simultaneously, hydrothermal reactions between a strongly acidic subcritical fluid and the primitive crust (basalt or komatiite) started and continued with decreasing temperatures until the ocean’s temperature stabilized.
In this study, therefore, we experimentally and thermodynamically simulated the formation processes of the primordial ocean to estimate the ocean’s composition. However, present-day techniques of high-temperature and high-pressure experiments can only mimic reactions between fluid and rock, whereas gas exchange (mainly CO2) between the vapor phase and fluid cannot be reproduced simultaneously. Therefore, the ocean–atmosphere system was assumed as a single-phase fluid in the experiment and the expected reactions in the experiments were reproduced using thermodynamic modeling to understand chemical processes during ocean formation. Although the temperature of the stabilized ocean is still unknown, the temperature of reactions in the experiments and modeling was decreased from 350 °C to room temperature (25 °C). Then, using the modeling results at 25 °C, we further conducted thermodynamic calculations simulating the redistribution of CO2 from the single-phase fluid to the hypothetical atmosphere at 25 °C by considering a re-equilibration among the atmosphere, ocean, and crustal rock. The results provide insights into the compositional evolution of the ocean from its formation to the early Archean, in which geological records are preserved.

2. Materials and Methods

2.1. Experiments

2.1.1. Starting Materials

It was assumed that the Hadean primitive crust was composed of basalt or komatiite [34,35,36,37]. Thus, we synthesized these two rock types for our hydrothermal experiments. The rocks were synthesized from a blend of 12 reagents (SiO2, TiO2, Al2O3, Fe2O3, MnO, MgO, CaCO3, Na2CO3, K2CO3, P2O5, NiO, and Cr2O3) using an electric furnace under QFM-buffered oxygen fugacity based on the same method as previously reported [38,39,40,41] (Table 1). The synthetic basalt is mainly composed of augite, plagioclase, and magnetite (Table 2; Figure 1a), whereas the komatiite consists of olivine, Cr-spinel, magnetite, and glass (Table 2; Figure 1b). Furthermore, we adjusted the sulfur contents in these rocks to about 2850 ppm, assuming that the sulfur contents were close to those of volcanic minerals and glass in Hawaii and mid-ocean ridge basalt (MORB) in the modern Earth (~3000 ppm) [42,43,44]. Sulfur was additionally mixed as FeS (purity >99.9%) in the rocks after heating at 600 °C with the electric furnace under an anoxic condition to remove organic components, as reported previously [45]. The Fe content in the rocks was maintained identically to the objective compositions of basalt and komatiite.
The solution’s HCl concentration was adjusted to approximately 1000 mmol/kg because the Cl concentration in seawater in the early Earth was estimated to be twice the modern value from the total amount of Cl included in seawater and continental halite in the present Earth [46]. Thus, HCl with this concentration was assumed to have been present as HCl in the supercritical early atmosphere. We assumed the CO2 concentration in the initial fluid to be approximately 5.9 mol/kg, which was roughly estimated from the total water and carbon (CO2) inventory in the atmosphere, biosphere, hydrosphere, and crust currently. The amounts of water and CO2 are ~8 × 10²² moles (1.41 × 10²¹ kg H2O) and 8.3 × 10²¹ moles (~1.0 × 10²⁰ kg C), respectively [7,47,48].

2.1.2. Experimental Procedure

This study used the Inconel alloy autoclave modeled for the hydrothermal experiment [49]. The reaction cell is made of a gold bag with a titanium head. However, in this experiment, the titanium head was covered with gold to prevent the reaction between the head and strongly acidic fluids. The contamination of organic matter was reduced by baking all apparatus in contact with the sample fluid in a muffle furnace at 450 °C for 8 h.
The synthetic basalt and komatiite were crushed in a tungsten mill and sieved to obtain a < 100 μm powder. Any contamination of organic materials during sample preparation was removed by washing both powdered rocks with Milli-Q water and acetone several times. The initial solution was prepared by adding HCl (99.5% purity) and liquid CO2 to Milli-Q water (about 44 g) that was degassed to remove dissolved oxygen. A HCl solution was introduced into the reaction cell with the rock powder, then liquid CO2 was directly injected into the reaction cell from a gas cylinder to set the initial ΣCO2 concentration to be around 6.1–8.0 mol/kg. Note that even such a high CO2 amount is completely dissolvable under the initial experimental conditions (350 °C and 500 bars) [50].
The basalt and komatiite powers were reacted with the strongly acidic fluid in the reaction cell for 6970 and 4864 h at 500 bars, respectively. During the experiments, the temperature decreased stepwise from 350 °C to 250 °C, 175 °C, 100 °C, and 25 °C, simulating the decrease in the surface temperature of the primitive crust. The initial water/rock (W/R) mass ratio was adjusted to 2.25, corresponding to the reactions between 2.7-km-thick water (modern seawater volume) and 0.4-km-thick proto-crust. During the experiments, fluid samples were collected eight times before (and after) the temperature changed via a gold-coated sampling tube. Because of the eight-time fluid samplings, the W/R ratio in the reaction cell decreased to about 1 at the end of the experiments. Hereafter, the experiments using basalt and komatiite are represented as Exp-B and Exp-K, respectively.

2.1.3. Analytical Methods

Quantitative analyses of CO2 and H2 were performed using a gas chromatograph (Nexis GC-2030; Shimadzu, Kyoto, Japan) with a barrier discharge ionization detector (BID), while analysis of H2S was performed using a gas chromatograph (Agilent 7890B; Agilent Technology, Santa Clara, CA, USA) with a sulfur chemiluminescence detector (SCD). Gas present at the headspace in the vials was injected into the GC using a gas-tight syringe. After measuring the H2 concentrations, for determination of the ΣCO2 and ΣH2S concentrations in the fluid, the sampled fluid was acidified (pH < 2) with HCl to completely extract the dissolved bicarbonate, carbonate and bisulfide ions. The procedural precision of the ΣCO2 and ΣH2S concentrations in the fluid analyses was better than 20%, whereas that of H2 was better than 5%.
The Na, K, and Cl concentrations in the fluid samples were determined using an ion chromatograph (Dionex ICS-1600/2100; Thermo Fisher Scientific, Waltham, MA, USA). Mg, Si, Ca, Mn, and Fe concentrations were obtained by introducing the sampled solutions into an inductively coupled plasma–optical emission spectrometry (ICP-OES) (Spectro ARCOS; AMETEK, Berwyn, PA, USA) instrument at JAMSTEC (Yokosuka, Japan) after adding ~1 M HNO3 or NaOH to avoid mineral precipitation. The analytical reproducibility (2σ) was better than 5% for all species. For pH measurement, another sample solution was placed in contact with the atmosphere at least 1 h after sampling, allowing the pH to stabilize against CO2 degassing. The pH of the fluid samples was measured using a pH meter (LAQUAtwin; HORIBA, Kyoto, Japan) at room temperature. The pHin-situ in the fluids was calculated using a Geochemist’s Workbench using the same method, as reported in [39,40].
The compositions of minerals and glass in the rock powders before and after the experiments (Exp-B and Exp-K) were determined using a field emission–electron probe microanalyzer (FE-EPMA) (JXA-8500F; JEOL, Tokyo, Japan) at JAMSTEC. The analytical conditions for the FE-EPMA were an accelerating voltage of 15 kV, a specimen current of 12 nA, and a counting time of 10–20 s.

2.2. Thermodynamic Modeling of Water–Rock Reactions

The thermodynamic modeling of water–rock reactions was conducted using the EQ3/6 version 8.0 software (Lawrence Livermore National Laboratory, Livermore, CA, USA) package for geochemical modeling [51] with a customized thermodynamic database. The database was assembled using SUPCRT92 [52], with thermodynamic data for minerals, aqueous species, and complexes taken from [53,54,55,56,57,58,59,60,61,62] or calculated using estimation techniques used in [63]. In the calculations, the B-dot activity model was used [64,65], whereas activity coefficients were assumed to be unity for neutral species, except for CO2 [66]. As solid solutions, Fe–Mg substitution was considered for olivine, chlorite, Felayer–saponite, tremolite, spinel, and talc, while a solid solution of plagioclase was assumed to consist of albite and anorthite. Meanwhile, carbonate was assumed to be ideal for mixing among four endmembers (calcite, magnesite, siderite, and rhodochrosite). The reaction model simulates the reactions between the rock (basalt or komatiite) and a highly acidic, CO2-rich fluid at 25–400 °C at 500 bars. The initial W/R ratios of the modeling with each rock were adjusted to those at the beginning (2.25) and end (1) of the experiments (hereafter represented as Model-BWR2 and -BWR1, and Model-KWR2 and -KWR1, respectively). The initial compositions of the rocks (except Cr, Ni, Ti, and P) and fluids were identical to those assumed for the experiments. All organic carbon species were suppressed because of the kinetically limited CO2 reduction at laboratory timescales (e.g., [67]).
After the modeling of reactions between single-phase fluid and rock, we further simulated a re-equilibration among a gas phase, solution, and rock to estimate the partial pressure of CO2 (pCO2) in atmosphere and the composition of the ocean, using the results at 25 °C in each model. In the calculations, a simulation of CO2 degassing from the solution (originally a single-phase fluid) to a hypothetical gas phase was continued until the pCO2 of the gas phase reached the value of the fluid, assuming the ocean depth as 2.7 km and a mass balance of CO2 in the atmosphere, ocean, and crust.

3. Results and Discussion

3.1. Experiments

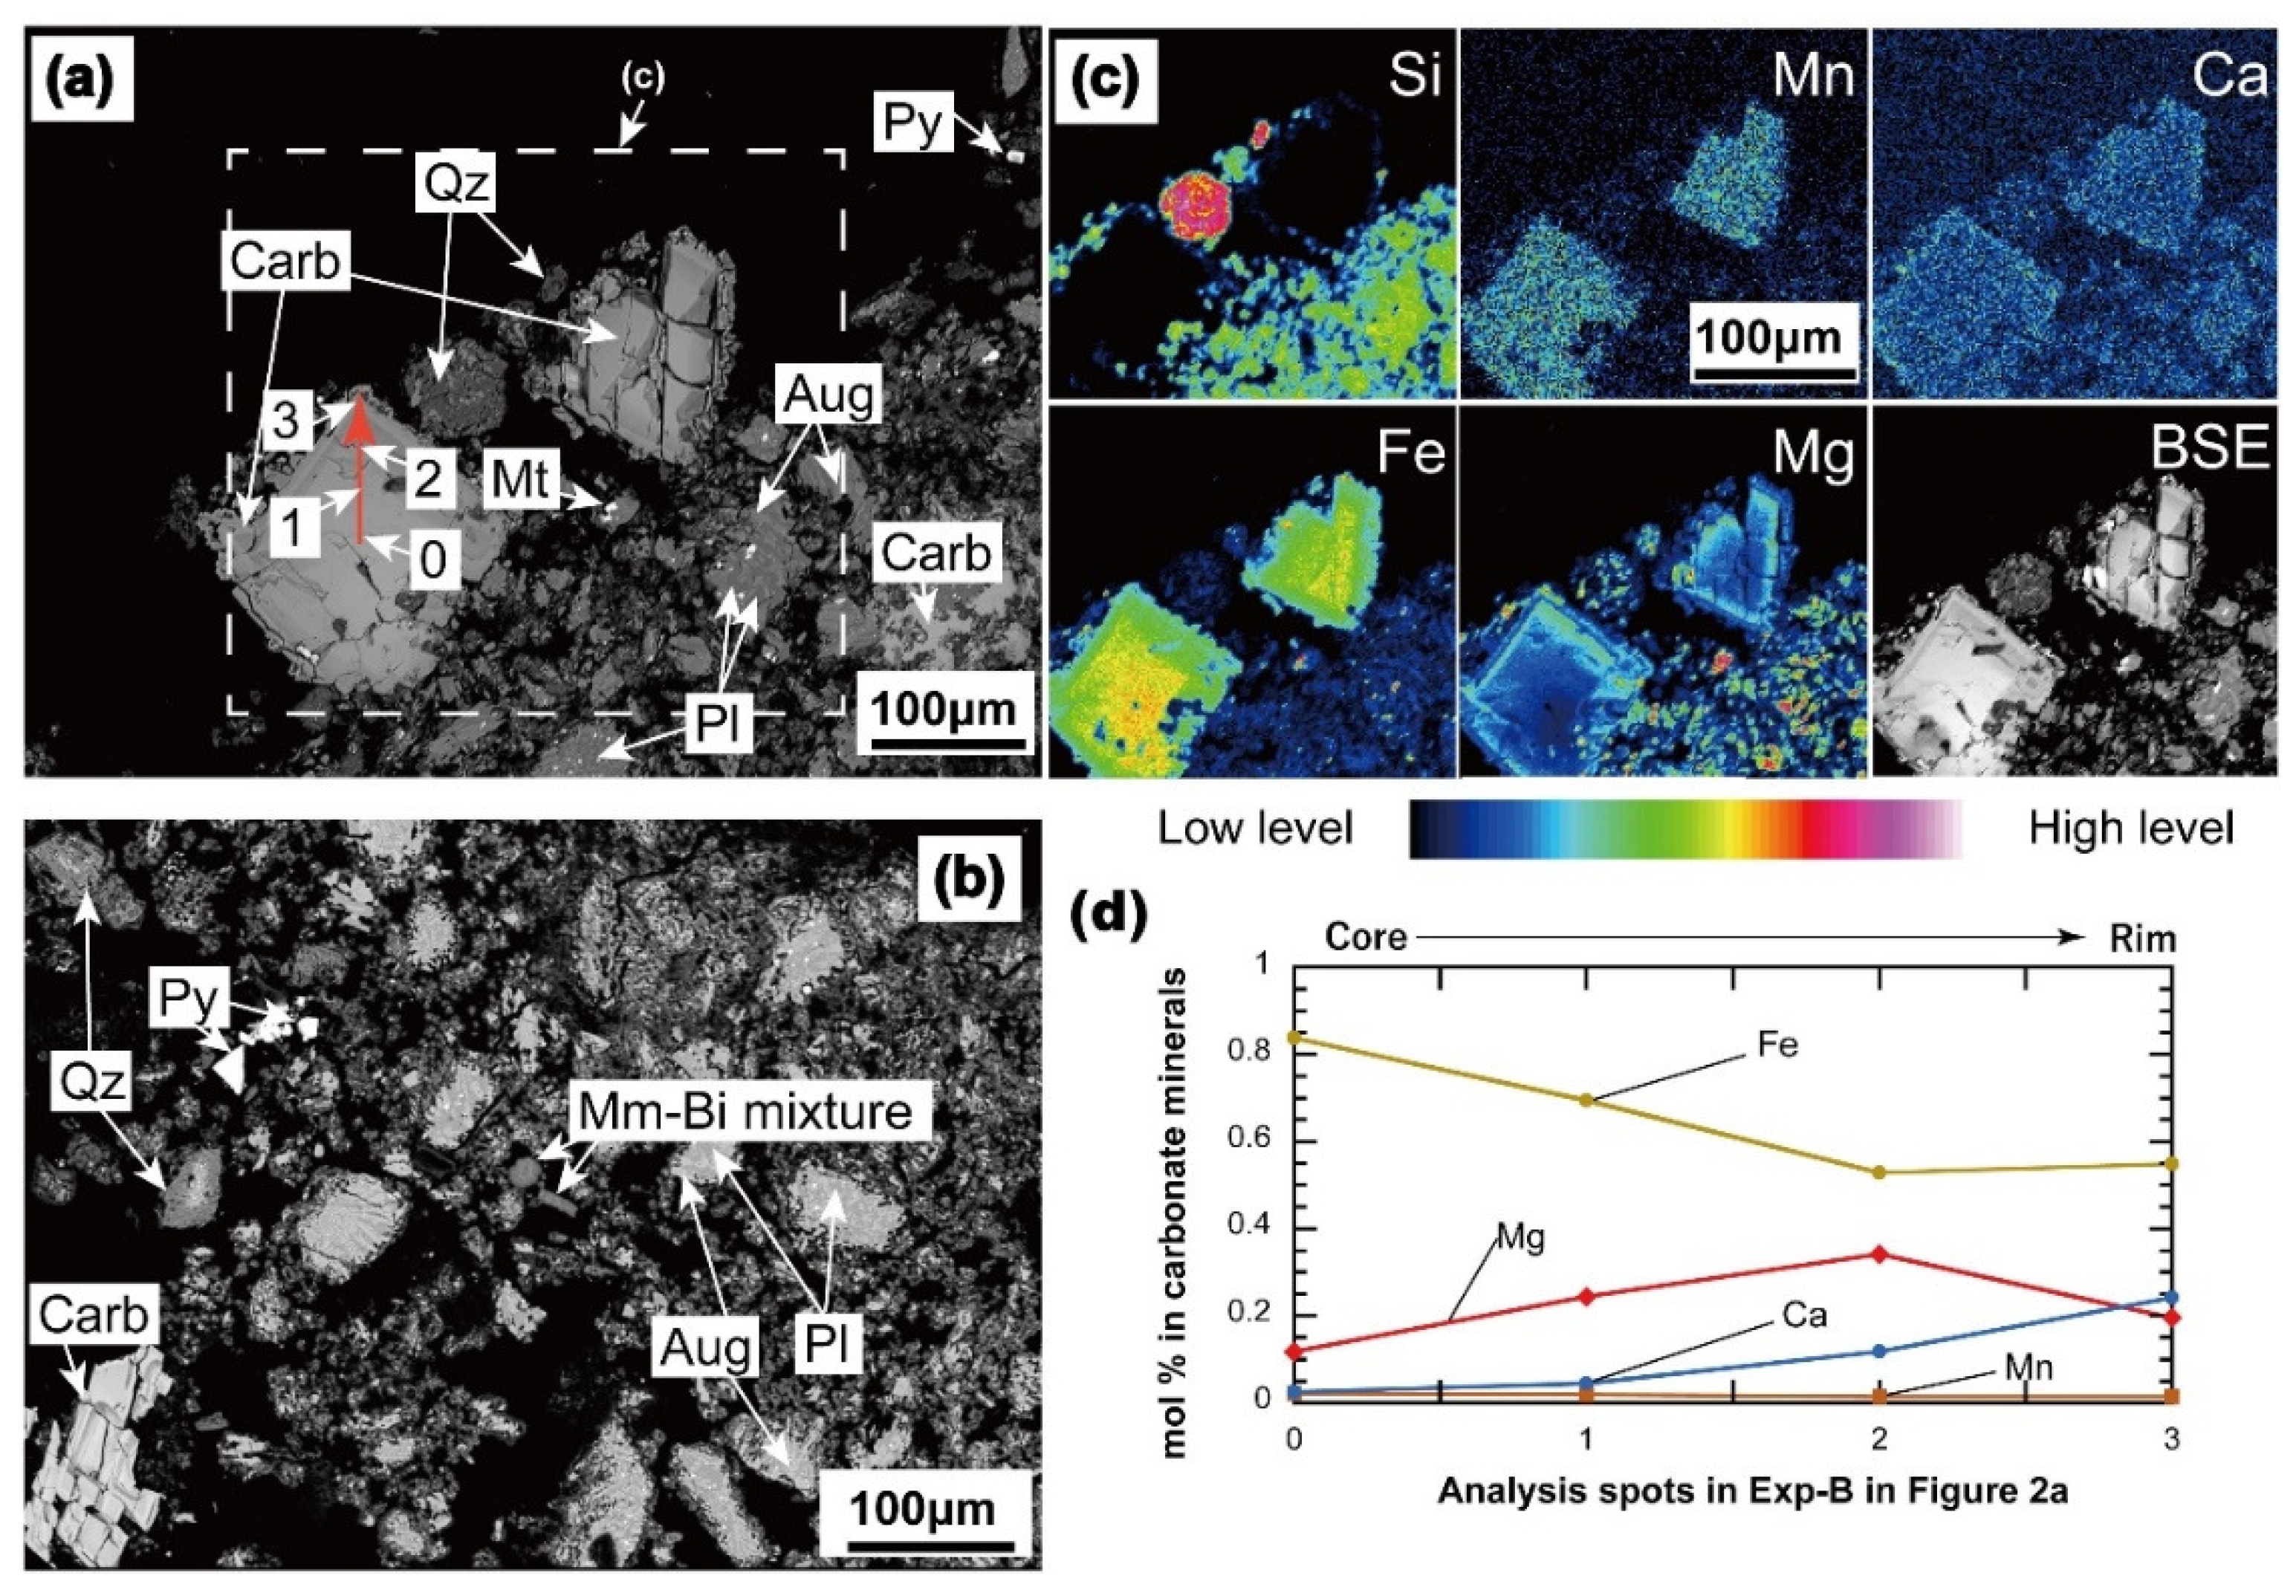
3.1.1. Carbonate and Other Secondary Minerals

In Exp-B, the solid run product includes carbonate, quartz, and a montmorillonite–beidellite mixture as secondary major minerals, whereas magnetite and pyrite occur as accessory minerals (Figure 2a,b and Table 3). In addition, subordinate amounts of augite and plagioclase were also recognized as relict igneous minerals. Among these minerals, the abundance of carbonate is clearly much higher than others (Figure 2a,b). Therefore, it is suggested that the composition of carbonate strongly affected and reflected the compositions of coexisting fluids.
Almost all carbonates in the run product have a high Fe content with clear zoning textures (Figure 2c,d). The carbonate Fe content decreases, whereas the Mg and Ca contents increases from the core to the rim (Figure 2c,d), although the Mn content is kept low throughout the crystal (Figure 2d). The second most abundant element in carbonate changes from Mg in the core to Ca in the rim. Meanwhile, the ΣCO2 concentration in the fluid drastically decreased before the first fluid sampling (Table 4 and Figure 3a), indicating that the carbonate formation mainly occurred at 350 °C. Furthermore, considering that the Fe content in the montmorillonite–beidellite mixture (only one major silicate bearing Fe) is quite low (Table 3), this indicates that most of the Fe in the basalts was fixed into carbonates at the earliest stage of the experiment. Then, the outer parts of carbonates presumably grew slowly in the periods at 250 and 175 °C because the outward increases in the contents of Mg and Ca relative to Fe in carbonates are consistent with the drastic decrease in Fe concentrations by the end of the 175 °C period and gradual increases or conservation of Mg and Ca concentrations in fluid by the beginning of the 175 °C period (Figure 2c,d and Figure 3a). Although the ΣCO2 concentration in the fluid irregularly fluctuated at these temperatures (e.g., a temporal increase at 665 h), it is highly possible that dissolution of preexisting (metastable) carbonate drove the growth of other zoned carbonates.
In Exp-K, carbonate and saponite predominantly occur as secondary minerals, whereas pentlandite and magnetite are also included in the run product as minor minerals. In addition, the primary igneous olivine and Cr-spinel are also partially preserved in Exp-K (Figure 4a,b,d). Similar to Exp-B, carbonate abundantly exists and shows clear zoning textures in the run product of Exp-K (Figure 4), whereas the drastic decrease in ΣCO2 concentration before the second sampling indicates the dominant formation of carbonate at 350 °C (Table 4 and Figure 3b). The EPMA analyses revealed that the carbonate minerals can be classified into two types, based on the zoning pattern—type I carbonates have a Mg-rich core (Figure 4c,e), whereas the less abundant type II carbonates have a Fe-rich core (Figure 4d,f). From core to rim, the most abundant element of the type I carbonate changes from Mg, through Fe, and Mg again to Ca, whereas that of the type II carbonate changes from Fe through Mg to Ca. Moreover, the second most abundant element of the type I carbonate changes from Fe through Mg and Fe to Mg, whereas that of the type II carbonate changes from Mg through Fe to Mg outward. The zoning pattern of the type II carbonate is completely consistent with that in the middle to the outer parts of the type I carbonate, indicating that the type II carbonate started to form when the composition of the preexisting type I carbonate changed from Mg-rich to Fe-rich.
By comparing the zoning patterns of carbonate to the fluid compositions, the Mg-rich core of the type I carbonate cannot be explained using the obtained fluid data because the ΣCO2 concentration had been already sufficiently decreased at the timing of the first fluid sampling (350 °C); therefore, the formation of the Mg-rich core of the type I carbonate was already terminated at that time (Figure 3b and Figure 4b,c,e). The hydrothermal fluid just after the beginning of the experiment presumably had a reasonably high Mg concentration. Next, the decrease in Fe content and the increases in Mg contents outward recognized in both type I and type II carbonates are consistent with the drastic decrease in the Fe concentration and the slight increase in Mg concentration in the fluid by the end of the 175 °C period (Figure 3b and Figure 4d,f). Then, although the Ca enrichment in the rims of both carbonate types is not reflected in the increase in Ca concentration in the fluid (Figure 3b and Figure 4e,f), this compositional change in carbonates was probably caused by the temperature decrease to ≤100 °C, because calcite is much more stable than Mg-bearing carbonates, even in solutions with high Mg/Ca ratios at low temperatures (e.g., <100 °C) [68].

3.1.2. Fluid Chemistry

The Cl concentrations of the fluids in both experiments were kept relatively constant throughout the experiments because Cl-bearing minerals generally rarely form during the alteration of basalts and komatiites (Table 4 and Figure 3) [69,70]. Nevertheless, most of the fluid compositions changed as water–rock reactions proceeded in both experiments. As discussed above, the ΣCO2 concentrations in the fluids decreased from 6000–8000 mmol/kg to 970 mmol/kg in Exp-B and 839 mmol/kg in Exp-K (Figure 3) because of the formation of abundant carbonate minerals (details above). Meanwhile, other cations also dissolved in the fluid from rocks through the reactions with the strongly acidic fluid. These water–rock reactions probably affected the pHin-situ of fluid. The pHin-situ values of fluids increased and converged to 4.6 in Exp-B and 3.9 in Exp-K through both experiments (Table 4), indicating that the neutralization effect of water–rock reactions (especially carbonate formation) efficiently elevated the pHin-situ from 0.
The H2 concentrations in the fluids in Exp-B and Exp-K increased up to 0.30 mmol/kg and 2.42 mmol/kg just after the beginning of the experiments, then eventually decreased down to 0.05 mmol/kg and 0.02 mmol/kg, respectively (Table 4 and Figure 3). The difference in H2 concentrations in the fluid between Exp-B and Exp-K was likely caused by the compositional difference between basalt and komatiite, as the modern peridotite-hosted hydrothermal systems generate more H2-rich fluid than basalt-hosted systems [71]. Thereafter, the H2 concentrations in both experiments rapidly decreased the values to lower than 0.1 mmol/kg. Such fluctuations in H2 concentrations under CO2-rich conditions are generally caused by Fe redox reactions in metastable minerals (including Fe-carbonate) before reaching a near-equilibrium state [40,72]. Thus, similar processes could occur in our experiments.
The other element concentrations (Na, K, Ca, Mg, Fe, Mn, SiO2 and H2S) increased just after the beginning of the experiments, then changed as the water–rock reactions proceeded (Table 4; Figure 3). As discussed in Section 3.1.1, the concentrations of carbonate-forming elements (Ca, Mg, Fe, and Mn) in the fluids are closely related to the formation of carbonates in both experiments. Among these elements, most importantly, Ca in Exp-B had the highest concentration, whereas the most abundant cation in the fluid was Mg in Exp-K at low temperatures, which is completely different from Na-rich modern seawater and seafloor hydrothermal fluids (Table 4 and Figure 3). Although it is known that Ca and Mg are frequently released from mafic and ultramafic rocks into hydrothermal fluid under CO2-rich conditions [39,40,72,73], this is likely because the Na content in basalt and komatiite is generally not high enough to elevate a fluid Na concentration from zero to the highest values, in contrast to the Mg and Ca abundantly contained in these mafic and ultramafic rocks. Therefore, considerable amounts of Na (and also K) in the rocks were dissolved into the fluids, whereas their residuals were fixed as minor elements in the secondary minerals (mainly phyllosilicates) in the experiments. Therefore, the rates of change of the Na and K concentrations in fluids in both experiments were not significant compared with those of Fe and Mn (Table 4 and Figure 3). It is, therefore, obviously suggested that the more Na- and K-rich basalt generated high concentrations of these cations in the fluid than komatiite in the experiments.
The SiO2 concentrations significantly fluctuated during both experiments. However, considering that the concentrations at the end of the period of each temperature were more stable than that just after the temperature drop, the changes in SiO2 concentrations should be tracked using the last values in the period of a temperature. In this case, it seems that the SiO2 concentrations in the fluid decreased in Exp-B, whereas the concentrations in Exp-K irregularly fluctuated with decreasing temperatures (Table 4 and Figure 3). The different behaviors may have been caused by the numbers of minerals buffering the SiO2 concentrations in the fluid. In Exp-B, two minerals (quartz and montmorillonite–beidellite mixture at least at low temperatures) should affect the fluid SiO2 concentration (Figure 2), indicating that the decreasing SiO2 concentration with decreasing temperature was presumably controlled mainly by the temperature dependency of equilibrium constants among SiO2 and minerals in the experiments. However, the only SiO2-bearing mineral in Exp-K was saponite, as far as the solid run product was observed using EPMA (Figure 4). Considering that saponite is basically influenced by not only SiO2 activity but also other components such as Al, Mg, and Fe, the SiO2 concentration in Exp-K was strongly affected by the behavior of the activities of other species during the experiments.
Regarding H2S concentrations in the experiments, they were drastically elevated just after the beginning of the experiments (sampling #0 to #1) and then basically decreased to <0.1 mmol/kg with minor fluctuations (Table 4 and Figure 3). These compositional changes were likely caused by the dissolution of FeS originally contained in the rocks just after the beginning and formation of pyrite in Exp-B and pentlandite in Exp-K with decreasing temperature (Figure 2 and Figure 4).

3.2. Thermodynamic Modeling

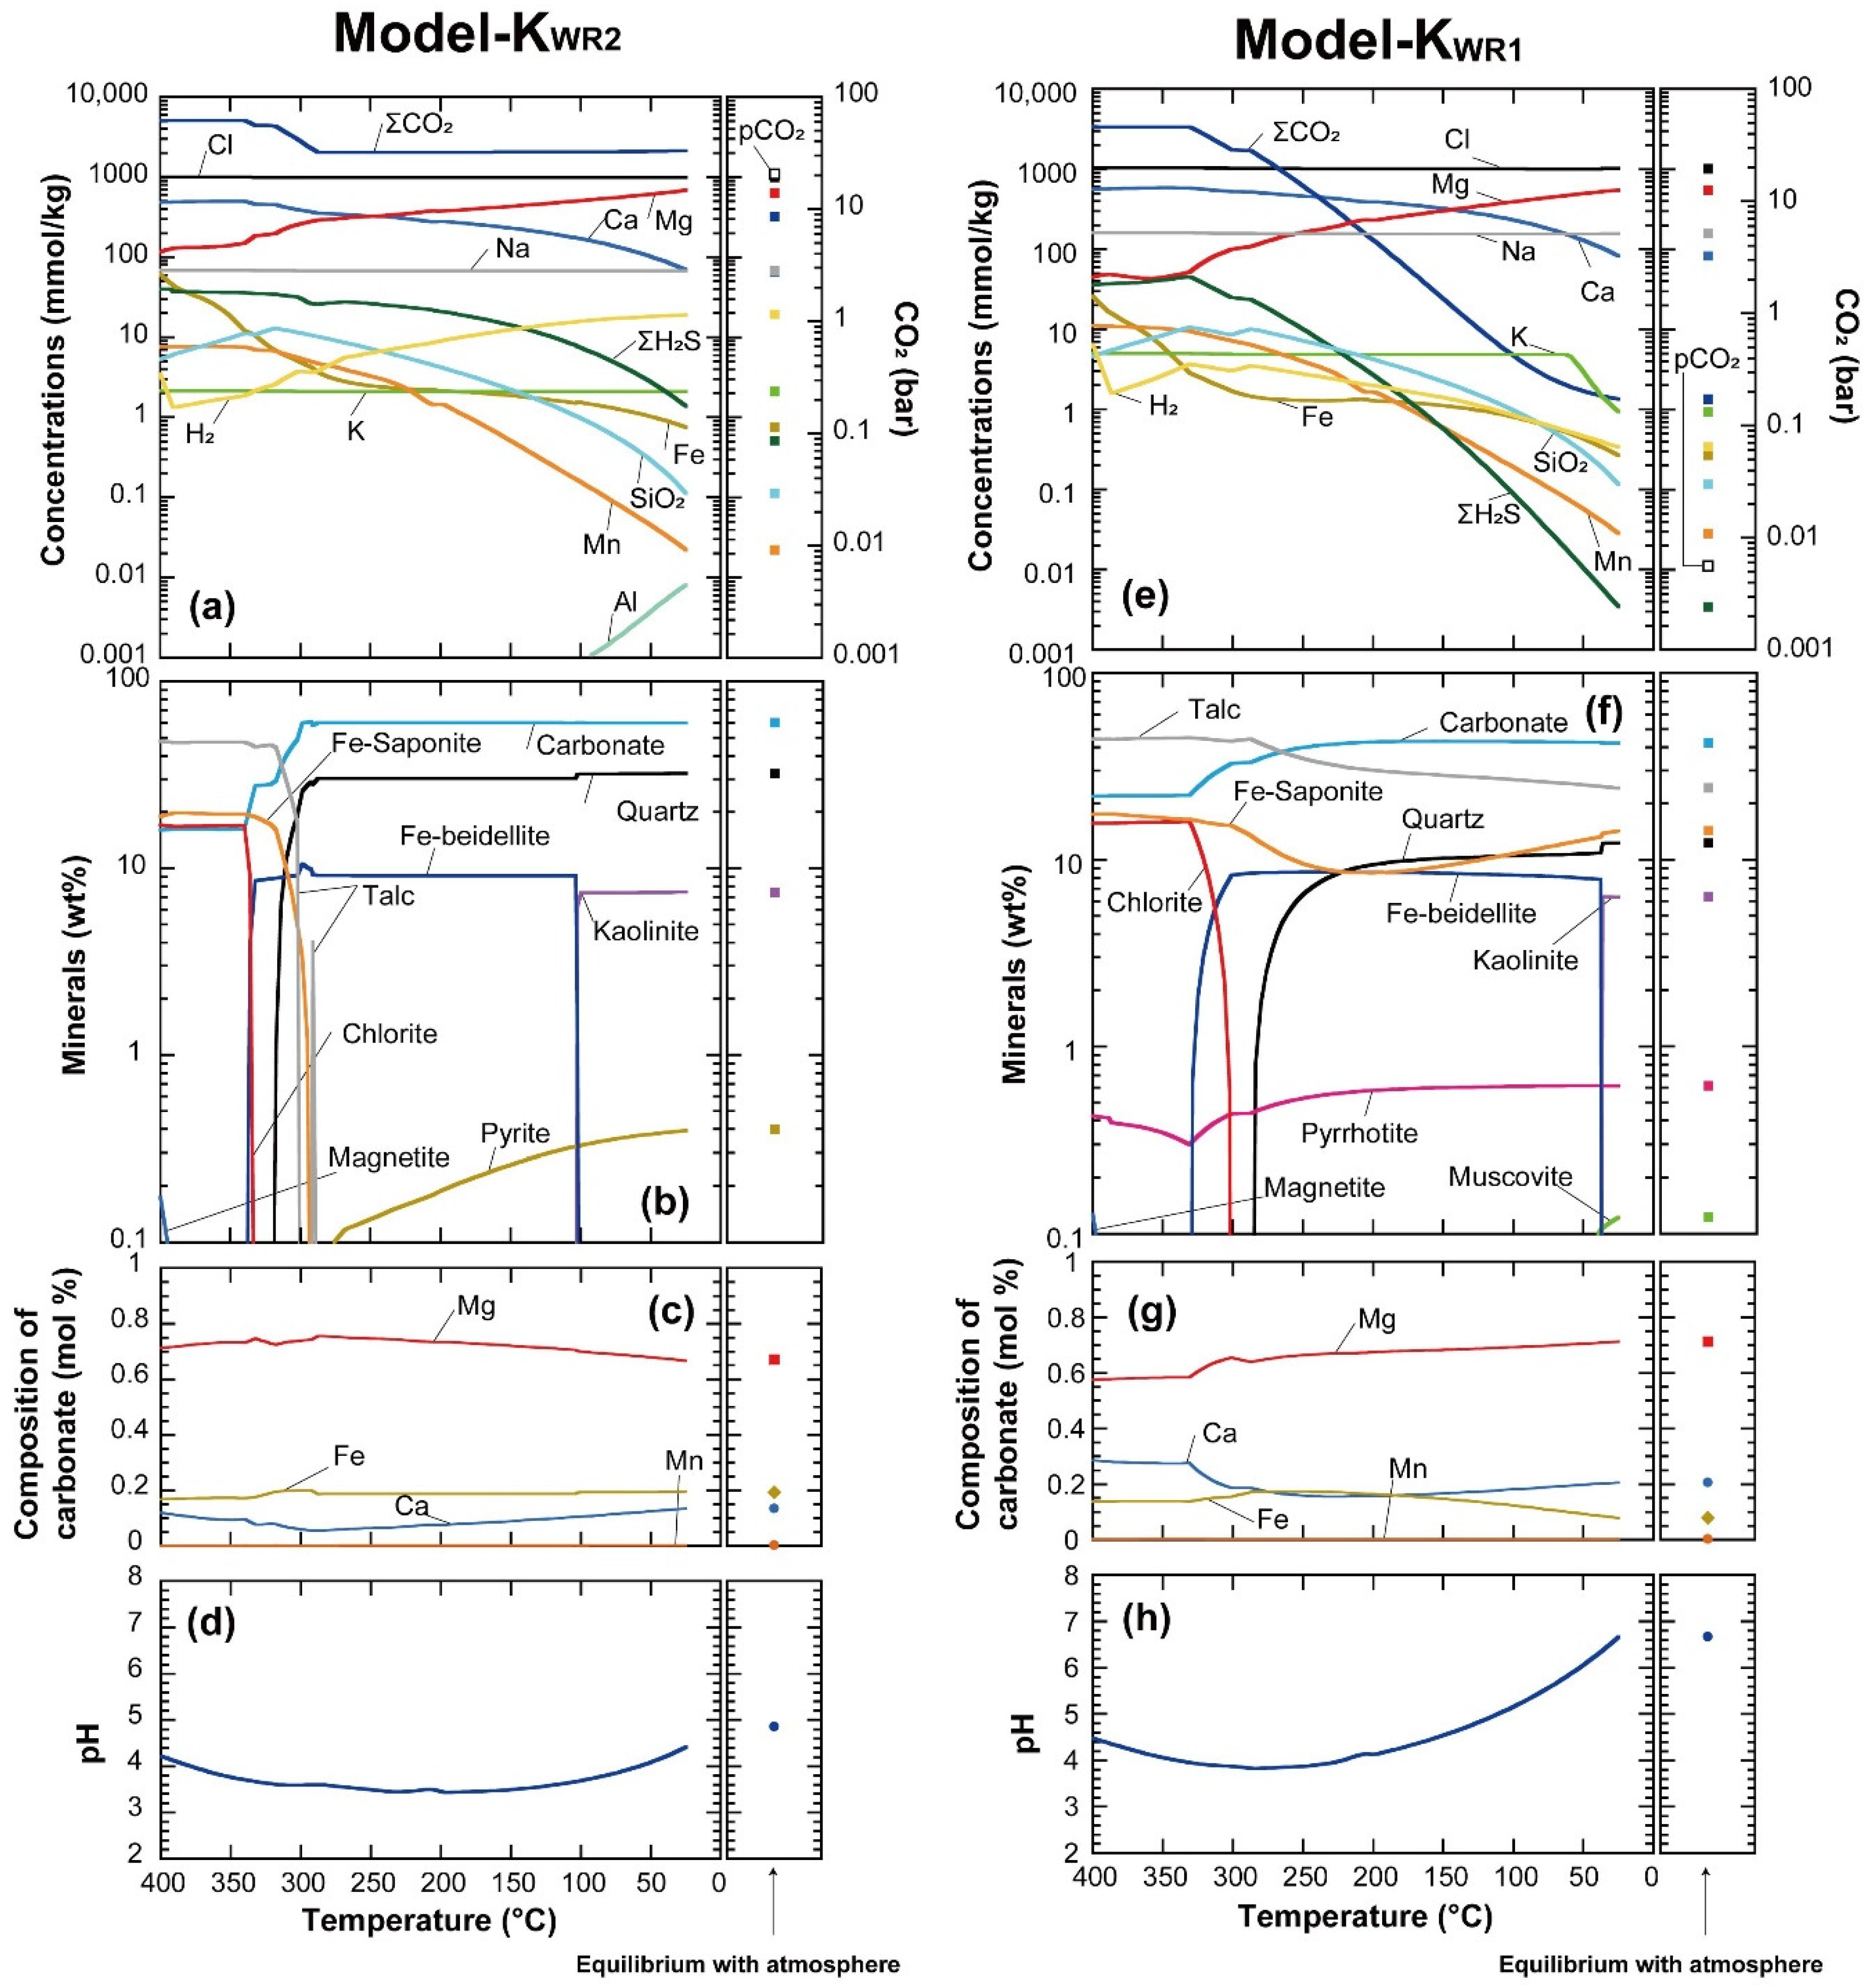
3.2.1. Secondary Minerals

The secondary minerals in the experiments were not completely but well reproduced by thermodynamic modeling. Both Model-BWR2 and Model-BWR1 show that the assemblage of major minerals changes from beidellite + saponite + talc + carbonate at 350 °C, through beidellite + carbonate + quartz at intermediate temperatures, to carbonate + kaolinite + quartz at <100 °C (Figure 5). Therefore, the low-temperature mineral assemblage of carbonate + kaolinite + quartz is expected for the solid run product in Exp-B if complete equilibrium was achieved during the experiment. In this regard, carbonate and quartz were also included as major minerals in Exp-B (Table 3; Figure 2). However, the montmorillonite–beidellite mixture was the most abundant phyllosilicate in the experiment, instead of kaolinite as predicted in the modeling. Although these phyllosilicates are commonly SiO2-rich hydrous minerals, this discrepancy of the mineral species could be due to the kinetic effects at the laboratory timescale. In this experiment, the solid run product experienced the reactions at temperatures decreasing from 350 °C to 25 °C, meaning it is highly likely that traces of the minerals formed at higher temperatures were compositionally conserved in the newly formed minerals or preserved as relict metastable minerals at lower temperatures.
In the modeling of the komatiite system, Model-KWR2 and Model-KWR1 commonly show that the major minerals consist of talc + carbonate + saponite + chlorite at around 350 °C (Figure 6). However, Model-KWR2 indicates that the assemblage of carbonate + quartz + beidellite at 300–100 °C changes to carbonate + quartz + kaolinite, whereas the assemblage in Model-KWR1 is carbonate + talc + saponite + quartz + beidellite at <300 °C. This difference in stable silicate minerals at temperatures below 300 °C between the two komatiite models means that phyllosilicates are generated more abundantly in the system with a low initial W/R ratio (Model-KWR1). The abundant occurrence of various phyllosilicates in Model-KWR1 indicates that carbonate-forming elements (Mg and Fe) are incorporated not only into carbonate but also into the phyllosilicates (Figure 6). Such elemental partitioning between carbonates and silicates is closely related to the drastic decrease in ΣCO2 concentrations in the fluid with decreasing temperature from ~300 °C in Model-KWR1 (see details below), indicating that the lowered ΣCO2 concentration can no longer form more carbonate minerals, in contrast to Model-KWR2 (Figure 6a). Therefore, the CO2 fixation capacity still remains for the komatiite at these temperatures in this model (see details below).
As described above, Exp-K shows that the carbonate and saponite are the predominant secondary minerals in the run products (Table 5 and Figure 4). These minerals are included as major minerals even at low-temperatures in Model-KWR1 (Figure 6), indicating that the alteration minerals in Exp-K could be reproduced by thermodynamic modeling, at least partially. However, the mineral assemblage of carbonate + saponite indicates that the run product includes neither quartz nor talc (Table 5 and Figure 4), which are the second major minerals in Model-KWR2 and Model-KWR1, respectively. In general, there are some minerals for which formation or precipitation is kinetically limited despite their thermodynamic stability. However, the formation of quartz and talc is rather common in altered rocks, as observed for natural carbonated serpentinites and experimentally serpentinized ultramafic rocks (e.g., [72,74,75]). Therefore, the inconsistency between the experiment and modeling might be explained by the effective bulk composition for silicates (whole-rock composition, excluding carbonate). If the amount of carbonate formed in the experiment is lower than the amounts predicted in the models, the effective bulk composition for silicates in the experiment should be more SiO2-poor than those of the models, which might stabilize saponite rather than more SiO2-rich talc and quartz. Conversely, if the saponite formation in Exp-K is faster than talc at 350 °C, where both saponite and talc are thermodynamically stable, the selective formation and the preservation of saponite, including carbonate-forming elements (e.g, Mg and Fe), could cause the slight suppression of carbonate formation. In addition, the small amount of igneous minerals left in the experiment could also affect the effective bulk composition.

3.2.2. Fluid Chemistry

There are also many similarities in fluid compositions between the models and experiments. Irrespective of the initial W/R ratios and rock types, the models and experiments show that (1) the major cations are Ca, Mg, and Na; (2) the concentrations of Ca, ΣCO2, SiO2, ΣH2S, and Mn decrease, while (3) that of Mg increases with decreasing temperature (Figure 5 and Figure 6). Furthermore, the Na, K, and Cl concentrations are basically constant at all temperatures, although only the K concentration at < 60 °C in Model-KWR1 is lowered because of the formation of the K-bearing mineral. These consistencies indicate that the experimental results are mostly well reproduced by our thermodynamic modeling (Figure 3, Figure 5 and Figure 6).
The final ΣCO2 concentration in each model strongly depends on the initial W/R ratio and the rock type; the high initial W/R ratio leads to the high final ΣCO2 concentration in fluid, whereas the final ΣCO2 concentrations in the komatiite system (1.4 mmol/kg in Model-KWR1 and 2146 mmo/kg in Model-KWR2) are lower than those of the basalt system (502 mmol/kg in Model-BWR1 and 4031 mmo/kg in Model-BWR2), respectively (Figure 5 and Figure 6). The former is well explained by the mass balance of CO2 in fluid and rocks. At 25 °C in Model-BWR2, Model-BWR1, and Model-KWR2, the abundance of CO2 in the initial fluid–rock equilibrium system exceeds the CO2 fixation capacity of the rocks, as carbonate, quartz, and kaolinite are the dominant secondary minerals (no more carbonate could be formed), which is reflected in the results showing that excess CO2 remains in the fluid as ΣCO2 in high concentrations (4031, 502, and 2146 mmol/kg, respectively). In contrast, the ΣCO2 concentration in Model-KWR1 decreases more drastically with decreasing temperature than other models, then reaches a minimum at 1.4 mmol/kg, while talc and saponite are present as major secondary minerals in addition to carbonates at 25 °C (Figure 6). In this case, the CO2 fixation ability of komatiite in Model-KWR1 still remains as Fe and Mg in talc and saponite, which sufficiently reduced the ΣCO2 concentration, in contrast to the Model-BWR1, despite having the same initial W/R ratio. Therefore, the latter factor (rock type) mainly depends on the contents of the carbonate-forming elements (Ca, Mg, and Fe) in the rocks. Indeed, the sum of these elements is more abundant in the komatiite (10.0 moles/kg) than basalt (5.8 moles/kg). Regarding the final ΣCO2 concentrations in the experiments (970 mmol/kg in Exp-B and 839 mmol/kg in Exp-K), the value falls within the range between the final ΣCO2 concentrations with two different initial W/R ratios in each rock type, consistent with the W/R ratios decreasing from 2.25 to 1 during both experiments.
The pHin-situ values of the modeling results are also broadly consistent with those of the experiments (Table 4; Figure 5 and Figure 6). In the basaltic system, the pHin-situ in Exp-B did not show significant fluctuation and changed from 3.6 at 350 °C to 4.6 at 25 °C (Table 4). Considering that the W/R ratios decreased during the experiment, the pHin-situ in Exp-B is consistent with the calculated pHin-situ value that changes from 4.1 at 350 °C in Model-BWR2 to 4.8 at 25 °C in Model-BWR1 (Figure 5). In the komatiitic system, the pHin-situ changed from 3.5 to 3.9 in Exp-K (Table 4), which can be considered to be broadly consistent with but slightly lower than that in Model-KWR2, changing from 3.8 at 350 °C to 4.4 at 25 °C (Figure 6). This small discrepancy, especially at low-temperatures, might be caused by the difference of phyllosilicate in the secondary minerals between the experiment and model (see above). In addition, in Model-KWR1, pHin-situ values (changing from 4.1 at 350 °C to 6.7 at 25 °C) are clearly higher than those of the experiment (Figure 5 and Figure 6), which is likely caused by the lower ΣCO2 concentration of fluid in the model than that of the experiment and by the difference in mineral assemblage between them.
Although most of the fluid compositions could be well explained by the thermodynamic modeling, as discussed above, the Fe and H2 concentrations in the models clearly differs from those in the experiments (Figure 3, Figure 5, and Figure 6). In both experiments, Fe concentrations decreased from quite high values (~100 mmol/kg) at 350 °C to minimum values at intermediate temperatures, then slightly increased again at 100–25 °C. Nevertheless, the Fe concentrations in the basalt models are kept almost constant at low levels at all temperatures (Figure 5), whereas the komatiite models show drastic decreases in Fe concentrations with decreasing temperatures from 350 to 300 °C, then the concentration gradually decreased even at low temperatures (Figure 6). Such discrepancies in the behavior of Fe concentrations between the model and experiment can be derived from several reasons, but the most plausible factor in this case is considered to be the kinetics of the iron redox reactions in the experiments, because there is also a discrepancy in H2 concentrations that are mainly controlled by the iron redox reactions in rocks.
The H2 concentrations in the models, except Model-KWR1, generally increase from 1–5 mmol/kg at 350 °C to 18–40 at 25 °C with decreasing temperature, which are much higher than the experimental values (generally <0.1 mmol/kg) (Figure 4, Figure 5 and Figure 6). As summarized, H2 and Fe concentrations in the experiments are lower and higher than those in a thermodynamic equilibrium state, respectively. Given that H2 is generated by oxidation of FeO and reduction of H2O in fluid–rock systems (e.g., [70]), it is suggested that H2 was not sufficiently generated because the oxidation of ferrous iron in rocks was kinetically slow during the experiments. Indeed, many previous studies have experimentally demonstrated that redox reactions involving Fe(II) and H2O in fluid–rock systems are kinetically much slower than non-redox reactions, even at high temperatures [40,76,77]. Therefore, the low H2 concentrations in the experiments were probably caused by insufficient oxidation of ferrous iron in the rocks, whereas the high activities of Fe(II)-bearing (solid-solution) minerals elevated the Fe concentrations in the experiments. These mechanisms likely account for the higher Fe contents in carbonate minerals in the experiments than thermodynamically expected (Figure 2, Figure 4, Figure 5 and Figure 6).

4. Implications for the Primitive Earth

4.1. Seawater ΣCO2 Concentration and W/R Ratio

The experiments and thermodynamic modeling provided the final ΣCO2 concentrations in fluids. However, these values methodologically include CO2 that should remain in the atmosphere after the separation of the ocean from the high-temperature atmosphere (Section 1 and Section 2). Therefore, the CO2 distribution between the atmosphere and ocean at 25 °C was thermodynamically calculated based on a mass balance of CO2 and re-equilibration of rock, fluid, and gas phases, providing the ΣCO2 concentration (and other compositions) in seawater and the partial pressure of atmospheric CO2 (Figure 5 and Figure 6). Consequently, 4031 and 503 mmol/kg of the final ΣCO2 values in Model-BWR2 and Model-BWR1 provided 550 and 84 mmol/kg of ΣCO2 in seawater and 39 and 4.4 bars of atmospheric CO2, respectively. Likewise, 2146 mmol/kg of the final ΣCO2 values for Model-KWR2 was calculated to be 320 mmol/kg ΣCO2 in seawater and 20 bar atmospheric CO2, whereas the 1.4 mmol/kg for Model-KWR1 was calculated to be 1.4 mmol/kg ΣCO2 (unchanged) and 0.006 bar of atmospheric CO2. Although these estimates vary depending on the ocean surface temperature, which is still unknown, we discuss the W/R ratios when the primordial ocean formed in comparison with geological records and other theoretical climate models.
Although geological records in the Hadean are quite limited, the Hadean ΣCO2 concentration can be extrapolated from Archean geological records. The carbonate-bearing mineral assemblage in the high-temperature zone of an Archean-altered oceanic crust [78,79] revealed that ΣCO2 concentrations in the hydrothermal fluid were much higher than 200 mmol/kg in the early Archean [80]. Furthermore, the depth profile of carbon isotope ratios of carbonate minerals in the altered oceanic crust indicated that most of CO2 dissolved in hydrothermal fluids was derived from the ambient seawater [81]. Therefore, it is suggested that ΣCO2 concentrations in seawater were higher than 200 mmol/kg, even in the Archean. Considering the evolution of seawater CO2 concentrations on geological timescales, the CO2 fixation into the oceanic crust through hydrothermal alteration at spreading centers and subsequent crustal subduction played significant roles in reducing ΣCO2 concentrations in seawater from the early Archean to the early Proterozoic [82,83]. In the meantime, previous theoretical modeling of the CO2 cycles in the early Earth showed that the ΣCO2 concentration in the 4.4 Ga seawater may have been comparable to that in the early Archean (e.g., 3.5 Ga), although massive meteorite impacts and their ejecta weathering potentially reduced the oceanic and atmospheric CO2 levels temporarily between the two ages [84,85,86]. These geological and theoretical considerations would imply that the ΣCO2 concentration when the primordial ocean emerged was higher than approximately 200 mmol/kg. Of course, it should be noted that this estimation involves many uncertainties. However, if this is the case, this lower limit value is inconsistent with the seawater ΣCO2 concentrations in Model-BWR1 and Model-KWR1, suggesting that the W/R ratio during the formation of the ocean was at least higher than 1. On the other hand, a mass balance model simulating geochemical CO2 cycles in the early Earth with a similar amount of total carbon indicated that CO2-rich seawater controlled the partial pressure of atmospheric CO2 at as high as 10 bars (e.g., 8 bars at pH = 6; [7]). Although the assumed geologic ages are later than that assumed in this study, if this value is assumed to be the upper limit of pCO2 when the stabilized primordial ocean emerged, the estimated values higher than 20 bars in Model-BWR2 and Model-KWR2 contradict the mass balance model. In this case, the W/R ratio can be estimated to be <2.25 during the formation process of the ocean. However, the quantitative constraints on the upper limit of pCO2 at the time assumed in this study are still uncertain [87].
The constrained W/R ratio (>1) when the primordial ocean formed means that the thickness of the reacted crust should be <0.9 km, given the 2.7 km depth of seawater and a density of carbonated basalt and komatiite of about 3 g/cc. The estimated thickness of the reactive crust in the early Hadean is less than the reactive crustal thickness in modern mid-ocean ridges, where a high-temperature (~400 °C) reaction zone (root zone of hydrothermal circulation cell) is located at a depth of ~2 km [88]. This implies that there was an extremely steep geothermal gradient in the primitive crust globally when the steady primordial ocean emerged. This interpretation is consistent with the extremely high heat flow (~160 W/m2) from the Earth’s interior when the ocean formed, indicating that the ocean was present on the thin, solidified crust covering the molten mantle [89,90]. Otherwise, almost all CO2 originally contained in the supercritical atmosphere could be fixed as carbonates into the thick crust with high CO2 fixation capacity. Furthermore, the underlying molten mantle had no potential to emit CO2 to the surface because CO2 in the magma ocean had been already degassed almost completely due to its quite low solubility in melts (e.g., [91]). As such, the CO2-poor atmosphere could not keep the Earth’s surface temperature above the freezing point of water due to the insufficiency of the greenhouse effects compensating the faint young sun, unless other greenhouse gases were present in the atmosphere (e.g., [92]).

4.2. Concentrations of Cations and pH in Seawater

The four models commonly suggest that the primordial ocean was remarkably enriched in Ca and Mg, in contrast to modern seawater. To keep the consistency with previous geological and theoretical studies (see above), it is highly possible that the concentration of Mg exceeded that of Na in the primordial ocean. Once plate tectonics started, however, a continuous recycling of oceanic crust efficiently provided fresh unaltered basaltic oceanic crust. The newly-created oceanic crust likely supplied Na and K to the ocean and relatively reduced Mg and Ca concentrations through hydrothermal alterations at mid-ocean ridges, as suggested by experiments simulating CO2-rich seawater and basalts [39]. Due to this process, the ocean composition would have gradually become NaCl-dominant. Furthermore, later halite formation in association with continental growth probably reduced the salinity to modern values [46].
In contrast, the pH value of the primordial ocean was estimated to be in the range of 4.9–6.7. Such values are consistent with geologically and theoretically estimated values for the early Archean era (>5.7; [8]). Therefore, even if plate tectonics started after ocean formation, a mildly acidic ocean could have been maintained by the Archean era probably because the neutralization effect of the later water–rock reactions in the oceanic crust could be canceled out by the CO2-rich atmosphere. Furthermore, Fe concentrations were estimated to be around 1 mmol/kg, consistent with the values in Archean seawater that precipitated banded iron formations (e.g., ~1.8 mmol/kg; [93]). This suggests that the ocean had the capacity to keep Fe concentrations high enough to generate banded iron formations even before the Archean once a continuous supply of Fe from the black smoker-type hydrothermal activities began.

5. Conclusions

After the last magma ocean, the volatile-bearing supercritical atmosphere cooled down, reacting with the underlying infantile primitive crustal rocks. Once the ocean’s temperature stabilized, a mildly acidic Mg- and Ca-rich carbonic ocean eventually emerged on the altered and carbonated thin crust covering a molten mantle. The estimated composition indicates that the modern salty ocean was originally derived from a bitter and fizzy primordial ocean. The ocean’s composition likely started to evolve once plate tectonics began on Earth.

Author Contributions

Conceptualization, H.U. and T.S.; methodology, H.U. and T.S.; software, H.U. and T.S.; validation, H.U. and T.S.; formal analysis, H.U.; investigation, H.U.; resources, T.S.; data curation, H.U.; writing—original draft preparation, H.U.; writing—review and editing, H.U. and T.S.; visualization, H.U.; supervision, T.S.; project administration, T.S.; funding acquisition, T.S. All authors have read and agreed to the published version of the manuscript.

Funding

This work was partly supported by Grants-in-Aid for Scientific Research from the Japan Society for Promotion of Science (KAKENHI JSPS), grant numbers JP15K13583, JP17H06455, and JP17H06454.

Data Availability Statement

The data presented in this study are available on request from the corresponding author.

Acknowledgments

We thank Yohei Matsui and Akiko Makabe for assisting the data acquisition with ICP-OES, and Akihiro Tame and Katsuyuki Uematsu for supporting FE-EPMA analysis. We also thank Keisuke Fukushi for providing thermodynamic data on clay minerals.

Conflicts of Interest

The authors declare no conflict of interest.

References

  1. Russell, M.J.; Barge, L.M.; Bhartia, R.; Bocanegra, D.; Bracher, P.J.; Branscomb, E.; Kidd, R.; McGlynn, S.; Meier, D.H.; Nitschke, W.; et al. The Drive to Life on Wet and Icy Worlds. Astrobiology 2014, 14, 308–343. [Google Scholar] [CrossRef] [PubMed]
  2. Martin, W.; Baross, J.; Kelley, D.; Russell, M.J. Hydrothermal vents and the origin of life. Nat. Rev. Microbiol. 2008, 6, 805–814. [Google Scholar] [CrossRef]
  3. Shibuya, T.; Russell, M.J.; Takai, K. Free energy distribution and hydrothermal mineral precipitation in Hadean submarine alkaline vent systems: Importance of iron redox reactions under anoxic conditions. Geochim. Cosmochim. Acta 2016, 175, 1–19. [Google Scholar] [CrossRef]
  4. Wilde, S.A.; Valley, J.W.; Peck, W.H.; Graham, C.M. Evidence from detrital zircons for the existence of continental crust and oceans on the Earth 4.4 Gyr ago. Nature 2001, 409, 175–178. [Google Scholar] [CrossRef] [PubMed]
  5. Mojzsis, S.J.; Harrison, T.M.; Pidgeon, R.T. Oxygen-isotope evidence from ancient zircons for liquid water at the Earth’s surface 4,300 Myr ago. Nature 2001, 409, 178–181. [Google Scholar] [CrossRef]
  6. Morse, J.W.; Mackenzie, F.T. Hadean Ocean carbonate geochemistry. Aquat. Geochem. 1998, 4, 301–319. [Google Scholar] [CrossRef]
  7. Walker, J.C.G. Carbon dioxide on the early earth. Orig. Life Evol. Biosph. 1985, 16, 117–127. [Google Scholar] [CrossRef] [Green Version]
  8. Grotzinger, J.P.; Kasting, J.F. New Constraints on Precambrian Ocean Composition. J. Geol. 1993, 101, 235–243. [Google Scholar] [CrossRef] [Green Version]
  9. Halevy, I.; Bachan, A. The geologic history of seawater pH. Science 2017, 355, 1069–1071. [Google Scholar] [CrossRef]
  10. Macleod, G.; McKeown, C.; Hall, A.J.; Russell, M.J. Hydrothermal and oceanic pH conditions of possible relevance to the origin of life. Orig. Life Evol. Biosph. 1994, 24, 19–41. [Google Scholar] [CrossRef]
  11. Maruyama, S.; Ikoma, M.; Genda, H.; Hirose, K.; Yokoyama, T.; Santosh, M. The naked planet Earth: Most essential pre-requisite for the origin and evolution of life. Geosci. Front. 2013, 4, 141–165. [Google Scholar] [CrossRef] [Green Version]
  12. Matsui, T.; Abe, Y. Impact-induced atmospheres and oceans on Earth and Venus. Nature 1986, 322, 526–528. [Google Scholar] [CrossRef]
  13. Matsui, T.; Abe, Y. Evolution of an impact-induced atmosphere and magma ocean on the accreting Earth. Nature 1986, 319, 303–305. [Google Scholar] [CrossRef]
  14. Abe, Y. Thermal and chemical evolution of the terrestrial magma ocean. Phys. Earth Planet. Inter. 1997, 100, 27–39. [Google Scholar] [CrossRef]
  15. Abe, Y.; Matsui, T. The formation of an impact-generated H2O atmosphere and its implications for the early thermal history of the Earth. J. Geophys. Res. 1985, 90, C545. [Google Scholar] [CrossRef]
  16. Pinti, D.L. The Origin and Evolution of the Oceans. In Lectures in Astrobiology; Gargaud, M., Barbier, B., Martin, H., Reisse, J., Eds.; Springer: Berlin, Germany, 2005. [Google Scholar]
  17. Zahnle, K.; Arndt, N.; Cockell, C.; Halliday, A.; Nisbet, E.; Selsis, F.; Sleep, N.H. Emergence of a Habitable Planet. Space Sci. Rev. 2007, 129, 35–78. [Google Scholar] [CrossRef]
  18. Zahnle, K.; Schaefer, L.; Fegley, B. Earth’s Earliest Atmospheres. Cold Spring Harb. Perspect. Biol. 2010, 2, a004895. [Google Scholar] [CrossRef] [Green Version]
  19. Foley, B.J.; Bercovici, D.; Elkins-Tanton, L.T. Initiation of plate tectonics from post-magma ocean thermochemical convection. J. Geophys. Res. Solid Earth 2014, 119, 8538–8561. [Google Scholar] [CrossRef] [Green Version]
  20. O’Neill, C.; Marchi, S.; Zhang, S.; Bottke, W. Impact-driven subduction on the Hadean Earth. Nat. Geosci. 2017, 10, 793–797. [Google Scholar] [CrossRef]
  21. O’Neill, C.; Turner, S.; Rushmer, T. The inception of plate tectonics: A record of failure. Philos. Trans. R. Soc. A Math. Phys. Eng. Sci. 2018, 376. [Google Scholar] [CrossRef] [Green Version]
  22. Aulbach, S.; Stagno, V. Evidence for a reducing Archean ambient mantle and its effects on the carbon cycle. Geology 2016, 44, 751–754. [Google Scholar] [CrossRef] [Green Version]
  23. Nicklas, R.W.; Puchtel, I.S.; Ash, R.D.; Piccoli, P.M.; Hanski, E.; Nisbet, E.G.; Waterton, P.; Pearson, D.G.; Anbar, A.D. Secular mantle oxidation across the Archean-Proterozoic boundary: Evidence from V partitioning in komatiites and picrites. Geochim. Cosmochim. Acta 2019, 250, 49–75. [Google Scholar] [CrossRef]
  24. Canil, D. Vanadium partitioning and the oxidation state of Archaean komatiite magmas. Nature 1997, 389, 842–845. [Google Scholar] [CrossRef]
  25. Canil, D. Vanadium in peridotites, mantle redox and tectonic environments: Archean to present. Earth Planet. Sci. Lett. 2002, 195, 75–90. [Google Scholar] [CrossRef]
  26. Trail, D.; Watson, E.B.; Tailby, N.D. The oxidation state of Hadean magmas and implications for early Earth’s atmosphere. Nature 2011, 480, 79–82. [Google Scholar] [CrossRef]
  27. Sleep, N.H. The Hadean-Archaean environment. Cold Spring Harb. Perspect. Biol. 2010, 2. [Google Scholar] [CrossRef] [Green Version]
  28. Liu, L.G. The inception of the oceans and CO2-atmosphere in the early history of the Earth. Earth Planet. Sci. Lett. 2004, 227, 179–184. [Google Scholar] [CrossRef]
  29. Sossi, P.A.; Burnham, A.D.; Badro, J.; Lanzirotti, A.; Newville, M.; O’Neill, H.S.C. Redox state of Earth’s magma ocean and its Venus-like early atmosphere. Sci. Adv. 2020, 6, 1–9. [Google Scholar] [CrossRef] [PubMed]
  30. Schaefer, L.; Lodders, K.; Fegley, B. Vaporization of the earth: Application to exoplanet atmospheres. Astrophys. J. 2012, 755. [Google Scholar] [CrossRef]
  31. Symonds, R.B.; Rose, W.I.; Reed, M.H. Contribution of C1- and F-bearing gases to the atmosphere by volcanoes. Nature 1988, 334, 415–418. [Google Scholar] [CrossRef]
  32. Gerlach, T.M. Volcanic sources of tropospheric ozone-depleting trace gases. Geochem. Geophys. Geosyst. 2004, 5. [Google Scholar] [CrossRef]
  33. Martin, R.S.; Mather, T.A.; Pyle, D.M. High-temperature mixtures of magmatic and atmospheric gases. Geochem. Geophys. Geosyst. 2006, 7. [Google Scholar] [CrossRef]
  34. Elkins-tanton, L.T. Magma Oceans in the Inner Solar System. Annu. Rev. Earth Planet. Sci. 2012, 40, 113–139. [Google Scholar] [CrossRef] [Green Version]
  35. Martin, H.; Albarède, F.; Claeys, P.; Gargaud, M.; Marty, B.; Morbidelli, A.; Pinti, D.L. 4. Building of a Habitable Planet. Earth. Moon. Planets 2006, 98, 97–151. [Google Scholar] [CrossRef] [Green Version]
  36. Nisbet, E.G. The geological setting of the earliest life forms. J. Mol. Evol. 1985, 21, 289–298. [Google Scholar] [CrossRef]
  37. Bickle, M.J. Implications of melting for stabilisation of the lithosphere and heat loss in the Archaean. Earth Planet. Sci. Lett. 1986, 80, 314–324. [Google Scholar] [CrossRef]
  38. Nakamura, K.; Kato, Y. Carbonatization of oceanic crust by the seafloor hydrothermal activity and its significance as a CO2 sink in the Early Archean. Geochim. Cosmochim. Acta 2004, 68, 4595–4618. [Google Scholar] [CrossRef]
  39. Shibuya, T.; Yoshizaki, M.; Masaki, Y.; Suzuki, K.; Takai, K.; Russell, M.J. Reactions between basalt and CO2-rich seawater at 250 and 350°C, 500bars: Implications for the CO2 sequestration into the modern oceanic crust and the composition of hydrothermal vent fluid in the CO2-rich early ocean. Chem. Geol. 2013, 359, 1–9. [Google Scholar] [CrossRef]
  40. Ueda, H.; Shibuya, T.; Sawaki, Y.; Saitoh, M.; Takai, K.; Maruyama, S. Reactions between komatiite and CO2-rich seawater at 250 and 350 °C, 500 bars: Implications for hydrogen generation in the Hadean seafloor hydrothermal system. Prog. Earth Planet. Sci. 2016, 3, 2–12. [Google Scholar] [CrossRef] [Green Version]
  41. Yoshizaki, M.; Shibuya, T.; Suzuki, K.; Shimizu, K.; Nakamura, K.; Takai, K.; Omori, S.; Maruyama, S. H2generation by experimental hydrothermal alteration of komatiitic glass at 300°C and 500 bars: A preliminary result from on-going experiment. Geochem. J. 2009, 43, 17–22. [Google Scholar] [CrossRef] [Green Version]
  42. Dixon, J.E.; Clague, D.A.; Stolper, E.M. Degassing History of Water, Sulfur, and Carbon in Submarine Lavas from Kilauea Volcano, Hawaii. J. Geol. 1991, 99, 371–394. [Google Scholar] [CrossRef] [Green Version]
  43. Saal, A.E.; Hauri, E.H.; Langmuir, C.H.; Perfit, M.R. Vapour undersaturation in primitive mid-ocean-ridge basalt and the volatile content of earth’s upper mantle. Nature 2002, 419, 451–455. [Google Scholar] [CrossRef] [PubMed]
  44. Wallace, P.; Carmichael, I.S.E. Sulfur in basaltic magmas. Geochim. Cosmochim. Acta 1992, 56, 1863–1874. [Google Scholar] [CrossRef]
  45. Nishizawa, M.; Saitoh, M.; Matsui, Y.; Usui, Y.; Shibuya, T. Removal of organic contaminants from iron sulfides as a pretreatment for mineral-mediated chemical synthesis under prebiotic hydrothermal conditions. Geochem. J. 2017, 51, 495–505. [Google Scholar] [CrossRef]
  46. Knauth, L.P. Temperature and salinity history of the Precambrian ocean: Implications for the course of microbial evolution. Palaeogeogr. Palaeoclimatol. Palaeoecol. 2005, 219, 53–69. [Google Scholar] [CrossRef]
  47. Ronov, A.B.; Yaroshevskhiy, A.A. A new model for the chemical structure of the earth’s crust. Geochem. Int. 1976, 13, 89–121. [Google Scholar]
  48. Holland, H.D. The Chemistry of the Atmosphere and Oceans; Wiley: New York, NY, USA, 1978. [Google Scholar]
  49. Seyfried, W.E.; Janecky, D.R.; Berndt, M.E. Rocking Autoclaves for Hydrothermal Experiments: II. The Flexible Reaction-Cell System. In Hydrothermal Experimental Techniques; Ulmer, G.C., Barnes, H.L., Eds.; Wiley: Hoboken, NJ, USA, 1987; ISBN 0-471-82145-4. [Google Scholar]
  50. Takenouchi, S.; Kennedy, G.C. The binary system H2O-CO2 at high temperatures and pressures. Am. J. Sci. 1964, 262, 1055–1074. [Google Scholar] [CrossRef]
  51. Wolery, T.W.; Jarek, R.L. EQ3/6, version 8.0–Software User’s Manual; Sandia National Laboratories: Albuquerque, NM, USA, 2003.
  52. Johnson, J.W.; Oelkers, E.H.; Helgeson, H.C. SUPCRT92: A software package for calculating the standard molal thermodynamic properties of minerals, gases, aqueous species, and reactions from 1 to 5000 bar and 0 to 1000 °C. Comput. Geosci. 1992, 18, 899–947. [Google Scholar] [CrossRef]
  53. Majzlan, J.; Lang, B.E.; Stevens, R.; Navrotsky, A.; Woodfield, B.F.; Boerio-Goates, J. Thermodynamics of Fe oxides: Part I. Entropy at standard temperature and pressure and heat capacity of goethite (α-FeOOH), lepidocrocite (γ-FeOOH), and maghemite (γ-Fe2O3). Am. Mineral. 2003, 88, 846–854. [Google Scholar] [CrossRef]
  54. Majzlan, J.; Grevel, K.D.; Navrotsky, A. Thermodynamics of Fe oxides: Part II. Enthalpies of formation and relative stability of goethite (α-FeOOH), lepidocrocite (γ-FeOOH), and maghemite (γ-Fe2O3). Am. Mineral. 2003, 88, 855–859. [Google Scholar] [CrossRef]
  55. Shock, E.L.; Helgeson, H.C.; Sverjensky, D.A. Calculation of the thermodynamic and transport properties of aqueous species at high pressures and temperatures: Standard partial molal properties of inorganic neutral species. Geochim. Cosmochim. Acta 1989, 53, 2157–2183. [Google Scholar] [CrossRef]
  56. Shock, E.L.; Koretsky, C.M. Metal-organic complexes in geochemical processes: Estimation of standard partial molal thermodynamic properties of aqueous complexes between metal cations and monovalent organic acid ligands at high pressures and temperatures. Geochim. Cosmochim. Acta 1995, 59, 1497–1532. [Google Scholar] [CrossRef]
  57. Sverjensky, D.A.; Shock, E.L.; Helgeson, H.C. Prediction of the thermodynamic properties of aqueous metal complexes to 1000 °C and 5 kb. Geochim. Cosmochim. Acta 1997, 61, 1359–1412. [Google Scholar] [CrossRef]
  58. Shock, E.L.; Sassani, D.C.; Willis, M.; Sverjensky, D.A. Inorganic species in geologic fluids: Correlations among standard molal thermodynamic properties of aqueous ions and hydroxide complexes. Geochim. Cosmochim. Acta 1997, 61, 907–950. [Google Scholar] [CrossRef]
  59. McCollom, T.M.; Bach, W. Thermodynamic constraints on hydrogen generation during serpentinization of ultramafic rocks. Geochim. Cosmochim. Acta 2009, 73, 856–875. [Google Scholar] [CrossRef]
  60. McCollom, T.M.; Shock, E.L. Geochemical constraints on chemolithoautotrophic metabolism by microorganisms in seafloor hydrothermal systems. Geochim. Cosmochim. Acta 1997, 61, 4375–4391. [Google Scholar] [CrossRef]
  61. Shock, E.L.; Helgeson, H.C. Calculation of the thermodynamic and transport properties of aqueous species at high pressures and temperatures: Correlation algorithms for ionic species and equation of state predictions to 5 kb and 1000 °C. Geochim. Cosmochim. Acta 1988, 52, 2009–2036. [Google Scholar] [CrossRef]
  62. Helgeson, H.C.; Delany, J.M.; Nesbitt, H.W.; Bird, D.K. Summary and critique of the thermodynamic properties. Am. J. Sci. 1978, 274, 1199–1261. [Google Scholar] [CrossRef] [Green Version]
  63. Wilson, J.; Savage, D.; Cuadros, J.; Shibata, M.; Ragnarsdottir, K.V. The effect of iron on montmorillonite stability. (I) Background and thermodynamic considerations. Geochim. Cosmochim. Acta 2006, 70, 306–322. [Google Scholar] [CrossRef]
  64. Helgeson, H.C. Thermodynamics of hydrothermal systems at elevated temperatures and pressures. Am. J. Sci. 1969, 267, 729–804. [Google Scholar] [CrossRef]
  65. Helgeson, H.C.; Kirkham, D.H. Theoretical prediction of the thermodynamic behavior of aqueous electrolytes at high pressures and temperatures; II, Debye-Huckel parameters for activity coefficients and relative partial molal properties. Am. J. Sci. 1974, 274, 1199–1261. [Google Scholar] [CrossRef] [Green Version]
  66. Drummond, S. Boiling and Mixing of Hydrothermal Fluids: Chemical Effects on Mineral Precipitation. Ph.D. Thesis, Pennsylvania State University, State College, PA, USA, 1981. [Google Scholar]
  67. McCollom, T.M.; Seewald, J.S. A reassessment of the potential for reduction of dissolved CO2 to hydrocarbons during serpentinization of olivine. Geochim. Cosmochim. Acta 2001, 65, 3769–3778. [Google Scholar] [CrossRef]
  68. Tribble, J.S.; Arvidson, R.S.; Lane, M.; Mackenzie, F.T. Crystal chemistry, and thermodynamic and kinetic properties of calcite, dolomite, apatite, and biogenic silica: Applications to petrologic problems. Sediment. Geol. 1995, 95, 11–37. [Google Scholar] [CrossRef]
  69. Seyfried, W.E.; Dibble, W.E. Seawater-peridotite interaction at 300°C and 500 bars: Implications for the origin of oceanic serpentinites. Geochim. Cosmochim. Acta 1980, 44, 309–321. [Google Scholar] [CrossRef]
  70. Allen, D.E.; Seyfried, W.E. Compositional controls on vent fluids from ultramafic-hosted hydrothermal systems at mid-ocean ridges: An experimental study at 400 °C, 500 bars. Geochim. Cosmochim. Acta 2003, 67, 1531–1542. [Google Scholar] [CrossRef]
  71. Seyfried, W.E.; Pester, N.J.; Tutolo, B.M.; Ding, K. The Lost City hydrothermal system: Constraints imposed by vent fluid chemistry and reaction path models on subseafloor heat and mass transfer processes. Geochim. Cosmochim. Acta 2015, 163, 59–79. [Google Scholar] [CrossRef] [Green Version]
  72. Grozeva, N.G.; Klein, F.; Seewald, J.S.; Sylva, S.P. Experimental study of carbonate formation in oceanic peridotite. Geochim. Cosmochim. Acta 2017, 199, 264–286. [Google Scholar] [CrossRef]
  73. Klein, F.; McCollom, T.M. From serpentinization to carbonation: New insights from a CO2 injection experiment. Earth Planet. Sci. Lett. 2013, 379, 137–145. [Google Scholar] [CrossRef]
  74. Lindahl, I.; Nilsson, L.P. Geology of the soapstone deposits of the Linnajavri area, Hamarøy, Nordland, north Norwegian Caledonides-Norway’s largest reserves of soapstone. Geol. Soc. Geol. Sur. Nor. Spec. Publ. 2008, 11, 19–35. [Google Scholar]
  75. Hansen, L.D.; Dipple, G.M.; Gordon, T.M.; Kellett, D.A. Carbonated serpentinite (listwanite) at Atlin, British Columbia: A geological analogue to carbon dioxide sequestration. Can. Mineral. 2005, 43, 225–239. [Google Scholar] [CrossRef]
  76. Seyfried, W.E.; Foustoukos, D.I.; Fu, Q. Redox evolution and mass transfer during serpentinization: An experimental and theoretical study at 200 °C, 500bar with implications for ultramafic-hosted hydrothermal systems at Mid-Ocean Ridges. Geochim. Cosmochim. Acta 2007, 71, 3872–3886. [Google Scholar] [CrossRef]
  77. Shibuya, T.; Yoshizaki, M.; Sato, M.; Shimizu, K.; Nakamura, K.; Omori, S.; Suzuki, K.; Takai, K.; Tsunakawa, H.; Maruyama, S. Hydrogen-rich hydrothermal environments in the Hadean ocean inferred from serpentinization of komatiites at 300 °C and 500 bar. Prog. Earth Planet. Sci. 2015, 2. [Google Scholar] [CrossRef] [Green Version]
  78. Kitajima, K.; Maruyama, S.; Utsunomiya, S.; Liou, J.G. Seafloor hydrothermal alteration at an Archaean mid-ocean ridge. J. Metamorph. Geol. 2001, 19, 583–599. [Google Scholar] [CrossRef]
  79. Shibuya, T.; Kitajima, K.; Komiya, T.; Terabayashi, M.; Maruyama, S. Middle Archean ocean ridge hydrothermal metamorphism and alteration recorded in the Cleaverville area, Pilbara Craton, Western Australia. J. Metamorph. Geol. 2007, 25, 751–767. [Google Scholar] [CrossRef]
  80. Shibuya, T.; Komiya, T.; Nakamura, K.; Takai, K.; Maruyama, S. Highly alkaline, high-temperature hydrothermal fluids in the early Archean ocean. Precambrian Res. 2010, 182, 230–238. [Google Scholar] [CrossRef]
  81. Shibuya, T.; Tahata, M.; Kitajima, K.; Ueno, Y.; Komiya, T.; Yamamoto, S.; Igisu, M.; Terabayashi, M.; Sawaki, Y.; Takai, K.; et al. Depth variation of carbon and oxygen isotopes of calcites in Archean altered upperoceanic crust: Implications for the CO2 flux from ocean to oceanic crust in the Archean. Earth Planet. Sci. Lett. 2012, 321–322, 64–73. [Google Scholar] [CrossRef]
  82. Shibuya, T.; Tahata, M.; Ueno, Y.; Komiya, T.; Takai, K.; Yoshida, N.; Maruyama, S.; Russell, M.J. Decrease of seawater CO2 concentration in the Late Archean: An implication from 2.6Ga seafloor hydrothermal alteration. Precambrian Res. 2013, 236, 59–64. [Google Scholar] [CrossRef]
  83. Shibuya, T.; Komiya, T.; Takai, K.; Maruyama, S.; Russell, M.J. Weak hydrothermal carbonation of the Ongeluk volcanics: Evidence for low CO2 concentrations in seawater and atmosphere during the Paleoproterozoic global glaciation. Prog. Earth Planet. Sci. 2017, 4, 31. [Google Scholar] [CrossRef] [Green Version]
  84. Sleep, N.H.; Zahnle, K.; Sleep, N.H. Carbon Dioxide Cycling and the Climate of Ancient Earth. J. Geophys. Res. Planets 2001, 106, 1373–1399. [Google Scholar] [CrossRef]
  85. Zahnle, K.; Sleep, N.H. Carbon dioxide cycling through the mantle and implications for the climate of ancient Earth. Geol. Soc. Spec. Publ. 2002, 199, 231–257. [Google Scholar] [CrossRef]
  86. Kadoya, S.; Krissansen-Totton, J.; Catling, D.C. Probable Cold and Alkaline Surface Environment of the Hadean Earth Caused by Impact Ejecta Weathering. Geochem. Geophys. Geosyst. 2020, 21. [Google Scholar] [CrossRef] [Green Version]
  87. Ramirez, R.M.; Kopparapu, R.K.; Lindner, V.; Kasting, J.F. Can Increased Atmospheric CO2 Levels Trigger a Runaway Greenhouse? Astrobiology 2014, 14, 714–731. [Google Scholar] [CrossRef] [PubMed]
  88. Alt, J.C. Subseafoor Processes in Mid-Oceanic Ridge Hydrothermal Systems. In Seafoor Hydrothermal Systems: Physical, Chemical, Biological Interactions Geophysical Monographs; Humphris, S.E., Zierenberg, R.A., Mullineaux, L.S., Thomson, R.E., Eds.; American Geophysical Union: Washington, DC, USA, 1995; pp. 85–114. [Google Scholar]
  89. Abe, Y.; Matsui, T. Evolution of an Impact-Generated H2O–CO2 Atmosphere and Formation of a Hot Proto-Ocean on Earth. J. Atmos. Sci. 1988, 45, 3081–3101. [Google Scholar] [CrossRef] [Green Version]
  90. Abe, Y. Physical state of the very early Earth. Lithos 1993, 30, 223–235. [Google Scholar] [CrossRef]
  91. Dixon, J.E. Degassing of alkalic basalts. Am. Mineral. 1997, 82, 368–378. [Google Scholar] [CrossRef]
  92. Kasting, J. Earth’s early atmosphere. Science 1993, 259, 920–926. [Google Scholar] [CrossRef]
  93. Konhauser, K.O.; Amskold, L.; Lalonde, S.V.; Posth, N.R.; Kappler, A.; Anbar, A. Decoupling photochemical Fe(II) oxidation from shallow-water BIF deposition. Earth Planet. Sci. Lett. 2007, 258, 87–100. [Google Scholar] [CrossRef]
Figure 1. Back-scatter electron (BSE) images of the synthetic (a) komatiite and (b) basalt before experiments, as revealed by field emission–electron probe microanalyzer (FE-EPMA). (a) The dark gray strip-shaped structure is composed of plagioclase, while the light gray structure that spreads to fill the space is augite. Therefore, the strip-shaped structure in which the space between the plagioclase constituting the matrix is filled with pyroxene, called the intersertal texture, a peculiar basalt structure. (b) The dark gray strip-shaped structure is composed of olivine (spinifex texture), while the light gray structure that spread to fill the space is glass. Abbreviations: Spi—Cr spinel; Pl—plagioclase; Ol—olivine; Mt—magnetite; Aug—augite; Gl—glass.
Minerals 11 00389 g001
Figure 2. (a,b) BSE images of the run products in Exp-B. (c) Elemental mapping (Si, Mn, Ca, Fe, and Mg) and BSE image for the area of the square in Figure 2a and (d) elemental contents of carbonate minerals in the run products in Exp-B. (a) Compositional zonation were observed in carbonate minerals. The brighter and dark regions correspond to Fe and Mg in carbonate minerals, respectively. (d) Fe, Mg, Ca, and Mn contents of carbonate minerals at each point of the carbonate minerals in Figure 2a. Abbreviations: Carb—carbonate mineral; Bi—beidellite; Mm –montmorillonite; Py—pyrite; Mt—magnetite; Qz—quartz; Pl—plagioclase.
Minerals 11 00389 g002
Figure 3. Concentrations of the dissolved species in aqueous fluid in (a) Exp-B and (b) Exp-K. The background colors represent each temperature during the experiments at 350, 250, 175, 100, and 25 °C. The green circles with black arrows mean that ΣH2S concentrations in the plot are the maximum and minimum estimates, respectively.
Minerals 11 00389 g003
Figure 4. (a,b,d) BSE images of the run products. (c) Elemental mapping of carbonate minerals (Mg, Fe, and Ca) from Figure 4b and (e,f) elemental contents of carbonate minerals in the run products after Exp-K. (ad) Compositional zonation observed in carbonate minerals. The brighter and dark regions correspond to Fe and Mg in carbonate minerals, as revealed by FE-EPMA, respectively. (b,d) Fe, Mg, Ca, and Mn contents at each point in type I and type II carbonate minerals in Figure 4c,e, respectively. Abbreviations: Carb—carbonate mineral; Spi—Cr spinel; Sap—saponite.
Minerals 11 00389 g004
Figure 5. Predicted fluid composition, mineral abundance, and carbonate composition values for Model-BWR2 (ad) and Model-BWR1 (eh) as functions of temperature. In each panel, the results of the re-equilibration simulation for the gas phase, solution, and rock at 25 °C are shown on the right.
Minerals 11 00389 g005
Figure 6. Predicted alteration, mineral abundance, and carbonate composition values for Model-KWR2 (ad) and Model-KWR1 (eh) as functions of temperature. In each panel, the results of the re-equilibration simulation for the gas phase, solution, and rock at 25 °C are shown on the right.
Minerals 11 00389 g006
Table 1. Chemical compositions of rocks (wt.%) used in this study.
Rock TypeBasaltKomatiite
SiO249.6947.46
TiO20.730.36
Al2O315.783.94
Cr2O30.030.35
FeO10.9711.00
MnO0.180.19
MgO9.4128.90
CaO10.817.13
Na2O1.870.14
K2O0.170.03
P2O50.050.02
NiO0.030.19
S0.280.28
Table 2. Representative compositions of minerals (wt.%) in synthetic basalt and komatiite as determined using EPMA.
MineralSynthetic BasaltSynthetic Komatiite
PlagioclaseAugiteOlivineGlassCr-Spinel
SiO250.057.857.847.354.041.854.50.0
TiO20.10.30.30.60.5-0.10.1
Al2O329.122.122.19.48.20.16.11.8
Cr2O3-0.00.00.10.00.10.257.4
FeOtotal a2.02.62.611.411.36.010.520.7
MnO0.00.00.00.30.30.00.20.2
MgO0.90.70.715.918.650.616.313.7
CaO14.510.410.413.05.90.210.90.3
Na2O2.55.85.80.71.90.00.20.0
K2O0.00.30.30.00.10.0--
P2O5-0.20.20.00.0-0.00.0
NiO-0.00.00.10.00.30.10.1
Total99.2100.1100.198.8100.999.399.194.3
Mg# b 0.710.750.94
Note: -, not detected. a Total iron as FeO. b Mg# = (Mg/(Mg + Fe)) × 100.
Table 3. Representative compositions of minerals (wt.%) in Exp-B as determined using EPMA.
MineralMontmorillonite-Beidellite MixtureCarbonate MineralsMineral Pyrite
core (0)12rim (3)
SiO255.454.80.0---Si0.0
TiO20.10.10.00.00.00.0Ti0.0
Al2O323.522.40.10.00.00.0Al0.0
Cr2O3-0.1---0.1Cr0.0
FeOtotal a1.11.350.243.735.135.0Fe47.9
MnO-0.11.31.10.90.9Mn0.0
MgO4.24.34.39.313.87.6Mg0.0
CaO1.01.01.22.26.012.0Ca0.0
Na2O0.00.00.10.10.10.0Na0.0
K2O0.00.0----K0.0
P2O5--0.10.10.00.0P0.0
NiO-0.10.00.00.1-Ni0.1
S54.4
Total85.384.357.356.556.155.8Total102.5
Mg# b0.870.85
Note: -, not detected. a Total iron as FeO. b Mg# = (Mg/(Mg + Fe)) × 100.
Table 4. Compositions of the sampled fluids in the experiments (mmol/kg).
ExperimentSampling #Temperature (°C)Time (h)pH25°C aΣCO2 bpH25°C cpHin-situ dΣH2SH2ΣCO2ClNaKMgCaSiO2FeMn
Basalt0 00.1n.a.n.a.n.a.<0.1n.a.6150–7270989-------
Exp-B1350173.53.92.93.60.70.30108896593.87.21031984.51432.06
23501374.20.93.13.91.30.0362910251399.747.43093.61153.32
32506655.73.43.13.30.10.03147088517111.186.43703.319.71.06
41758576.13.23.43.30.40.0673688519820.61394291.613.01.05
517518416.56.03.83.7<0.10.017108971307.91282592.83.750.02
610018656.79.13.93.7<0.10.028438951287.61122560.54.650.02
710033586.70.03.12.9<0.10.0383710031267.71082631.44.980.02
82569706.946.04.64.6<0.10.059709161245.61122820.39.440.04
Komatiite0 00.1n.a.n.a.n.a.<0.1n.a.6700–8000989-------
Exp-K1350164.311.22.93.5>9.72.4221938878.11.31322405.071.43.07
23501605.22.13.03.325.30.3312378697.11.41072631.364.44.42
32506405.61.63.03.1>0.30.08113792012.11.52372581.15.410.42
41759526.812.93.93.80.40.01981126011.21.43541922.92.210.01
517516246.55.43.53.3<0.10.0797788511.01.34181482.91.600.00
610016487.320.44.23.9<0.10.0171586811.61.14151412.71.870.01
710032087.427.24.44.1<0.10.1679691210.51.749387.91.41.620.00
82548647.510.63.93.9<0.10.028398355.4-50887.91.12.980.02
Note: n.a., not analyzed; -, not detected. a Measured pH after CO2 degassing. b Measured ΣCO2 concentration after CO2 degassing. c Calculated pH25 °C at 1 bar before CO2 degassing at room temperature. d Calculated pHin-situ at high-temperatures, 500 bars.
Table 5. Representative compositions of minerals (wt.%) in Exp-K as determined using EPMA.
MineralSaponiteCarbonate Minerals (Type I)Carbonate Minerals (Type II)
core (0)1234rim (5)core (0)1234567rim (8)
SiO246.4 54.4 46.9 -0.0 0.0 0.0 0.0 0.0 4.4 ---0.0 ----
TiO20.1 0.1 0.1 -0.0 0.0 0.0 0.0 0.0 -0.0 0.0 ------
Al2O35.7 4.5 6.7 -0.0 0.0 0.1 0.0 0.0 0.1 -0.0 -0.0 0.0 -0.0 0.0
Cr2O30.5 0.5 0.4 ---------0.0 0.0 ----
FeOtotal a15.6 7.2 10.2 9.4 12.6 32.2 17.3 7.2 7.9 35.9 38.3 32.1 28.5 25.8 24.0 20.0 17.3 9.5
MnO0.1 -0.1 0.3 0.5 1.5 0.7 0.1 0.1 2.0 2.0 1.6 1.3 1.3 1.1 0.6 0.2 0.2
MgO20.3 20.4 21.2 32.4 30.4 13.8 25.4 13.1 9.3 12.6 10.8 16.2 19.0 20.8 21.9 25.5 29.0 9.3
CaO0.1 0.1 2.2 3.1 2.5 2.9 3.4 28.1 33.9 2.6 5.2 5.5 5.4 6.0 7.0 6.3 4.8 33.2
Na2O0.0 0.1 0.1 0.0 0.0 0.0 0.0 0.0 0.1 0.1 0.0 0.1 0.0 0.0 0.0 0.0 -0.0
K2O-0.0 -0.0 0.0 0.0 0.0 0.0 0.0 ---------
P2O50.0 -0.0 0.1 0.0 0.0 0.1 0.1 0.0 0.0 0.0 0.0 0.1 0.0 0.0 0.1 0.0 0.1
NiO0.1 0.3 0.1 0.0 0.0 0.1 0.0 0.0 0.1 -0.1 -0.1 0.0 -0.1 0.0 0.1
Total88.9 87.6 88.0 45.3 46.1 50.4 46.9 48.7 51.3 57.8 56.5 55.6 54.5 54.2 54.2 52.6 51.4 53.1
Mg# b0.70 0.84 0.79
Note: -, not detected. a Total iron as FeO. b Mg# = (Mg/(Mg+Fe)) × 100.
Publisher’s Note: MDPI stays neutral with regard to jurisdictional claims in published maps and institutional affiliations.

