Article

Strength Characteristics of Clay–Rubber Waste Mixtures in Low-Frequency Cyclic Triaxial Tests

by
Małgorzata Jastrzębska
1,* and
Krzysztof Tokarz
2
1
Department of Geotechnics and Roads, Faculty of Civil Engineering, Silesian University of Technology, Akademicka 5, 44-100 Gliwice, Poland
2
Department of Graphics, Computer Vision and Digital Systems, Faculty of Automatic Control, Electronics and Computer Science, Silesian University of Technology, Akademicka 16, 44-100 Gliwice, Poland
*
Author to whom correspondence should be addressed.
Minerals 2021, 11(3), 315; https://doi.org/10.3390/min11030315
Submission received: 28 January 2021 / Revised: 10 March 2021 / Accepted: 16 March 2021 / Published: 18 March 2021

Abstract

:
This paper presents the results of consolidated and undrained (CU) triaxial cyclic tests related to the influence of tire waste addition on the strength characteristics of two different soils from Southern Poland: unswelling kaolin and swelling red clay. The test procedure included the normally consolidated remolded specimens prepared from pure red clay (RC) and kaolin (K) and their mixtures with two different fractions of shredded rubber powder (P) and granulate (G) in 5%, 10%, and 25% mass proportions. All samples were subjected to low-frequency cyclic loading carried out with a constant stress amplitude. Analysis of the results includes consideration of the effect of rubber additive and number of load cycles on the development of excess pore pressure and axial strain during the cyclic load operation and on the maximum stress deviator value. A general decrease in the shear strength due to the cyclic load operation was observed, and various effects of shear strength depended on the mixture content and size of the rubber waste particles. In general, the use of soil–rubber mixtures, especially for expansive soils and powder, should be treated with caution for cyclic loading.

Graphical Abstract

1. Introduction

The task of modern geotechnical engineering seeks solutions to many problems related to the foundation of building structures, protection against destruction, and creation of earthen structures (e.g., high embankments, dams). These problems are most often caused by complicated soil–water conditions, unfavorable loads transferred from the structure to the subsoil (cyclic or dynamic loads), the presence of a seismically active subsoil, or a subsoil subjected to mining influences. Unfortunately, many of these problems occur simultaneously.
Difficult and complicated geotechnical conditions occur when the substrate contains weak cohesive soils. Such soils often feature plastic consistency or show volume changes (swelling or shrinking) due to changes in the moisture content [1]. In the case of weak cohesive soils, measures are taken to reduce the weight of embankments constructed on them, while expansive soils seek a reduction in swelling. For these purposes, rubber waste from car tires can be used. In this way, soil strengthening treatments combine with the use of waste (referred to as “end-of-life tires” (ELT)), which humans generate in enormous quantities.
Methods to manage various rubber-type wastes (in addition to tires) are regulated by appropriate laws and regulations that require testing for new applications such as civil engineering works (reported by the World Business Council for Sustainable Development (WBCSD) [2]). These wastes are used primarily as backfills for road and railway embankments or backfill above flexible PVC pipelines [3], as retaining wall backfills (e.g., [4,5,6,7,8,9]), asphalt mixture additives [10,11], or as protection for buildings against earthquakes [12].
The majority of research conducted in this area focused primarily on checking the influence on a change in the optimum soil moisture content [13,14], the mechanical behavior of soils [15,16,17,18], reducing Atterberg limits and the plasticity index of fine-grained soils [17,19,20,21], and on a reduction of swelling by natural soils [22,23,24,25,26,27]. If the first two groups of issues apply to all soils, the next two are related strictly to cohesive (frequently expansive) soils. Furthermore, most papers focused on non-cohesive soils, while the few that refer to cohesive soils, and their related shear strength, are based primarily on direct shear [6,15,17,28] tests or unconfined compression tests. Triaxial tests are less common and conducted only under CD (consolidated and drained tests) [21] or CU (consolidated and undrained tests) conditions. The authors of this study are aware of only two papers where the researchers conducted UU triaxial tests (unconsolidated and undrained tests) [29,30].
This observation was confirmed inter alia by an extensive review by Yadav and Tiwari [31], which was devoted entirely to ELT inclusion in fine-grained soils. At the same time, having analyzed the available literature, the following conclusions were drawn and frequently function within a given soil group, either cohesive or non-cohesive. Regardless of the soil type, its unit weight declines after adding it to rubber waste and makes the structure lighter [32]. In the case of mixing cohesive soils with rubber waste, the basic conclusion was that generalizing the behavior of those mixtures was impossible due to the diversity of the mechanical properties of cohesive soils. All discrepancies observed in the behaviors of soil–rubber mixtures resulted from three basic factors: soil type, type of rubber waste used (size/shape, [25,26,33,34,35,36]), and its percentage (weight or volume) content. Many researchers reported unexpected changes in the behavior of mixtures depending on the type and size of rubber waste, the level of confining pressure, and the type of soil. This can concern both physical and mechanical parameters. Daud et al. [18] evaluated the effect of 1–5-mm-thick shredded tires on Atterberg’s limit of peat and clayey soil and reported liquid limit increases up to 20% rubber waste and decreases thereafter. In turn, Cetin et al. [17] reported no change in the liquid limit up to 30% rubber waste (4.75–2-mm tire chips) but decreases thereafter. In the case of the triaxial tests, Das and Singh [37] observed a reduction and random variation in the cohesion and friction angle (clay-fly ash-tire buffing mixtures), while Tajdini et al. [29] reported a noticeable increase in the friction angle of clay with the addition of crumb rubber amounts up to 10% (with subsequent decreases) and a decrease in cohesion for all mixtures. These results justified the need to continue further research in this direction.
Recently, new issues have appeared concerning the research of mixtures containing more than two components (such as cemented soil–rubber waste mixtures [38], steel furnace slag-coal wash–rubber crumb mixtures [39,40]), the energy distribution in such materials [39,40], or dynamic influences [39,40,41,42,43]. It is worth noting that more advanced research is possible thanks to the use of modern technologies (optical and stereoscopic binocular microscope [44], dynamic hollow cylinder [43], etc.).
The cyclic loadings that commonly occur in the environment (generated both by the forces of nature and by various types of devices) create another group of issues. These are interactions during which the loading and unloading cycles alternate over time, i.e., the multiple changes observed in the direction of the stress path by 180°. Most of the research on soil behavior under cyclical stresses concentrates on sands, not on fine-grained soils. The information related to cohesive soils originated early in the 1970s [45,46]. Another excellent paper was the state-of-the-art report by Wood [47] as well as a more current Leal and Kaliakin research report [48]. There is an impression that, within the focus of cyclic processes, current research interests comprise issues related to soil liquefaction resulting from pore pressure accumulation [49,50]. The results obtained so far concerning cohesive soils indicate the different, more complex behavior of these soils under cyclic loads. Cyclic degradation of strength and stiffness and development of pore pressure occurs in subsequent cyclic loading cycles in cohesive soils at the same time [50,51,52,53,54,55,56,57]. The development of pore pressure in saturated cohesive soils in undrained conditions depends on the amplitude, the soil overconsolidation ratio, and, as indicated by Jastrzębska [51,58], on the location of cyclic process in the “stress–strain” system (at the origin of coordinates (q, εs) = {0,0} or after a monotonic trajectory of primary loading that exists at each cyclic process in the soil environment). Significantly, the pore pressure is always positive for normally consolidated soils and causes a decrease in the effective stress [59]; however, for overconsolidated soils, a negative pressure may occur [60]. At the same time, Jastrzębska [51] observed that normally consolidated cohesive soils subjected to cyclic loading may also be characterized by an initial decrease in the pore pressure. Such a situation occurs when the cyclic load is implemented with a low amplitude after the monotonic load path (i.e., from a certain deformation value at ε1,unload ≠ 0).
There is a certain common element, cohesive soils, in the briefly presented issues. Such soils receive less study relative to non-cohesive soils for reasons such as that the testing methodology dedicated to such soils is specific and frequently complicated. Furthermore, the tests take longer than for sands [61,62,63], and at the same time, they constitute a greater challenge in geotechnics. Considering that weak cohesive soil represents the problematic soil, including expansive, “reinforced” by rubber waste, and subjected to cyclic loading in undrained conditions, a very interesting research issue appears, the aim of which is the practical use of cohesive soil–rubber waste mixtures in geoengineering as the light embankments on weak soils or the road or railway embankment construction. These aspects were all considered during the planning and implementation of these tests/experiments and are presented below.
The basic aim of this paper, determining the influence of cyclic loading at constant stress amplitude on the strength characteristics of clay–rubber waste mixtures, was based on these premises. CU cyclic triaxial tests (consolidated and undrained shearing) were performed for this issue on the following material mixtures: swelling red clay, non-swelling kaolin, rubber waste in the form of a 0–1-mm powder, and a 1–5-mm granulate. The influence of the aforementioned rubber waste on red clay swelling parameters was presented earlier by Kowalska and Jastrzębska [22] and Kowalska and Ptaszek [23].

2. Materials and Methods

2.1. Fine-Grained Soils

This research project utilized two fine-grained soils. One of them came from Triassic deposits in Patoka, near Częstochowa, Southern Poland. Because of its characteristic reddish-brown color caused by the presence of iron compounds, it was referred to as red clay (RC). Based on areometric [22] and laser analyzer tests [64], the soil was classified as clay with silt (siCl) per PN-EN ISO 14688-2:2006 [65]. According to a classification consistent with the Unified Soil Classification System (USCS) [66], the soil subjected to testing was clay with high plasticity (CH) and expansive according to Stempkowska’s X-ray diffraction [64]. Table 1 and Table 2 display its basic parameters. Determination of the swelling parameters has been previously described in detail [22]. The swelling pressure test was conducted in an oedometer based on the PN-EN ISO 17892-5 standard [67], while the free-swelling test (FS) was performed according to Holtz and Gibbs [68] (after Head [69]).
The other soil came from the Porcelain Factory in Tułowice, Southern Poland. It exhibits great homogeneity of structure without signs of swelling and was referred to as kaolin (K). Based on areometric tests [70], this soil was classified as clay with silt (siCl) per PN-EN ISO 14688-2:2006 [65]. According to classification consistent with the Unified Soil Classification System (USCS) [66], the kaolin (K) subjected to testing was clay with low plasticity (CL). A complete mineralogical composition was unavailable because the manufacturer maintained its proprietary information. Table 1 and Table 2 give its basic properties.

2.2. Rubber Waste

Two tire waste sizes were used: powder (P) 0.1–1.0 mm (Figure 1a) and granulate (G) 1–5 mm (Figure 1b). Both rubber additives originated from two different local shredding companies and contained negligible amounts of textile parts. Coefficients of uniformity and curvature values were obtained based on grain size curves (effective diameters according to [30,64] are presented in Table 2) and indicated uniform granulated rubber materials (Cu = 3.5 and Cc = 1.2, and Cu = 2.1 and Cc = 0.8, respectively). The specific gravity of rubber was approximately 1.15 g/cm3, which falls within the range of values given by Akbulut et al. [71] and Kalkan [24]. Table 2 outlines the basic parameters of tire waste.

2.3. Red Clay–Rubber (RC-R) and Kaolin–Rubber (K-R) Mixtures

For test purposes, specimens were prepared such that a mixture of clay with rubber waste contained appropriately 5%, 10%, or 25% of powder P or granulate G relative to the total mass. Both clayey soils, (RC) and (K), were dried at 105 °C and later ground in a ball mill. Next, distilled water was added after mixing them with rubber to obtain a mixture with a moisture content of approximately w = wopt = 18% (mass of water against the total of dry soil and rubber mass). It is worth noting that rubber tires have a limited water absorption capacity (maximum 4%), so most of the water in the mixture fell to soils. This means that specimens containing higher rubber amounts also had higher moisture levels in the clays (approximately w = 18.2–23.0%).
Finally, six different mixtures were prepared (Table 3) and marked according to the code adopted in an extensive project by Kowalska et al. [77]:
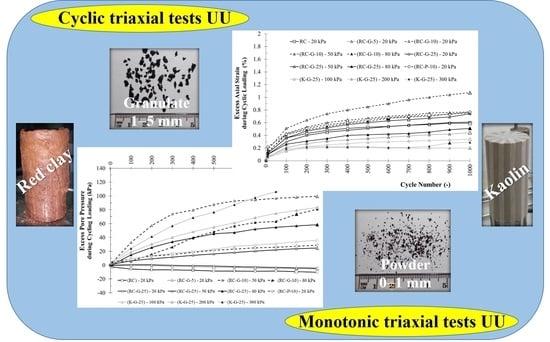
  • RC-G-5 (95% red clay with 5% addition of granulate 1–5 mm);
  • RC-G-10 (90% red clay with 10% addition of granulate 1–5 mm);
  • RC-G-25 (75% red clay with 25% addition of granulate 1–5 mm);
  • RC-P-10 (90% red clay with 10% addition of powder 0–1 mm);
  • K-G-25 (75% kaolin with 25% addition of granulate 1–5 mm);
  • and additionally,
  • RC (100% red clay).
Material prepared this way was laid in three layers in the large Proctor mold (2200 cm3). Each layer was compacted 55 times with the standard Proctor energy of 0.59 J/cm3 following recommendations of Polish Standard PN EN 13286-2 [76]. Finally, the obtained specimen densities were ρ = 1.46–1.94 g/cm3 and the initial void ratios were e0 = 0.82–0.93 (Table 3). Based on work reported by Indraratna et al. [32], the void ratio better represents the compaction efficiency because it eliminates the effect of specific gravity.
Strength characteristics for both pure red clay (RC–100%) and pure rubber waste (powder P–100% or granulate G–100%) based on our own UU monotonic triaxial tests (unconsolidated, undrained) were reported previously [30], as well as strength characteristics for pure kaolin (K–100%) based on our own CIU triaxial tests (isotropically consolidated, undrained) as reported in [70].

3. Test Procedure

This research cycle builds upon Jastrzębska’s low-frequency cyclic triaxial studies on kaolin from Tułowice (CU monotonic/cyclic triaxial tests on soil with constant/variable stress/strain amplitude [53,54,55,56,57,58,70]) and swelling red clay from Patoka (UU cyclic triaxial tests on soil–rubber waste mixtures with constant stress amplitude; [30]). Taking into account the nature of amplitude, these tests were carried out at their constant value. Such a case occurs most often both in nature and in the lab. Examples comprise the action of a storm wave or vibrations caused by an earthquake. Their impacts are irregular, but even simplified, they may be expressed as harmonic vibrations. Vibrations forced by machine operation are similar. Because of instrument capabilities, the starting point conditioning the beginning of the cyclic load action consisted of a current axial strain ε1,unload = 1%, and a corresponding specific moment deviator stress q, against which the amplitude value was determined A = 0.35 q.

3.1. Preparation of Proper Specimens from Red Clay (RC) and a Clay–Rubber Waste Mixture (RC-R and K-R)

Formation of proper specimens from red clay (RC) and clay mixtures with rubber wastes (RC-R and K-R) for triaxial tests proceeded in two ways. Pure clay specimens were cut directly using a string cutter from a block prepared in a Proctor apparatus. For the mixture, a large sample was initially prepared in the Proctor apparatus. Later, the cylindrical forms were pressed into Proctor’s mold (Figure 2). Finally, the specimens were pushed out from these forms and then mounted in a triaxial apparatus. Each of them was 50 mm in diameter and 95 mm high. At least four specimens were prepared for each material. Unfortunately, due to the long duration of cyclic tests (~six weeks for each test) and technical problems during testing, only 14 samples were fully tested (Table 3).

3.2. Test Conditions

Triaxial tests were conducted according to the Polish Standard PN EN ISO 17892-9 [78]. Each sample was saturated, initially flushed with de-aerated water. Thereafter, a high back pressure was applied. Despite the known red clay swelling pressure (Table 1), this test stage was not as simple or as effective as for kaolin. Skempton parameter B values obtained for (RC) and (RC-R) were B = 0.86 and B = 0.79–0.94, respectively. For (K-R), they were >0.95. A significant relationship was observed between the type of rubber waste (G or P), its percentage in the mixture, and the Skempton parameter values: thicker rubber waste and more of it lowered the B values.
When the saturation was complete (back pressure method), the samples were isotropically consolidated. The cyclic triaxial tests were started in undrained conditions (CU) under a constant loading rate (strain controlled) equal to vs = 0.9 mm/h, according to the assumed testing procedure (Table 3). Specimen height changes, shear force values, and pore water pressures were recorded during shearing. Each series of tests was conducted at confining stresses equal to σ3 = 20 kPa, 50 kPa, and 80 kPa (for RC, RC-G, and RC-P) and σ3 = 100 kPa, 200 kPa, and 300 kPa (for K-G). The selection of confining pressure σ3 = 100, 200, 300 kPa for kaolin–rubber waste mixture tests refers to earlier Jastrzębska tests conducted on good, pure kaolin [51,53,56,57], and covered issues related to the behavior of cohesive soils (overconsolidated and normally consolidated) subjected to low-frequency cyclic loads in the range of small deformations, with constant and variable amplitudes. In turn, the choice of confining pressure σ3 = 20, 50, 80 kPa for red clay–rubber waste mixture tests sought to verify whether the expansive soil (weak soil) with the addition of rubber waste could be used for road or railway embankment construction, where the real transferred loads are usually less than 100 kPa. The cyclic load was implemented after application of the monotonic load until a predetermined value of axial strain (ε1,unload = 1.0%) was reached. The cyclic load was conducted at low frequency (f ≈ 0.001 Hz) and low enough to exclude the presence of dynamic phenomena.
A constant deviator stress amplitude was assumed as 35% of the deviator stress value q at the moment of axial strain ε1,unload = 1.0%: Aq = 0.35q (Figure 3). Since the deviator stress at strain ε1,unload = 1.0% was different in each test, the total values of amplitudes differed (Table 3). After cyclic loading, the test continued under a monotonic load until an axial strain of 15% was achieved. In this way, ten tests were conducted with 1000 “unloading–reloading” cycles and two tests with 10,000 “unloading–reloading” cycles. Furthermore, two monotonic shearing tests were executed (Table 3).

4. Results and Discussion

The influence of the rubber addition on red clay (RC) and kaolin (K) was observed at the specimen stage for proper test preparation in a Proctor apparatus. The densities and initial void ratios were: ρ = 1.85 g/cm3 and e0 = 0.87 for (RC); ρ = 1.46–1.68 g/cm3 and e0 = 0.89–0.93 for (RC-G and RC-P); ρ = 1.52 g/cm3 and e0 = 0.82 for (K-G) (Table 3). This proved that the addition of powder or granulate reduced the density of pure red clay (RC) by approximately 9.2% (for G-5). Reductions for (P-10) and (G-10) were 11.4% and 12.4%, respectively, while for 25% rubber addition, the loss was 21.1%. The addition of 25% granulate to pure kaolin reduced its density by approximately 21.7%. These values show that higher rubber waste grain sizes correspond to larger density decreases and void ratio growth that results from the low specific gravity of rubber itself and reduced compaction efficiency due to the elasticity of rubber particles and their energy absorption capacity. This relationship agrees with results presented by most other researchers, e.g., Yadav and Tiwari [79] and Indraratna et al. [32].
The effect of soil type (swelling or non-swelling), rubber waste type (granulate or powder), and its percentage in the mixture (5%, 10%, or 25%) on the Skempton parameter value B during back pressure was mentioned in Section 3.2. The authors of that study are not aware of publications with similar comparisons.
Results of CU cyclic triaxial tests are presented in the form of:
  • axial strain variation Δε1,cyc depending on the cycle number N (Figure 4 and Figure 5);
  • pore pressure variation Δu depending on the axial strain ε1 (Figure 6);
  • pore pressure variation Δucyc depending on the cycle number N (Figure 7 and Figure 8);
  • deviator stress q versus axial strain ε1 (Figure 9);
  • deviator stress at failure qmax versus powder (P) or granulate (G) content (Figure 10);
  • strain at failure ε1,f versus confining stress σ3 (Figure 11).
Figure 4 and Figure 6 present these results on semi-logarithmic scales while Figure 5 and Figure 7 show a linear scale. Due to the high cycle numbers and obvious higher changes in axial strains and pore pressures during the first ten cycles, Figure 5a and Figure 7a show the data for those fragments on a larger scale.
For red clay (RC) and its mixtures with rubber waste (RC-R), a full quantitative analysis of the results refers to all tests performed with confining pressure σ3 = 20 kPa (RC, RC-G-5, RC-G-10, RC-G-25, and RC-P-10). Other discussions are only qualitative in nature, including kaolin.

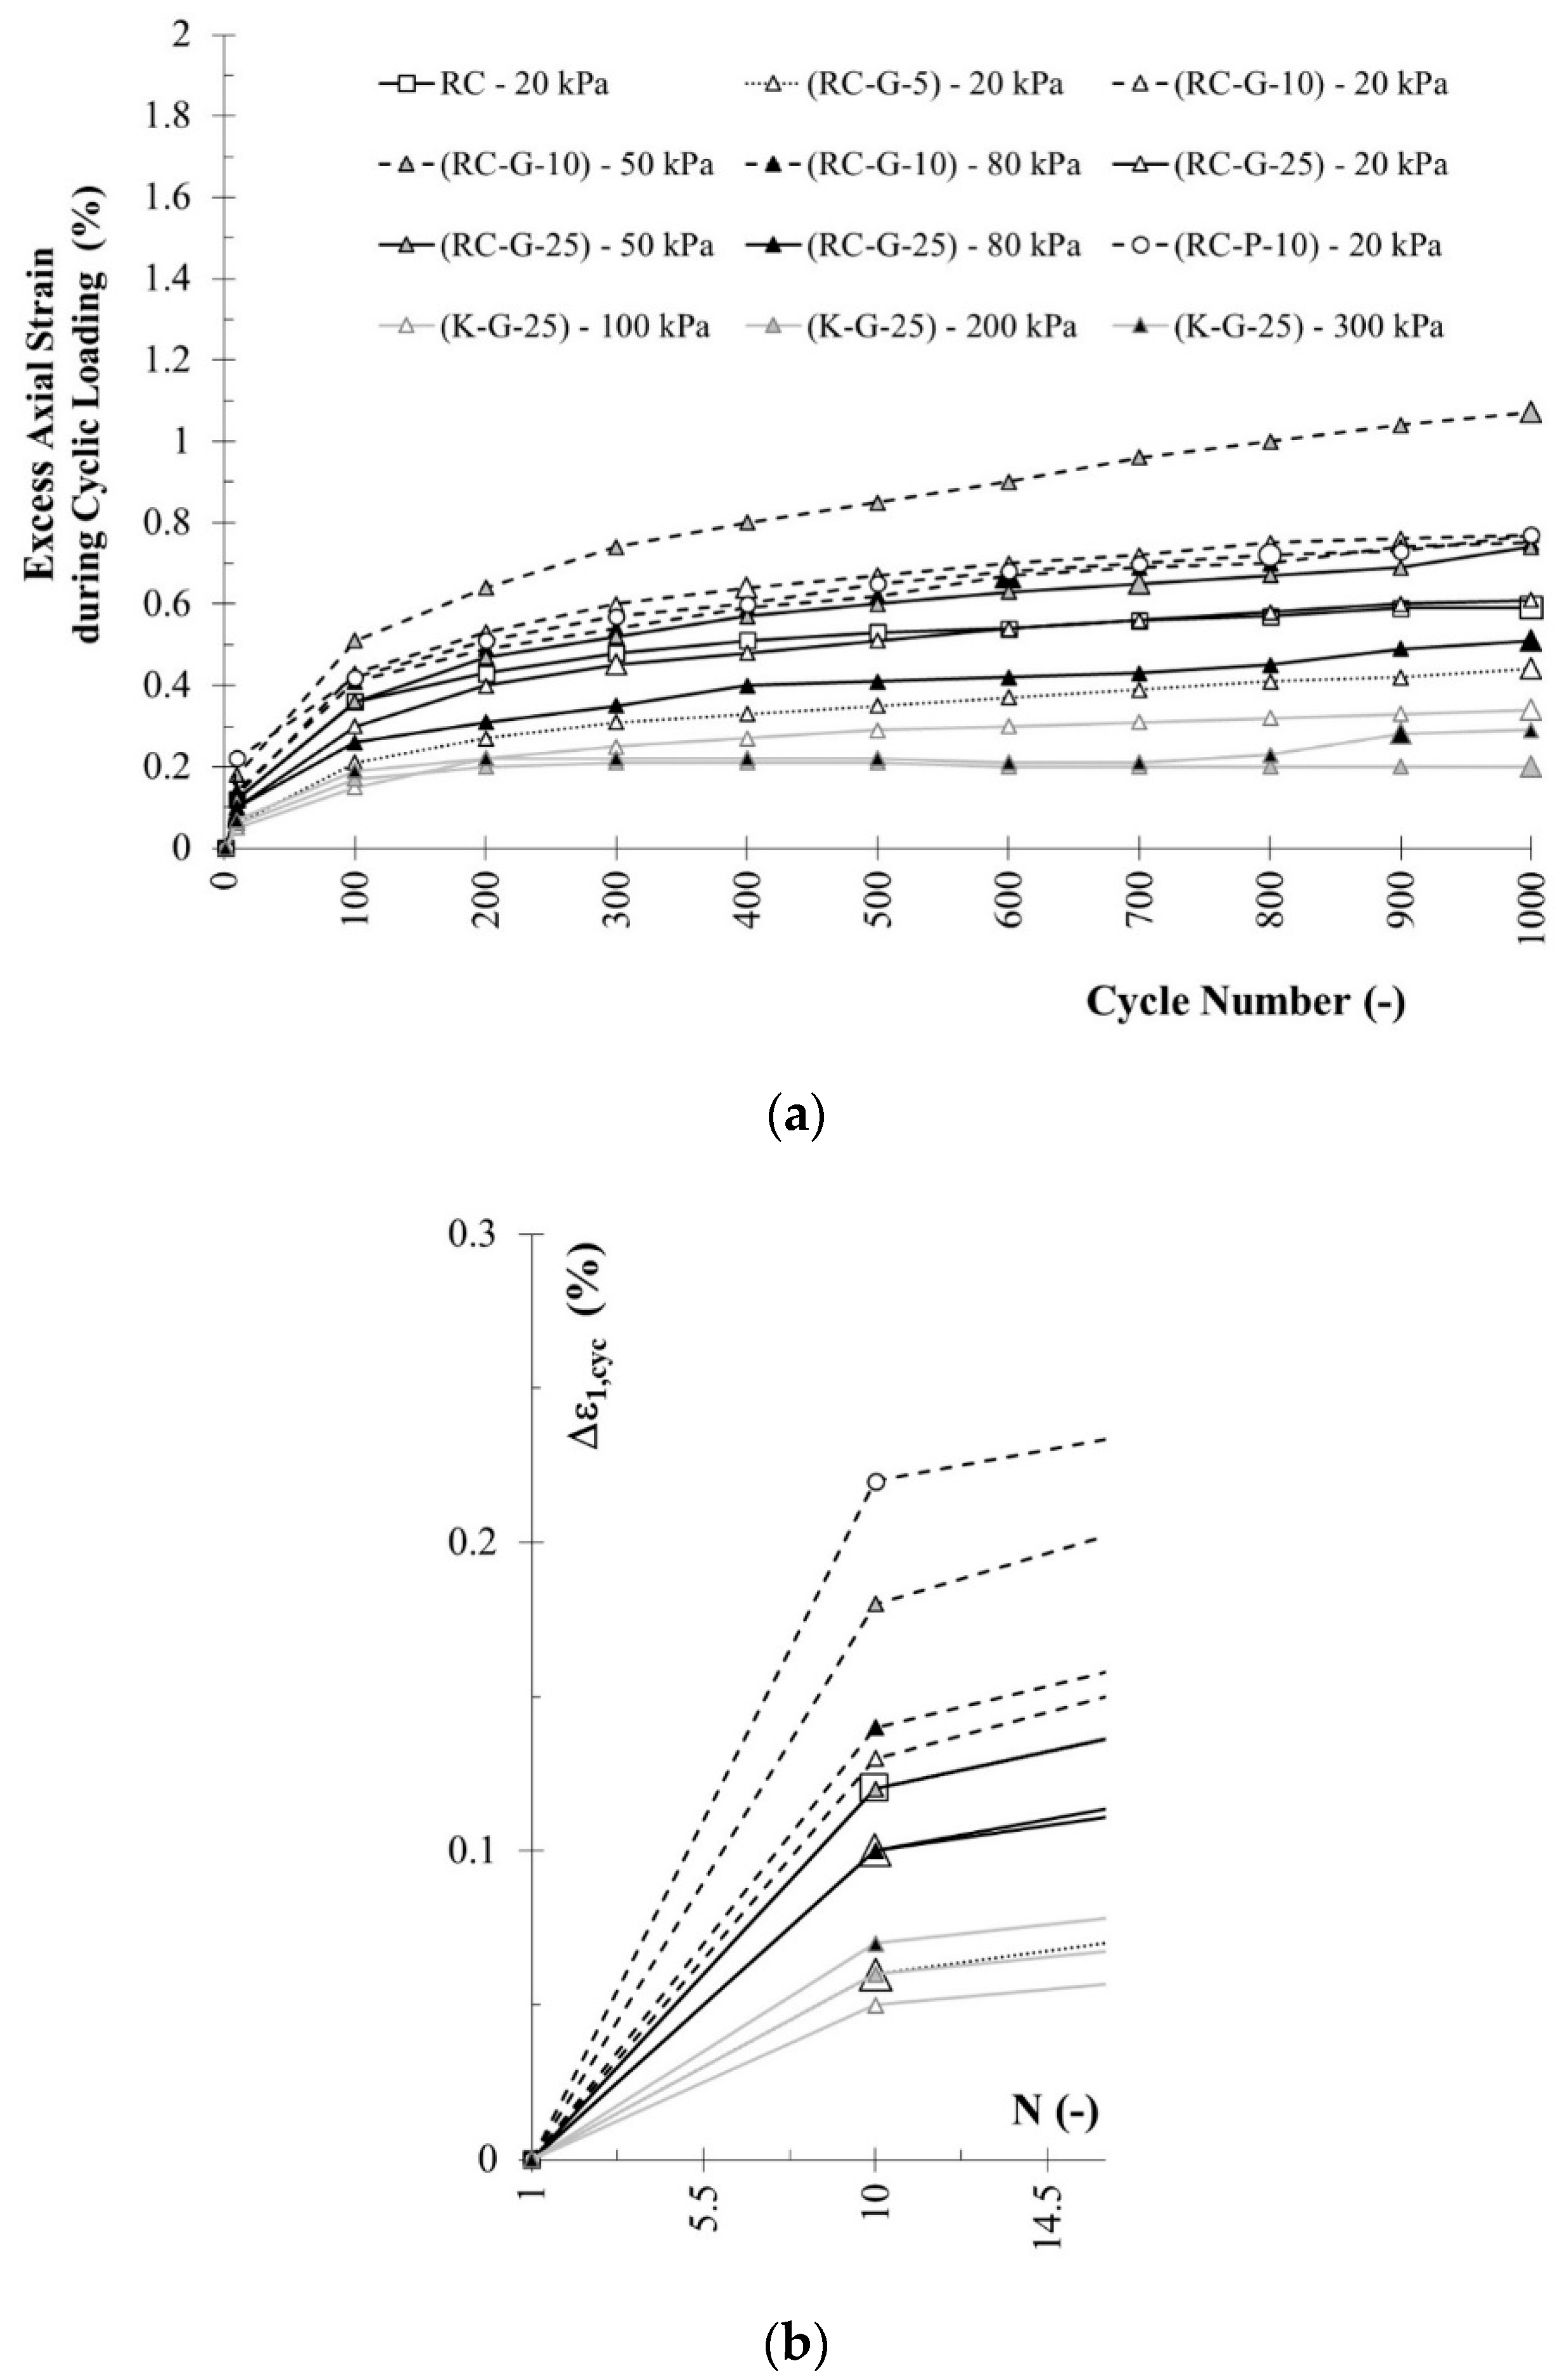
4.1. The Effect of Rubber Waste on the Axial Strain during Cyclic Loading

An analysis of the results showed a clear influence of rubber additives on the axial strain increase ε1,cyc of soil–rubber mixtures during cyclic loading (see Table 4 and Figure 4 and Figure 5). Based on Figure 4, we concluded that the weakening of the characteristics during cyclic loading had a logarithmic dependence on the cycle number; these results were in accordance with results from Głuchowski and Sas [80]. Addition of 25% granulate did not influence Δε1,cyc after 1000 cycles (RC-20 kPa versus RC-G25-20 kPa). The addition of 10% granulate (RC-G10-20 kPa) or 10% powder (RC-P10-20 kPa) to pure red clay (RC-20 kPa) caused an axial strain increase after 1000 cycles by ~30%. On the other hand, the addition of 5% granulate (RC-G5-20 kPa) reduced the axial strain increase by 25% relative to (RC-20 kPa).
Other test results (for σ3 = 50 and 60 kPa) showed that the addition of 10% granulate (RC-G-10) or powder (RC-P-10) increased the strain during cyclic loading (~46% and 31%, respectively) relative to the addition of 25% granulate (strain increase of ~5%). Such a result in monotonic tests, where higher rubber levels increased the compressibility, would be surprising. In our study, a slight specimen overconsolidation was due to cyclic loading. Additional rubber strengthened the cohesive soil–rubber mixture. This was also observed by Hong et al. [81] and Rios et al. [82] as an indication of the viscoelastic influence of rubber. This was why strain accumulation increased for specimens containing fewer rubber grains. It is worth mentioning that Soroush and Soltani-Jigheh [83] proposed an apparent overconsolidation ratio, which was a direct consequence of cyclic loading and a key factor that significantly influenced the soil behavior during post-cyclic shearing. This issue is still being intensively investigated.
For the kaolin–granulate mixture (K-G-25), it was observed that average axial strain increases during 1000 cycles were half as large as the (RC-G-25) mixture and approximately a third as large as (RC-G-10) and (RC-P-10). Of significance was that kaolin tests were conducted at much higher confining pressures (σ3 = 100, 200, and 300 kPa) than tests with red clay (σ3 = 20, 50, and 80 kPa). This conclusion is also true considering that (RC-R) research for σ3 = 80 kPa only, where the increases in axial strain were ~1.5–2 times higher than (K-G) for σ3 = 100 kPa. Expansive red clay–rubber mixtures may require the use of higher confining pressures to obtain lower axial strain gains, which will be the aim of future research.
It is worth noting that compared to (RC), the (RC-P-10) mixture showed an axial strain increase of 30% for 1000 cycles and nearly 100% for 10,000 cycles. This behavior excludes the use of powder as an additive to strengthen swelling soils subjected to long-term cyclic loading.

4.2. The Effect of Rubber Waste on the Pore Pressure during Cyclic Loading

As can be seen, the behavior of pore pressure ucyc in materials under cycling loading is interesting. The results of all tests are specified in Table 4 and Figure 6, Figure 7 and Figure 8.
The rc5-1 (RC-G-10-20 kPa) test was excluded from analysis due to pore pressure sensor failure. It is worth pointing out that pore pressure changes depend on whether the soil is overconsolidated or normally consolidated. In this study, the soil–rubber mixtures were prepared in the Proctor apparatus by tamping with some energy and caused a slight overconsolidation. The material may partially loosen during the cutting of proper samples and their installation in the triaxial apparatus (more loosening means a higher rubber waste content). During the triaxial tests, when the confining pressure did not balance the Proctor energy, the soil–rubber mixtures’ behavior resembled overconsolidation soils that differ from the normally consolidated soils. Soroush and Soltani-Jigheh [83] reported a similar effect of slightly overconsolidated samples due to their preparation method. In this study, such an effect was observed only with a low confining pressure σ3 = 20 kPa (Figure 6, Figure 7 and Figure 8) for all mixtures (RC and RC-G) except one. The RC-P mixture was the notable exception as the initial pore pressure significantly increased during cycle loading (270–360% greater than RC).
Such behavior was also observed by Głuchowski et al. [84] and Kucharczyk et al. [85] on compacted clays in CU cyclic triaxial tests. The moment of starting the cyclic load operation (after monotonic loading) is important, as mentioned by Matasovic and Vucetic [50] and Kalinowska and Jastrzębska [52] and noted in the Introduction.
Many researchers confirm that for normally consolidated clays and a given number of cycles, lower frequencies generated larger shear strains and excess pore pressures [86,87]. The frequency used in this study was very low, f = 0.001 Hz (and similar to work reported by Hanna and Javed on sensitive Champlain clay [88]). According to Matsui et al. [87], larger strains due to lower frequencies occurred primarily as a result of loading time differences due to the viscous behavior of the soil. Higher cyclic shear stress levels rapidly increased the excess pore pressure (after ten loading–unloading cycles) relative to the number of cycles (Figure 7 and Figure 8). At low levels of cyclic shear stress, the excess pore pressure increased gradually with the number of cycles. Negative excess pore pressures were measured for overconsolidated specimens at the beginning of cyclic loading; the pressure subsequently increased and eventually became positive ([87]). This behavior was observed (Figure 7 and Figure 8) for pure red clay and (RC-G) mixtures tested under confining pressure of 20 kPa (decrease in pore pressure during cyclic loading). In turn, the behavior of the (RC-P) mixture at 20 kPa differed (an increase in the pore pressure from the beginning of the cyclic loading operation), which proved the significance of the rubber waste particle sizes. In other cases (confining pressures greater than 20 kPa), a positive increase in pore pressure under cyclic loading was observed for all mixtures. However, those results showed that the addition of 25% of the granulate (RC-G-25) to the swelling soil (RC) caused lower increases in pore pressure relative to the addition of 10% of the granulate (RC-G-10): for σ3 = 50 and 80 kPa, Δucyc = 25 kPa and 59 kPa (RC-G-25), Δucyc = 99 kPa and 81 kPa (RC-G-10), respectively.
Figure 6 shows that pore pressures induced during post-cyclic tests surpassed pore pressures induced during monotonic tests. The differences were significant for K-G-25 (cyclic versus monotonic, under σ3 = 300 kPa), clearly visible for RC-G-25 (monotonic, σ3 = 20 kPa) versus RC-P-10 (cyclic, σ3 = 20 kPa), and almost negligible for RC-G-25 (cyclic versus monotonic, under σ3 = 20 kPa). These results differ from conclusions conveyed by Soroush and Soltani-Jigheh [83], who reported significant pore pressure decreases after cycle loading relative to monotonic tests. However, their work focused on clay–sand and clay–gravel mixtures performed with an axial strain amplitude (vs. this study, which used a deviator stress amplitude).
Pore pressure generation in cohesive soils subjected to cyclic loading was clearly affected by the number of cycles, duration of cyclic loading, the load frequency, and the applied cyclic stress (e.g., [89]), as well as the type and particle size of the rubber waste.

4.3. Analysis of Shear Strength Test Results

Based on the final test results (unsatisfactory number of successful tests), in terms of strength parameters, analyses of soil–rubber mixtures behaviors under cycling loads were limited to a discussion of the stress deviator q (Figure 9 and Figure 10) and failure strain ε1,f (Figure 11) development. The shear characteristics presented in Figure 9 indicate that rubber addition and cycling loading affected the strengths of the tested mixtures. Because the three plots presented in Figure 9b overlap, the axial strain range that corresponded to cyclic loading is magnified and shown in the box. For the sake of the graph’s clarity, only loops with the numbers 1–10, 50, 150, 200, 250, 300, etc., up to 1000 every 50, are plotted on the curves.
The effect of strengthening was observed only for monotonic tests under σ3 = 300 kPa for kaolin with 25% granulate (K-G-25) as compared to pure kaolin, Δqmax = +65% (Figure 9b and Figure 10). The same mixture (K-G-25-300 kPa) softened by Δqmax = (–18%) in the post-cyclic stage. For red clay–rubber (RC-R) mixtures (Figure 9a and Figure 10), post-cyclic strengthening was not observed except for the (RC-G-10) mixture, which showed an increase of Δqmax = + 50% at the lowest confining pressure σ3 = 20 kPa. In relation to (RC-G) during post-cyclic monotonic load, increasing the content of granulates from 10% (G) to 25% (G) softened the mixtures in the following ways: for (RC-G-25-50 kPa), Δqmax = (−76%); for (RC-G-25-80 kPa), Δqmax = (−128%). Jastrzębska’s UU monotonic triaxial tests for (RC-G) under confining pressure = 50 kPa also confirmed a gradual decrease in the strength of the mixture as the granulate content increased from 0 to 5%, 10%, and 25% [30], and they were compatible with the behavior observed in this study for (RC-G-25-50 kPa) and (RC-G-10-50 kPa). The 10% granulate addition to red clay (RC-G-10) was clearly more favorable in terms of the mixture strength than the addition of 10% powder (RC-P-10) at a confining pressure of 20 kPa. The maximum deviator stress (Δqmax) was 45% higher for (RC-G-10) as compared to (RC-P-10). Admittedly, this observation was based on only one point (Figure 10) representing a mixture of red clay with 10% powder, but it indicated a trend in the behavior of this mixture. Certainly, the results of (RC-P-10) mixture cyclic tests must be verified by a greater number of tests at different confining pressures.
Strengthening was observed only for monotonic tests under σ3 = 300 kPa for kaolin mixtures containing 25% granulate (K-G-25) as compared to pure kaolin (Δqmax = +65%; Figure 9b and Figure 10. The same mixture (K-G-25-300 kPa) weakened by 18% under cyclic loading. For red clay–rubber (RC-R) mixtures, the lack of strengthening was most likely related to specimen preparation, which was compacted in a Proctor apparatus at the optimum moisture content. Mixtures prepared in this way may come loose after compaction relative to pure soil due to the energy-absorbing capacity of rubber [32,39,40,82]. Moreover, the addition of rubber waste to the cohesive soil caused a density decrease in the mixture (Table 3). These facts help to explain the overall decrease in shear strength in the soil–rubber waste mixtures relative to the soil itself. Furthermore, Figure 9 and Figure 10 show that maximum failure stress was achieved at different axial strains. For red clay and all mixtures, higher deformations were obtained for the maximum deviator stress with increasing confining pressure. This can be explained by the fact that higher confining pressures clearly reduced swelling. Soltani et al. [25,26] also reported a reduction in the swelling pressure based primarily on rubber size and shape, with coarser rubber sizes and more elongated forms being more favorable. Additionally, examples of unfavorable effects of tire-derived aggregate products with finer granulation (material marked with TDA-F [90] with a granulation similar to the powder (P) tested in this study) on soil compressive strength based on unconfined compression tests were reported by Soltani et al. [90] and confirmed the above observations. However, in this study, the swelling was not the most important. This study initially analyzed the influence of cyclic loading on soil–rubber mixtures, which included swelling soil (red clay). Clearly, these effects differed for kaolin and red clay. Because both soils were tested at different confining pressure levels, these conclusions are inconclusive. The choice of low confining pressures in the red clay studies resulted from the need to use this material for the construction of road embankments.
Due to the insufficient number of tests (equipment failure during long-term tests), it was difficult to evaluate the influence of the rubber additive (its size and content) and the effect of cyclic loading on the internal friction angle and cohesion. For this reason, such an analysis was omitted but will be addressed in the future after conducting additional tests. However, referring to monotonic tests from other research groups, general trends in this area were observed. Cohesion decreased as the particle size and the proportion of rubber in the mixture increased (this is a common opinion; see, e.g., [29]). This is due to the decreasing domination of electromagnetic forces between clay particles, which results in the separation of soil particles due to increasing levels of rubber waste. However, some groups [33] report an increase in cohesion. In contrast, the internal friction angle was affected inconsistently by rubber waste levels in mixtures. Some researchers reported a gradual increase in the internal friction [7], others reported a gradual decrease [33], and still others described a random variation [37]—the growth of internal friction to a certain rubber content below which its reduction was observed [29].
The behaviors described above concerning cohesion and friction angles were related to the monotonic load cases. The soil behavior under cyclic loading depended on factors such as amplitude, frequency, overconsolidation ratio, and loading rate.

4.4. The Effect of Rubber Waste on Deformability

Figure 11 presents the rubber waste influence on the plasticity of red clay and kaolin. Tajdini et al. [29] (and many other researchers) refer to this property as ductility, a term assigned to materials such as metals, steel, concrete, and, occasionally, rocks. Recently, some researchers have applied this term to cemented soils as well as soil–rubber waste mixtures. The soil–rubber waste mixtures (as with natural soils) are sensitive to water content, consolidation history, and their mineralogical composition; because of this, they are subject to the laws of soil mechanics that utilize plasticity, not ductility. For this reason, we chose to use this term even though ductility describes rubber. As rubber is a minor component in the mixture relative to the soil, in our opinion, such soil–rubber mixtures have more soil-like properties.
The number of tests performed did not allow for a reliable analysis of plasticity. Nevertheless, some trends were observed. The addition of 25% granulate and the influence of cyclic load did not change the plasticity of kaolin. Both in Jastrzębska’s CU monotonic triaxial tests of pure kaolin [51] and in the (K-G-25) mixture (from this study), the failure strain was 15%.
In turn, for red clay–rubber mixtures (RC-R), the failure strain ε1,f increased with increasing granulate levels (from 10% to 25%) and increasing rubber waste particle size in a post-cyclic state under a low confining pressure of 20 kPa. For example, when σ3 was 20 kPa, Δε1,f values for RC-P-10, RC-G-10, and RC-G-25 were 3%, 7.5%, and 13%, respectively. On the other hand, 5% granulate content (RC-G-5, 20 kPa) caused a large deformation increase (ε1,f = 15%). This behavior suggested that 10% granulate content addition to red clay is a limit value above and below which different behaviors were observed during cyclic tests. Rios et al. [82] made similar observations when analyzing the mechanical properties (including stiffness degradation) of sand from the Coimbra region and red clay from Patoka with the addition of ground rubber (0.1–0.8 mm) in various proportions (0, 9%, 33%, and 100% by weight) subjected to cyclic loading. In general, they found that 9% of the rubber content caused different behaviors in sandy and clayey specimens. In this study, the behaviors of (RC-G-25) and (RC-G-10) were reversed relative to a confining pressure > 20 kPa. For (RC-G-25) at σ3 values of 50 kPa and 80 kPa, ε1,f values were 12%; however, for (RC-G-10) and σ3 values of 50 and 80 kPa, ε1,f levels were 15% and 5%, respectively.
These CU cyclic triaxial test results differed from the results reported by Jastrzębska et al. (UU triaxial tests, [30]). It is generally known that soil–rubber waste mixtures are more affected by cycling loading due to factors such as amplitude, frequency, and overconsolidation ratio than a monotonic load. The variation in plasticity observed requires further research. However, the effects of rubber on the stiffness of the composite were clearly visible: for the soil–rubber mixtures, the elastic modulus decreased with increasing amounts of rubber, and this was attributed to the resilience of the rubber particles. In addition, it was evident the reduction rate was lower for the soils mixed with the finer rubber waste due to the additional interlock between the fine rubber particles and clay particles. This led to a more homogeneous mixture with a higher elastic modulus [29] and is an important consideration in the engineering design. As rubber particles are more flexible than soil particles, mixtures of rubber waste and soil can be more plastic than soil itself (Figure 11: ε1,f (RC-20 kPa)) = 2% < ε1,f (RC-G-25-20kPa) = 13%). This behavior is due to a greater capacity to absorb the deformation energy due to the presence of rubber. Many research groups actively study this topic, all of whom account for the mechanical interlocking of soil particles and rubber as well as the frictional resistance generated at the soil–rubber interface [34] and the energy-absorbing mechanism [39,82].

5. Conclusions

In this study, CU cyclic triaxial tests were performed at a constant stress amplitude and low frequency (f = 0.001 Hz) on two soils—expansive red clay (siCl/CH) and non-expansive kaolin (siCl/CL)—as well as their mixtures with various mass percentages of powder (0–1 mm) or granulate (1–5 mm). The effect of the rubber additive and the number of load cycles (N = 1000 or 10,000) on the development of pore pressure, axial strain during cyclic loading, and the maximum stress deviator value were investigated. Due to the limited number of samples (14) and the lack of repeatability of tests under the same conditions, the presented conclusions are mainly qualitative in nature and indicate certain trends in the behavior of soil–rubber mixtures. The main conclusions drawn from this research are as follows:
  • Cyclic loading
    • (low confining pressure σ3 = 20 kPa and lightly overconsolidated specimens due to its preparation using Proctor’s method)—The addition of 25% granulate to expansive red clay (RC-G-25) does not influence the value Δε1,cyc after 1000 cycles under low confining pressure σ3 = 20 kPa. Meanwhile, the addition of 10% granulate (RC-G-10) or 10% powder (RC-P-10-20 kPa) caused an axial strain increase of ~30% after 1000 cycles. On the other hand, the addition of 5% granulate (RC-G-5) reduced the axial strain increase by 25% relative to pure clay (RC).
    • (confining pressures σ3 = 50 and 80 kPa)—Addition of 10% granulate (RC-G-10) or powder (RC-P-10) to swelling red clay caused higher strain increases during cyclic loading (~46% and 31%, respectively) than the addition of 25% granulate (a strain increase of ~5%).
    • (confining pressure σ3 = 100 kPa)—Axial strain increases for kaolin–granulate mixtures (K-G-25) were approximately 1.5–2 times lower than for (RC-R).
    • Care should be taken when using a red clay–powder mixture because after adding 10% powder (RC-P-10), the axial strain increased by 30% over 1000 cycles and by nearly 100% for 10,000 cycles relative to pure red clay (RC).
    • (confining pressure σ3 = 20 kPa)—The negative excess pore pressure for pure red clay (RC) and (RC-G) mixtures displayed behavior opposite to that of (RC-P-10) mixtures—the pore pressure gradually increased from the beginning of the cyclic loading operation.
    • (confining pressures σ3 = 50 and 80 kPa)—Addition of 25% of the granulate (RC-G-25) to the swelling soil (RC) caused smaller increases in pore pressure (Δucyc = 25 kPa and 59 kPa, respectively) than for 10% of the granulate (RC-G-10): Δucyc = 99 kPa and 81 kPa, respectively.
    • It is worth noting that the characteristic decrease in pore pressure (after activation of cyclic loading) at a low confining pressure σ3 = 20 kPa was due to specimen preparation (in the future, from the method of preparing an embankment, for example). The preliminary compaction of a soil–rubber mixture with Proctor’s energy caused a light overconsolidation of the material. This is favorable for reducing pore pressure increases.
  • Post-cyclic loading
    8.
    (cyclic versus monotonic stage, confining pressure σ3 = 20 kPa)—The pore pressures induced during the post-cyclic tests were higher than pore pressures induced during monotonic tests (and applied to (RC-G-25) and (RC-P-10)).
    9.
    Monotonic test and post-cyclic stage (confining pressure σ3 = 300 kPa)—A strengthening of kaolin–granulate mixture (K-G-25) by Δqmax = +65% and its softening by Δqmax = −18% in the post-cyclic state (as compared to pure kaolin (K)).
    10.
    The lack of the strengthening of (RC-R) mixtures, except for (RC-G-10) under σ3 = 20 kPa—Δqmax = 18%. The softening in strength of (RC-G-25) by Δqmax = (−76%) for σ’3 = 50 kPa and by (-128%) at a σ3 of 80 kPa.
    11.
    (confining pressure σ3 = 20 kPa)—The plasticity growth (called ductility in the literature) when increasing the granulate (G) levels (from 10% to 25%) and when increasing the rubber waste particle size (granulate (G) or powder (P)).
    12.
    (confining pressures σ3 = 50 and 80 kPa)—The plasticity behaviors of (RC-G-25) and (RC-G-10) were reversed relative to a confining pressure lower than 20 kPa. For (RC-G-25) and σ3 values of 50 kPa and 80 kPa, the ε1,f was 12%. For (RC-G-10) and a σ3 of 50 kPa, the ε1,f was 15% but only 5% for a σ3 of 80 kPa. These results would benefit from additional studies on more specimens.
These conclusions indicated that the use of soil–rubber mixtures, especially with expansive soils, should be treated with caution for cyclic loading operations. The combined analysis of low-frequency cyclic loads at a constant stress amplitude with cohesive soils, including expansive soil and the rubber waste, may be adopted for predicting the behavior of soil–rubber waste mixtures during cycling and post-cyclic loading. The authors plan to develop and continue this research project so that kaolin and red clay could be utilized in geoengineering structures such as road and railway embankments.

Author Contributions

Conceptualization, methodology, investigation, validation, research tests, formal analysis, writing—original draft preparation, M.J.; data curation, software, K.T.; visualization, writing—review and editing, M.J. and K.T.; All authors have read and agreed to the published version of the manuscript.

Funding

This research received no external funding. The APC was partially funded by the Department of Graphics, Computer Vision and Digital Systems, Silesian University of Technology (Gliwice, Poland) (under state research project Rau6, 2021).

Data Availability Statement

The data presented in this study are available on request from the corresponding author. The data are not publicly available due to ongoing research.

Acknowledgments

The authors would like to express their gratitude to the representatives of the tire shredding companies ORZEŁ S.A. and ATB TRUCK S.A., who delivered the rubber powder and granulate for this study free of charge.

Conflicts of Interest

The authors declare no conflict of interest. The funders had no role in the design of the study; in the collection, analyses, or interpretation of data; in the writing of the manuscript, or in the decision to publish the results.

References

  1. Kalantari, B. Foundations on Expansive Soils: A Review. Res. J. Appl. Sci. Eng. Technol. 2012, 4, 3231–3237. [Google Scholar]
  2. World Business Council for Sustainable Development Home Page (WBCSD). Available online: https://docs.wbcsd.org/2008/08/EndOfLifeTires-FullReport.pdf (accessed on 10 August 2008).
  3. Kliszczewicz, B.; Kowalska, M. Numerical Study of the Use of Tyre-Derived-Aggregate (TDA) as the Backfill Above Flexible PVC Pipeline. In Proceedings of the IOP Conference Series: Materials Science and Engineering, Prague, Czech Republic, 15–19 June 2020; Volume 960, pp. 32–44. [Google Scholar] [CrossRef]
  4. Gromysz, K.; Kowalska, M. Reduction of Vibrations Applied on Structures-Results of Chamber Tests with the Use of Tire Derived Aggregate. Procedia Eng. 2017, 193, 305–312. [Google Scholar] [CrossRef]
  5. Jurczuk, J. The Application of Rubber Shreds as a Light Filling in Road Embankments; Mostostal Warszawa, S.A., Ed.; Biuro Analiz i Rozwoju: Warsaw, Poland, 2011. [Google Scholar]
  6. Kowalska, M.; Chmielewski, M. Mechanical Parameters of Rubber-Sand Mixtures for Numerical Analysis of a Road Em-bankment. In Proceedings of the IOP Conference Series, Materials Science and Engineering, Beijing, China, 24–27 October 2017. [Google Scholar]
  7. Signes, C.H.; Garzón-Roca, J.; Fernández, P.M.; Garrido de la Torre, M.E.; Insa Franco, R. Swelling Potential Reduction of Spanish Argillaceous Marlstone Facies Tap Soil Through the Addition of Crumb Rubber Particles from Scrap Tires. Appl. Clay Sci. 2016, 132, 768–773. [Google Scholar] [CrossRef]
  8. Sybilski, D. The Application of Rubber Waste in Road Construction. Prz. Bud. 2009, 5, 37–44. [Google Scholar]
  9. Yoon, S.; Prezzi, M.; Siddiki, N.Z.; Kim, B. Construction of a Test Embankment using a Sand-Tire Shred Mixture as Fill Material. Waste Manag. 2006, 26, 1033–1044. [Google Scholar] [CrossRef]
  10. Karacasu, M.; Okur, V.; Er, A. A Study on the Rheological Properties of Recycled Rubber-Modified Asphalt Mixtures. Sci. World J. 2015, 2015, 1–9. [Google Scholar] [CrossRef] [Green Version]
  11. Lo Presti, D. Recycled Tire Rubber Modified Bitumens for Road Asphalt Mixtures: A Literature Review. Constr. Build. Mater. 2013, 49, 863–881. [Google Scholar] [CrossRef]
  12. Xu, X.; Lo, S.H.; Tsang, H.H.; Sheikh, M.N. Earthquake Protection by Tire—Soil Mixtures: Numerical Study. In Proceedings of the New Zealand Society for Earthquake Engineering (NZSEE) Conference, Wellington, New Zealand, 3–5 April 2009. [Google Scholar]
  13. Kowalska, M. Compactness of Scrap Tyre Rubber Aggregates in Standard Proctor Test. Procedia Eng. 2016, 161, 975–979. [Google Scholar] [CrossRef] [Green Version]
  14. Ramirez, G.G.D.; Casagrande, M.D.T.; Folle, D.; Pereira, A.; Paulon, V.A. Behavior of Granular Rubber Waste Tire Reinforced Soil for Application in Geosynthetic Reinforced Soil Wall. Rev. IBRACON Estrut. Mater. 2015, 8, 567–576. [Google Scholar] [CrossRef]
  15. Balasooriya, M.G.B.T.; Kumari, W.G.S.D.; Mallawarachchi, M.A.S.N.; Udakara, D.D.S. Study the Effect of Waste Rubber Materials on Shear Strength of Residual Soils. In Proceedings of the International Conference on Sustainable Built Environment (ICSBE-2012), Ipoh, Malaysia, 23–24 April 2012. [Google Scholar]
  16. Carraro, J.A.H.; Budagher, E.; Badanagki, M.; Kang, J.B. Sustainable Stabilization of Sulfate-Bearing Soil with Expansive Soil-Rubber Technology; Technical Report No. CDOT-2013-2; Colorado Department of Transportation: Washington, DC, USA, 2013.
  17. Cetin, H.; Fener, M.; Gunaydin, O. Geotechnical Properties of Tire-Cohesive Clayey Soil Mixtures as a Fill Material. Eng. Geol. 2006, 88, 110–120. [Google Scholar] [CrossRef]
  18. Daud, N.; Yusoff, Z.; Muhammed, A. Ground Improvement of Problematic Soft Soils Using Shredded Waste Tire. In Proceedings of the 6th Jordanian Int. Civil Engineering Conference (JICEC06), Amman, Jordan, 10–12 March 2015. [Google Scholar]
  19. Soltani, A.; Deng, A.; Taheri, A.; Sridharan, A. Consistency Limits and Compaction Characteristics of Clay Soils Containing Rubber Waste. Proc. Inst. Civ. Eng. Geotech. Eng. 2019, 172, 174–188. [Google Scholar] [CrossRef] [Green Version]
  20. Srivastava, A.; Pandey, S.; Rana, J. Use of Shredded Tyre Waste in Improving the Geotechnical Properties of Expansive Black Cotton Soil. Géoméch. Geoengin. 2014, 9, 303–311. [Google Scholar] [CrossRef]
  21. Akbarimehr, D.; Aflaki, E. An Experimental Study on the Effect of Tire Powder on the Geotechnical Properties of Clay Soils. Civ. Eng. J. 2018, 4, 594. [Google Scholar] [CrossRef] [Green Version]
  22. Kowalska, M.; Jastrzębska, M. Swelling of Cohesive Soil with Rubber Granulate. In Analizy i Doświadczenia w Geoinżynierii; Bzówka, J., Łupieżowiec, M., Eds.; Politechniki Śląskiej: Gliwice, Poland, 2017; Volume 651, pp. 261–270. ISBN 978-8-37-880446-8. [Google Scholar]
  23. Kowalska, M.; Ptaszek, M. Influence of Rubber and Mineral Admixtures on Selected Swelling Properties of Red Clay. In Proceedings of the 3rd World Multidisciplinary Civil Engineering, Architecture, Urban Planning Symposium (WMCAUS 2018), Prague, Czech Republic, 18–22 June 2018. [Google Scholar] [CrossRef]
  24. Kalkan, E. Preparation of Scrap Tire Rubber Fiber–Silica Fume Mixtures for Modification of Clayey Soils. Appl. Clay Sci. 2013, 80–81, 117–125. [Google Scholar] [CrossRef]
  25. Soltani, A.; Deng, A.; Taheri, A.; Mirzababaei, M.; Vanapalli, S.K. Deng Swell–Shrink Behavior of Rubberized Expansive Clays During Alternate Wetting and Drying. Minerals 2019, 9, 224. [Google Scholar] [CrossRef] [Green Version]
  26. Soltani, A.; Deng, A.; Taheri, A.; Sridharan, A. Swell–Shrink–Consolidation Behavior of Rubber–Reinforced Expansive Soils. Geotech. Test. J. 2019, 42, 761–788. [Google Scholar] [CrossRef]
  27. Soltani, A.; Deng, A.; Taheri, A.; Mirzababaei, M. Rubber Powder–Polymer Combined Stabilization of South Australian Expansive Soils. Geosynth. Int. 2018, 25, 304–321. [Google Scholar] [CrossRef]
  28. Tafti, M.F.; Emadi, M.Z. Impact of Using Recycled Tire Fibers on the Mechanical Properties of Clayey and Sandy Soils. Elec-tron. J. Geotech. Eng. 2016, 21, 7113–7125. [Google Scholar]
  29. Tajdini, M.; Nabizadeh, A.; Taherkhani, H.; Zartaj, H. Effect of Added Waste Rubber on the Properties and Failure Mode of Kaolinite Clay. Int. J. Civ. Eng. 2016, 15, 949–958. [Google Scholar] [CrossRef]
  30. Jastrzębska, M. Strength Characteristics of Clay-Rubber Waste Mixtures in UU Triaxial Tests. Geosciences 2019, 9, 352. [Google Scholar] [CrossRef] [Green Version]
  31. Yadav, J.S.; Tiwari, S.K. The Impact of End-of-Life Tires on the Mechanical Properties of Fine-Grained Soil: A Review. Environ. Dev. Sustain. 2019, 21, 485–568. [Google Scholar] [CrossRef]
  32. Indraratna, B.; Rujikiatkamjorn, C.; Tawk, M.; Heitor, A. Compaction, Degradation and Deformation Characteristics of an Energy Absorbing Matrix. Transp. Geotech. 2019, 19, 74–83. [Google Scholar] [CrossRef]
  33. Özkul, Z.H.; Baykal, G. Shear Behavior of Compacted Rubber Fiber-Clay Composite in Drained and Undrained Loading. J. Geotech. Geoenviron. Eng. 2007, 133, 767–781. [Google Scholar] [CrossRef]
  34. Soltani, A.; Taheri, A.; Deng, A.; Nikraz, H. Tyre Rubber and Expansive Soils: Two Hazards, One Solution. Proc. Inst. Civ. Eng. Constr. Mater. 2020, 1–17. [Google Scholar] [CrossRef]
  35. CEN CWA 14243-2002. In Post-Consumer Tire Materials and Applications; PKN: Warszawa, Poland, 2002.
  36. ASTM D 6270-08. In Standard Practice for Use a Scrap Tires in Civil Engineering Applications; ASTM: Philadelphia, PA, USA, 2014.
  37. Das, T.; Singh, B. Strength Behaviour of Cohesive Soil-Fly Ash-Waste Tyre Mixtures. In Proceedings of the SAITM Research Symposium on Engineering Advancements, University of Moratuwa, Malabe, Sri Lanka, 27–28 April 2012; pp. 35–38. [Google Scholar]
  38. Yadav, J.; Tiwari, S. A Study on the Potential Utilization of Crumb Rubber in Cement Treated Soft Clay. J. Build. Eng. 2017, 9, 177–191. [Google Scholar] [CrossRef]
  39. Qi, Y.; Indraratna, B. Energy-Based Approach to Assess the Performance of a Granular Matrix Consisting of Recycled Rubber, Steel-Furnace Slag, and Coal Wash. J. Mater. Civ. Eng. 2020, 32, 04020169. [Google Scholar] [CrossRef]
  40. Qi, Y.; Indraratna, B.; Tawk, M. Use of Recycled Rubber Elements in Track Stabilisation. Geo-Congress 2020, 319, 49–59. [Google Scholar] [CrossRef]
  41. Akbarimehr, D.; Fakharian, K. Dynamic Shear Modulus and Damping Ratio of Clay Mixed with Waste Rubber using Cyclic Triaxial Apparatus. Soil Dyn. Earthq. Eng. 2021, 140, 106435. [Google Scholar] [CrossRef]
  42. Indraratna, B.; Qi, Y.; Jayasuriya, C.; Heitor, A.R.; Navaratnarajah, S.K. Use of Rubber Tyre Elements in Track Stabilization. In Proceedings of the 9th Asian Young Geotechnical Engineers Conference, Invited Keynote Lecture, Lahore, Pakistan, 5–7 December 2019; Available online: https://www.researchgate.net/publication/339900917_Use_of_Rubber_Tyre_Elements_in_Track_Stabilization (accessed on 5 December 2019).
  43. Sarajpoor, S.; Kavand, A.; Zogh, P.; Ghalandarzadeh, A. Dynamic Behavior of Sand-Rubber Mixtures Based on Hollow Cylinder Tests. Constr. Build. Mater. 2020, 251, 118948. [Google Scholar] [CrossRef]
  44. Akbarimehr, D.; Eslami, A.; Aflaki, E. Geotechnical Behaviour of Clay Soil Mixed with Rubber Waste. J. Clean. Prod. 2020, 271, 122632. [Google Scholar] [CrossRef]
  45. Andersen, K.H. Behaviour of Clay Subjected to Undrained Cyclic Loading. In Proceedings of the BOSS’76, Trondheim, Norway, 2–5 August 1976; Volume 1, pp. 392–403. [Google Scholar]
  46. Andersen, K.H.; Lauritzsen, R. Bearing Capacity for Foundations with Cyclic Loads. J. Geotech. Eng. 1988, 114, 540–555. [Google Scholar] [CrossRef]
  47. Wood, D.M. Laboratory Investigations of the Behaviour of Soils under Cyclic Loading: A review. In Soil Mechanics-Transient and Cyclic Loads; Pande, G.N., Zienkiewicz, O.C., Eds.; Wiley: New York, NY, USA, 1982; Volume 20, pp. 513–582. [Google Scholar]
  48. Leal, A.N.; Kaliakin, V. Behavior of Cohesive Soils Subjected to Cyclic Loading; An Extensive Review of Pertinent Literature, Research Report; Department of Civil and Environmental Engineering, University of Delaware: Newark, DE, USA, September 2013; Available online: http://nwp.engr.udel.edu/cieg/faculty/kaliakin/CEE_Report_cyclic_13.pdf (accessed on 15 June 2020).
  49. Sangrey, D.A.; France, J.W. Peak Strength of Clay Soils after a Repeated Loading History. In International Symposium on Soils under Cyclic and Transient Loading; Balkema: Rotterdam, The Netherland, 1980; Volume 1, pp. 421–430. [Google Scholar]
  50. Matasović, N.; Vucetic, M. Generalized Cyclic-Degradation-Pore-Pressure Generation Model for Clays. J. Geotech. Eng. 1995, 121, 33–42. [Google Scholar] [CrossRef]
  51. Jastrzębska, M. Investigations of the Behaviour of Cohesive Soils Subject to Cyclic Loads in the Area of Small Deformations; Monograph, D.S., Ed.; Silesian University of Technology Publishers: Gliwice, Poland, 2010. [Google Scholar]
  52. Kalinowska, M.; Jastrzębska, M. Behaviour of Cohesive Soil Subjected to Low-Frequency Cyclic Loading in Strain-Controlled Tests. Stud. Geotech. Mech. 2015, 36, 21–35. [Google Scholar] [CrossRef] [Green Version]
  53. Jastrzebska, M. The External and Internal Measurement Impact on Shear Modulus Distribution within Cyclic Small Strains in Triaxal Studies into Cohesive Soil. In Proceedings of the EPJ Web of Conferences, Gliwice, Poland, 10 June 2010; Volume 6, p. 22014. [Google Scholar] [CrossRef] [Green Version]
  54. Jastrzębska, M.; Sternik, K. Application of Elasto-Plastic Model with Anisotropic Hardening to Analysis of Cyclic Loading of Cohesive Soil. In Proceedings of the International Conference on “Cyclic Behaviour of Soils and Liquefaction Phenomena”, Bochum, Germany, 31 March–2 April 2004; pp. 41–46. [Google Scholar]
  55. Jastrzębska, M.; Łupieżowiec, M. The Effect of the Rate on the Cyclic Strains in the Cohesive Soils in the Light of Theoretical and Laboratory Tests. In Proceedings of the 16th International Conference on Soil Mechanics and Geotechnical Engineering, Osaka, Japan, 12–16 September 2005; pp. 807–810. [Google Scholar]
  56. Jastrzębska, M. The Influence of Overconsolidation Ratio on the “Gs-ε1” Dependence for Cyclic Loading of Cohesive Soils in the Range of Small Strains. Studia Geotechnica et Mechanica. Stud. Geotech. Mech. 2010, 32, 17–28. [Google Scholar]
  57. Jastrzębska, M. The Influence of Selected Parameters of Cyclic Process on Cohesive Soils Shear Characteristics at Small Strains. Arch. Civ. Eng. 2010, 56, 89–107. [Google Scholar] [CrossRef] [Green Version]
  58. Jastrzębska, M. Influence de l’Amplitude et du Niveau Initial de Déchargement sur la Relation “Gs-ε1” en Cas de Charge-ment Cyclique des Sols Cohésifs dans la Zone de Petites Deformations. Stud. Geotech. Mech. 2010, 32, 17–27. [Google Scholar]
  59. Yasuhara, K.; Hirao, K.; Hyde, A.F. Effects of Cyclic Loading on Undrained Strength and Compressibility of Clay. Soils Found. 1992, 32, 100–116. [Google Scholar] [CrossRef] [Green Version]
  60. Vuetic, M.; Dobry, R. Degradation of Marine Clays under Cyclic Loading. J. Geotech. Eng. 1998, 114, 133–149. [Google Scholar] [CrossRef]
  61. Jastrzębska, M.; Kowalska, M. Triaxial Tests on Weak Cohesive Soils—Some Practical Remarks (part 2). Arch. Civ. Eng. Envi-ron. 2016, 9, 81–94. [Google Scholar] [CrossRef] [Green Version]
  62. Kowalska, M.; Jastrzębska, M. Triaxial Tests on Weak Cohesive Soils-Some Practical Remarks (Part 1). Arch. Civ. Eng. Environ. 2016, 9, 71–80. [Google Scholar] [CrossRef] [Green Version]
  63. Jastrzębska, M.; Kalinowska-Pasieka, M. Selected Research Methods in Modern Geotechnical Laboratory. In From the Subsoil to the Soil Parameters; Silesian University of Technology Publishers: Gliwice, Poland, 2015; Volume 313, ISBN 978-83-7880-210-5. [Google Scholar]
  64. Stempkowska, A. Determination of Properties of Clays and Clinker Masses. Red Clay; AGH University of Science and Technology: Kraków, PL, USA, 2014; Unpublished report. [Google Scholar]
  65. PN-EN ISO 14688-2:2006. In Geotechnical Investigation and Testing—Determination and Classification of Soils—Part 2: Classification Rules; PKN: Warszawa, Poland, 2006.
  66. ASTM D2487-11. In Standard Practice for Classification of Soils for Engineering Purposes (Unified Soil Classification System); ASTM International: Philadelphia, PA, USA, 2017.
  67. PN-EN ISO 17892-5:2017-06. In Geotechnical Investigation and Testing—Laboratory Testing of Soil—Part 5: Incremental Loading Oedometer Test; PKN: Warszawa, Poland, 2017.
  68. Holtz, W.G.; Gibbs, H.J. Engineering Properties of Expansive Clays. Trans. Am. Soc. Civ. Eng. 1956, 121, 641–663. [Google Scholar] [CrossRef]
  69. Head, K.H. Manual of Soil Laboratory Testing: Soil Classification and Compaction Test, 3rd ed.; Whittles Publishing: Scotland, UK, 2006; Volume 1. [Google Scholar]
  70. Jastrzębska, M. Calibration and Verification of One-Surface Elasto-Plastic Soil Model of Strongly Non-Linear Anisotropic Strengthening. Ph.D. Thesis, Silesian University of Technology, Gliwice, Poland, 2002. [Google Scholar]
  71. Akbulut, S.; Arasan, S.; Kalkan, E. Modification of Clayey Soils using Scrap Tire Rubber and Synthetic Fibers. Appl. Clay Sci. 2007, 38, 23–32. [Google Scholar] [CrossRef]
  72. PKN-CEN ISO/TS 17892-3:2009. In Geotechnical Investigation and Testing—Laboratory Testing of Soil—Part 3: Determination of Particle Density—Pycnometer Method; PKN: Warszawa, Poland, 2009.
  73. PKN-CEN ISO/TS 17892-12:2009. In Geotechnical Investigation and Testing—Laboratory Testing of Soil—Part 12: Determination of Atterberg Limits; PKN: Warszawa, Poland, 2009.
  74. ASTM D422-63:(2007)e2. In Standard Test Method for Particle-Size Analysis of Soils; ASTM International: West Conshohocken, PA, USA, 2007.
  75. PKN CEN ISO/TS 17892-4:2009. In Geotechnical Investigation and Testing—Laboratory Testing of Soil—Part 4: Determination of Particle Size Distribution; PKN: Warszawa, Poland, 2009.
  76. PN EN 13286-2:2010. In Unbound and Hydraulically Bound Mixtures—Part 2: Test Methods for Laboratory Reference Density and Water Content—Proctor Compaction; PKN: Warszawa, Poland, 2010.
  77. Kowalska, M.; Rios, S.; Kijanka, M.; Jastrzębska, M. The Use of Scrap Tire Rubber in Geotechnical Engineering. Available online: https://www.researchgate.net/project/The-use-of-scrap-tire-rubber-in-geotechnical-engineering (accessed on 28 October 2016).
  78. PN-EN ISO 17892-9:2018-05. In Geotechnical Investigation and Testing—Laboratory Testing of Soil—Part 9: Consolidated Triaxial Compression Test on Water Saturated; PKN: Warszawa, Poland, 2020.
  79. Yadav, J.S.; Tiwari, S.K. Effect of Inclusion of Crumb Rubber on the Unconfined Compressive Strength and Wet-Dry Dura-bility of Cement Stabilized Clayey Soil. J. Build. Mater. Struct. 2016, 3, 68–84. [Google Scholar] [CrossRef]
  80. Głuchowski, A.; Sas, W. Long-Term Cyclic Loading Impact on the Creep Deformation Mechanism in Cohesive Materials. Materials 2020, 13, 3907. [Google Scholar] [CrossRef] [PubMed]
  81. Hong, Y.; Yang, Z.; Orense, R.P.; Lu, Y. Investigation of Sand–Tire Mixtures as Liquefaction Remedial Measure. In Proceedings of the 10th Pacific Conference on Earthquake Engineering—Building an Earthquake Resilient Pacific. Australian Earthquake Engineering Society, Sydney, Australia, 6–8 November 2015. [Google Scholar]
  82. Rios, S.; Kowalska, M.; da Fonseca, A.V. Cyclic and Dynamic Behavior of Sand–Rubber and Clay–Rubber Mixtures. Geotech. Geol. Eng. 2021, 1–19. [Google Scholar] [CrossRef]
  83. Soroush, A.; Soltani-Jigheh, H. Pre- and post-cyclic behavior of mixed clayey soils. Can. Geotech. J. 2009, 46, 115–128. [Google Scholar] [CrossRef]
  84. Głuchowski, A.; Sas, W.; Soból, E.; Gabryś, K.; Szymański, A. Pore Pressure Behavior of Compacted Clay Under Long-Term Cyclic Loads in Undrained Conditions. In Proceedings of the ECSMGE, Reykjavik, Iceland, 1–6 September 2019. [Google Scholar] [CrossRef]
  85. Kucharczyk, K.; Głuchowski, A.; Miturski, M.; Sas, W. Influence of Load Frequency on Cohesive Soil Respond. Geosciences 2018, 8, 468. [Google Scholar] [CrossRef] [Green Version]
  86. Li, L.-L.; Dan, H.-B.; Wang, L.-Z. Undrained Behavior of Natural Marine Clay under Cyclic Loading. Ocean Eng. 2011, 38, 1792–1805. [Google Scholar] [CrossRef]
  87. Matsui, T.; Ohara, H.; Ito, T. Cyclic Stress-Strain History and Shear Characteristics of Clay. J. Geotech. Eng. Div. 1980, 106, 1101–1120. [Google Scholar] [CrossRef]
  88. Hanna, A.M.; Javed, K. Design of Foundations on Sensitive Champlain Clay Subjected to Cyclic Loading. J. Geotech. Geoenvironmental Eng. 2008, 134, 929–937. [Google Scholar] [CrossRef]
  89. Ren, X.-W.; Xu, Q.; Xu, C.-B.; Teng, J.-D.; Lv, S.-H. Undrained Pore Pressure Behavior of Soft Marine Clay under Long-Term Low Cyclic Loads. Ocean Eng. 2018, 150, 60–68. [Google Scholar] [CrossRef]
  90. Soltani, A.; Taheri, A.; Deng, A.; O’Kelly, B.C. Improved Geotechnical Behavior of an Expansive Soil Amended with Tire-Derived Aggregates Having Different Gradations. Minerals 2020, 10, 923. [Google Scholar] [CrossRef]
Figure 1. Rubber waste: (a) powder (P) 0–1 mm; (b) granulate (G) 1–5 mm.
Minerals 11 00315 g001
Figure 2. Preparation of specimens from the red clay–rubber (RC-R) mixture.
Minerals 11 00315 g002
Figure 3. Cyclic load scheme at constant deviator stress amplitude Aq.
Minerals 11 00315 g003
Figure 4. Variation in the axial strain ε1,cyc with the cycle number from 1–10,000 cycles (the horizontal axis is logarithmic).
Minerals 11 00315 g004
Figure 5. Axial strain variation ε1,cyc with the cycle number from: (a) 1–1000 cycles; (b) 1–10 cycles.
Minerals 11 00315 g005
Figure 6. Pore pressure u versus axial strain ε1 for: (a) selected (RC-R) mixtures; (b) (K-R) mixtures.
Minerals 11 00315 g006
Figure 7. Variation of the pore pressure ucyc with the cycle number N from 1–10 thousand cycles (the horizontal axis is logarithmic).
Minerals 11 00315 g007
Figure 8. Variation of the pore pressure ucyc with the cycle number N from: (a) 1–1000 cycles; (b) 1–10 cycles.
Minerals 11 00315 g008
Figure 9. Deviator stress q versus axial strain ε1 for: (a) (RC-R) mixtures; (b) (K-R) mixtures.
Minerals 11 00315 g009
Figure 10. Deviator stress at failure qmax versus powder or granulate levels for (RC-R) and (K-R) mixtures and the kaolin (K) and red clay (RC) (based on this study and tests reported in [30,51]). * Jastrzębska’s tests [51], ** Jastrzębska’s tests [30]. The points indicating the single tests are described separately (next to the markers). The description of the test series for different rubber waste levels and an identical confining pressure (the corresponding curves) is included in the legend.
Minerals 11 00315 g010
Figure 11. Strain at failure ε1,f versus confining stress σ3 for (RC-R) and (K-R) mixtures and kaolin (K) and red clay (RC) (based on this study and tests reported in [30,51]). * Jastrzębska’s tests [51], ** Jastrzębska’s tests [30].
Minerals 11 00315 g011
Table 1. Basic geotechnical properties of red clay (siCl/CH) and kaolin (siCl/CL) [30,53,64,70].
PropertiesRed Clay (RC)Kaolin (K)Standard Designation
Value Value
Specific gravity, Gs (g/cm3)2.772.64PKN-CEN ISO/TS 17892-3 [72]
Consistency limits:
Plastic limit, PL (%)2520PKN-CEN ISO/TS 17892-12 [73]
Liquid limit—Casagrande method, LL (%)7542PKN-CEN ISO/TS 17892-12 [73]
Swelling properties:
Swelling pressure, σsp (kPa) 197-PN-EN ISO 17892-5 [67]
Free-swell, FS (%)31.50-Head [69]
Grain size distribution: ASTM D422 [74]
Gravel (>2000 μm), (%)00
Sand (75–2000 μm), (%)02
Silt (2–75 μm), (%)7160
Clay (<2 μm), (%)2938PKN CEN ISO/TS 17892-4 [75]
Mineralogy:
Quartz, (%)41.8-
Kaolinite, (%)31.5-
Illite, (%)19.5-
Siderite, (%)5.6-
Goethite, (%)2.0-
EC7 2 soil classificationsiCl 3siCl 3PN-EN ISO 14688-2 [65]
USCS 4 soil classificationCH 5CL 6ASTM D2487-11 [66]
Compaction characteristics: PN EN 13286-2 [76]
Optimum moisture content (OMC), wopt (%)18.019.0
Maximum dry density, ρdmax (g/cm3)1.751.79
1 based on Kowalska and Jastrzębska’s tests [22]. 2 Eurocode 7. 3 clay with silt or silty clay. 4 Unified Soil Classification System. 5 inorganic clay of high plasticity. 6 inorganic clay of low plasticity.
Table 2. Physical properties of the red clay (siCl/CH), kaolin (siCl/CL), powder (P), and granulate (G), based on the grain size distribution curves [30,53,64,70].
Effective Diameter/PropertiesRed Clay Kaolin PowderGranulate
d10, (mm)0.00080.00010.1651.12
d30, (mm)0.0020.0010.341.45
d50, (mm)0.00450.00460.52.0
d60, (mm)0.0080.0080.582.35
d90, (mm)0.020.050.854.0
Coefficient of uniformity, Cu100733.52.1
Coefficient of curvature, Cc0.631.251.20.8
Table 3. Characteristics of tests conducted within the study.
Symbol of TestMaterialRubber Content (%)Type of TestTotal Amplitude A (kPa)Skempton’s Parameter B (-)Effective Confining Pressure (Shearing) σ3 (kPa)Density ρ for w = 18% (g/cm3)Initial Void Ratio e0
(-)
rc1-2RC 10C-10000 5380.86201.850.87
rc3-1RC-G 2-55C-1000250.89201.680.89
rc5-1RC-G-1010C-1000 6350.79201.620.90
rc5-35050
rc5-48080
rc4-1RC-G-2525C-1000250.87201.460.93
rc4-23550
rc4-33180
rc4-4M 7-20
rc2-1RC-P 3-1010C-10000370.94201.640.89
k1-2K 4-G-2525C-1000350.951001.520.82
k1-335200
k1-144300
k1-4M-300
(8)K0Mvarious0.99(50–350)1.940.84 for w = 31%
1 red clay (siCl/CH). 2 granulate. 3 powder. 4 kaolin (siCl/CL). 5 the cyclic test of constant deviator stress amplitude (A = 0.35q) with 10,000 cycles. 6 the cyclic test of constant deviator stress amplitude (A = 0.35 q) with 1000 cycles. 7 monotonic test. 8 based on Jastrzębska’s tests [51].
Table 4. Specification of axial strain ε1,cyc and pore pressure ucyc values during triaxial tests after 10/100/1000/10,000 cycles at amplitude A = 0.35 q.
Symbol of TestMaterialIncrease in Axial Strain after 10/100/1000/10,000 Cycles (%)Ratio of Reduction in Axial Strain after 10/100/ 1000/10,000 Cycles (-)Increase in Pore Pressure after 10/100/ 1000/10,000 Cycles (kPa)Ratio of Reduction in Pore Pressure after 10/100/ 1000/10,000 Cycles (-)
rc1-2RC0.12/0.36/-–2.6/–5.6/-
0.59/0.77–10.2/–21.3
rc3-1RC-G-50.06/0.21/0.5/0.58/–0.8/–1.0/0.31/0.18/
0.44/-0.75/-−5.4/-0.53/-
rc5-1RC-G-100.13/0.43/1.08/1.19/--
0.77/-1.31/-
rc5-30.18/0.51/-3.6/32.8/-
1.07/-99.5/-
rc5-40.14/0.41/-4.4/5.8/-
0.75/-81.0/-
rc4-1RC-G-250.10/0.30/0.83/0.83/0.2/0.5/–0.08/–0.09/
0.61/-1.03/-–0.5/-0.44/-
rc4-20.12/0.36/-1.5/6.3/-
0.74/-24.7/-
rc4-30.10/0.26/-0.4/14.9/-
0.51/-58.6/-
rc4-4----
rc2-1RC-P-100.22/0.42/1.83/1.17/4.4/9.3/–1.7/–1.7/
0.77/1.521.31/1.9728.9/42.0–2.8/–1.97
k1-2K-G-250.05/0.15/-2.8/9.3/-
0.34/-36.1/-
k1-30.06/0.17/-3.0/19.0/-
0.20/-83.3/-
k1-10.07/0.19/-4.2/24.1/-
0.29/-120.2/-
k1-4----
Publisher’s Note: MDPI stays neutral with regard to jurisdictional claims in published maps and institutional affiliations.

