Article

Microscale Heterogeneous Distribution and Speciation of Phosphorus in Soils Amended with Mineral Fertilizer and Cattle Manure Compost

1
Institute for Agro-Environmental Sciences, NARO, 3-1-3 Kannondai, Tsukuba, Ibaraki 305-8604, Japan
2
Graduate School of Bio-Applications and Systems Engineering, Tokyo University of Agriculture and Technology, 2-24-16 Koganei, Tokyo 184-8588, Japan
3
Aichi Agricultural Research Center, 1-1 Yazako-Sagamine, Nagakute, Aichi 480-1193, Japan
4
Department of Geosciences, Stony Brook University, Stony Brook, NY 11794, USA
5
Department of Agricultural Chemistry, National Taiwan University, No.1, Sec. 4, Roosevelt Road, Taipei 10617, Taiwan
6
Department of Crop and Soil Sciences, NC State University, Raleigh, NC 27695, USA
7
Brazilian Synchrotron Light Laboratory, Brazilian Center for Research in Energy and Materials, Rua Giuseppe Máximo Scolfaro, 10.000, Polo II de Alta Tecnologia de Campinas, Campinas, São Paulo 13083-100, Brazil
*
Author to whom correspondence should be addressed.
Minerals 2021, 11(2), 121; https://doi.org/10.3390/min11020121
Submission received: 10 January 2021 / Revised: 21 January 2021 / Accepted: 22 January 2021 / Published: 26 January 2021
(This article belongs to the Special Issue Phosphorous in Soils and Sediments)

Abstract

:
Global concerns for the sustainability of agriculture have emphasized the need to reduce the use of mineral fertilizer. Although phosphorus (P) is accumulated in farmland soils due to the long-term application of fertilizer, most soil P is not readily available to plants. The chemical speciation of P in soils, which comprise heterogeneous microenvironments, cannot be evaluated with a high degree of specificity using only macroscopic analyses. In this study, we investigated the distribution and speciation of P accumulated in soils by using both macro- and microscopic techniques including chemical extraction, solution and solid-state 31P NMR, bulk- and micro- P K-edge X-ray absorption near edge structure (XANES), and electron probe microanalysis (EPMA). Soil samples were collected from a field in which cabbage was cultivated under three amendment treatments: i) mineral fertilizer (NPK), ii) mineral fertilizer and compost (NPK + compost), and iii) mineral fertilizer plus compost but without nitrogen fertilizer (PK + compost). Macro-scale analyses suggested that accumulated P was predominantly inorganic P and associated with Al-bearing minerals. The repeated application of compost to the soils increased the proportion of P associated with Ca which accounted for 17% in the NPK + compost plot and 40% in the PK + compost plot. At the microscale, hot spots of P were heterogeneously distributed, and P was associated with Fe and Ca in hot spots of the NPK + compost (pH 6) and PK + compost (pH 7) treated samples, respectively. Our results indicate that application of compost contributed to creating diverse microenvironments hosting P in these soils.

1. Introduction

Continuous applications of inorganic phosphorus (P) fertilizer results in P build-up in agricultural soils during long-term continuous cropping, while placing demand on finite supplies of rock phosphate. As an alternative, the rational use of animal manure compost can reduce the use of mineral fertilizer and enhance carbon sequestration and resources recycling, which will contribute to achieving the sustainable development goals (SDGs) proposed by the United Nations General Assembly in 2015 [1,2]. Nonetheless, the application of animal manure to agricultural fields may increase the risk of groundwater contamination with nitrogen (N) and eutrophication of nearby surface waters because weakly bound N is lost from soil by leaching and strongly bound P is lost mainly by surface runoff, including with eroded particles [3]. To reduce the risk of eutrophication and prevent further accumulation of P in cropland, P in fertilizer and compost applied to soil should be used efficiently. Therefore, it is of great importance to understand how chemical speciation of soil P potentially controls the mobility and phytoavailability of P from various fertilizer sources under different soil conditions.
Mobility and phytoavailability of P in soils depend largely on chemical speciation in relation to soil chemical and mineralogical properties [4,5]. The chemical extraction methods [6,7,8] are quite useful to compare relative abundance and availability of P with different solubility on large numbers of samples. However, they are operational methods that have a drawback of producing artifacts in presumed soil P speciation analysis because of the possible redistribution of P among different binding sites during the extraction process [9,10].
As a direct solid phase analyses, solid-state 31P nuclear magnetic resonance (NMR) and P K-edge X-ray near-edge structure (XANES) spectroscopy have been used for P speciation in soils. Solid-state 31P NMR can differentiate P species according to different chemical shifts of P associated with calcium and aluminum (Ca-P and Al-P) or in organic P forms, whereas iron-associated P (Fe-P) is difficult to detect [11]. XANES spectroscopy can distinguish phosphate associated with calcium (Ca-P), iron (Fe-P), and aluminum (Al-P) based on unique spectral features, specifically a post-edge shoulder (Ca-P), a pre-edge peak (Fe-P) and typically an intense white line (Al-P), especially for adsorbed Al-P [12,13,14,15,16], although identification of organic P is difficult [17]. Chemical extraction is more sensitive to small changes in P pools than solid-state spectroscopy. However, these operationally defined P-pools are sometimes inconsistent with those from XANES spectra [10,17]. The pool size of Ca-P evaluated by the modified Hedley method is larger than those evaluated by XANES [10]. On the other hand, the pool size of Ca-P evaluated by the Sekiya method [8] was consistent with those evaluated by XANES, while those of Al-P and Fe-P were inconsistent with XANES results [16]. Therefore, complementary analyses combining chemical extraction and spectroscopy should enhance the interpretation of soil P speciation analyses with respect to lability by combining sensitivity to minor differences in P extractability with the power of physical techniques that more directly infer P speciation based on local molecular bonding configurations.
Spatially resolved analytical methods such as micro X-ray fluorescence spectroscopy (µ-XRF) combined with micro X-ray absorption spectroscopy (µ-XANES) analyses provide additional insights into P speciation in soils [18]. Soil P is present as minute hot spots distributed heterogeneously on a diffuse, low-concentration background. In some soils, including calcareous and clay-rich soil with high concentration of P, hot spots are dominated by Ca-associated P species, including hydroxyapatite, while P in the diffuse background is Al-P or Fe-P, which is adsorbed on Al/Fe (oxy)hydroxide and aluminosilicate minerals [19,20,21,22,23]. Microscale analyses enable detection of minor P species, which cannot be detected in bulk soils due to the limitation of the analytical sensitivity of bulk XANES analysis. Minor P species in localized hot spots include P species that are not thermodynamically favored under the given bulk soil pH [19,22]. Such inconsistencies of P speciation in hot spot with chemical properties of the bulk soil can occur because soils typically do not reach an equilibrium state. Moreover, when organic amendments applied to a field are not homogeneously mixed with soil particles at the microscale, localized hotspots of non-equilibrium species can persist. Decomposition of organic matter also affects the chemistry of localized microenvironments and consequently creates unique microsites at interfaces between soil constituents [24]. For example, in acidic soils, Ca-P is soluble but could be detected at the microscale. This is because elevated P concentrations in the applied organic amendments enhance the stability of Ca-P even in acidic soils [12,25,26], possibly because of the influence of unique and heterogeneous conditions within soil microsites. Nevertheless, the role of organic amendments on microsite reactions of P in soils is still poorly understood.
We hypothesize that organic compost amended to soil creates unique microsite environments that are different from average conditions of bulk soil, thereby causing the persistence of P species that are not dominant in the bulk soil. To evaluate this hypothesis, we aimed to investigate influence of organic amendments on microsite reaction by comparing the P species in soils collected from cabbage field treated with three different combination of mineral fertilizer and compost: (i) NPK mineral fertilizer, (ii) NPK mineral fertilizer plus cattle manure compost, and iii) PK mineral fertilizer plus cattle manure compost under otherwise consistent soil management for eight years. Speciation of P in soil microsites were compared to representative and average P speciation in the corresponding bulk soil. Microscale distribution and speciation of P in soils were determined by electron probe microanalysis (EPMA) and µ-XANES, while average P speciation in bulk soils was determined by chemical extraction, solution and solid-state 31P NMR and bulk XANES. Understanding the unique chemical reactions in soil microsites will contribute to developing soil management strategies that maintain soil P as phytoavailable in these microsites where water and plant roots permeate with different timing.

2. Materials and Methods

2.1. Soil Samples

Soil samples were collected from an experimental field at Aichi agricultural research center, Toyohashi, Aichi, Japan in June 2018. The soil was classified as Stagnic Acrisols [27] and its parent material is unconsolidated sedimentary rock. The experimental field was established in 2010 to investigate the combined application effects of cattle manure compost and mineral fertilizer on the yield and nutrient absorption of cabbage (Brassica oleracea var. capitata) cultivated with two rotations of cabbage per year [28]. Winter cabbage was planted in early to mid-September and harvested in February, while summer cabbage was planted in March and harvested in late June. Cattle manure compost was applied in August before planting winter cabbage. The mineral fertilizer applied was ammonium sulfate (N), super calcium phosphate (P), and potassium sulfate (K).
In this study, we selected the plots receiving NPK mineral fertilizer without cattle manure compost (NPK), NPK mineral fertilizer with cattle manure compost (NPK + compost), PK mineral fertilizer and cattle manure compost (PK + compost) because P was accumulated in these plots after 5-year cultivation [28]. Cabbage residues were incorporated into the soil after harvest. Annual application rates of mineral fertilizer and cattle manure compost are shown in Table 1 and contents of N, P, K, C, and Ca in cattle manure compost are shown in Supplementary Table S1. In all plots, applied P exceeded the amounts of P-uptake by cabbage according to the P-budget calculation after 5 years of cultivation [28].
Surface soils (10 cm) were collected using a steel sampling cylinder after 16 cycles of cabbage cultivation. The soils from five sampling points in each plot were blended, passed through a 2 mm mesh sieve, and freeze-dried.

2.2. Preparation of Soil Thin-Sections

After cutting the above-ground part of cabbage, 2 set of soil cylinders (80 mm in diameter and 15 cm in depth) including cabbage roots in the center were collected from each plot. The soil cylinders were sliced into 3 cm segments to avoid the collapse of soil structure by freezing. The sliced samples were carefully frozen in liquid nitrogen, then freeze-dried. The soil slices were embedded in unsaturated polyester resin (Sandoma, DIC, Tokyo, Japan) under vacuum for 2 days and then set aside at room temperature until the resin was hardened. The resin block was cut and polished into thin sections with a thickness of approximately 50 μm. Thin-sections for microscale analyses were prepared from the soil at depths of 0–3 cm and 3–6 cm. Before the microscale analyses, the images of soil thin sections were scanned using an optical scanner (EW-M751T, Epson, Nagano, Japan).

2.3. Wet Chemical Analyses

Soil pH was measured in a soil to water ratio of 1:2.5 (v/w) by a pH meter. Total carbon (TC) and nitrogen (TN) was determined by the dry combustion method. Cation exchange capacity (CEC) was determined by saturating the soils with NH4+ at pH 7 followed by extraction of NH4+ with K+ [29]. Exchangeable Ca, Mg, K, and Na concentrations extracted with 1 mol L−1 ammonium acetate at pH 7 and acid oxalate extractable Al (Alox) and Fe (Feox) concentrations extracted with 0.2 mol·L−1 ammonium oxalate at pH 3.0 in the dark [30] were determined by an inductivity coupled plasma optical emission spectrometer (ICP-OES). Total Al and Fe concentrations were determined by X-ray fluorescence spectrometry (NEX CG, Rigaku, Tokyo, Japan) using the scattering fundamental parameter (FP) method [31]. Accuracy of XRF analyses was confirmed by analyzing reference soil (SRM-1646, NRB, Japan). The soil particle size distribution was determined by the pipet method [32] and size distribution was described as follows: coarse sand: 2–0.2 mm, fine sand 0.2–0.02 mm, silt: 0.02–0.002 mm, clay: <0.002 mm.
Water soluble P was extracted from 4 g of soils by 10 mL of deionized water for 6 h. Available P was extracted from 0.5 g of soil by 100 mL of 0.001 mol·L−1 H2SO4 for 30 min by the method of Truog [33]. Soil P of different solubility was evaluated by the sequential extraction method modified by Sekiya et al. [8] after Chang and Jackson [7]. The detailed method is described elsewhere [34]. Briefly, 0.5 g soil was sequentially extracted with 50 mL of 0.44 mol·L−1 acetic acid for 2 h (Ac-P), 1 mol L−1 NH4F at pH 7.0 for 1 h (NH4F-P), and 0.1 mol·L−1 NaOH for 17 h (NaOH-P), respectively. The Ac-P, NH4F-P and NaOH-P were operationally defined as Ca-P, Al-P, and Fe-P, respectively [8]. Pseudo-total P contents of soil were analyzed by digesting 0.1 g of soil with HNO3-HClO4 mixture. Phosphate concentrations in the extracts were determined colorimetrically with molybdenum blue [35]. Soils were analyzed in duplicate.

2.4. 31P-NMR

For liquid-state 31P-NMR analyses, 0.5 g of finely ground soil and cattle manure compost were extracted with 10 mL of 0.25 mol·L−1 NaOH-0.05 mol·L−1 EDTA solution for 16 h [36]. After removing soils by centrifugation at 4000× g for 15 min, the supernatant was freeze-dried and re-dissolved in NaOH-EDTA solution with 10% of D2O. Liquid-state 31P NMR spectra were obtained using a ECA600 FT NMR (JEOL, Tokyo, Japan) with a 5 mm probe at 243 MHz using the following parameters: 30° pulse of 4.24 μs, an acquisition time of 0.304 s, a pulse delay of 2 s, and broadband proton decoupling at room temperature (around 25 °C), respectively. A broadening factor of 2.00 Hz was used for Fourier transformation. Chemical shifts (ppm) were determined with respect to 85% H3PO4 solution (0 ppm).
For solid-state 31P-NMR analyses, finely ground soil and cattle manure compost were packed into a zirconium tube with an outer diameter of 3.2 mm. Spectra were recorded at 243 MHz with the following parameters: a single pulse experiment using 90° pulse of 3.7 μs, an acquisition time of 6.02 ms, a pulse delay of 10 s, with magic angle spinning rate of 15 kHz at room temperature. A broadening factor of 200 Hz was used for Fourier transformation. Chemical shifts (ppm) were again determined with respect to 85% H3PO4 solution (0 ppm). Spectral deconvolution was performed by OriginPro 2019 software (version 9.9.0.172, LightStone, Tokyo, Japan).

2.5. Bulk P-K Edge XANES

Phosphorus K-edge XANES data were obtained at BL6N1 of Aichi Synchrotron Radiation Center, Japan. An InSb(111) monochromator crystal was used and the energy scale was calibrated to the first derivative maximum of an AlPO4 reference at 2151.4 eV (E0) [37]. Fluorescence spectra were collected in a He atmosphere using a silicon drift detector (SDD, Vortex-EM, Hitachi, Illinois) in the energy range from 2120 to 2200 eV.
As standard materials for linear combination fitting (LCF), phosphate-bearing precipitates associated with Ca, Al and Fe. CaHPO4·2H2O, hydroxyapatite (Ca10(PO4)6 (OH)2), AlPO4, and FePO4 were commercially obtained and measured after dilution with boron nitride. Phosphate adsorbed on gibbsite or ferrihydrite was synthesized by mixing sodium phosphate solution with the minerals at pH 6 for 24 h and the phosphate adsorbed minerals were freeze-dried after washing with water. Normalization of XANES spectra and LCF analyses were performed with the Athena ver. 0.9.26 software [38].

2.6. Microscale Analyses

Microscale distribution and speciation of P on the soil thin-sections were analyzed by elemental mapping using synchrotron µ-XRF followed by µ-XANES at the Tender Energy Spectroscopy (TES) beamline (8-BM), NSLS-II, Brookhaven National Laboratory (Upton, NY, USA) and at BL27SU, SPring-8.
At TES, thin-sections prepared from a soil cylinder collected at a depth of 0–3 cm were analyzed. An incident X-ray beam of 2700 eV was focused on the sample using Kirkpatrick-Baez (KB) mirrors and the beam size was adjusted in the range from 3.75 to 10 µm using the virtual source slit [39], depending on the sample area analyzed. The elemental maps of P, S, and Si were obtained by on-the-fly scan mode with the detection of fluorescence yield by a Canberra Ultra-low-energy Ge detector. The scan step size was set to the same as the beam size. The fluorescence yield was normalized by the incident photon intensity. Data processing for reproduction of elemental maps was performed using beamline-specific software. Phosphorus K-edge µ-XANES on selected P hot spots were obtained by the partial fluorescence yield method in the scanning range from 2120 to 2200 eV; energy was selected using a Si(111) monochromator. The beam size for µ-XANES analyses was adjusted depending on the size of hot spots. Background subtraction and normalization of µ-XANES was conducted using Athena. The analogous methods of µ-XRF and µ-XANES analyses at SPring-8 are described in the supporting information.
After µ-XRF measurement, the soil thin-sections were coated with carbon and the distributions of sulfur (S), P, Ca, Al, and Fe were determined using an electron probe micro analyzer (JXA-8500F, JEOL, Tokyo, Japan) at an acceleration voltage of 15 kV and current of 20 nA.

3. Results and Discussion

3.1. Soil Properties and P Concentrations

Chemical properties of soils were affected by the different application rates of compost and mineral fertilizers (Table 2). The application of compost to the soils increased total C, N and exchangeable cations. Soil pH values close to 6.0 were observed in samples from NPK and NPK + compost plots, whereas the sample from the PK + compost was at pH 7.4. Before starting the experiment of combined applications of mineral fertilizer and compost in 2010, soil pH and exchangeable Ca ranged from 5.9 to 6.0 and 2.5 to 3.0, respectively [28]. Soil pH in the PK + compost increased after eight years of fertilizer and compost application under low yield of cabbage (Supplementary Table S3), partly due to the increase of exchangeable Ca. In the PK + compost plot, the base saturation rate exceeded 100% due to the high concentration of exchangeable Ca, which is possibly related to the presence of calcite and Ca associated with P (Figure 1).
Total P concentration was increased by the application of compost (~1650 mg·kg−1), compared to the soil without compost applications (i.e., NPK plot, 1353 mg·kg−1) and water-soluble P was less than 1% of the total P and larger in the order of NPK, NPK + compost, PK + compost. (Table 3). According to results of sequential extraction, soil P in the NPK plot was mainly found in the NH4F and NaOH fractions, accounting for 27% and 24% of the total P, respectively, while 39% remained in the residual fraction (Table 3). This result suggests that soil P in the NPK plot may be primarily associated with Al and Fe [8,24] and with the hardly extractable fraction (residual fraction). Compost application caused a slight increase of oxalate extractable Al (Table 2) while P in the NH4F and NaOH fractions were not different among the three treatments (Table 3). In contrast, the repeated application of compost to the soils increased the proportion of Ac-P, which reached 16% in the NPK + compost plot and 31% in the PK + compost plot. A notable increase of soil P extracted by the Truog method (“Truog-P”) was also found in the PK + compost, compared to the NPK + compost plot, although their total P concentrations were similar. The accumulation of Truog-P and Ac-P in the PK + compost plot, relative to the NPK + compost plot, likely resulted from greater stability of Ca-phosphates under alkaline pH [40], and was verified by spectroscopic techniques (described later).

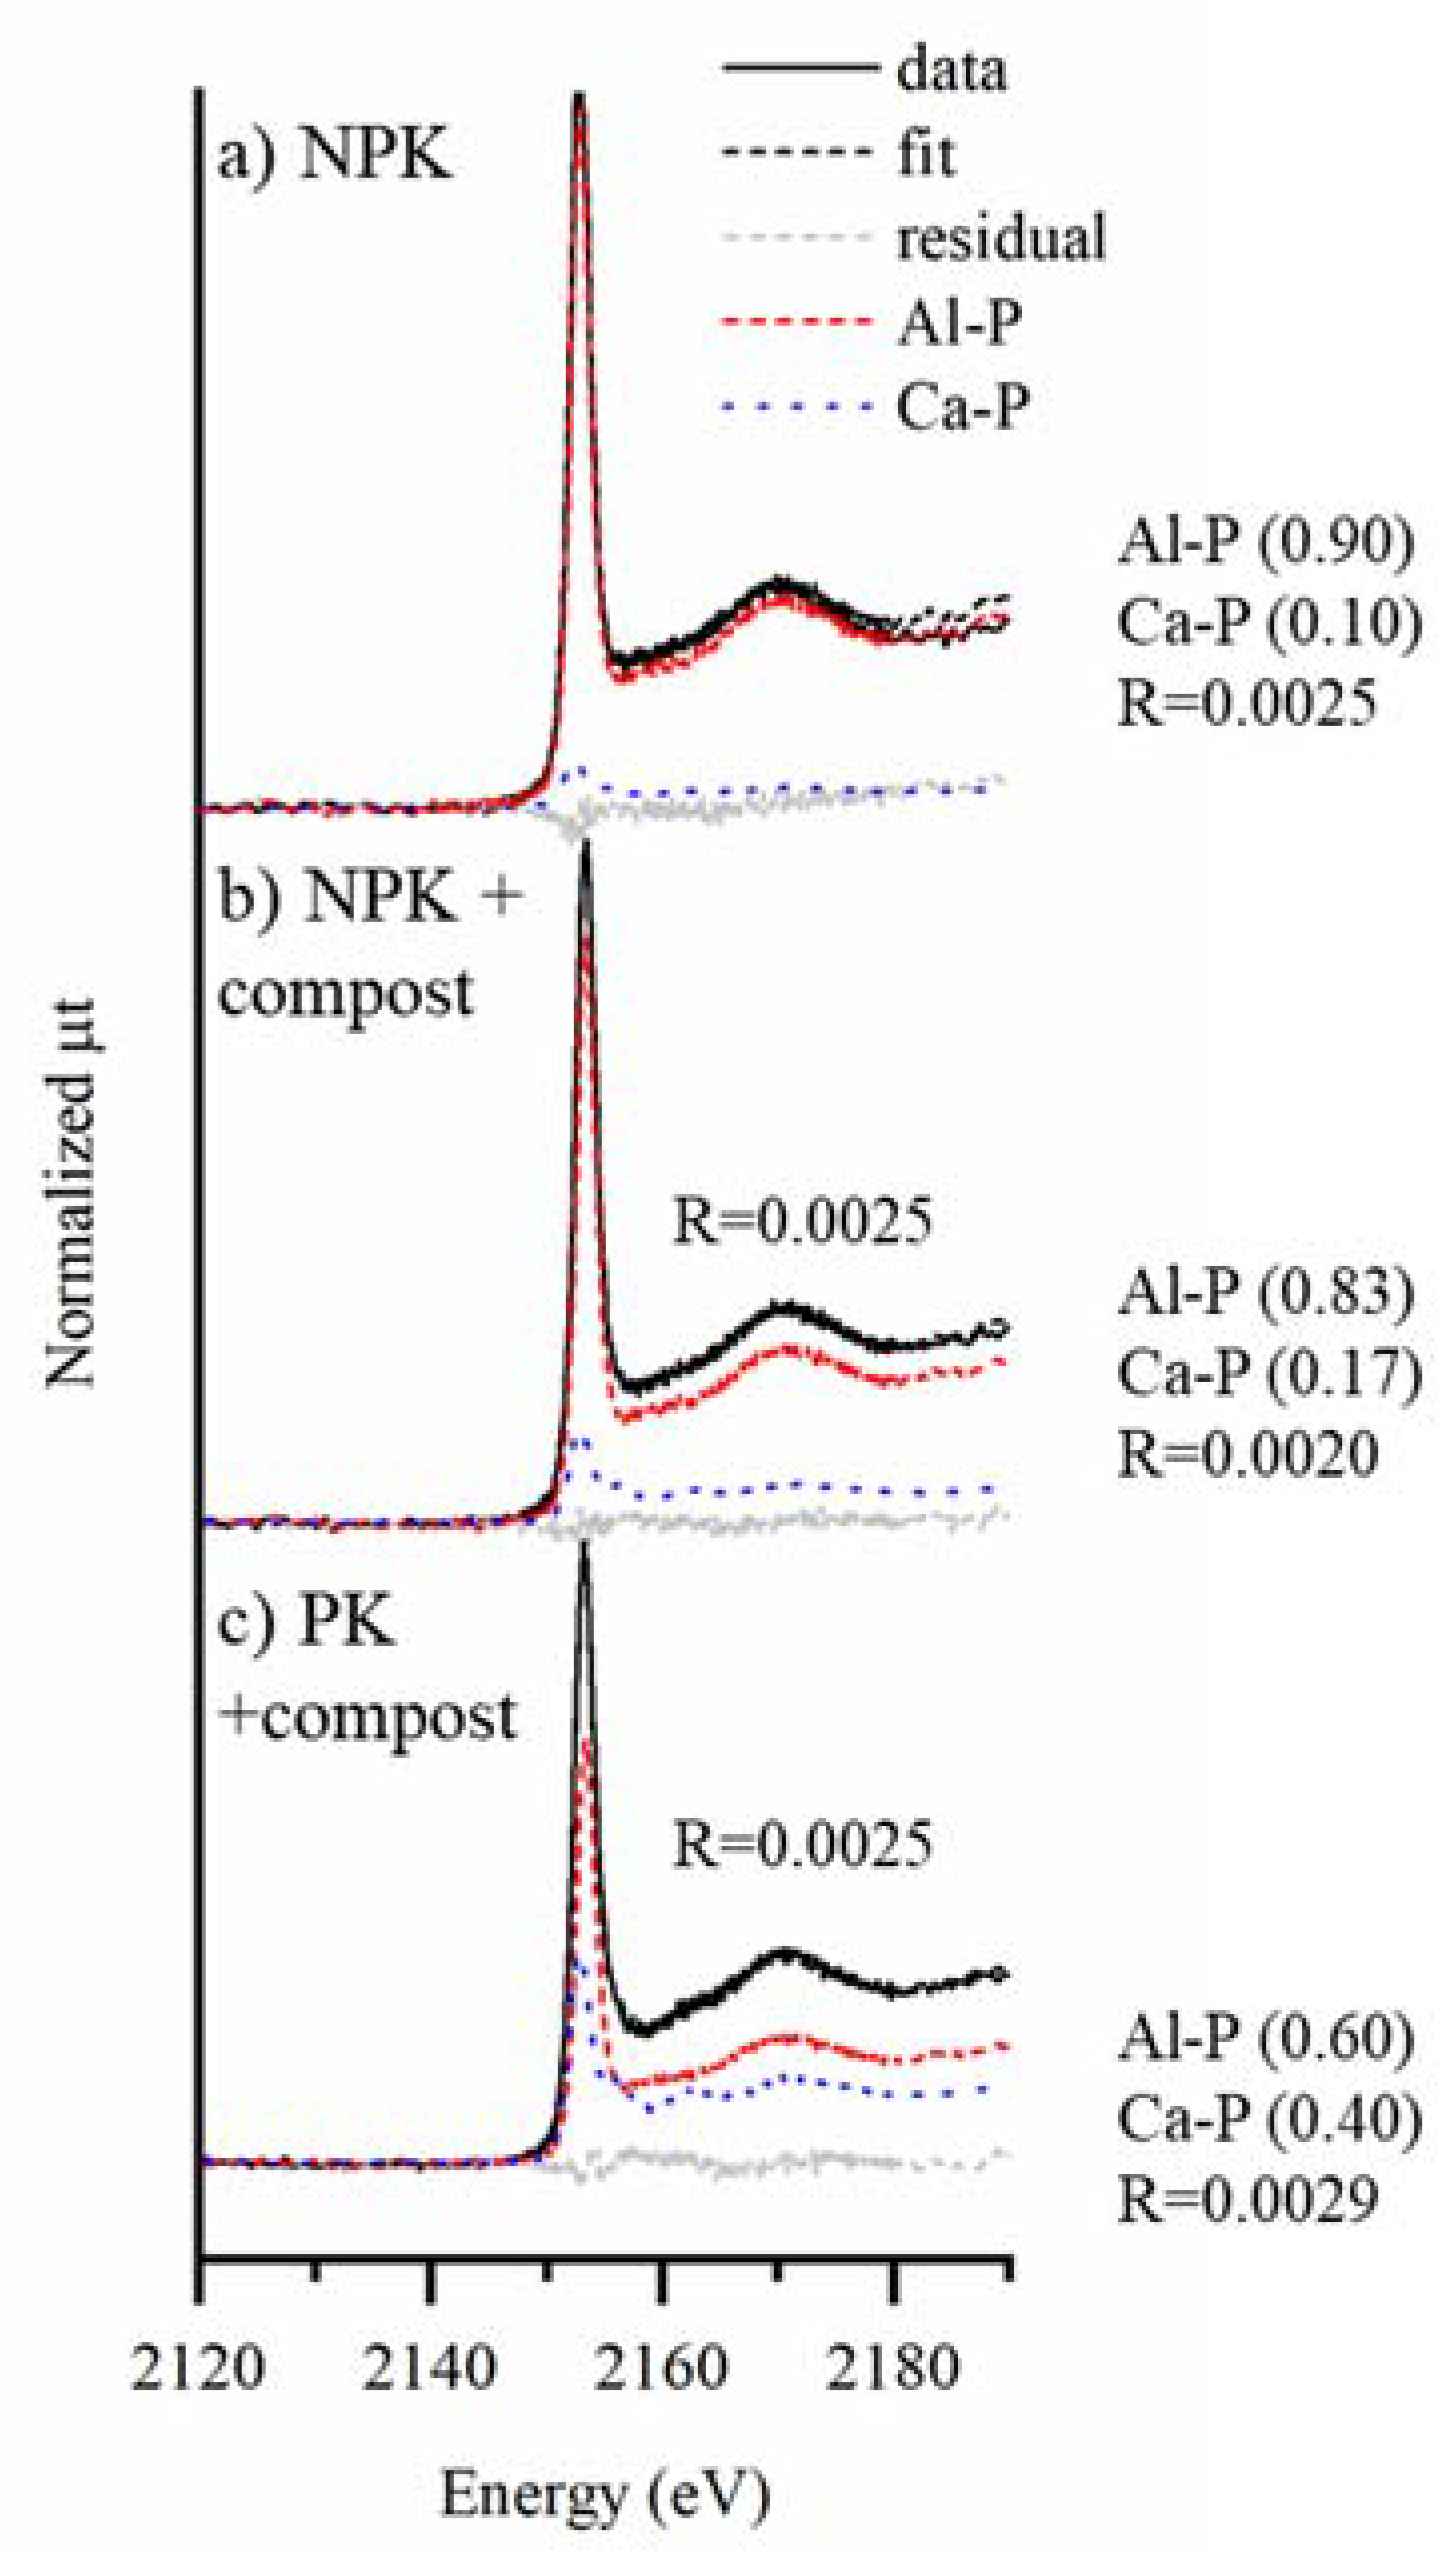
3.2. Bulk P K-Edge XANES

Bulk P K-edge XANES spectra of NPK and NPK + compost soils were similar to each other but different from that of the PK + compost soil (Figure 1, Supplementary Figure S1). The intensity of the white line peak was lower for PK + compost than for NPK and NPK + compost samples (Supplementary Figure S1), suggesting a greater proportion of solid-phase precipitates relative to adsorbed P species in the former [41]. In addition, the higher energy side of the white line peak was expanded for PK + compost compared with the other samples (Supplementary Figure S1), which is a distinctive feature of P associated with Ca (Supplementary Figure S2) [41]. A pre-edge peak between 2147 and 2152 eV that is indicative of P associated with Fe as shown in the standard spectra (Supplementary Figure S2) was not obvious in any XANES spectra from soils. It is difficult to differentiate P species between adsorbed phases (e.g., P adsorbed on gibbsite) and minerals (e.g., variscite) due to similarity in their XANES spectra [42]. Therefore, we report the LCF results as groups of P associated with Ca (Ca−P), Fe (Fe−P), or Al (Al−P), where weighting factors on individual standards within each group were summed. The LCF result for the XANES spectra of NPK soil showed that a large proportion of P (90%) was associated with Al with a minor proportion of Ca-P (10%) (Figure 1). These P species were common in the NPK + compost soils with similar proportions to those for the NPK soil. Although we used P adsorbed on gibbsite as a standard for Al-P, any Al-P in soils may include P adsorbed on aluminosilicate minerals such as smectite and kaolinite [43,44]. The proportion of Ca-P was greatest (40%) for the PK + compost soil and Al-P decreased to 60% of the total P. Overall, the proportion of P associated with Ca by treatment increased in the order of NPK < NPK + compost < PK + compost (Figure 1). This was attributed to the repeated application of cattle manure compost, in which 76% of P was associated with Ca based on the LCF analysis (Supplementary Figure S3) and greater thermodynamic stability of Ca-phosphate minerals at the alkaline pH (7.4) of the PK + compost treated soil (Table 2).

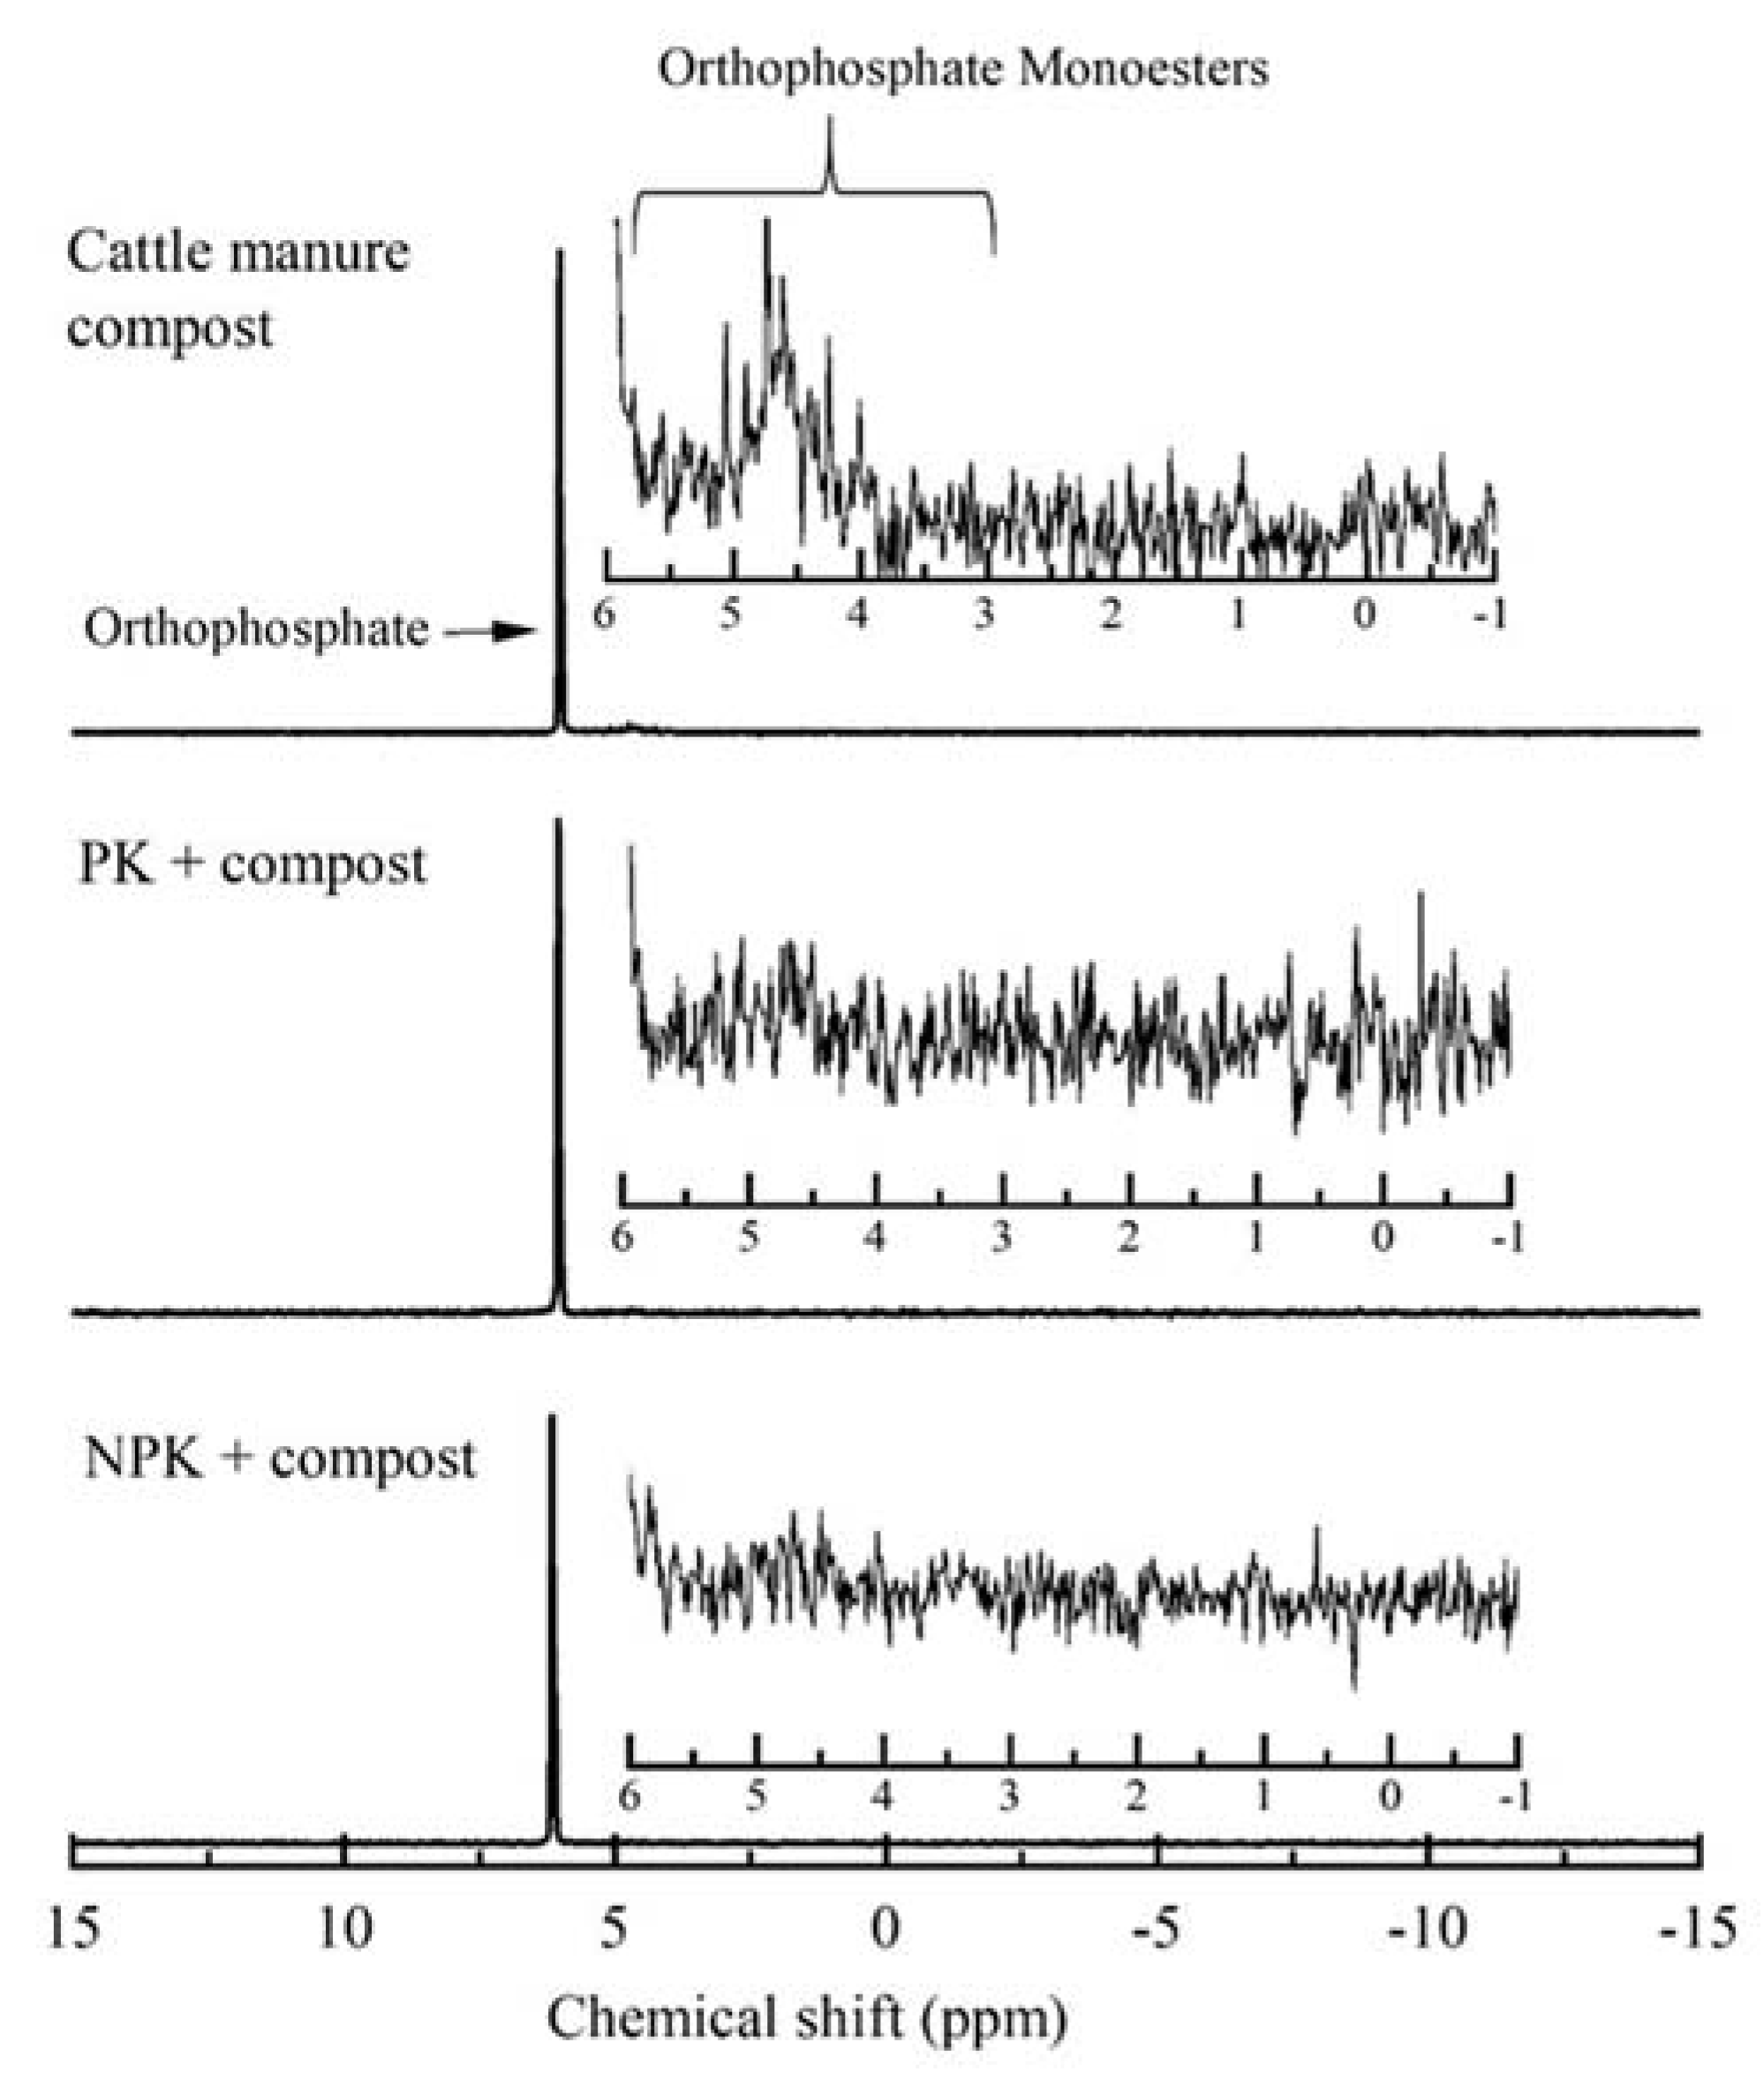
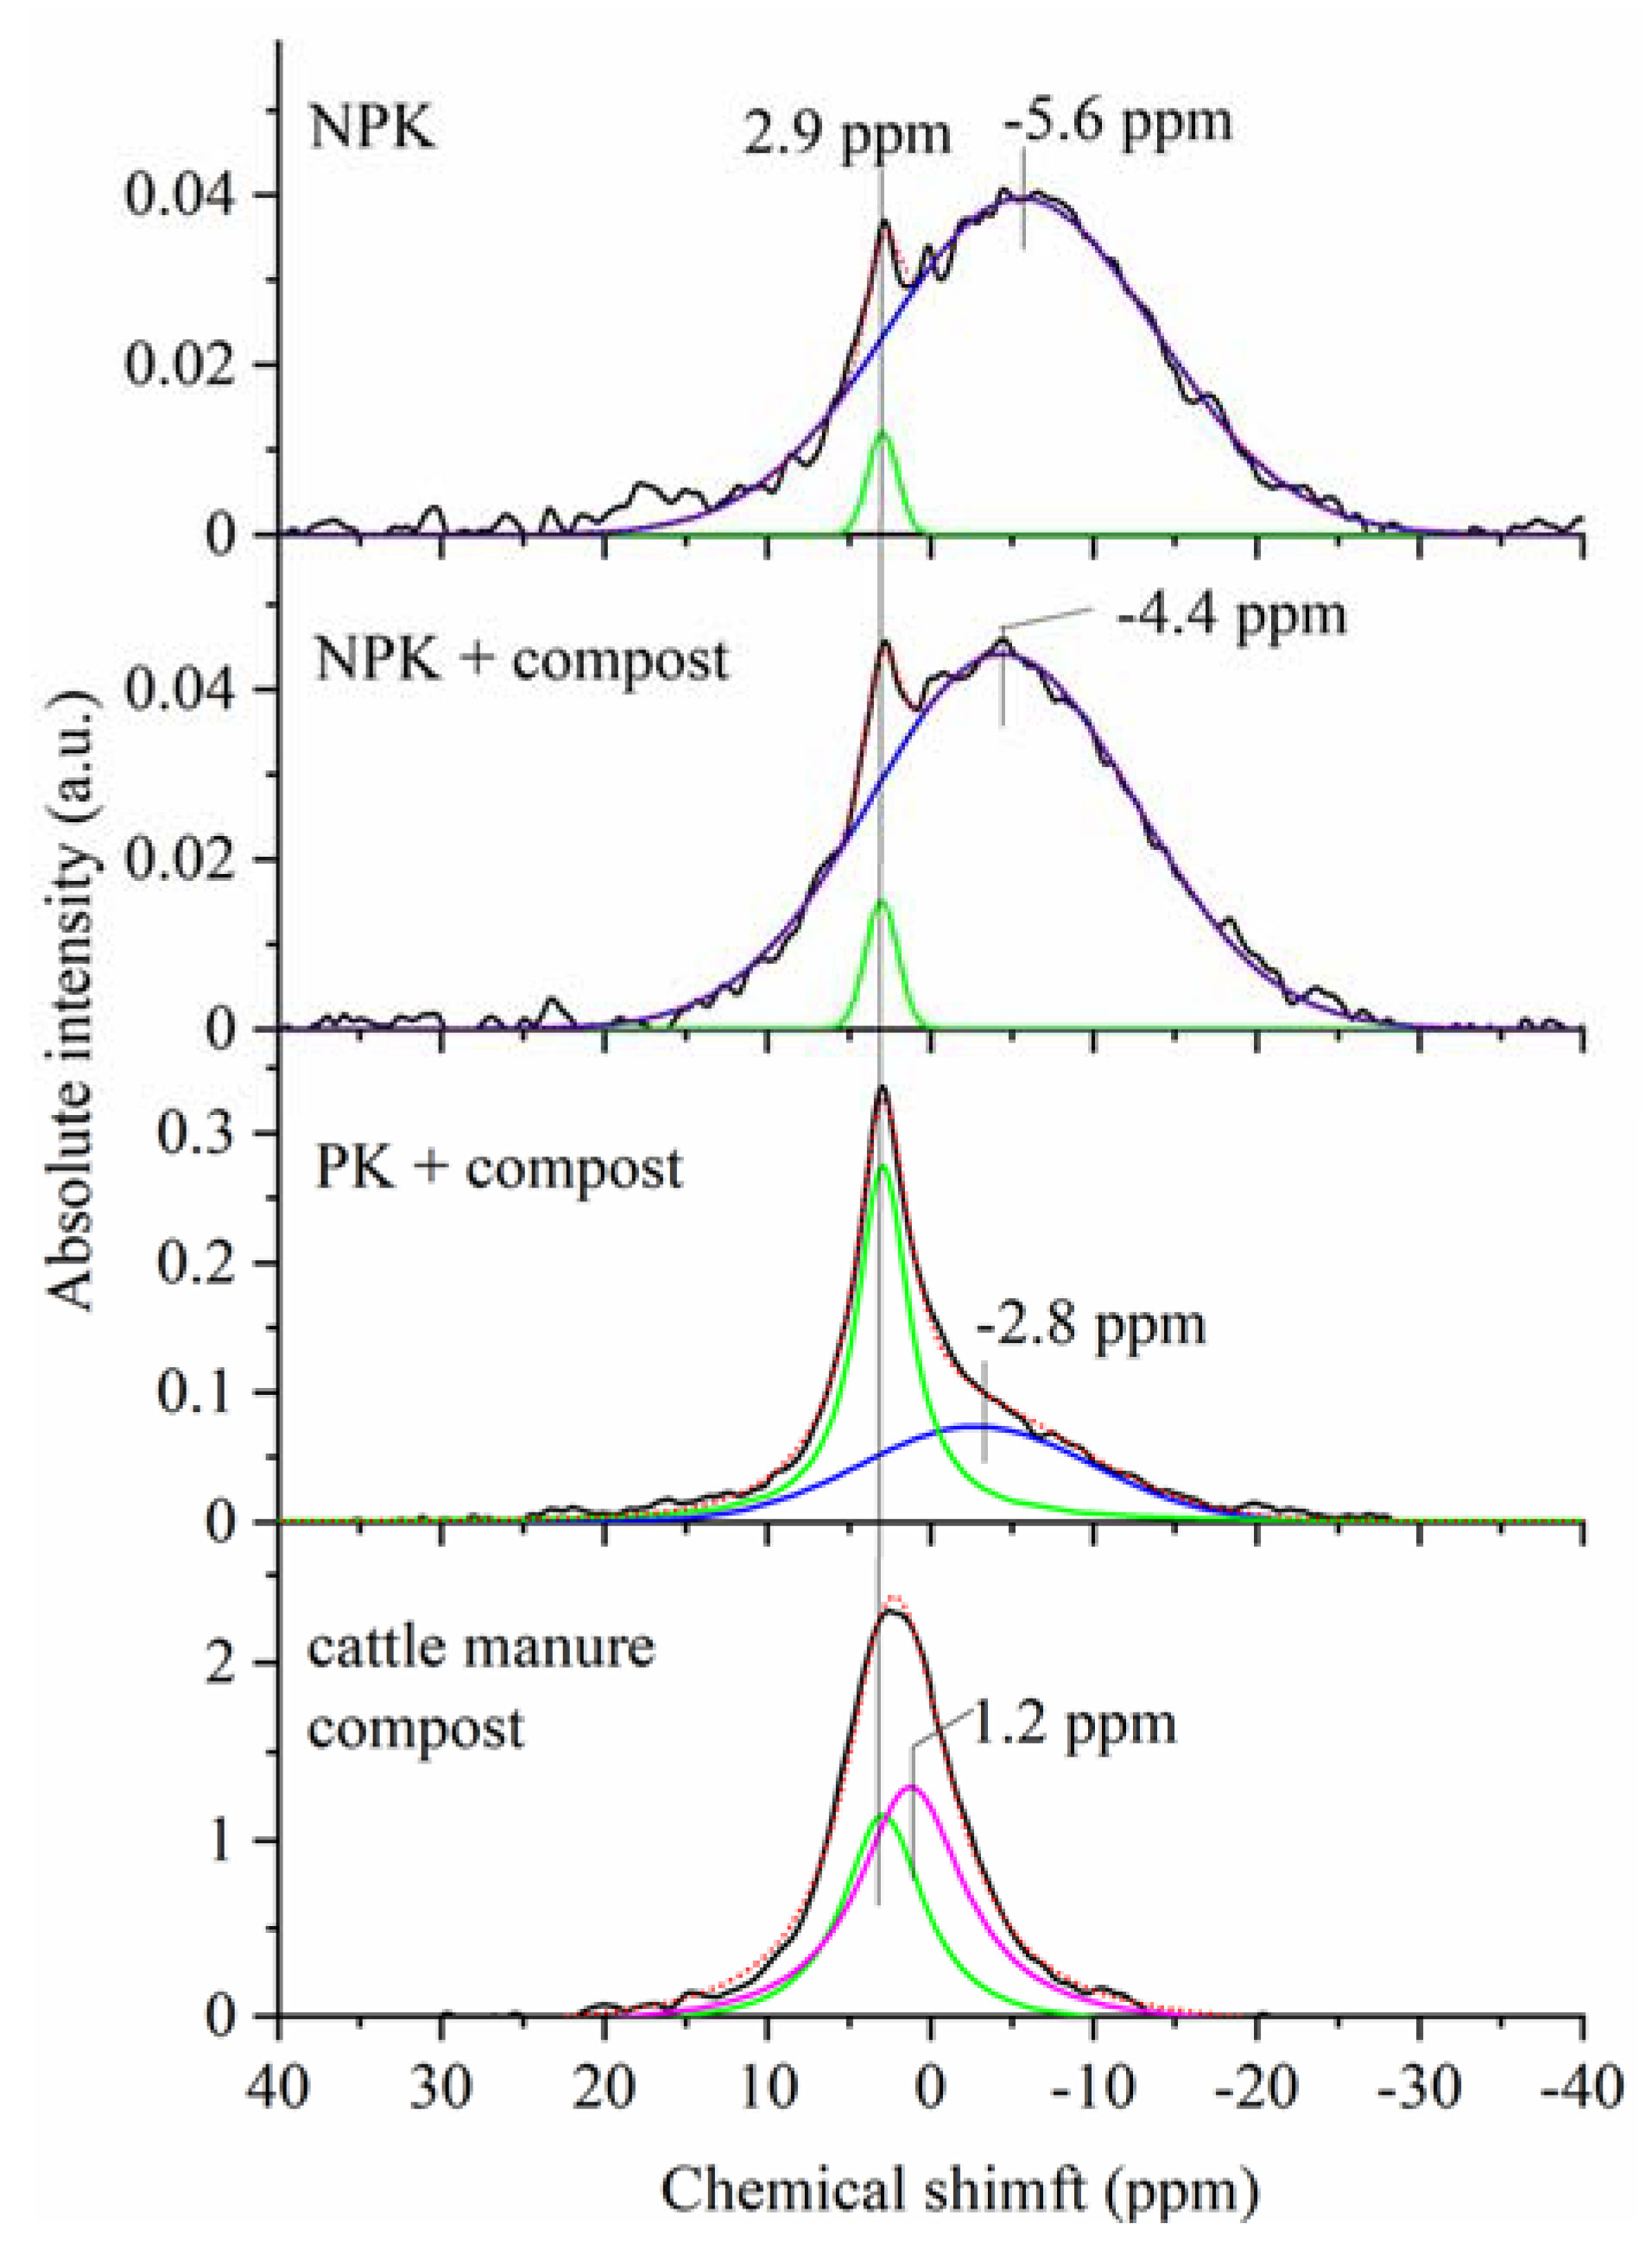
3.3. Phosphorus Speciation by 31P-NMR

Liquid-state 31P NMR spectra showed that dominant soil P species extracted with the NaOH-EDTA solution were inorganic orthophosphates regardless of the treatment. Note that more than 88% of total phosphorus was extracted by NaOH-EDTA (Table 3). Only trace amounts of orthophosphate monoesters were detected in the NaOH-EDTA extracts from the cattle manure compost, and none were detected in extracts from the compost-amended soils (Figure 2). Organic P is decomposed during the composting processes [45]. The small proportion of organic P in cattle manure compost (10% of total P) was consistent with the reported proportions of organic P in cattle manure compost produced in Japan [45].
Solid-state 31P NMR spectra of soils were different among the treatments. The peak at a chemical shift of 2.9 ppm was deconvoluted from the baseline-subtracted NMR spectra and its peak area increased in the order of NPK < NPK + compost < PK + compost (Figure 3, Supplementary Table S2). The chemical shift of this peak was assigned to hydroxyapatite, which can be distinguished from CaHPO4·2H2O (brushite), Ca(H2PO4)2·H2O, and other calcium phosphate minerals [46] (Supplementary Figure S4). One broad peak of cattle manure compost was deconvoluted into two peaks centered at 2.9 and 1.2 ppm, respectively (Figure 3), indicating that hydroxyapatite was added to soil from cattle manure compost [45]. The peak at 1.2 ppm corresponded to that of CaHPO4·2H2O (Supplementary Figure S4) suggesting the presence of soluble calcium phosphate species in the cattle manure compost. The broad peaks centered at −5.6, −4.4, and −2.8 ppm were also identified in NPK, NPK + compost, and PK + compost, respectively (Figure 3). These broad peaks indicate the presence of different unresolved chemical species of P in the soils. Reported chemical shifts range from −25 to −7 for Al-P species [26,47] and −4.4 to 9 ppm for Ca-P species [46,48]. The downfield shift of the broad peak centers from −5.6 to −2.8 ppm arose from the increased contribution of Ca bearing species, in line with the results from LCF of XANES spectra.

3.4. Complementary P Speciation Using Extraction and Spectroscopic Techniques

Our study using P K-edge XANES spectroscopy in combination with solid and solution-state 31P NMR spectroscopy revealed the accumulation of hydroxyapatite in the soils with repeated applications of amendments containing cattle manure compost (Figure 1 and Figure 3). This conclusion was drawn from the following evidence: (i) the result of solution 31P NMR demonstrated that inorganic P species contributed largely to the increase of P in compost-amended soils, (ii) the result of P K-edge XANES narrowed the P species down to Ca phosphate compounds, and (iii) solid-state 31P NMR finally identified a distinct signal assigned to hydroxyapatite in compost-amended soils, in addition to the other undefined P species that are associated with Ca. These results concur with recommendations to combine multiple spectroscopic techniques to better identify specific P species in soils and environmental samples [49,50]. The use of P K-edge XANES alone may fail to identify specific P species due to a close similarity in the XANES spectra among Ca phosphate compounds [51] or organic P compounds [52]. Unequivocal identification of specific Ca phosphate species in environmental samples is challenging, even by combining P K-edge and L-edge XANES spectroscopies [53,54]. A combination of solid state 31P NMR with liquid state 31P NMR and P K-edge XANES was a more powerful approach to directly show the presence of or improving the accuracy of quantifying hydroxyapatite in P-amended soils with moderate P contents (1000 mg·kg−1). However, poorly crystalline phases are difficult to identify by solid-state NMR. It should be noted that Ca-P included species other than hydroxyapatite which were not identified by solid-state NMR. Accurate determination and quantification of soil P species contribute to the prediction and understanding of short and long-term P dynamics and cycles in the terrestrial environment.
Single and sequential chemical extractions provided complementary information on P speciation determined using molecular spectroscopic techniques. Our study found a remarkable increase of Truog-P and Ac-P in NPK + compost and PK + compost plots (Table 3). The proportion of Truog-P and Ac-P to total P (Table 3) corresponded approximately to the proportion of Ca-P determined by LCF of bulk XANES spectra (Figure 1, Supplementary Figure S5), suggesting that, for the soils analyzed here, the use of Truog-P and Ac-P can evaluate soil P associated with Ca [8,16] although quantitative evaluation of the contribution of hydroxyapatite was difficult. The increase of Ca-P by the continuous application of compost (Table 3, Figure 1 and Figure 3) was also observed in the experimental fields with a long-term manure application using bulk XANES spectroscopy [15,49,55]. The difference in total P between NPK and PK + compost plots was close to those differences in Truog-P and Ac-P, suggesting that the excess P added with cattle manure compost was accumulated as Ca-P. In the NPK + compost plot, contrarily, the increase of excess P added from cattle manure compost was likely accumulated as an essentially non-extractable form (Table 3).
Hydroxyapatite in the soils from NPK + compost and PK + compost plots was likely derived from cattle manure compost. Cattle manure compost was found to contain hydroxyapatite, which is a Ca-phosphate of lower solubility, and CaHPO4 and struvite (MgNH4PO4 6H2O) of higher solubility [45] (Supplementary Figure S3). The accumulation of hydroxyapatite particularly in the PK + compost plot was also enhanced by higher pH and Ca concentration, which is a thermodynamically favorable condition to stabilize P as hydroxyapatite [40], than the other plots (Table 2).
Proportions of NH4F-P and NaOH-P, which is designed to target Al- and Fe-associated P (Al-P and Fe-P) [8], did not correspond with proportions determined by LCF of XANES spectra (Table 2, Figure 1). Although 19–24% of total P was extracted as P associated with Fe by the sequential extraction, bulk XANES showed no visible pre-edge feature for Fe-P (Figure 1). A destructive sequential extraction is perhaps not highly specific to the species that it is intended to target. In addition, it was possible that XANES could not identify Fe-P corresponding to c.a. 20% of total P. The method to determine P associated with Al and Fe bearing phase in soils separately remains an experimental challenge.

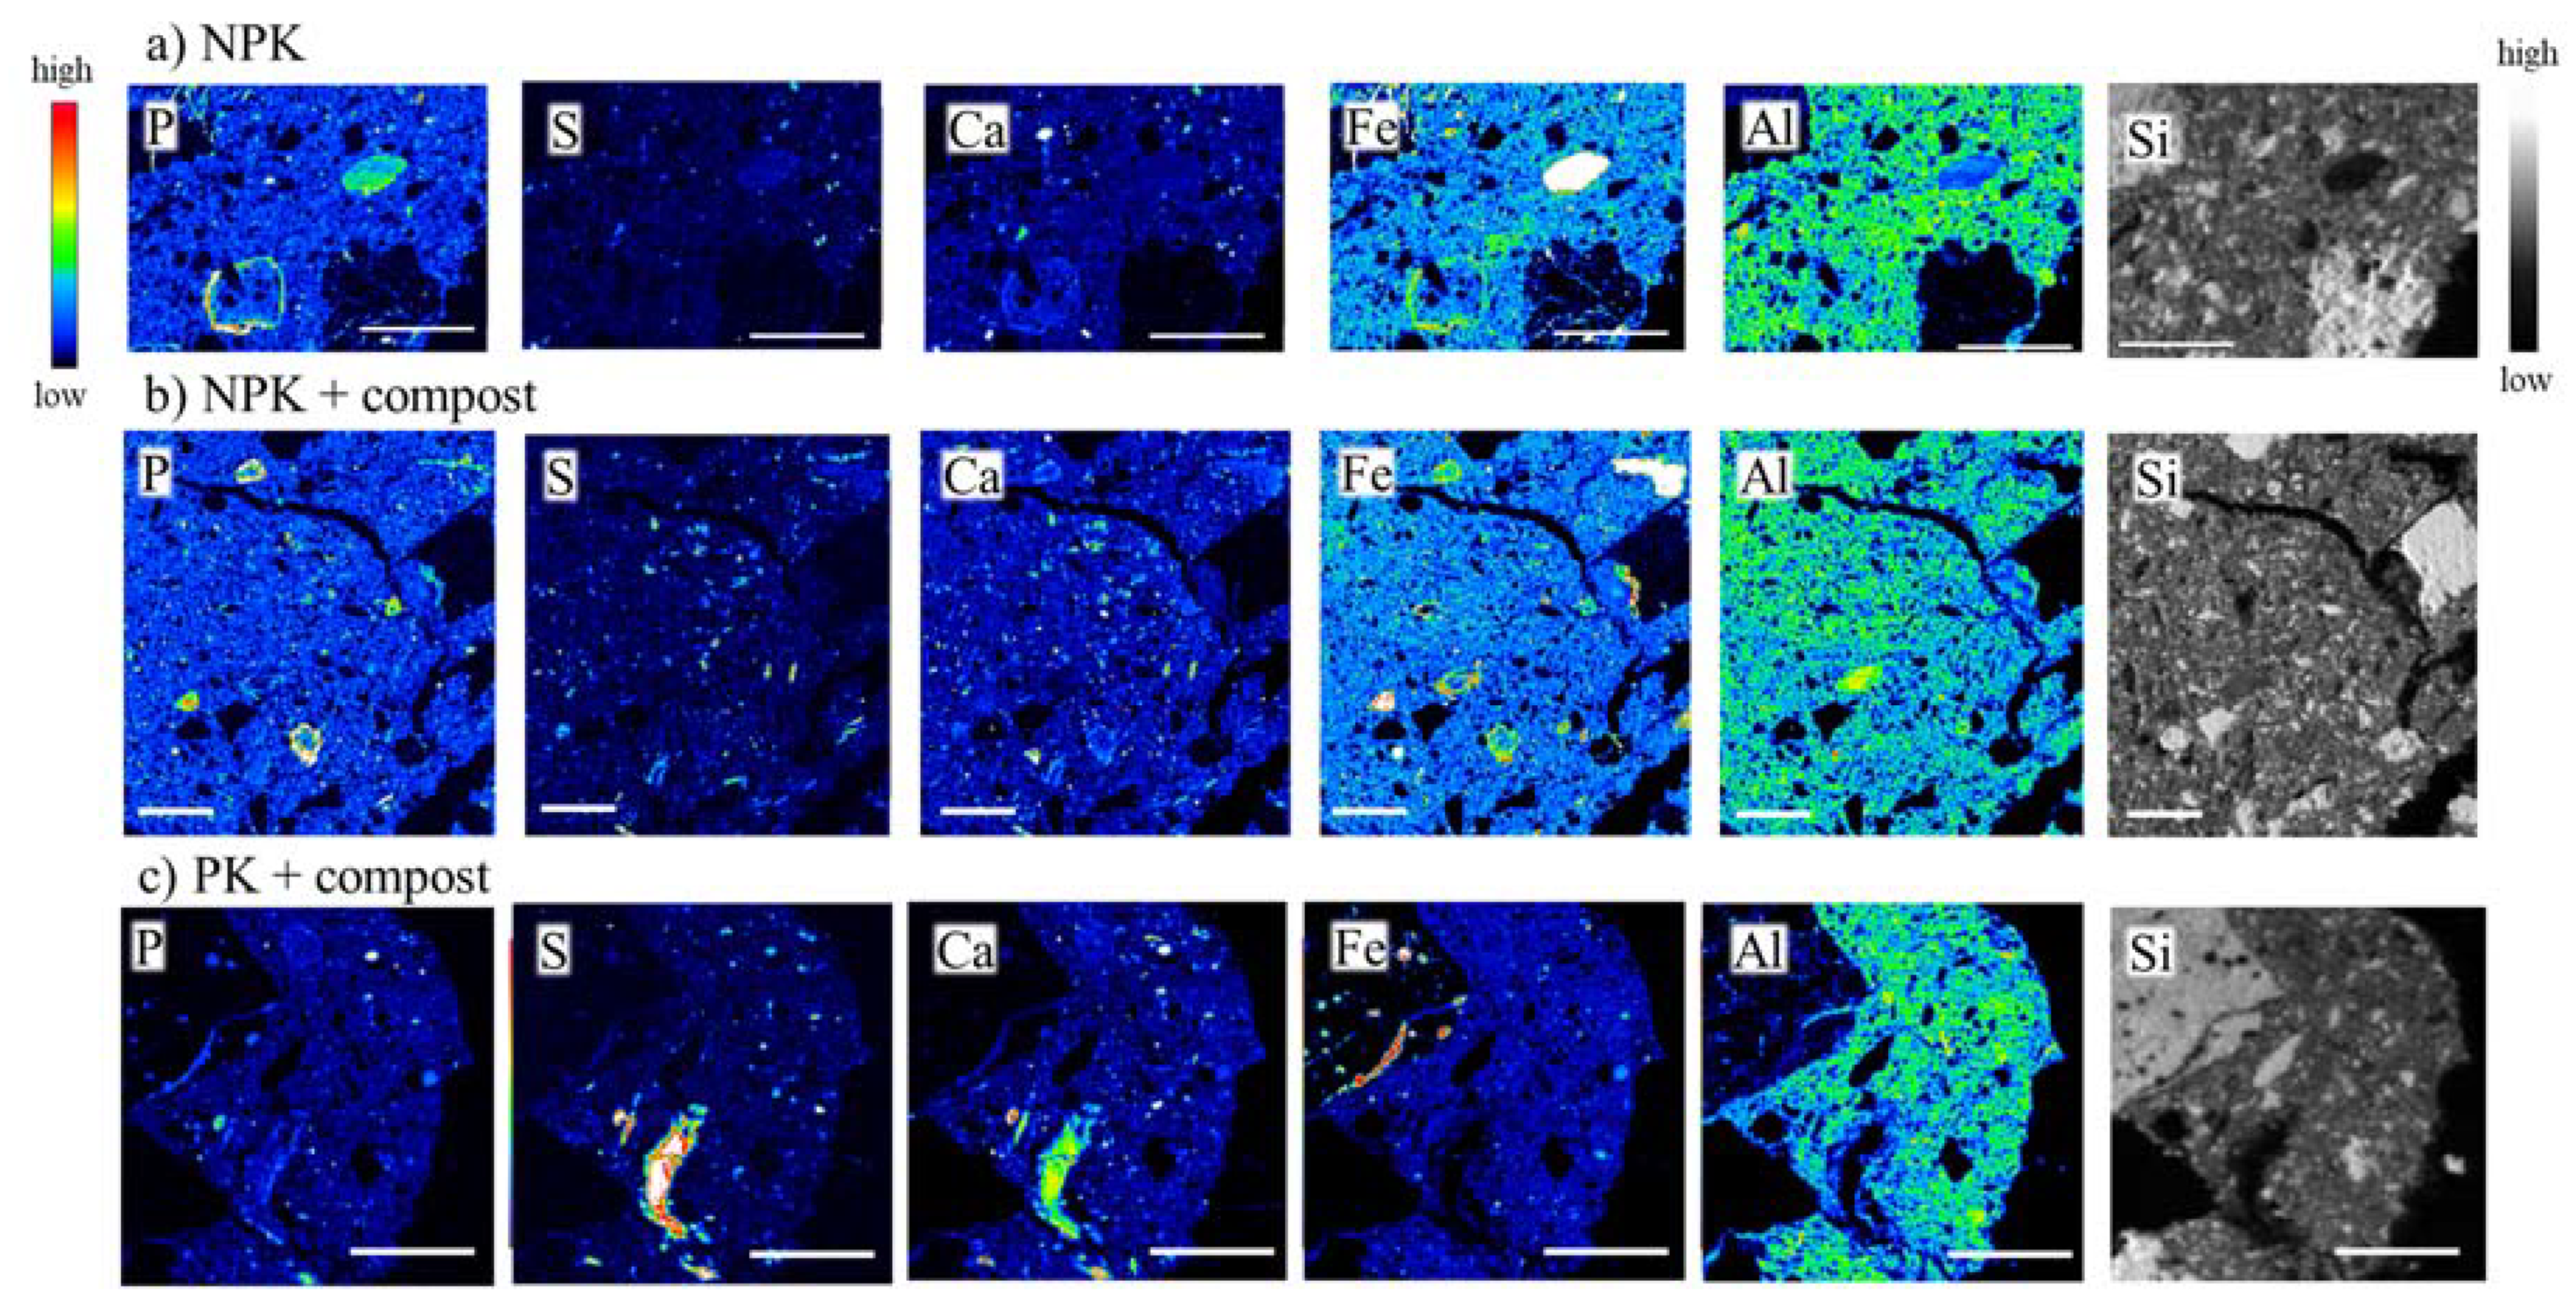
3.5. Microscale Distribution and Speciation of P

For the comparison of microscale distribution of P and relevant elements among soils amended with different combination of mineral fertilizer and compost, elemental maps of P, S, Ca, Fe, Al, and Si were obtained (Figure 4). The area of analyses on the soil thin-sections are marked in Supplementary Figure S6. In the sections of all samples, aggregates of silicate-rich minerals and fine aluminosilicate minerals were distributed. Phosphorus was distributed across the soil particles except for being absent on the Si-rich aggregates and hot spots.
In the soil thin-section from the NPK plot, ~10-µm hot spots of P were colocalized with Ca (Figure 4a). The µ-XANES spectrum of spot 1 in the NPK soil thin-section resembled that of hydroxyapatite whereas that of spot 2 did not have distinct features indicative of hydroxyapatite and other calcium phosphate compounds (Figure 5a,d). Hotspots of P and Fe were co-localized around spot 3 and 4 in the NPK soil (Figure 4a and Figure 5a). However, the µ-XANES spectra in these spots resembled that of P adsorbed on gibbsite and did not have a pre-edge feature of Fe-P nor a post-edge feature of Ca-P (Figure 5a,d). The µ-XANES spectra on the P hot spot in the soil section of NPK at the depth from 3–6 cm also resembled that of P adsorbed on gibbsite (spots 14 and 15 in Supplementary Figure S7a). These µ-XANES spectra of NPK soil thin-section were characterized by a higher intensity of white line peaks than those of NPK + compost and PK + compost, indicating the presence of adsorbed Al-bonded PO4 [41].
Most of the P hot spots in the NPK + compost (0–3 cm depth) thin section were colocalized with Fe (Figure 4b). The µ-XANES spectra of spot 6–9 (Figure 5b) had a clear pre-edge feature of Fe-P as was observed in the standard of P adsorbed on ferrihydrite (Figure 5e) despite the absence of pre-edge feature of Fe-P by bulk XANES analyses (Figure 1). Spot 5 was a lower intensity spot of P, and the µ-XANES spectra on this spot resembled that of P adsorbed on gibbsite and did not have a pre-edge feature of Fe-P (Figure 5e). The soil thin-section of NPK + compost at the depth of 3–6 cm also had P hot spots associated with Fe (spot A in Supplementary Figure S8) and Ca (spot B in Supplementary Figure S8). However, the µ-XANES spectra of spots 16‒18 did not have distinct features of Fe-P and Ca-P (Supplementary Figure S7b). The hot spots of S tended to co-localize with those of Ca (Figure 4b, Supplementary Figure S8b), suggesting the presence of Ca associated with a S-bearing phase such as organic matter. These Ca hot spots were not always associated with those of P.
Hot spots of P were mostly associated with Ca in the soil thin-section of PK + compost (Figure 4c, Supplementary Figure S8c), and the µ-XANES spectra on the spot 10–13 and 19–21 had a post-edge feature of Ca-P (Figure 5f, Supplementary Figure S7c). Sulfur was co-located with Ca in the PK + compost thin-section (Figure 4c, Supplementary Figure S8c). In contrast to NPK and NPK + compost soils, the distribution of P hot spots did not correspond to Fe in PK + compost soil.

3.6. Accumulation Mechanisms of P in Soil Microsites

The result of µ-XRF demonstrated that hot spots of P were heterogeneously distributed on a diffuse background of lower P concentrations in the soils from all treatment plots. The spot 5 in the NPK + compost soil (Figure 5b), for example, represented a low concentration diffuse background where the µ-XANES spectrum indicated the presence of Al-P (Figure 5e). The LCF on the bulk XANES spectrum also indicated Al-P as a primary P species in the NPK + compost soil (83%, Figure 1), as also shown by previous studies [20,22]. In the area of diffuse P background, the concurrence of Al and Si revealed that aluminosilicate minerals, such as smectite and kaolinite, may retain P to some extent in the NPK + compost soil [43,44].
When P was applied as mineral fertilizer, dominant P species in hot spots were similar to those in the diffuse background, most likely phosphate adsorbed on Al-bearing minerals including aluminosilicate [43,44]. At spots 3 and 4 in the NPK soil (Figure 5a), the EPMA map showed co-occurrence of P with Fe (Figure 4a), but the pre-edge feature of Fe-P was not obvious in the µ-XANES spectra (Figure 5d). In contrast, the element co-localization (Figure 4b) and XANES of the hotspots (Figure 5e) in the NPK-compost soil indicated the presence of Fe-associated PO4. Although P and Ca were co-located at spot 1 and 2 (Figure 4a), the µ-XANES spectrum collected from spot 1 only had a post-white line shoulder indicative of Ca-P (Figure 5d). It is possible that the µ-XANES spectra were affected by P species on the diffuse matrix because the beam size for µ-XANES analyses might be larger than the size of hot spot. Since exchangeable Ca contents were lower in NPK plot than NPK + compost and PK + compost plots (Table 2), size of Ca-P at microsite may be smaller. In addition, XANES possibly demonstrates that physical co-localization on a microscale does not necessarily mean that these phosphate ions are chemically bonded with Fe or Ca on a nanometer/molecular scale.
When cattle manure compost was also applied to the soils with mineral fertilizer (NPK + compost and PK + compost), P species in hot spots were different from those in the diffuse background. The P was mainly accumulated as Fe-P on Fe-hydroxide deposits around soil aggregates for the NPK + compost treatment (Figure 4b), while it was associated with Ca in samples from the PK + compost plot. These differences can be explained by the higher pH and Ca concentration in these plots (Table 2). In the NPK + compost plot samples (pH 6), Ca-P supplied from cattle manure compost was apparently dissolved under a lower pH condition [43] and apparently taken up in part for cabbage growth. Then, our results (Figure 4b and Figure 5e) indicate that Fe hydroxides deposited around soil aggregates served as a sink of excess P dissolved from fertilizer or compost because P is preferentially adsorbed on Fe hydroxides relative to Al-bearing phases [56,57]. The application of organic amendment results in an increased P sorption capacity because organic materials induce the dissolution of crystalline minerals, and the subsequent increase of surface area of partially dissolved minerals due to the re-precipitation of poorly crystalline minerals [13]. However, controversial results showing decreased P retention have also been reported [24,58]. The dissolution and deposition of Fe hydroxides may be facilitated by enhanced microbial activity [59] in soil microsites caused by the application of metabolizable carbon from the organic compost amendment. The excess P was possibly immobilized as Fe-P at microsites while dominant P was associated with Al-bearing phase as shown by bulk XANES spectra (Figure 1).
Concurrence of P and Fe in hot spots was also found on the EPMA map of PK + compost plot (Figure 4c, Supplementary Figure S8c). However, the relative abundance of P on the hot spots associated with Fe was less than those with Ca. It was likely that the dissolution of Ca-P in the PK + compost soil was limited because of the alkaline pH, and therefore excess P was not adsorbed on Fe hydroxides as indicated by µ-XANES in the NPK + compost soil (Figure 5e). Phosphorus was heterogeneously accumulated as Ca-P in the hot spots of PK + compost plot (Figure 4c) in which the cabbage yield was low due to the deficiency of N fertilizer (Supplementary Table S3). The relatively sharp features at higher energy (2167 and 2170 eV) of µ-XANES spectra (Figure 5f) are indicative of a crystalline species, and their position and shape match apatite. These results suggested that Ca-P supplied from cattle manure compost remained undissolved at microscale hot spots in the PK + compost plot due to the higher pH and Ca concentration (Table 2, Figure 1 and Figure 3).

3.7. Complementary P Speciation Using Macro- and Micro-Spectroscopic Techniques

The microsite speciation of P by µ-XANES provided additional information that was not apparent from bulk XANES. In the soil from the NPK + compost plot, for example, the presence of Ca-P was determined by bulk XANES (Figure 1) together with chemical extraction (Table 3) and solid-state 31P NMR (Figure 3). Nevertheless, the µ-XANES analyses for the NPK + compost soil did not show the presence of Ca-P species in the hot spots (Figure 5e, Supplementary Figure S7b), even though Ca and P were co-located on the EPMA map (Figure 4b). It is possible that the size of Ca-P minerals present in the NPK + compost plot may be smaller than those found in the PK + compost plot probably because of chemical dissolution at the lower pH. As a consequence, Ca-P was not detected in µ-XANES. For the NPK + compost plot, moreover, the pre-edge feature indicative of Fe-P was absent in the bulk XANES spectra (Figure 1b, Supplementary Figure S1), whereas the µ-XANES spectra collected from P hot spots clearly indicated the presence of Fe-P (Figure 5e). Other studies have indicated that minor P species representing <5% of total P were difficult to detect by LCF of P K-edge XANES spectra [42,60]. The contribution of Fe-P may also be underestimated by LCF of XANES if P was present as organic forms [17]. In our samples, only inorganic orthophosphates were detected by 31P NMR spectra of EDTA-NaOH soil extracts, and the contribution of organic P was almost nil despite the higher extraction efficiency of organic P than inorganic P [35,61] and possible degradation of organic P during extraction [62]. Therefore, the underestimation of Fe-P due to the presence of organic P was unlikely in this study. An important finding of our study is that µ-XANES can probe P species heterogeneously distributed in microscales which cannot be revealed using the bulk XANES technique, consistent with other studies showing that microscale XANES speciation reveal a greater diversity of P species in soil [18,63]. The use of µ-XRF-XANES in combination with the bulk XANES and NMR provides special information on microscale P distribution and overall speciation, allowing comprehensive understanding of complex soil systems.

4. Conclusions

Results from XANES and NMR speciation analysis of P in soils that were amended for eight years with mineral fertilizer with and without cattle manure compost indicated mainly inorganic phosphate associated with Al bearing minerals. Sequential extractions showed similar trends between the phosphate in the extraction solution targeting Ca bonded phosphate and Ca species determined by LCF of bulk XANES spectra. However, no such trends were found between extractions and XANES species comprising Al and Fe bonded phosphate. On the microscale, part of the P was co-localized into hot spots with Ca and Fe. When composted manure was applied with mineral fertilizer, the excess P was accumulated into different microscale chemical associations, depending on soil pH, with Ca-P at soil pH > 7 and Fe-P at pH near 6. Similar to biodiversity stabilizing a sustainable ecosystem, enhancing the physicochemical and biological diversity of microsite P in soils could benefit the sustainable use of soil, which is potentially achieved by the application of organic amendments.

Supplementary Materials

The following are available online at https://www.mdpi.com/2075-163X/11/2/121/s1, Table S1: Composition of cattle manure compost. Table S2: Peak deconvolution results of solid state 31P NMR, Table S3: Yield of cabbage heads, Figure S1: Overlaid view of P K-edge spectra of soils, Figure S2: Normalized P K-edge XANES spectra of standard materials used for linear combination, Figure S3: Normalized P K-edge XANES spectra of cattle manure compost, Figure S4: Solid state 31P NMR spectra of standard materials. Figure S5: Comparison of results of LCF with chemical extraction, Figure S6: Scanned image of soil thin-sections, Figure S7: µ-XRF and µ-XANES for soil thin-sections at the depth of 3–6 cm, Figure S8: EPMA results for soil thin-sections at the depth of 3–6 cm.

Author Contributions

Conceptualization, N.Y. and T.O.; methodology, P.N.; software, P.N.; validation, Y.H. and A.S.; formal analysis, N.Y.; investigation, N.Y, T.O., A.H., Y.H., A.S., T.Y., K.A., M.K., P.N. and S.-L.W.; resources, T.Y., K.A. and M.K.; data curation, N.Y.; writing—original draft preparation, N.Y. and Y.H.; writing—review and editing, D.H., P.N. and S.-L.W.; visualization, N.Y.; supervision, N.Y.; project administration, N.Y.; funding acquisition, N.Y. All authors have read and agreed to the published version of the manuscript.

Funding

This research was funded by JSPS KAKENHI Grant Number 18H02116.

Institutional Review Board Statement

Not applicable.

Informed Consent Statement

Not applicable.

Acknowledgments

This research used the TES (8-BM) beamline of the National Synchrotron Light Source II, a U.S. Department of Energy (DOE) Office of Science User Facility operated for the DOE Office of Science by Brookhaven National Laboratory under Contract No. DE-SC0012704. Synchrotron X-ray experiments were also performed under approval of Aichi SR (Proposal No. 201805013, 2019L4002) and SPring-8 (Proposal No. 2018B1255, 2019B1126). We thank Y. Tamenori for technical support at SPring-8. Liquid- and solid-state NMR experiment was conducted at Advanced analyses center, NARO.

Conflicts of Interest

The authors declare no conflict of interest. The funders had no role in the design of the study; in the collection, analyses, or interpretation of data; in the writing of the manuscript, or in the decision to publish the results.

References

  1. Diacono, M.; Montemurro, F. Long-term effects of organic amendments on soil fertility. A review. Agron. Sustain. Dev. 2010, 30, 401–422. [Google Scholar] [CrossRef] [Green Version]
  2. Keesstra, S.D.; Bouma, J.; Wallinga, J.; Tittonell, P.; Smith, P.; Cerda, A.; Montanarella, L.; Quinton, J.N.; Pachepsky, Y.; van der Putten, W.H.; et al. The significance of soils and soil science towards realization of the united nations sustainable development goals. Soil 2016, 2, 111–128. [Google Scholar] [CrossRef] [Green Version]
  3. Daniel, T.C.; Sharpley, A.N.; Lemunyon, J.L. Agricultural phosphorus and eutrophication: A symposium overview. J. Environ. Qual. 1998, 27, 251–257. [Google Scholar] [CrossRef] [Green Version]
  4. Stutter, M.I.; Shand, C.A.; George, T.S.; Blackwell, M.S.A.; Dixon, L.; Bol, R.; MacKay, R.L.; Richardson, A.E.; Condron, L.M.; Haygarth, P.M. Land use and soil factors affecting accumulation of phosphorus species in temperate soils. Geoderma 2015, 257, 29–39. [Google Scholar] [CrossRef]
  5. Vaughan, R.E.; Needelman, B.A.; Kleinman, P.J.A.; Allen, A.L. Vertical distribution of phosphorus in agricultural drainage ditch soils. J. Environ. Qual. 2007, 36, 1895–1903. [Google Scholar] [CrossRef] [Green Version]
  6. Hedley, M.J.; Stewart, J.W.B.; Chauhan, B.S. Changes in organic and inorganic-phosphorus fractions induced by cultivation practices and laboratory incubations. Soil Sci. Soc. Am. J. 1982, 46, 970–976. [Google Scholar] [CrossRef]
  7. Chang, S.C.; Jackson, M.L. Fractionation of soil phosphorus. Soil Sci. 1957, 84, 133–144. [Google Scholar] [CrossRef]
  8. Sekiya, K. Phosphorus. In Methods of Soil Analysis; Bunsekihou, D.Y., Ed.; Yokendo: Tokyo, Japan, 1983. (In Japanese) [Google Scholar]
  9. Condron, L.M.; Newman, S. Revisiting the fundamentals of phosphorus fractionation of sediments and soils. J. Soils Sediments 2011, 11, 830–840. [Google Scholar] [CrossRef]
  10. Gu, C.; Dam, T.; Hart, S.C.; Turner, B.L.; Chadwick, O.A.; Berhe, A.A.; Hu, Y.; Zhu, M. Quantifying uncertainties in sequential chemical extraction of soil phosphorus using XANES spectroscopy. Environ. Sci. Technol. 2020, 54, 2257–2267. [Google Scholar] [CrossRef]
  11. Hinedi, Z.R.; Chang, A.C. Solubility and P-31 magic angle spinning nuclear magnetic resonance of phosphorus in sludge amended soils. Soil Sci. Soc. Am. J. 1989, 53, 1057–1061. [Google Scholar] [CrossRef]
  12. Beauchemin, S.; Hesterberg, D.; Chou, J.; Beauchemin, M.; Simard, R.R.; Sayers, D.E. Speciation of phosphorus in phosphorus-enriched agricultural soils using X-ray absorption near-edge structure spectroscopy and chemical fractionation. J. Environ. Qual. 2003, 32, 1809–1819. [Google Scholar] [CrossRef]
  13. Abdala, D.B.; da Silva, I.R.; Vergutz, L.; Sparks, D.L. Long-term manure application effects on phosphorus speciation, kinetics and distribution in highly weathered agricultural soils. Chemosphere 2015, 119, 504–514. [Google Scholar] [CrossRef]
  14. Koch, M.; Kruse, J.; Eichler-Lobermann, B.; Zimmer, D.; Willbold, S.; Leinweber, P.; Siebers, N. Phosphorus stocks and speciation in soil profiles of a long-term fertilizer experiment: Evidence from sequential fractionation, P K-edge XANES, and P-31 NMR spectroscopy. Geoderma 2018, 316, 115–126. [Google Scholar] [CrossRef]
  15. Sato, S.; Solomon, D.; Hyland, C.; Ketterings, Q.M.; Lehmann, J. Phosphorus speciation in manure and manure-amended soils using XANES spectroscopy. Environ. Sci. Technol. 2005, 39, 7485–7491. [Google Scholar] [CrossRef]
  16. Ando, K.; Yamaguchi, N.; Nakamura, Y.; Kasuya, M.; Taki, K. Speciation of phosphorus accumulated in fertilized cropland of Aichi prefecture in Japan with different soil properties by sequential chemical extraction and P K-edge XANES. Soil Sci. Plant Nutr. 2021. [Google Scholar] [CrossRef]
  17. Prietzel, J.; Harrington, G.; Hausler, W.; Heister, K.; Werner, F.; Klysubun, W. Reference spectra of important adsorbed organic and inorganic phosphate binding forms for soil P speciation using synchrotron-based K-edge XANES spectroscopy. J. Synchrotron Radiat. 2016, 23, 532–544. [Google Scholar] [CrossRef]
  18. Vogel, C.; Rivard, C.; Tanabe, I.; Adam, C. Microspectroscopy—Promising techniques to characterize phosphorus in soil. Commun. Soil Sci. Plant Anal. 2016, 47, 2088–2102. [Google Scholar] [CrossRef]
  19. Lombi, E.; Scheckel, K.G.; Armstrong, R.D.; Forrester, S.; Cutler, J.N.; Paterson, D. Speciation and distribution of phosphorus in a fertilized soil. Soil Sci. Soc. Am. J. 2006, 70, 2038–2048. [Google Scholar] [CrossRef]
  20. Rivard, C.; Lanson, B.; Cotte, M. Phosphorus speciation and micro-scale spatial distribution in North-American temperate agricultural soils from micro X-ray fluorescence and X-ray absorption near-edge spectroscopy. Plant Soil 2016, 401, 7–22. [Google Scholar] [CrossRef]
  21. Liu, J.; Sui, P.; Cade, B.; Hu, Y.F.; Yang, J.J.; Huang, S.M.; Ma, Y.B. Molecular-level understanding of phosphorus transformation with long-term phosphorus addition and depletion in an alkaline soil. Geoderma 2019, 353, 116–124. [Google Scholar] [CrossRef]
  22. Werner, F.; Mueller, C.W.; Thieme, J.; Gianoncelli, A.; Rivard, C.; Hoschen, C.; Prietzel, J. Micro-scale heterogeneity of soil phosphorus depends on soil substrate and depth. Sci. Rep. 2017, 7, 3203. [Google Scholar] [CrossRef] [PubMed]
  23. Gamble, A.V.; Northrup, P.; Sparks, D.L. Elucidation of soil phosphorus speciation in mid-Atlantic soils using synchrotron-based microspectroscopic techniques. J. Environ. Qual. 2020, 49, 184–193. [Google Scholar] [CrossRef] [PubMed]
  24. Nobile, C.M.; Bravin, M.N.; Becquer, T.; Paillat, J.M. Phosphorus sorption and availability in an Andosol after a decade of organic or mineral fertilizer applications: Importance of pH and organic carbon modifications in soil as compared to phosphorus accumulation. Chemosphere 2020, 239. [Google Scholar] [CrossRef] [PubMed]
  25. Luo, L.; Ma, Y.; Sanders, R.L.; Xu, C.; Li, J.; Myneni, S.C.B. Phosphorus speciation and transformation in long-term fertilized soil: Evidence from chemical fractionation and P K-edge XANES spectroscopy. Nutr. Cycl. Agroecosyst. 2017, 107, 215–226. [Google Scholar] [CrossRef]
  26. Lookman, R.; Geerts, H.; Grobet, P.; Merckx, R.; Vlassak, K. Phosphate speciation in excessively fertilized soil: A P-31 and Al-27 MAS NMR spectroscopy study. Eur. J. Soil Sci. 1996, 47, 125–130. [Google Scholar] [CrossRef]
  27. IUSS Working Group. WRB 2006. In World Reference Base for Soil Resources 2006; World Soil Resources Reports No.103; FAO: Rome, Italy, 2006. [Google Scholar]
  28. Yamamoto, T.; Tsuji, M.; Suzuki, R.; Kasuya, M.; Takeuchi, M. Changes of phosphate species in a cabbage field using cattle manure compost. Res. Bull. Aichi Agric. Res. Cent. 2016, 48, 101–107, (In Japanese with English summary). [Google Scholar]
  29. Sumner, M.E.; Miller, W.P. Cation exchange capacity and exchange coefficients. In Methods of Soil Analysis: Part 3 Chemical Methods; Sparks, D.L., Ed.; Soil Science Society of America: Fitchburg, WI, USA, 1996; pp. 1201–1229. [Google Scholar]
  30. Jackson, M.L.; Lim, C.H.; Zelazny, L.W. Oxides, hydroxides, and aluminosilicates. In Methods of Soil Analysis: Part 1—Physical and Mineralogical Methods; Klute, A., Ed.; Soil Science Society of America: Madison, WI, USA, 1986; pp. 101–142. [Google Scholar]
  31. Moriyama, T.; Ikeda, S.; Doi, M.; Fess, S. Trace element analysis using EDXRF with polarized optics. Adv. X Ray Anal. 2011, 54, 289–298. [Google Scholar]
  32. Gee, G.; Bauder, J. Particle-size analysis. In Methods of Soil Analysis: Part 1—Physical and Mineralogical Methods; Klute, A., Ed.; Soil Science Society of America: Madison, WI, USA, 1986; pp. 383–411. [Google Scholar]
  33. Truog, E. The determination of the readily available phosphorus of soils. J. Am. Soc. Agron. 1930, 22, 874–882. [Google Scholar] [CrossRef] [Green Version]
  34. Otani, T.; Ae, N. The status of inorganic and organic phosphorus in some soils in relation to plant availability. Soil Sci. Plant Nutr. 1997, 43, 419–429. [Google Scholar] [CrossRef] [Green Version]
  35. Murphy, J.; Riley, J. A modified single solution method for the determination of phosphate in natural waters. Anal. Chim. Acta. 1962, 27, 31–36. [Google Scholar] [CrossRef]
  36. Cade-Menun, B.; Liu, C.W. Solution phosphorus-31 nuclear magnetic resonance spectroscopy of soils from 2005 to 2013: A review of sample preparation and experimental parameters. Soil Sci. Soc. Am. J. 2014, 78, 19–37. [Google Scholar] [CrossRef] [Green Version]
  37. Ingall, E.D.; Brandes, J.A.; Diaz, J.M.; de Jonge, M.D.; Paterson, D.; McNulty, I.; Elliott, W.C.; Northrup, P. Phosphorus K-edge XANES spectroscopy of mineral standards. J. Synchrotron Radiat. 2011, 18, 189–197. [Google Scholar] [CrossRef] [PubMed] [Green Version]
  38. Ravel, B.; Newville, M. Athena, Artemis, Hephaestus: Data analysis for X-ray absorption spectroscopy using IFEFFIT. J. Synchrotron Radiat. 2005, 12, 537–541. [Google Scholar] [CrossRef] [PubMed] [Green Version]
  39. Northrup, P. The TES beamline (8-BM) at NSLS-II: Tender-energy spatially resolved X-ray absorption spectroscopy and X-ray fluorescence imaging. J. Synchrotron Radiat. 2019, 26, 2064–2074. [Google Scholar] [CrossRef] [PubMed] [Green Version]
  40. Lindsay, W.L. Chemical Equilibria in Soils; John Wiley: New York, NY, USA, 1979. [Google Scholar]
  41. Hesterberg, D.; Zhou, W.Q.; Hutchison, K.J.; Beauchemin, S.; Sayers, D.E. XAFS study of adsorbed and mineral forms of phosphate. J. Synchrotron Radiat. 1999, 6, 636–638. [Google Scholar] [CrossRef]
  42. Gustafsson, J.P.; Braun, S.; Tuyishime, J.R.M.; Adediran, G.A.; Warrinnier, R.; Hesterberg, D. Probabilistic approach to phosphorus speciation of soils using P K-edge XANES spectroscopy with linear combination fitting. Soil Syst. 2020, 4, 26. [Google Scholar] [CrossRef]
  43. Andersson, K.O.; Tighe, M.K.; Guppy, C.N.; Milham, P.J.; McLaren, T.I.; Schefe, C.R.; Lombi, E. XANES demonstrates the release of calcium phosphates from alkaline vertisols to moderately acidified solution. Environ. Sci. Technol. 2016, 50, 4229–4237. [Google Scholar] [CrossRef] [Green Version]
  44. Gerard, F. Clay minerals, iron/aluminum oxides, and their contribution to phosphate sorption in soils—A myth revisited. Geoderma 2016, 262, 213–226. [Google Scholar] [CrossRef]
  45. Komiyama, T.; Ito, T. The characteristics of phosphorus in animal manure composts. Soil Sci. Plant Nutr. 2019, 65, 281–288. [Google Scholar] [CrossRef]
  46. He, Z.Q.; Honeycutt, C.W.; Xing, B.; McDowell, R.W.; Pellechia, P.J.; Zhang, T.Q. Solid-state Fourier transform infrared and P-31 nuclear magnetic resonance spectral features of phosphate compounds. Soil Sci. 2007, 172, 501–515. [Google Scholar] [CrossRef]
  47. Li, W.; Pierre-Louis, A.M.; Kwon, K.D.; Kubicki, J.D.; Strongin, D.R.; Phillips, B.L. Molecular level investigations of phosphate sorption on corundum (alpha-Al2O3) by P-31 solid state NMR, ATR-FTIR and quantum chemical calculation. Geochim. Cosmochim. Acta 2013, 107, 252–266. [Google Scholar] [CrossRef]
  48. Frossard, E.; Tekely, P.; Grimal, J.Y. Characterization of phosphate species in urban sewage sludges by high-resolution solid-state P-31 NMR. Eur. J. Soil Sci. 1994, 45, 403–408. [Google Scholar] [CrossRef]
  49. Kruse, J.; Abraham, M.; Amelung, W.; Baum, C.; Bol, R.; Kühn, O.; Lewandowski, H.; Niederberger, J.; Oelmann, Y.; Rüger, C.; et al. Innovative methods in soil phosphorus research: A review. J. Plant Nutr. Soil Sci. 2015, 178, 43–88. [Google Scholar] [CrossRef] [PubMed] [Green Version]
  50. Hashimoto, Y.; Takamoto, A.; Kikkawa, R.; Murakami, K.; Yamaguchi, N. Formations of hydroxyapatite and inositol hexakisphosphate in poultry litter during the composting period: Sequential fractionation, P K-edge XANES and solution 31P NMR investigations. Environ. Sci. Technol. 2014, 48, 5486–5492. [Google Scholar] [CrossRef] [PubMed]
  51. Yamamoto, K.; Hashimoto, Y.; Kang, J.; Kobayashi, K. Speciation of phosphorus zinc and copper in soil and water-dispersible colloid affected by a long-term application of swine manure compost. Environ. Sci. Technol. 2018, 52, 13270–13278. [Google Scholar] [CrossRef] [PubMed]
  52. Hesterberg, D. Macroscale chemical properties and X-ray absorption spectroscopy of soil phosphorus. In Synchrotron-Based Techniques in Soils and Sediments; Singh, B., Grafe, M., Eds.; Elsevier: Oxford, UK, 2010; pp. 313–356. [Google Scholar]
  53. Negassa, W.; Kruse, J.; Michalik, D.; Appathurai, N.; Zuin, L.; Leinweber, P. Phosphorus speciation in agro-industrial byproducts: Sequential fractionation, solution 31P NMR, and P K- and L2,3-edge XANES spectroscopy. Environ. Sci. Technol. 2010, 44, 2092–2097. [Google Scholar] [CrossRef]
  54. Kruse, J.; Leinweber, P.; Eckhardt, K.-U.; Godlinski, F.; Hu, Y.; Zuin, L. Phosphorus L2,3-edge XANES: Overview of reference compounds. J. Synchrotron Radiat. 2009, 16, 247–259. [Google Scholar] [CrossRef]
  55. Weyers, E.; Strawn, D.G.; Peak, D.; Moore, A.D.; Baker, L.L.; Cade-Menun, B. Phosphorus speciation in calcareous soils following annual dairy manure amendments. Soil Sci. Soc. Am. J. 2016, 80, 1531–1542. [Google Scholar] [CrossRef]
  56. Khare, N.; Hesterberg, D.; Beauchemin, S.; Wang, S.L. XANES determination of adsorbed phosphate distribution between ferrihydrite and boehmite in mixtures. Soil Sci. Soc. Am. J. 2004, 68, 460–469. [Google Scholar] [CrossRef]
  57. Abdala, D.B.; Moore, P.A.; Rodrigues, M.; Herrera, W.F.; Pavinato, P.S. Long-term effects of alum-treated litter, untreated litter and NH4NO3 application on phosphorus speciation, distribution and reactivity in soils using K-edge XANES and chemical fractionation. J. Environ. Manag. 2018, 213, 206–216. [Google Scholar] [CrossRef]
  58. Lehmann, J.; Lan, Z.; Hyland, C.; Sato, S.; Solomon, D.; Ketterings, Q.M. Long-term dynamics of phosphorus forms and retention in manure-amended soils. Environ. Sci. Technol. 2005, 39, 6672–6680. [Google Scholar] [CrossRef] [PubMed]
  59. Colombo, C.; Palumbo, G.; He, J.Z.; Pinton, R.; Cesco, S. Review on iron availability in soil: Interaction of Fe minerals, plants, and microbes. J. Soils Sediments 2014, 14, 538–548. [Google Scholar] [CrossRef]
  60. Werner, F.; Prietzel, J. Standard protocol and quality assessment of soil phosphorus speciation by P K-edge XANES spectroscopy. Environ. Sci. Technol. 2015, 49, 10521–10528. [Google Scholar] [CrossRef] [PubMed]
  61. Prietzel, J.; Dumig, A.; Wu, Y.H.; Zhou, J.; Klysubun, W. Synchrotron-based P K-edge XANES spectroscopy reveals rapid changes of phosphorus speciation in the topsoil of two glacier foreland chronosequences. Geochim. Cosmochim. Acta 2013, 108, 154–171. [Google Scholar] [CrossRef]
  62. Turner, B.L.; Mahieu, N.; Condron, L.M. Phosphorus-31 nuclear magnetic resonance spectral assignments of phosphorus compounds in soil NaOH-EDTA extracts. Soil Sci. Soc. Am. J. 2003, 67, 497–510. [Google Scholar] [CrossRef]
  63. Hesterberg, D.; McNulty, I.; Thieme, J. Speciation of soil phosphorus assessed by XANES spectroscopy at different spatial scales. J. Environ. Qual. 2017, 46, 1190–1197. [Google Scholar] [CrossRef]
Figure 1. Normalized P K-edge XANES spectra of soils amended with (a) mineral fertilizer (NPK), (b) mineral fertilizer and cattle manure compost (NPK + compost), (c) mineral fertilizer without nitrogen fertilizer plus cattle manure compost (PK + compost). The values indicate the ratio of P species associated with Al (Al-P) and Ca (Ca-P), respectively. R values indicate goodness of fit calculated by the following equation, R = Σ (μsample − μfit)2/Σ (μsample)2, where μ is normalized absorption at each fit energy point.
Minerals 11 00121 g001
Figure 2. Solution 31P-NMR spectra of EDTA-NaOH extract of soils amended with mineral fertilizer and cattle manure compost (NPK + compost), soil amended with mineral fertilizer without nitrogen fertilizer plus cattle manure compost (PK + compost) and cattle manure compost.
Minerals 11 00121 g002
Figure 3. Solid-state 31P NMR spectra and deconvoluted peaks of cattle manure compost and soils amended with mineral fertilizer (NPK), mineral fertilizer plus cattle manure compost (NPK + compost), mineral fertilizer without nitrogen fertilizer plus cattle manure compost (PK + compost). Dotted lines indicate the sum of deconvoluted peaks. Numbers refer to peak centers.
Minerals 11 00121 g003
Figure 4. EPMA elemental maps of P, S, Ca, Fe, Al and SXRF map of Si in soil thin-sections from NPK (a), NPK + compost (b) and PK + compost (c) at a depth of 0–3 cm. NPK: mineral fertilizer, NPK + compost: mineral fertilizer with cattle manure compost, PK + compost: mineral fertilizer without nitrogen fertilizer plus cattle manure. Scale bars indicate 200 µm.
Minerals 11 00121 g004
Figure 5. SXRF tricolor maps of P, S and Si (ac) and normalized P K-edge µ-XANES spectra (df) on the soil thin-sections from NPK (a,d), NPK + compost (b,e) and PK + compost (c,f) plots. Yellow arrows indicate selected spots for µ-XANES analyses. Numbers in the parentheses show beam size used for the µ-XANES analyses. NPK: mineral fertilizer, NPK + compost: mineral fertilizer with cattle manure compost, PK + compost: mineral fertilizer without nitrogen fertilizer plus cattle manure. Al-P: phosphate adsorbed on gibbsite, CaHPO4; Calcium hydrogen phosphate, HAP; hydroxyapatite, Fe-P; phosphate adsorbed on ferrihydrite. Scale bars indicate 200 µm.
Minerals 11 00121 g005
Table 1. Application rate of cattle manure compost and chemical fertilizer.
Cattle Manure Compost *Chemical Fertilizer (kg·ha−1)
Winter CabbageSummer Cabbage
Mg·ha−1NP2O5K2ONP2O5K2O
NPK030015030020050180
NPK + compost1530015030020050180
PK + compost150150300050180
* Dry matter basis.
Table 2. Properties soil samples from a depth of 0–10 cm.
pH (H2O)TCTNCECExchangeable CationsBSRAloxFeoxTotal AlTotal FeParticle Size Distribution
CaMgKNaCoarse SandFine SandSiltClay
g·kg−1cmolc·kg−1%g·kg−1%
NPK5.911.31.411.15.51.20.90.1>681.52.1844020.120.322.736.9
NPK + compost6.016.91.612.56.91.81.30.1811.72.2813921.421.522.334.8
PK + compost7.416.51.613.714.53.120.11441.82.0813821.920.122.135.9
TC and TN: total carbon and nitrogen; CEC, cation exchange capacity; BSR, Base saturation ratio; Alox and Feox: acid oxalate extractable Al and Fe.
Table 3. Phosphorus concentrations.
Total PWater-Soluble PTruog PSequential ExtractionEDTA-NaOH-P
Ac-PNH4F-PNaOH-PResidual-P
mgP·kg−1
NPK13532.61961363703235241346
(0.19)(14)(10)(27)(24)(39)(100)
NPK + compost16414.42982653433327011444
(0.27)(18)(16)(21)(20)(43)(88)
PK + compost16726.74805263543224701347
(0.40)(29)(31)(21)(19)(29)(95)
Ac-P, acetic acid extractable P; NH4F-P, ammonium fluoride extractable P; NaOH-P, NaOH extractable P, EDTA-NaOH-P, extracted P for solution 31P NMR analyses. The numbers in the parentheses indicate percentage of extracted or residual P to total P.
Publisher’s Note: MDPI stays neutral with regard to jurisdictional claims in published maps and institutional affiliations.

