1. Introduction
Titanium and its alloys are widely employed materials. Many titanium properties are attributed to the passive oxide layer which spontaneously forms on the titanium surface in an oxygen-containing environment. The protective oxide layer, with the thickness of 2 to 6 nm, mainly consists of amorphous TiO
2 [
1]. A thicker titanium oxide layer can be prepared by various methods, including electrochemical modification by anodic oxidation [
2]. Formed titania coating imparts antibacterial and biocompatible properties to the underlying titanium. Further improvement of surface properties can be achieved by modification the Ti/TiO
2 surface by polyelectrolytes [
3].
The surface properties of metal oxides, including TiO
2, are of great interest in many research fields, from fundamental surface science to understanding of the processes in the interfaces, the distribution of ions, as well as the adsorption of counterions and macromolecules [
4]. The colloid stability, adhesion, adsorption and electrokinetic phenomena are determined by the electrical charge at the solid-liquid interface [
5]. Metal oxide surface properties are affected by the number, type and arrangement of atoms on the surface [
6]. The titanium atoms in the rutile crystal structure are coordinated with six oxygen atoms, while the oxygen atoms are surrounded by three titanium atoms. However, the surface structure depends on the crystal orientation. The type and surface concentration of the specific surface sites are determined by the surface structure. According to the charge distribution multi-site complexation model (CD-MUSIC) [
7], which is based on Pauling’s bond valence principle, at the crystalline rutile, three different surface groups (single, double and triple coordinated) are present. However, for spontaneously or electrochemically prepared amorphous titanium oxide layers, such a precise model cannot be applied. It is more appropriate to apply, less fundamental, 2-pK model [
8] which assumes only existence of amphoteric ≡TiOH surface sites and equilibrium reactions:
Consequently, surface charge of a metal oxide in aqueous environment is the result of the protonation and deprotonation of amphoteric surface sites. In addition to the mentioned surface reactions, the association of anions and cations from the bulk of solutions takes place reducing the net surface charge. The distribution and accumulation of ions result in the formation of an electrical interfacial layer [
9,
10]. The special attention has been paid to the impact of interfacial water on surface properties [
11]. The charges created by interactions of surface sites with potential-determining ions (≡TiO
− and ≡TiOH
2+) are located in the 0-plane which is characterized by the inner surface potential,
Ψ0 and surface charge density,
σ0. Associated counterions are located in the β-plane. The onset of the diffuse layer is the d-plane, while the electrokinetic
ζ-potential corresponds to the slip (shear) plane (e-plane) [
12]. The zero charge condition at the interface is expressed by (i) the point of zero charge (p.z.c.) corresponding to
σ0 = 0, (ii) the isoelectric point (i.e.,p.) corresponding to electrokinetic potential
ζ = 0, and (iii) the point of zero potential (p.z.p.) corresponding to
Ψ0 = 0. In the absence of specific adsorption of ions and in the case of negligible or symmetric association of counterions, all three points coincide and correspond to the state in which all electrical properties diminish [
13]. This electroneutrality condition is related to the protonation equilibrium constants. Surface characterization involves determination of the parameters that describe the structure of the electrical interfacial layer, as well as the surface reactions [
14].
While electrochemical methods (e.g., cyclic voltammetry and electrochemical impedance spectroscopy) supply data on the dielectric (interfacial) capacity and electrical (charge transfer resistance) properties of the electrified phase boundary [
15], measurements of the open circuit potential by means of single crystal electrode provide the values of inner surface potential [
16] and information about the equilibrium at the interface. Based on the obtained parameters and measured surface potentials, a more detailed picture of the electrical interfacial layer, ion distributions and mechanisms of the processes at the mineral/ electrolyte solution interface may be deduced.
Most of the measurements of the TiO
2 electrokinetic potential and isoelectric point have been obtained for titanium oxide particles [
17], only a few results have been published for TiO
2 flat surfaces. The surface of colloid particles is heterogeneous, with different crystal planes exposed to the electrolyte solution [
18], resulting in the measurement of average surface properties. Additionally, the experimentally obtained points of zero charge show strong size, shape, as well as form or crystal structure dependency. Points of zero charge for rutile and anatase colloid particles were found to be between pH = 3 and pH = 9 [
19,
20,
21]. The surface properties of amorphous Ti/TiO
2 layer are comparable to the surface properties of colloid TiO
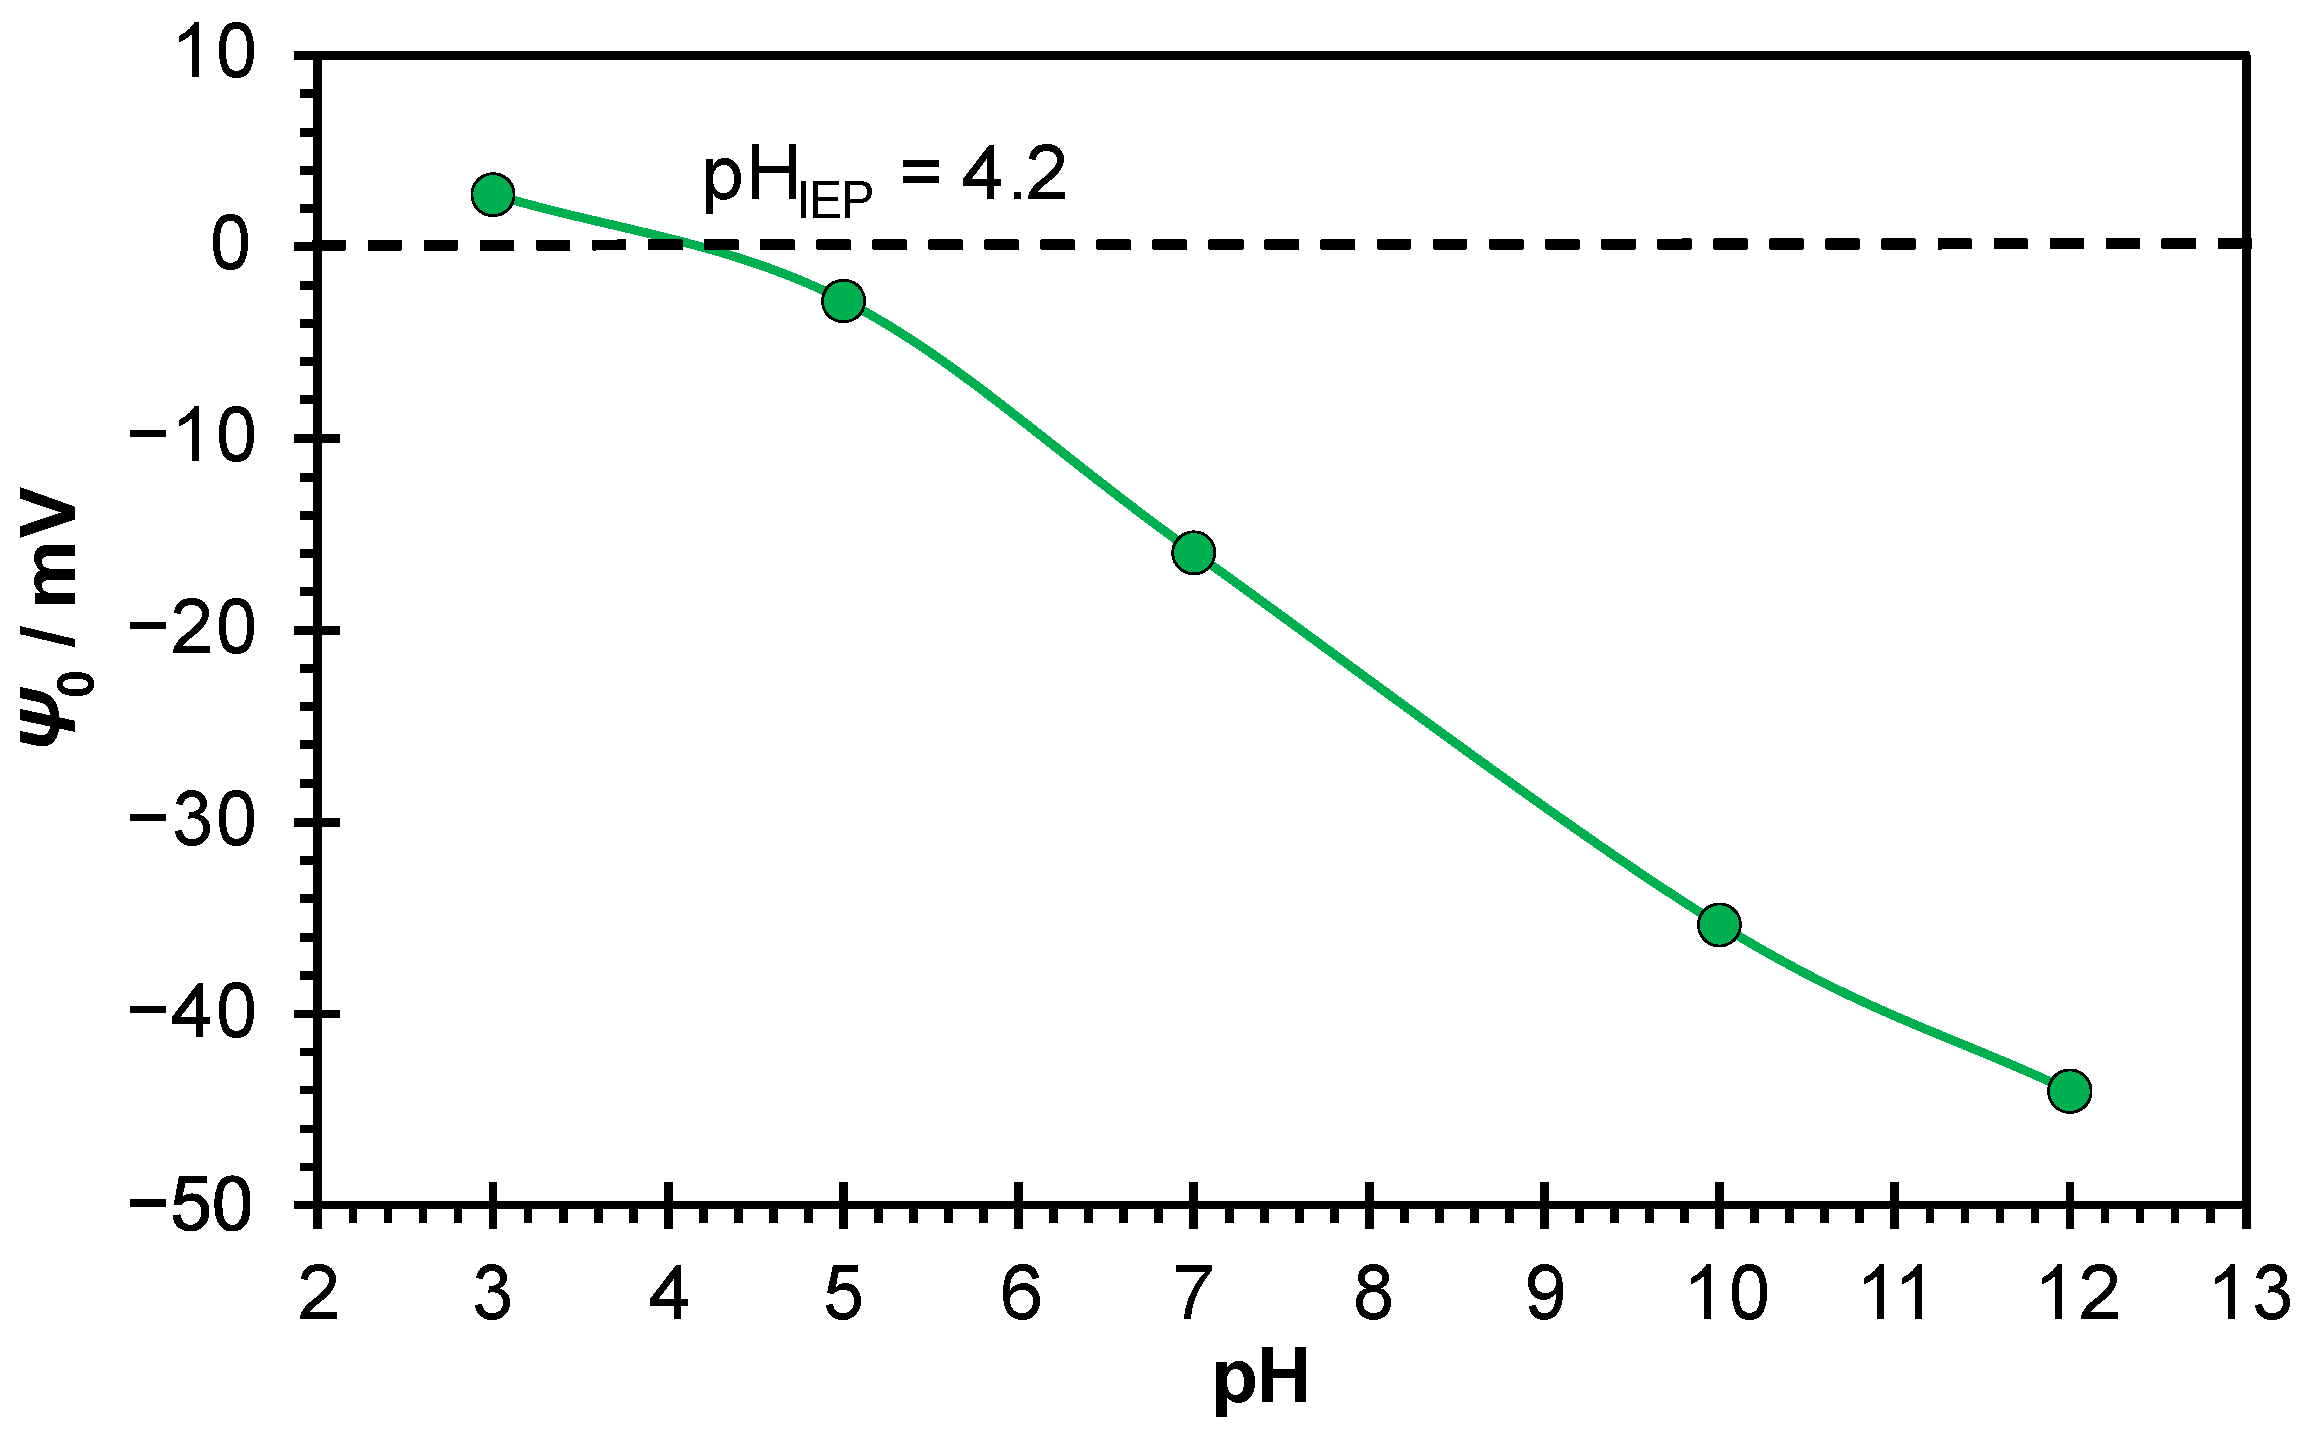
2 particles. The isoelectric point of spontaneously formed TiO
2 passive layer on titanium in potassium chloride aqueous solution was measured by streaming current, and it was found to be at pH
iep = 4.2 [
22]. At pH < pH
iep the surface of the TiO
2 layer is positively charged and attract anions from the aqueous solution. The binding of cation is expected when the TiO
2 layer is negatively charged, what is achieved at pH > pH
iep.
The isoelectric points of flat rutile (110) plane and rutile (100) plane were found to be at pH
iep = 5.6 [
16,
23], and pH
iep = 3.5 [
16], respectively. In addition to the electrokinetic measurements (streaming potential measurements), for the same rutile crystal planes the results on inner surface potential, obtained by means of single crystal electrodes, were published [
16]. The inner surface potential of both rutile crystal planes were found to be a linear function of pH, with slopes –14.9 mV, and –47.7 mV, respectively.
Polyelectrolytes are macromolecules with dissociating functional groups which can carry positive (polycations) or negative (polyanions) charge in solution. In general, polycations and polyanions are built of repeating units which could dissociate in aqueous solution, making the polyelectrolyte chains charged. Polyelectrolytes easily adsorb on the metal oxide solid surface and therefore surface properties can be modified and even controlled. Polyelectrolyte-coated mineral surfaces can therefore exhibit some quite different properties from the metal oxide themselves [
24]. Adsorption of these polyions is a consequence of electrostatic attraction to the surface, although in some cases non-electrostatic interactions should be also taken into account [
25].
There are several key parameters that significantly influence polyelectrolyte adsorption process. Since electrostatic interactions prevail, surface charge density, as well as polyelectrolyte charge, are very important. Moreover, the roughness of the surface and its hydrophobicity should also be considered. According to Tsukruk et al. [
26] surface defects are main adsorption sites. Additionally, the influence of experimental parameters such as pH, ionic strength, type of supporting electrolyte and polyelectrolyte molar mass (i.e., chain length) should also be carefully studied [
27,
28].
Adsorption of polyelectrolytes is important not only from the fundamental point of view. Many applications could also be achieved based on the surface modifications with polyelectrolytes. Recently, studies regarding applications in the field of antibiotic removal became popular [
29,
30]. Moreover, it was shown that adsorbed polyelectrolytes could protect the surface from corrosion. In that sense, polyelectrolyte multilayers (thin films obtained by alternate adsorption of oppositely charged polyelectrolytes) are especially important [
31,
32].
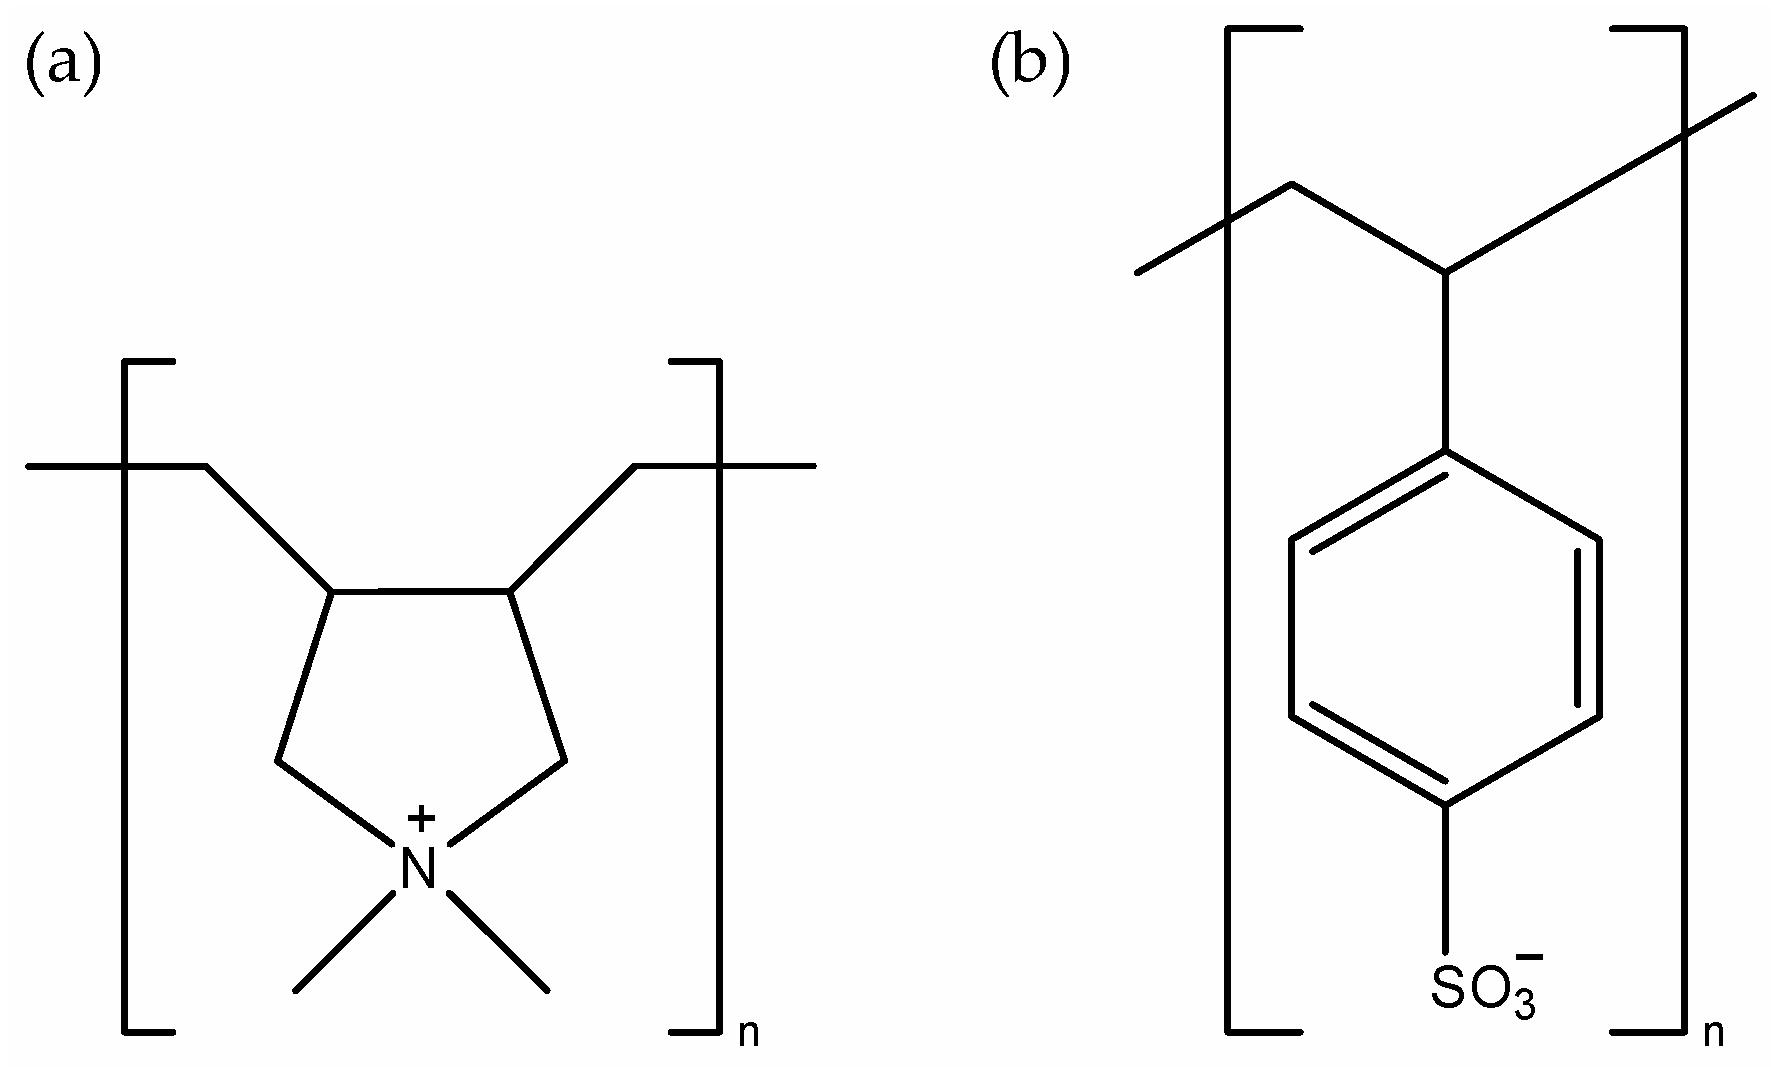
The aim of this study is to investigate how the adsorption of strong polyelectrolytes on the flat TiO
2 surface affects the surface properties of TiO
2, with the special emphasis on anticorrosive properties. As polyelectrolytes, strongly charged polycation poly(diallyldimethylammonium) (PDADMA) and strongly charged polyanion poly(4-styrenesulfonate) (PSS) were used (
Figure 1). The several independent experimental methods, ellipsometry, atomic force microscopy (AFM), cyclic voltammetry (CV), electrochemical impedance spectroscopy (EIS) and measurements of surface potential by means of crystal electrode (CrE), were applied to study the film thickness and surface morphology, electrical surface properties as well as anticorrosive effects. Such systematic studies are needed to elucidate in what extent polyelectrolyte coatings on flat metal oxide surfaces influence various surface properties. The obtained results could be used for the prediction of the effect of polyelectrolyte coatings, especially in terms of anticorrosive properties, which could enable the aimed preparation of polyelectrolyte-coated metal oxide surfaces with tuned properties. A novelty in presented research is related to the interfacial electrochemical approach that combines polyion (PI) adsorption measurements by means of atomic force microscopy and ellipsometry with electrochemical ac and dc methods. The crystal TiO
2 electrode was constructed and, to the best of our knowledge, no results have been reported concerning its application for determination of TiO
2 inner surface potential during the process of polyelectrolyte adsorption. Electrochemical methods (cyclic voltammetry and electrochemical impedance spectroscopy) were used for determination of the corrosion protection effectiveness of the PSS and PDADMA polyion coated flat TiO
2 surface, but also for providing deeper insight in modelling the structure of Ti|TiO
2|PI interface to the corresponding electrical equivalent circuit model.
2. Materials and Methods
2.1. Ti/TiO2 Preparation
The titanium plates (Ti, 99.9%, Alfa Aesar, Karlsruhe, Germany) were cut in 11 mm-diameter discs and were prepared as substrates for polyion adsorption/polyelectrolyte coating formation. Prior to the polyion adsorption, Ti samples were abraded using SiC #240-#1200 grit papers, and afterwards polished with alumina suspensions (particle size: 1, 0.3 and 0.05 μm) followed by ultrasonical cleaning in absolute ethanol (p.a, Gram-Mol®, Zagreb, Croatia) and redistilled water and drying in pure N2 stream (99.999%, Messer®, Bad Soden, Germany). Titanium samples prepared in this manner, covered by spontaneously formed TiO2 oxide (Ti|TiO2) served as substrates for polyelectrolyte coating formation.
2.2. Adsorption of Polyelectrolytes
As model polyelectrolytes, poly(diallyldimethylammonium chloride) (PDADMACl, Mw < 100,000 g mol−1, w = 35.5%, Sigma Aldrich, St. Louis, MO, USA) and poly(sodium 4-styrenesulfonate) (NaPSS, Mw ≈ 70,000 g mol−1, Sigma Aldrich, USA) were used. In acidic region, where the TiO2 surface is positively charged, polyanion (PSS) was used, and in basic region, where the TiO2 surface is negatively charged, polycation (PDADMA) was used. For that purpose, two solutions containing polyelectrolyte, salt (NaCl) and acid/base were prepared. The concentration of both polyelectrolytes was 1 × 10⁻² mol dm−3 and of NaCl was 0.1 mol dm−3. Hydrochloric acid was added to the solution containing PSS and sodium hydroxide solution was added to the solution containing PDADMA. The final acid/base concentration was 1 × 10⁻³ mol dm−3. The measured pH values were: pH = 3.2 for PSS solution and pH = 10.7 for PDADMA solution. The spontaneously prepared Ti/TiO2 samples were immersed vertically in NaPSS and PDADMACl solution for 5 min, respectively. The polyion solution was continuously stirred at the approximate speed of 500 rpm. After adsorption step, three consecutive rinsing steps with deionized water were performed (by dipping the plate to three separated beakers for 1 min each). At the end, the plate was dried with nitrogen or argon (99.9990%, Messer, Croatia). Prepared polyelectrolyte-modified Ti/TiO2 substrates are labeled as Ti|TiO2|PSS and Ti|TiO2|PDADMA.
Unmodified (Ti|TiO2) and polyelectrolyte modified Ti substrates (Ti|TiO2|PSS and Ti|TiO2|PDADMA) were characterized by means of ellipsometry, atomic force microscopy, Ti/TiO2 crystal electrode, cyclic voltammetry and electrochemical impedance spectroscopy.
2.3. Ellipsometry
Thickness measurements of oxide and polymeric layer on titanium sample were made on an L116B-USB ellipsometer from Gaertner Scientific Corporation (Skokie, IL, USA). The measurements were performed under ambient conditions (
θ ≈ 25 °C and humidity 30–55%) using red He-Ne laser light with a wavelength of 632.8 nm at a fixed incident angle of 70°. For calculation of film thicknesses (
d) from the measured
Ψ and
Δ values, the commercial Gaertner Ellipsometric Measurement Program (Version 8.071) was used. In the software, a three-box model with air as a continuum (
n = 1.000) [
33], TiO
2 layer with a refractive index of 2.130 [
34], and titanium (
n = 2.704 and
k = 3.765) [
35] as a substrate was assumed. In the case of polyelectrolyte thickness measurements, the Ti/TiO
2 substrate was treated as one-phase system and before adsorption of polyelectrolytes on the substrate surface, its average refractive index was determined by ellipsometric measurements on ten different positions on each used Ti plate. In such kind of model, refractive indexes of PDADMA (
n = 1.530) [
36] and PSS (
n = 1.484) [
37] were used instead of TiO
2. Oxide and polyelectrolyte thicknesses were determined at ten different positions on each sample and are presented as the average (with the standard error) of measurements for two individual samples.
2.4. Atomic Force Microscopy
Atomic force microscopy measurements were performed under the ambient air conditions at (25 ± 2) °C and the relative humidity between 20 and 55% on a commercial Multimode 8 instrument (Bruker, Camerillo, CA, USA). Surface topography of Ti substrate was visualized in the contact mode, while tapping mode was used to image the surface of considerably softer polyelectrolyte films. For the measurements in contact mode, ScanAssyst Air probes (Bruker, Camerillo, CA, USA) with a cantilever of 70 kHz nominal resonance frequency and a nominal spring constant of 0.4 N m−1 were used. For imaging in tapping mode, the NCHV-A probes (Bruker, Camerillo, CA, USA) of a resonance frequency of approximately 320 kHz and a nominal spring constant of 42 N m−1 were used. All measurements were done on a 5 μm × 5 μm area with a scanning rate of 1 Hz and a picture resolution of 515 × 512 pixels. After the data were processed in NanoScope Scan 9.7, AFM images were corrected for tilt and bow using a second-order flattening and were analyzed in NanoScope Analyses 2.0 software to determine the root mean square (RMS) roughness of surface materials. The AFM roughness parameters and appropriate standard errors reported here were calculated from all the measurements, which included five local areas on two sample surfaces.
2.5. Electrochemical Measurements
The electrochemical behavior of prepared substrates (working electrode, area of 1 cm2) was examined by employing standard electrochemical three-electrode reactor Corrosion Cell System Model K47 Princeton Applied Research (PAR, Ametek, Berwyn, PA, USA). Two graphite rods served as counter electrodes. The reference electrode, to which all potentials in the paper are referred, was an Ag|AgCl, 3.0 mol dm−3 KCl (E = 0.210 V vs. standard hydrogen electrode). Solartron 1287 potentiostat/galvanostat with Solartron FRA 1260 (Solartron Analytical, Farnborough, UK) was used and the electrolyte solution for all measurements was 0.1 mol dm−3 NaCl solution (p.a., Gram-Mol®, Zagreb, Croatia).
In order to assess polyelectrolyte coating’s stability and level of corrosion protection, cyclic voltammetry measurements for prepared Ti substrates were performed in the wide potential range with anodic limit shift, Eal from 1.0 V to 3.0 V at the scan rate, ν = 100 mV s
−1. Corrosion protection evaluation has been made by impedance measurements at the open circuit potential (EOC) with an ac voltage amplitude of ±5 mV in the frequency range from 10
5 to 10
−3 Hz after 1 h of stabilization in the electrolyte solution. Impedance data were fitted by a suitable electrical equivalent circuit (EEC) model, employing the complex non-linear least squares (CNLS) fit analysis [
38]. ZView® software (v. 3.5e, Scribner Associates Inc., Southern Pines, NC, USA) fit was carried out to model all experimental data with chi-squared values less than 5 × 10
−3 (relative errors in parameter values of 1–5%) indicating that the agreement between the proposed EEC model and the experimental data was good.
2.6. Inner Surface Potential Measurements
The Ti/TiO
2 electrode (Ti/TiO
2-E) was constructed as described earlier [
16,
39] in the way that the polished plate of pure titanium (10 mm × 10 mm × 1 mm, Titanium (Ti, 99.9%, Alfa Aesar
®, Karlsruhe, Germany) with spontaneously formed TiO
2 oxide layer (Ti|TiO
2) was exposed to the aqueous electrolyte solution (NaCl, 1 × 10
−3 mol dm
−3). The Ti/TiO
2-E potentials with respect to the reference electrode (Ag|AgCl|3 M KCl) from a combined glass/reference electrode were measured using a Metrohm 826 pH meter.
The measured electrode potential (EOC) was the result of the ion adsorption equilibrium within the TiO2/aqueous electrolyte solution electrical interfacial layer only because all other potentials in the circuit are constant:
Cu(s)|silver conductive paint |Ti|TiO2| aqueous electrolyte solution | reference electrode.
Inner surface potential of TiO
2 layer was obtained from the measured electrode potential by
where
EOC(iep) is the measured electrode potential of Ti/TiO
2 electrode at the isoelectric point of TiO
2; pH
iep = 4.2 [
22]. The dependency of Ti/TiO
2 surface potential on pH was determined by measuring the electrode potential vs. reference electrode in solutions of 1 × 10
−3 mol dm
−3 NaCl of different pH, at 25 °C and in argon atmosphere. The pH of each solution was adjusted by the addition of HCl or NaOH. The readings were made after 30 min of stabilization for each solution. The combined (glass/reference) electrode was calibrated using standard buffers. During measurements, the measuring solutions were stirred with a magnetic stirrer.
The effect of polyelectrolyte adsorption on the surface potential of TiO2 was measured under the same conditions as electrochemical measurements, with exception of the background electrolyte which had to be of lower concentration. Two solutions containing polyelectrolyte, salt (NaCl, c = 1 × 10⁻³ mol dm−3) and acid/base were prepared. The initial concentration of both polyelectrolytes was 1 × 10⁻¹ mol dm−3. Hydrochloric acid was added to the solution containing PSS and sodium hydroxide solution was added to the solution containing PDADMA. The final acid/base concentration was 1 × 10⁻³ mol dm−3. The measured pH values were: pH ≈ 3 for PSS solution and pH ≈ 11 for PDADMA solution. After stabilization of the Ti/TiO2-E signal in the NaCl and acid/base solution, the solution of polyelectrolyte was added so that the final concentration of polyelectrolyte was 1 × 10⁻² mol dm−3, while the concentrations of NaCl and HCl/NaOH remained the same. The potential was measured continuously before, during, and after the addition of polyelectrolyte.
3. Results and Discussion
Unmodified Ti/TiO2 substrates and Ti/TiO2 substrates modified by adsorption of polyions, PDADMA and PSS, were studied. The comprehensive set of experimental results has been collected. The surface topography and thickness of TiO2 layer, as well as polyelectrolyte layer, were examined by ellipsometry and atomic force microscopy, while stability of polyion’s film, as well as corrosion protection effectiveness, were determined by cyclic voltammetry and electrochemical impedance spectroscopy. The results were supplemented with measurements of inner surface potential during the process of polyion adsorption.
3.1. Thickness of the Oxide Layer and Formed Polyelectrolyte Coatings
As mentioned in the introduction, the passive oxide layer spontaneously forms on the titanium surface in an oxygen-containing environment. For examined titanium samples, the thickness of this oxide layer is (3.8 ± 0.1) nm, as determined by ellipsometry measurements. The obtained value is in the range of expected thicknesses for the spontaneously formed oxide films [
1].
Ellipsometry was also used for measuring the thickness of polyelectrolyte layers formed on the Ti/TiO
2 surface after the adsorption process. It was found that both PDADMA and PSS form a subnanometer coating on TiO
2 surface with layer thicknesses of (0.7 ± 0.1) nm and (0.8 ± 0.1) nm, respectively. The obtained thickness of polycation film agrees well with the values (
d = 0.2–0.4 nm) determined by Popa et al. [
40] by means of ellipsometry and AFM for PDADMA layer adsorbed on the surface of Si/SiO
2 substrate at several pH-values and ionic strengths of polyelectrolyte solutions. Moreover, in the same group Porus and coworkers [
41] obtained thickness values ranging from 0.2 to 2.5 nm for the PSS film prepared on the amino-functionalized Si/SiO
2 substrate depending on a molar mass of polyelectrolyte and concentration of background electrolyte (NaCl). For conditions similar to our experiments (
Mw ≈ 70 000 g mol
−1 and
c(NaCl) = 0.1 mol dm
−1) PSS film thickness of approximately 0.6 nm, which is very close to our value, was reported.
3.2. Surface Morphology Characterization
Digital optical microscope and atomic force microscope were used to visualize surfaces of unmodified and polyelectrolyte-modified Ti/TiO
2 samples on a large and small scale, respectively.
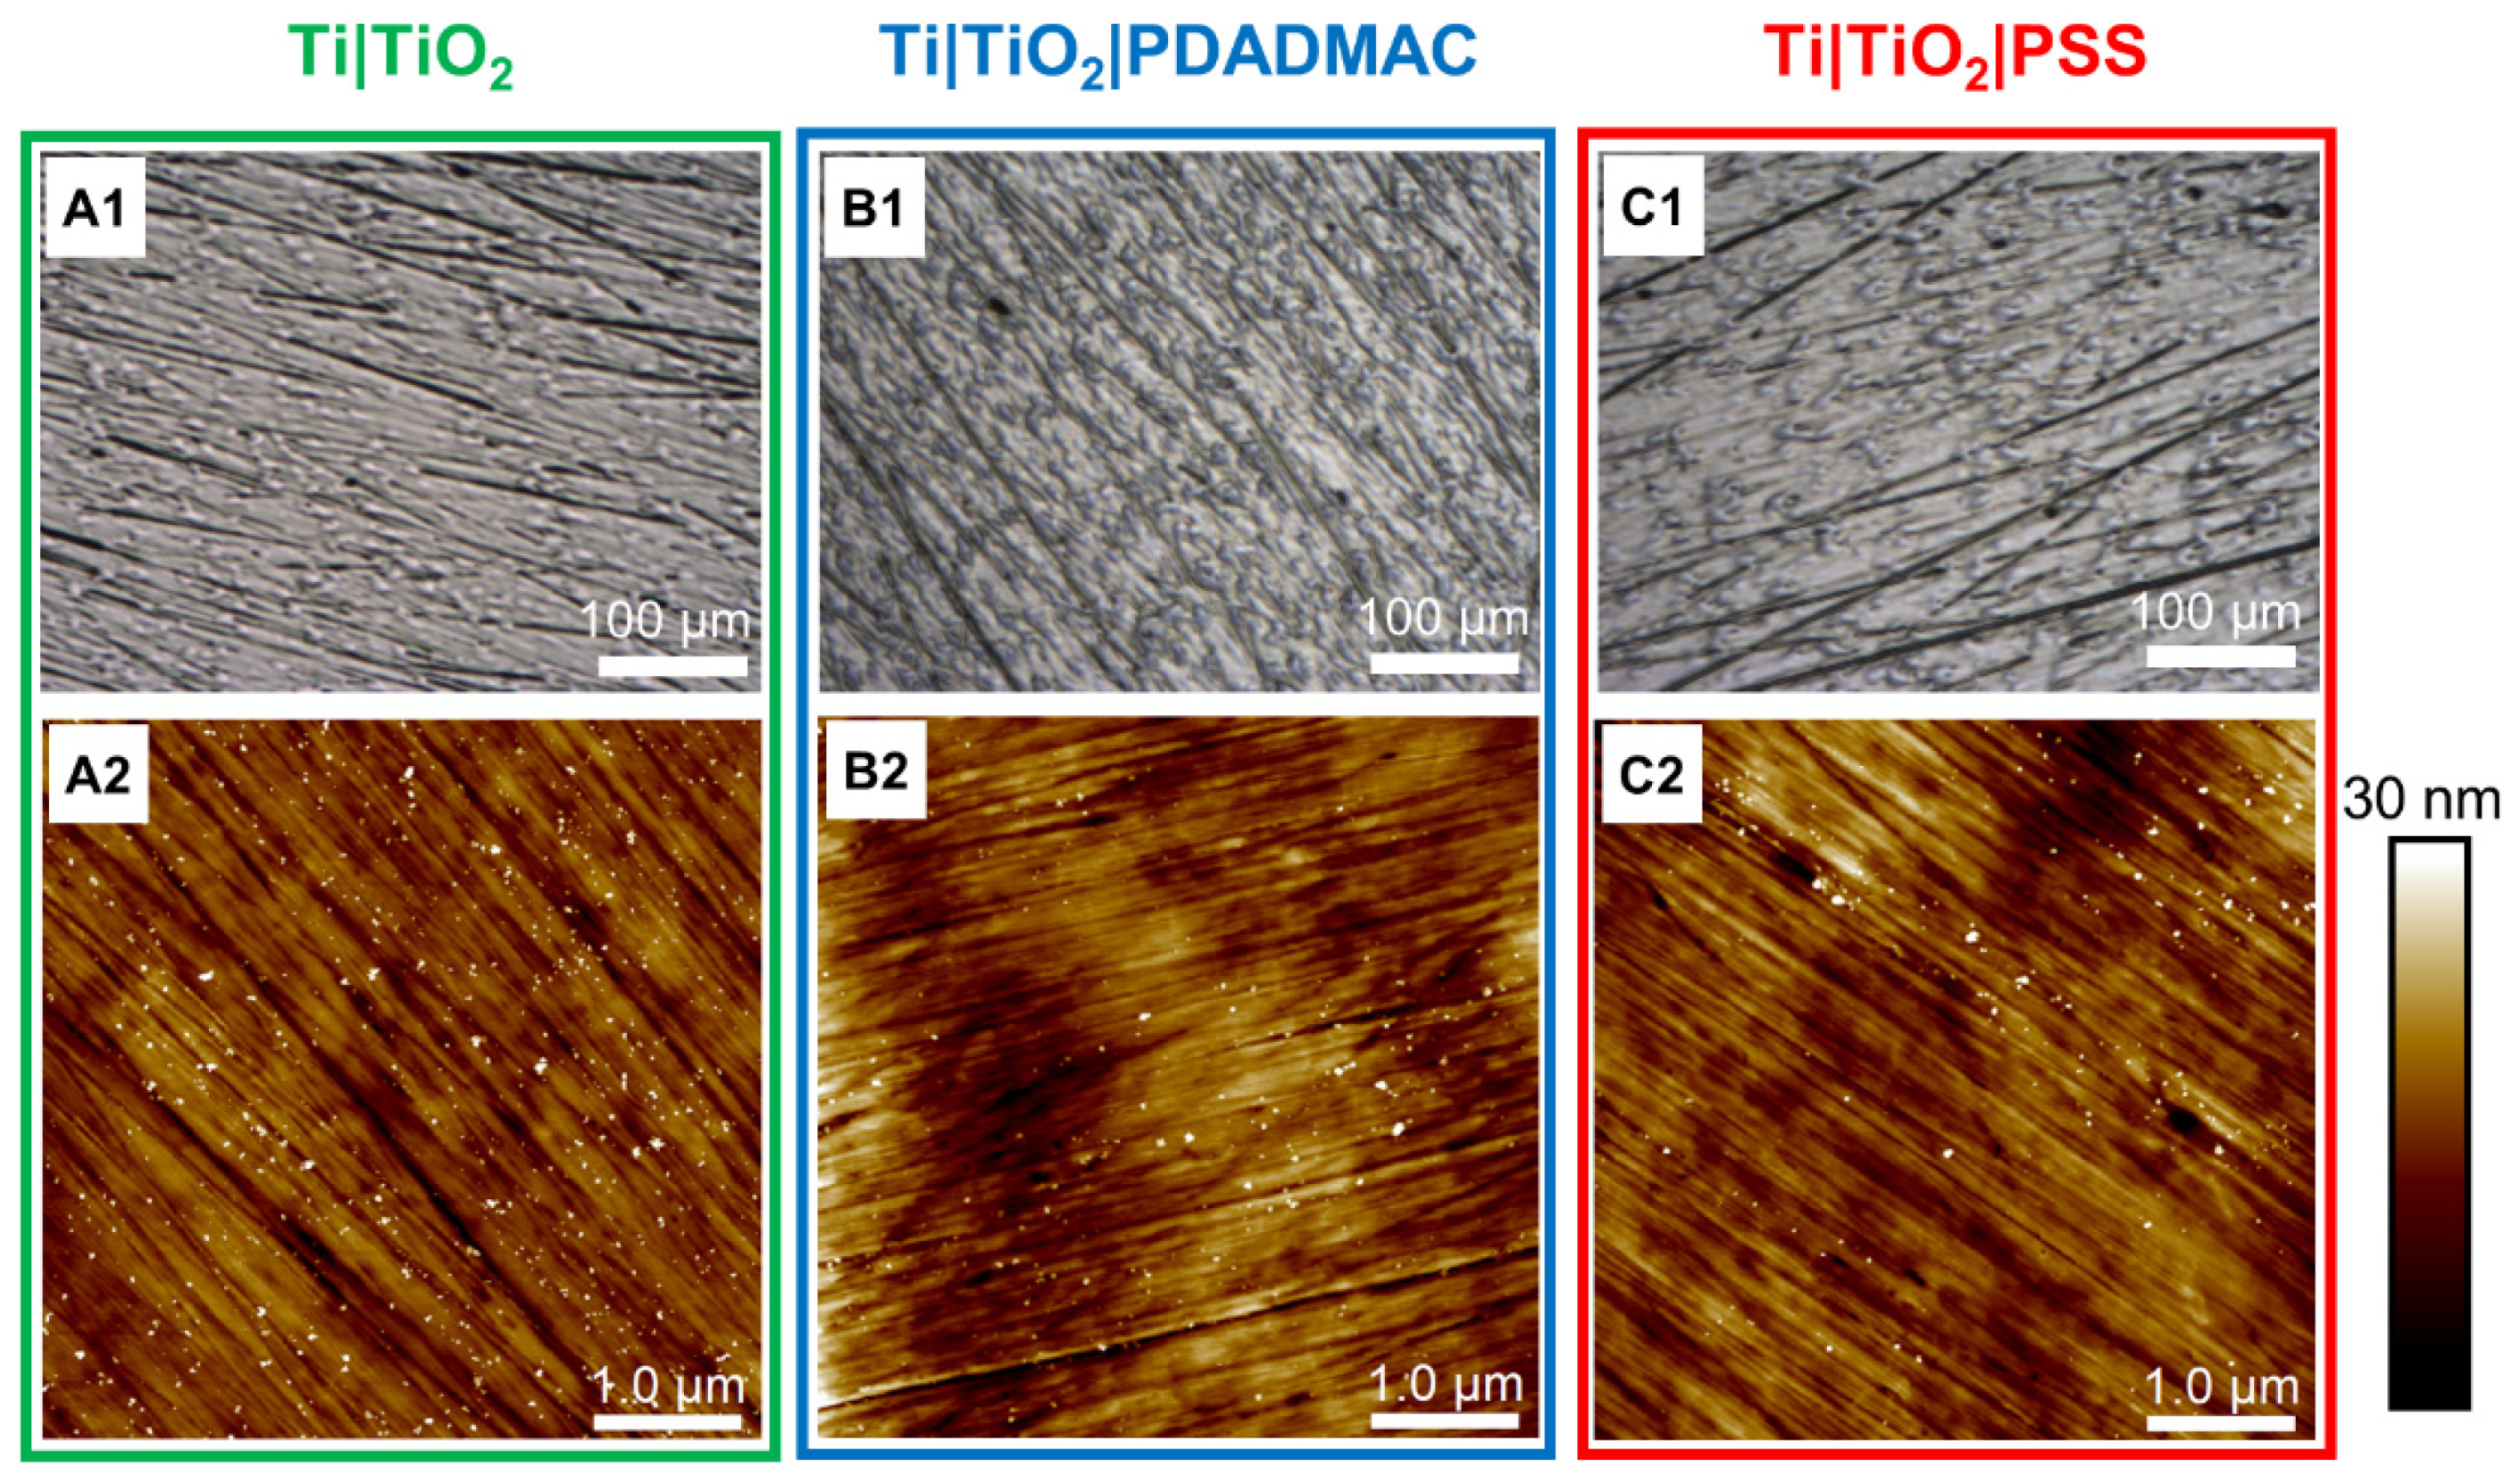
Figure 2. shows the representative images of the surface of Ti/TiO
2 substrate before and after polyion adsorption. As can be seen, the surface of bare Ti/TiO
2 substrate is characterized by linear defects and protrusions of nanometer dimensions that cover the surface
Figure 2A1,A2). Line defects were probably formed during the sample preparation process, and the protrusions are attributed to Al
2O
3 nanoparticles used for polishing the substrate. These very tough impurities can easily be imprinted on the soft titanium surface.
After the adsorption of polyelectrolytes on the Ti/TiO
2 surface morphological changes were observed. Although line defects are still present on PDADMA- and PSS-modified TiO
2 surface, unevenly distributed clusters can be seen on images recorded with the optical microscope (
Figure 2B1,C1). These clusters are polymer material electrostatically attached to TiO
2 in island-like form separated by micrometer distances. These clusters are more pronounced in the case of PDADMA, creating the impression that the substrate’s surface is almost completely covered with this polymer. On contrary, in the case of PSS adsorption, the substrate surface morphology is more visible as polymer material only partially covers the surface. The process of forming PSS coating on amine-terminated Si/SiO
2 substrate was explored in detail by Tsukruk and coworkers [
26]. The authors monitored by AFM the self-assembly process at various stages of adsorption and made the following conclusions. At the earliest stage, PSS macromolecules tend to adsorb on selected defect sites of positively-charged substrate (scratches, microparticles and edges) and form islands composed of PSS coils. At this stage, adsorption of PSS chains is predominant and equilibration of the surface structure is not achieved by the slow surface diffusion mechanism. Only longer deposition times (
t > 10 min) result in the equilibration of polymer layers and the formation of a homogeneous thin film composed of highly flattened macromolecular chains. From all mentioned, it is not unexpected that PDADMA and PSS didn’t form a compact homogeneous coating on Ti/TiO
2 surface in our case, as the deposition time was only 5 min.
The last statement is further substantiated with AFM images of polyelectrolyte modified-surfaces (
Figure 2B2,C2). At these higher magnification images, polymer clusters are not visible and the only difference between modified and unmodified surfaces is in the fraction of structural imperfections. After adsorption of polyelectrolytes on Ti/TiO
2 surface, the number of linear and protrusion defects decreased probably as a result of covering these defects with macromolecular material. This observation was further confirmed by a detail analysis of AFM images that enable comparison of the surface roughness and the proportion and size of protrusions on the unmodified and polyelectrolyte modified surface of Ti/TiO
2 substrate (
Table 1.).
Generally speaking, all three samples have similar surface microroughness corresponding to very smooth surfaces. In more detail, the Ti|TiO2|PDADMA surface is slightly rougher than the substrate surface, while the Ti|TiO2|PSS surface has a substrate-like roughness. From the presented results, it is concluded that PDADMA forms a little rougher layer on the surface of Ti/TiO2 substrate compared to PSS. As mentioned before, very few protrusions were observed on all three surfaces, and their share on the surface decreased slightly after the adsorption of polyelectrolytes. As the size of the protrusions on all three surfaces is similar, between 60 and 75 nm, we assume that these protrusions are Al2O3 nanoparticles used for polishing the substrate.
3.3. Cyclic Voltammetry
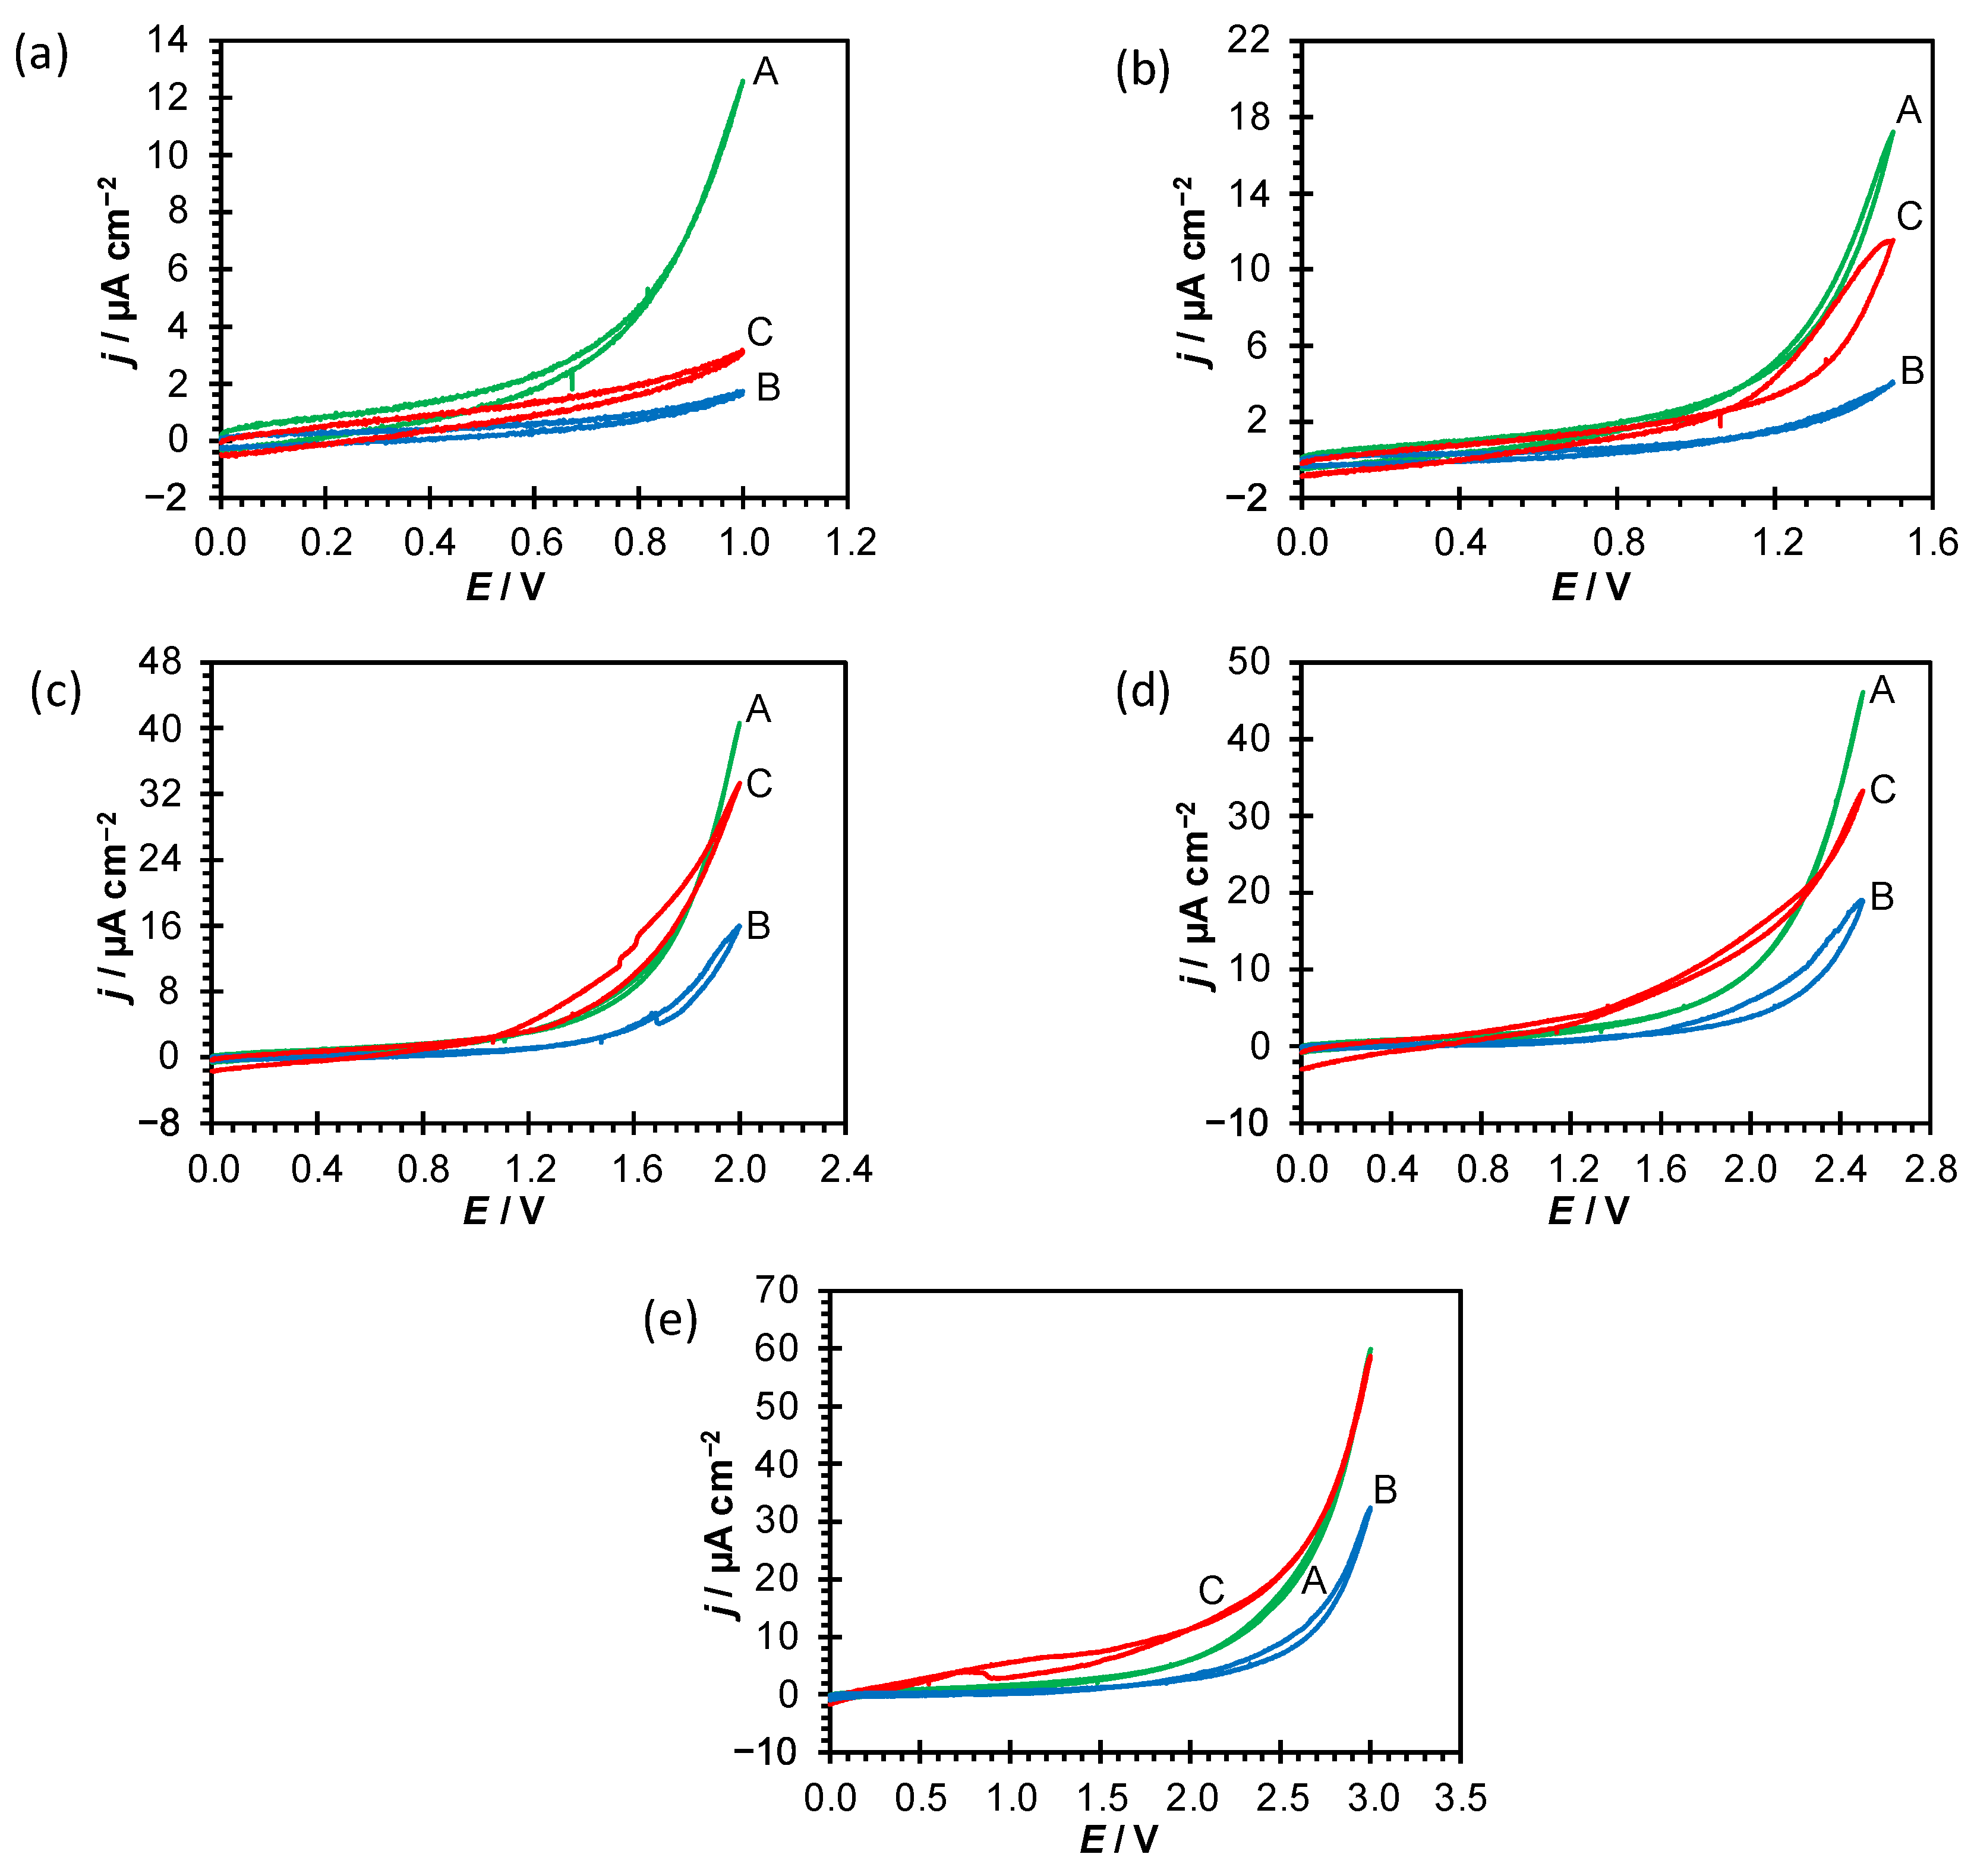
In order to evaluate the polyelectrolyte coating’s stability upon polarization in the wide potential range, cyclic voltammograms of unmodified (Ti|TiO
2) and polyelectrolyte-modified Ti/TiO
2 substrates (Ti|TiO
2|PSS and Ti|TiO
2|PDADMA) were recorded in 0.1 mol dm
−3 NaCl solution with anodic limit shift,
Eal, from 1.0 V to 3.0 V at the scan rate,
ν = 100 mV s
−1 (
Figure 3).
As can be seen from CV results presented in
Figure 3., the polyelectrolyte coatings exhibit stability and structural integrity in the wider potential range (coating is stable and not susceptible to anodic desorption/electrochemical degradation) in comparison to uncoated Ti substrate. The current density for Ti|TiO
2|PDADMA is lower compared to Ti|TiO
2 and Ti|TiO
2|PSS system for all investigated anodic limit potentials. For
E < 2.0 V anodic polarization does not significantly influence the PDADMA coating’s structure and the reverse scan in cyclic voltammogram quite matches the forward scan. However, at potentials
E > 2.0 V the observed higher current density values for both PSS and PDADMA coatings are probably related to partial removal of polyelectrolyte coating. This potential assisted anodic desorption leads to polyelectrolyte’s coating decomposition at higher potentials.
From the CV results the level of corrosion protection can be estimated using equation:
where
and
represent current densities values at anodic potential limit for unmodified (Ti|TiO
2) and polyelectrolyte-modified Ti substrates (Ti|TiO
2|PDADMA and Ti|TiO
2|PSS), respectively. The calculated values are provided in
Table 2.
In the potential range up to 2.0 V, PDADMA coating offers good level of corrosion protection in comparison to PSS coating and spontaneously formed oxide film. At higher potentials, the anodic desorption starts. For PSS coating, lower current densities in comparison to uncoated Ti substrate and the coating’s stability are observed up to 1.0 V and afterwards anodic desorption and coating’s degradation take place. Obtained results point to better barrier/blocking and protective properties of PDADMA coating (lower current density values and wider stability potential range) in comparison to PSS coating.
3.4. Electrochemical Impedance Spectroscopy
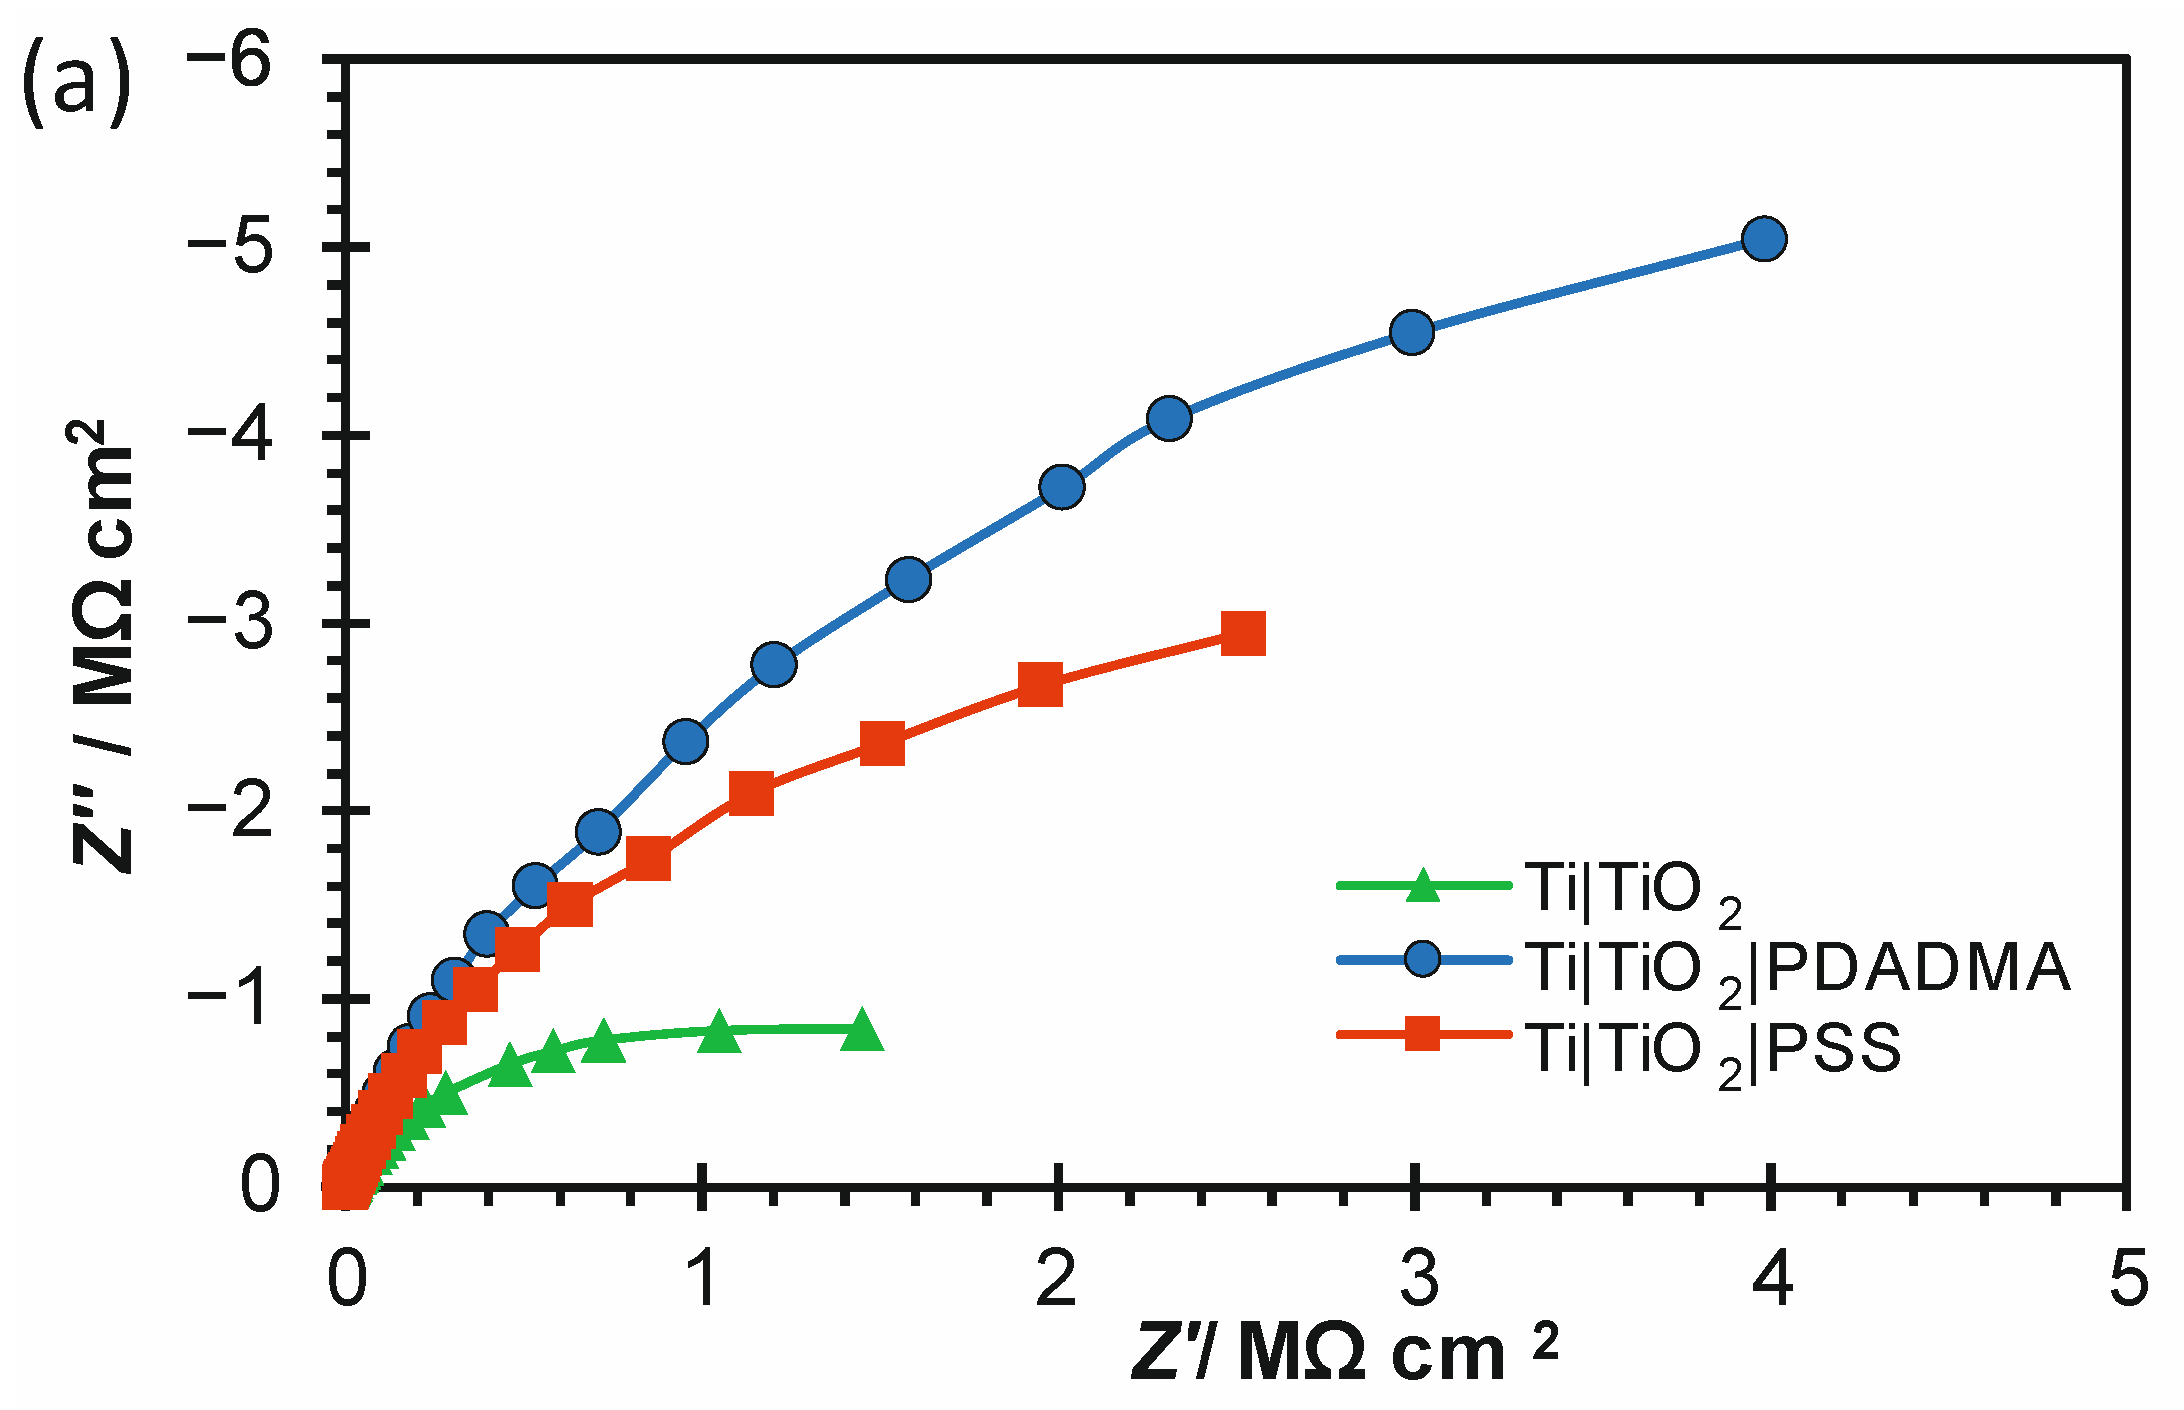
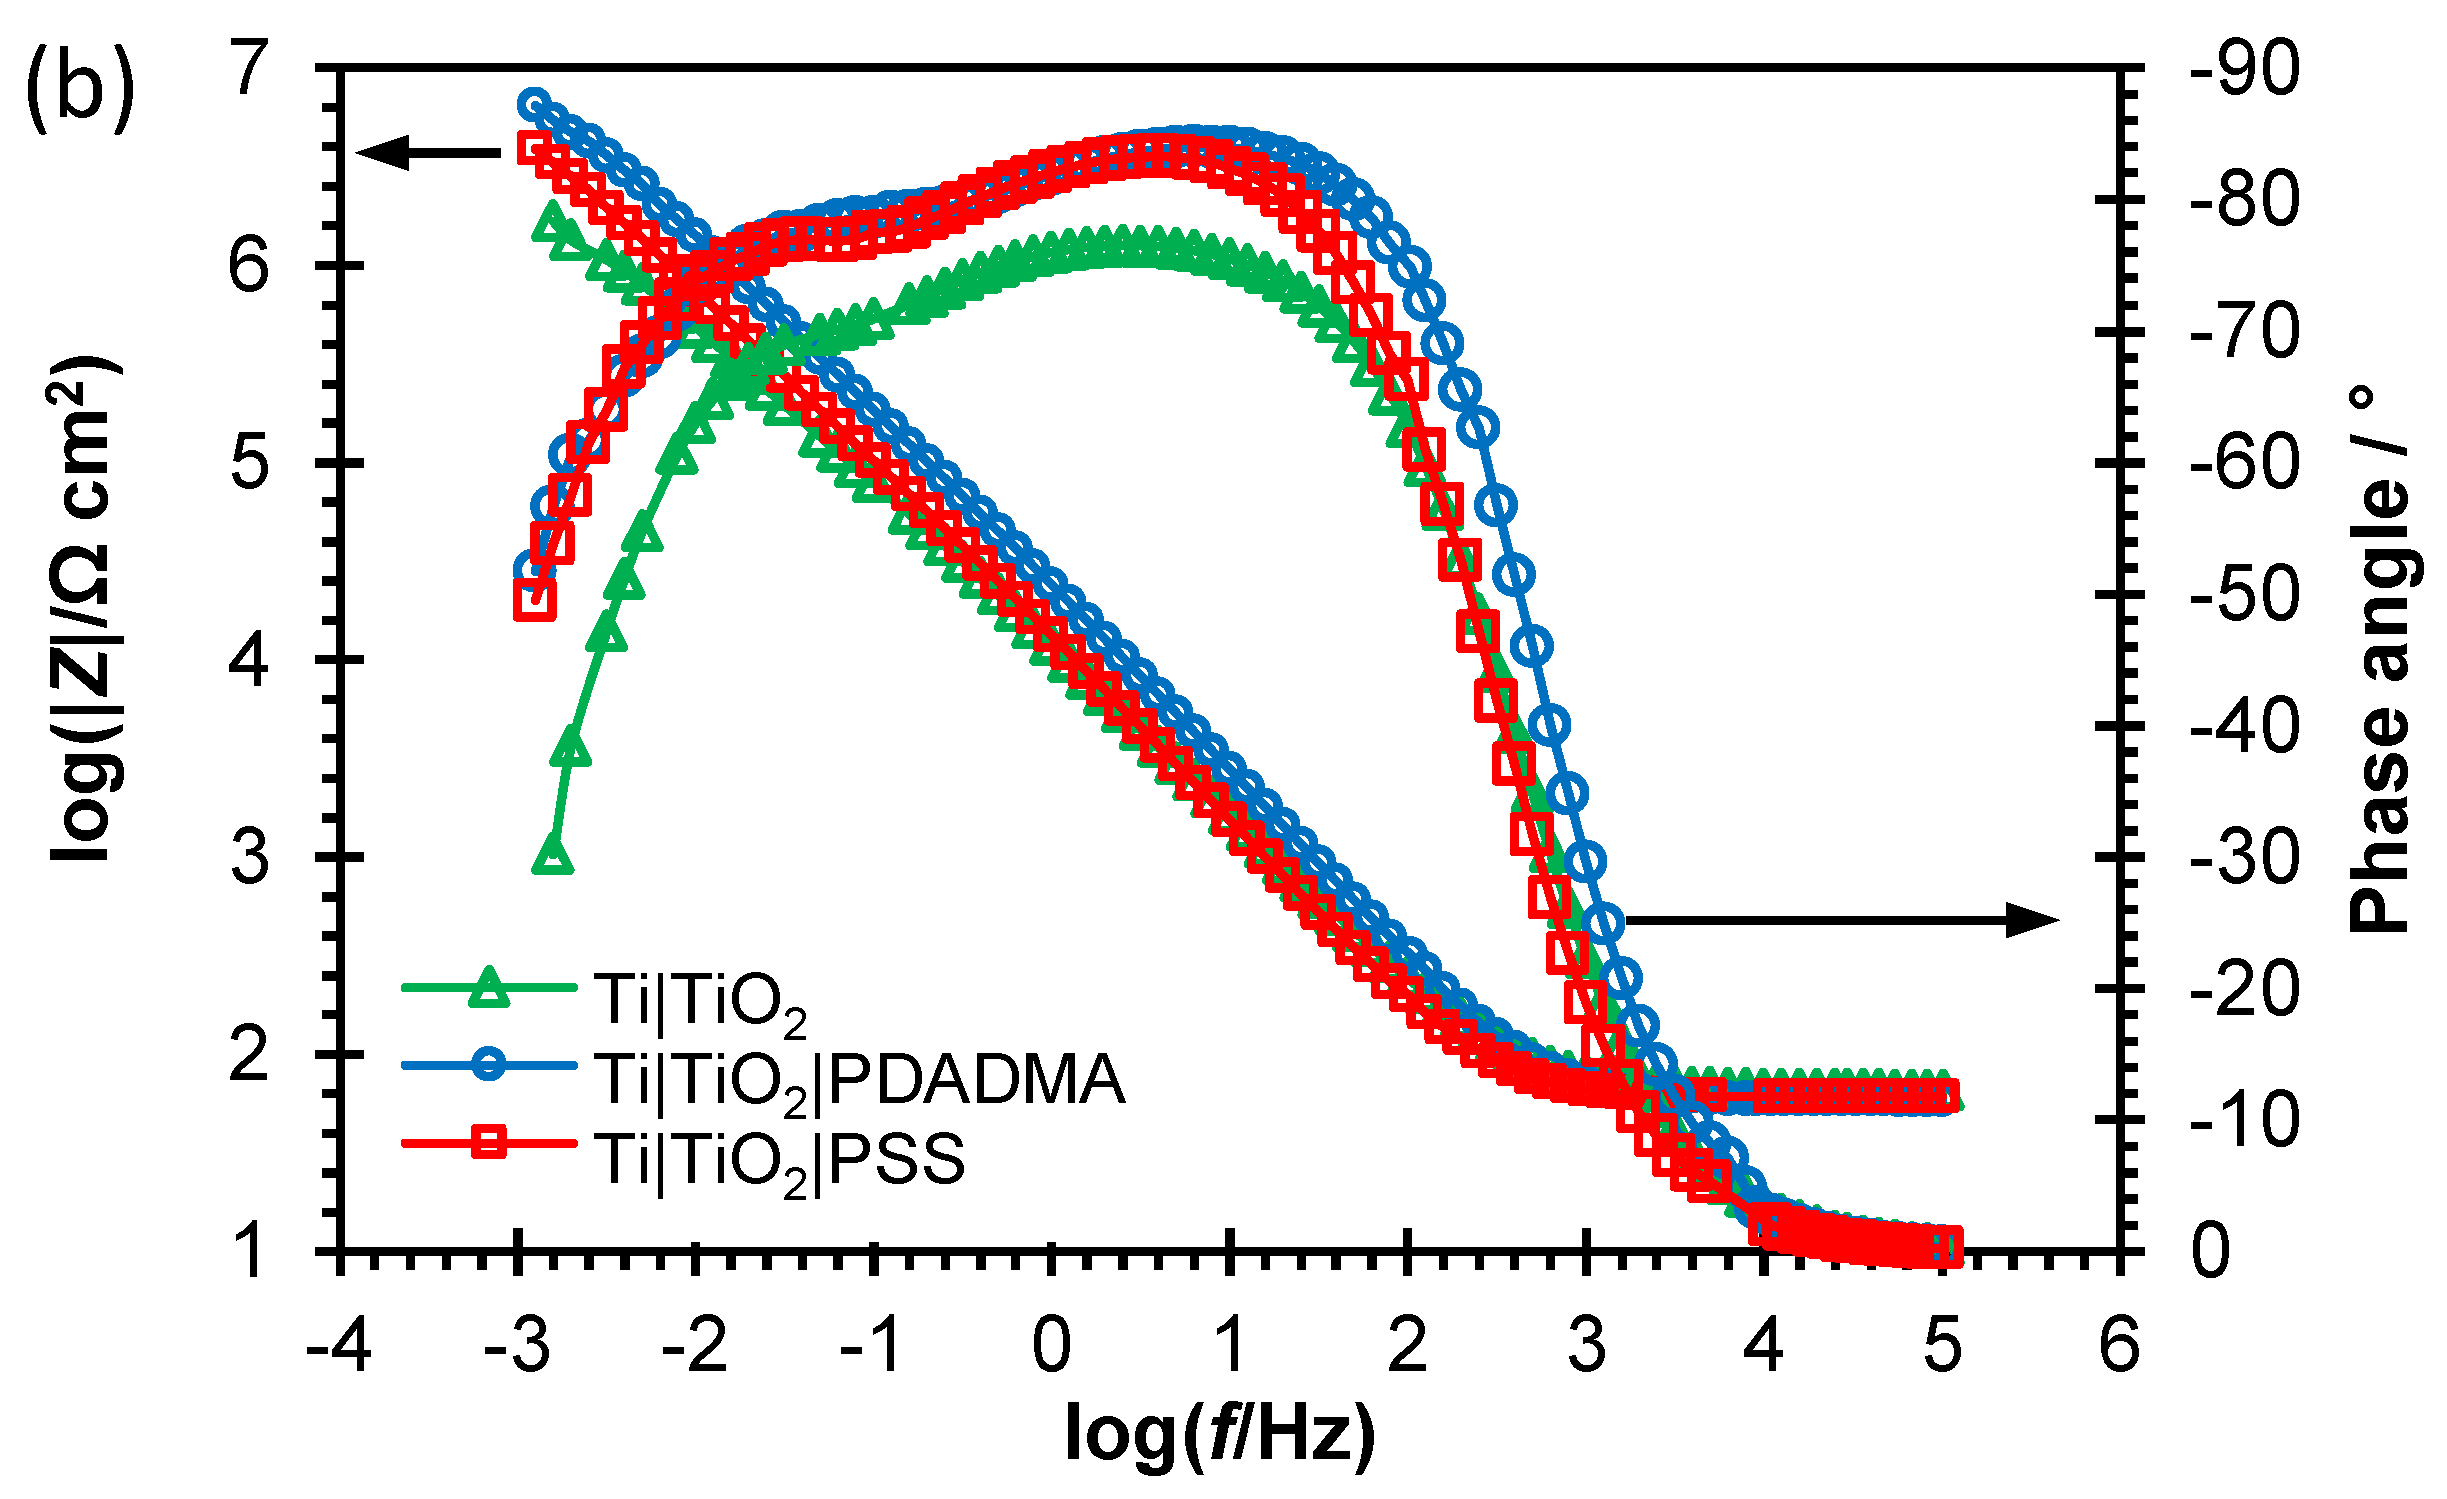
The corrosion (barrier) properties of unmodified (Ti|TiO
2) and polyelectrolyte-modified Ti substrates (Ti|TiO
2|PSS and Ti|TiO
2|PDADMA) were probed in 0.1 mol dm
−3 NaCl solution at
EOC over the wide frequency range. EIS data collected are provided in the Nyquist and Bode impedance spectra form (
Figure 4.). The PSS and PDADMA adsorption affected beneficially corrosion properties of the unmodified Ti substrate what was reflected in wider unfinished depressed semi-circle responses in Nyquist spectra and higher low frequency impedance magnitude values. Also, the polyion adsorption on flat TiO
2 surface resulted in more negative phase angle values, wider in the middle frequency range compared to the corresponding response of the unmodified titanium surface what as well points to improved barrier properties.
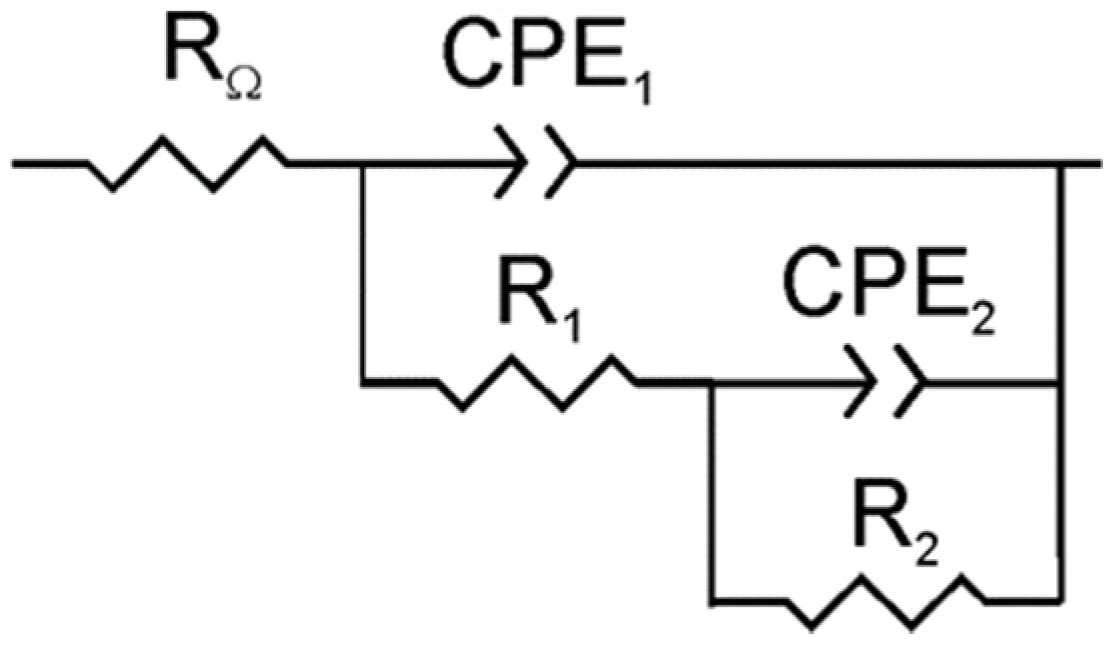
Impedance data were fitted by employing the complex non-linear least squares (CNLS) fit analysis [
38]. The obtained EIS data were modelled utilizing electrical equivalent circuit, EEC, with two time constants, schematically shown as
RΩ(CPE
1(
R1(CPE
2R2))) in
Figure 5. Analysis yielded χ
2 values less than 5 × 10
−3 with relative errors in parameter values of 1–5%.
Due to the presence of surface roughness or fractal geometry (surface inhomogeneity) resulting in capacitance dispersion, impedance ideal element, capacitor was described by a constant phase element, CPE with impedance equal to
In term (5),
Q is the frequency–independent CPE parameter related to the interface capacity,
n is the CPE exponent representing a degree of non-ideal capacitor behavior and
ω is the angular frequency [
42,
43,
44]. The interface capacitance values,
C were calculated using the Brug’s relation [
43]:
The impedance parameter values obtained by described EEC model fitting are provided in
Table 3.
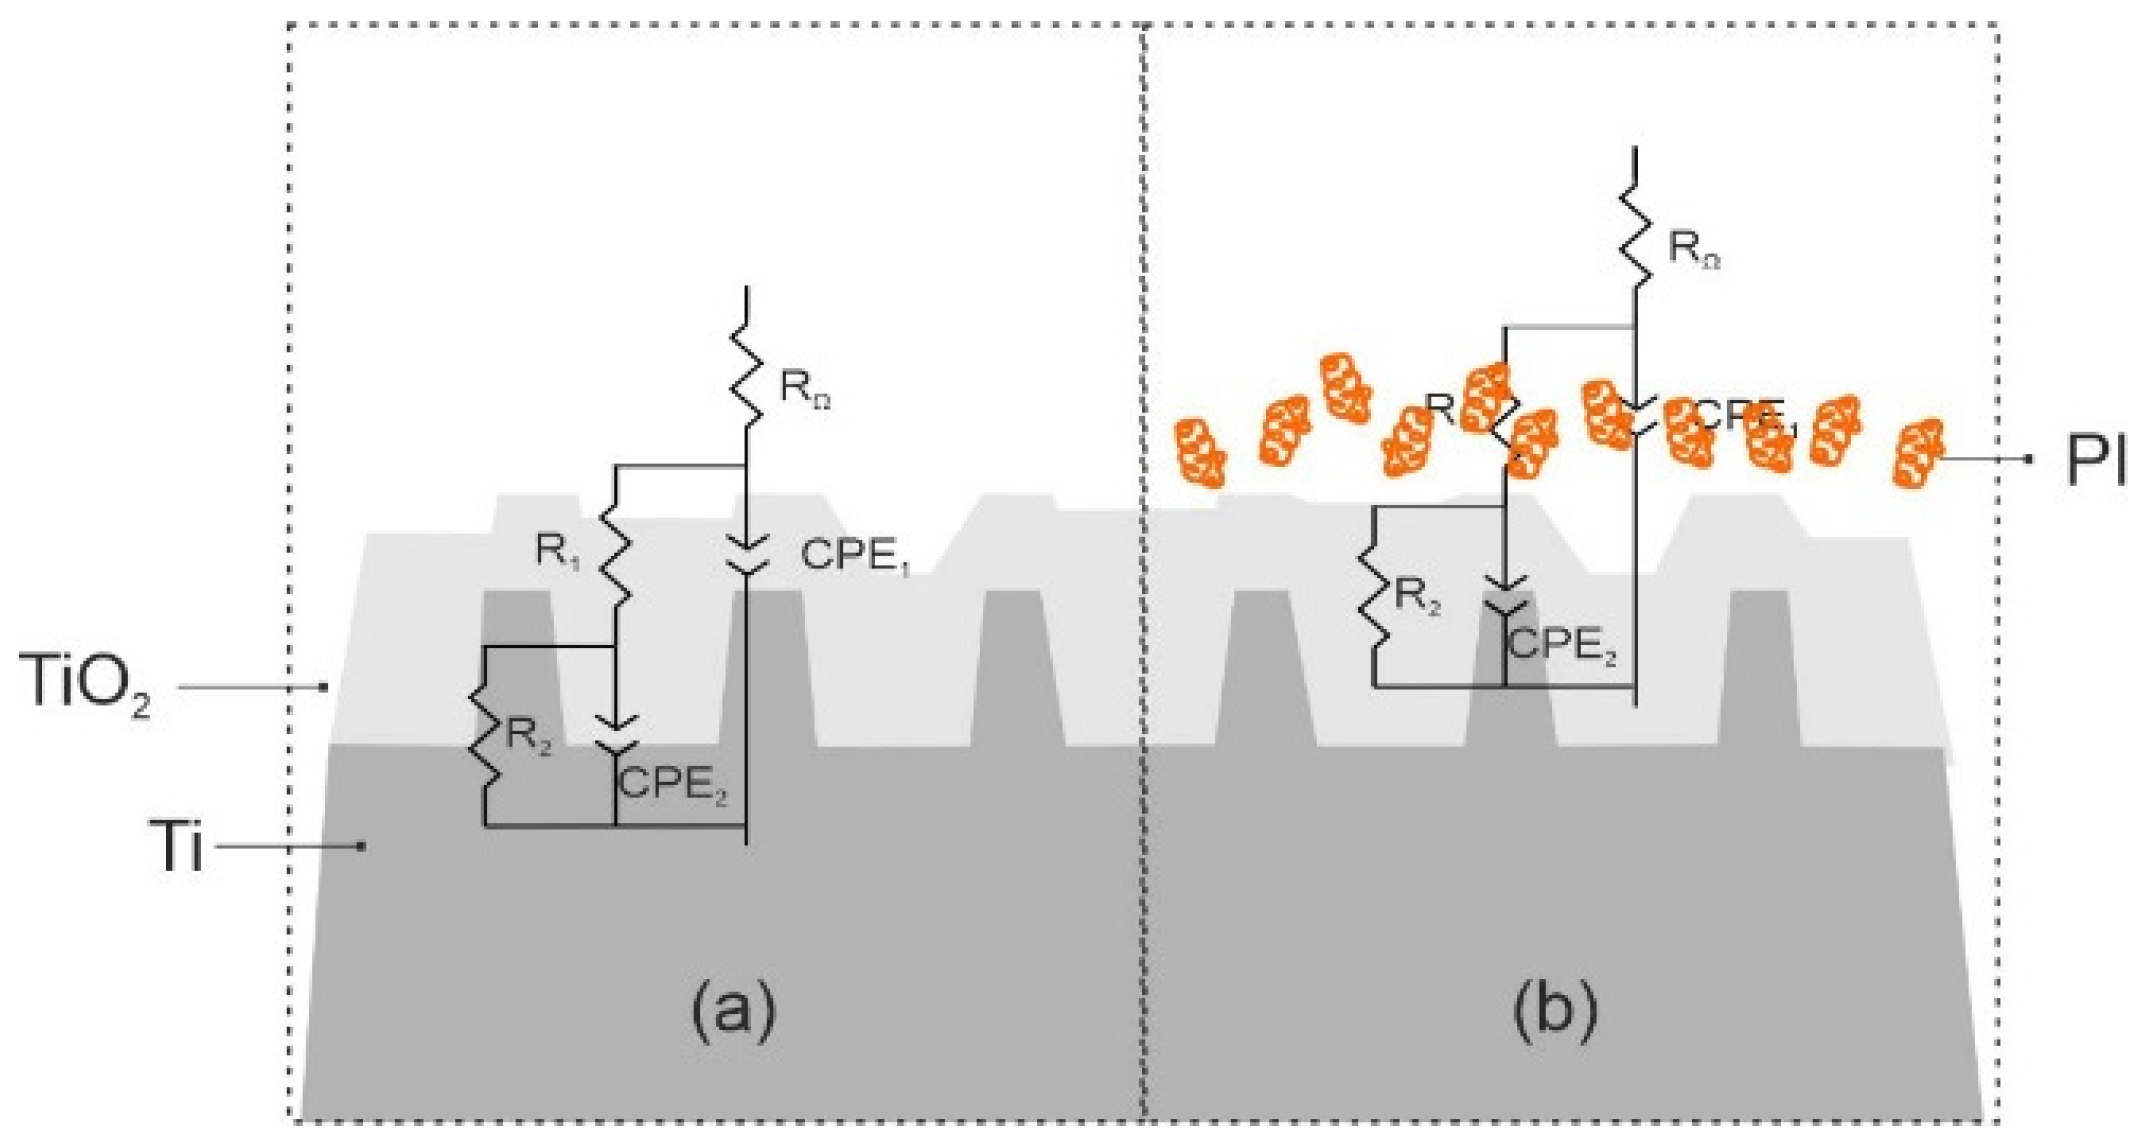
The EEC consisting of two time constants in parallel combination connected in series to ohmic (electrolyte) resistance,
RΩ has been frequently utilized to model EIS data of the oxide covered valve metals, including Ti metal materials in saline solution and is related to the duplex structured oxide film [
45,
46,
47,
48,
49].
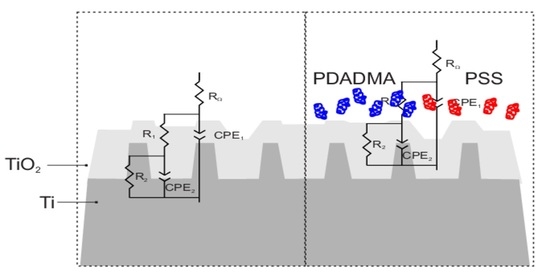
According to EEC model the titanium/titanium oxide interface structure corresponds to bi-layered oxide surface film (
Figure 6a). This surface film consists of the outer part of the oxide film characterized by
R1-CPE
1 time constant and the inner part of the oxide film characterized by
R2-CPE
2 time constant that is related to the barrier oxide layer, predominately being TiO
2 and determining corrosion resistance of titanium materials [
50]. According to the higher
R2 film’s resistance component value, it can be concluded that the inner part of the oxide film is more corrosion resistant and contributes mostly to the overall corrosion protection of titanium in NaCl solution. It was also corroborated by lower capacitance,
C and higher CPE exponent,
n values indicating the formation of more compact and thicker oxide film’s inner part.
For TiO
2 flat surfaces with adsorbed PSS and PDADMA polyions,
Figure 6b, two time constants are attributed to the outer and inner part of the surface polyelectrolyte coating formed over spontaneous TiO
2 oxide film. The EEC employed was previously reported for covered titanium metal materials [
51,
52,
53,
54].
The polyions adsorption resulted in few times higher surface film resistance, R2 values in comparison to unmodified TiO2 flat surface. Electrochemical interface changes due to polyions adsorption are also reflected in higher n1 values suggesting filling in the structural imperfections existing in the spontaneously formed oxide film. Lower capacitance values for both polyions covered surface in comparison to uncoated flat TiO2 surface confirm the formation of thicker surface film as was shown by AFM and ellipsometry results. For PDADMA coating, the significant R2 increase (to order of 107 Ω cm2) points to formation of highly protective compact barrier film formed upon polyelectrolyte surface modification. This is in agreement with the cyclic voltammetry results previously commented regarding the high protective properties.
The polarization (corrosion) resistance,
Rp, is the sum of
R1 and
R2 resistance contributions and determines the overall corrosion resistance of Ti substrate in electrolyte solution used [
50].
Rp values of Ti|TiO
2, Ti|TiO
2|PSS and Ti|TiO
2|PDADMA are equal to 2.11, 7.08 and 13.69 MΩ cm
2, respectively.
The corrosion protection effectiveness of the PSS and PDADMA polyion coated flat TiO
2 surface (
η) was obtained by use of the expression:
where
Rp(Ti|TiO
2) and
Rp(Ti|TiO
2|polyion) are the polarization resistance
Rp values determined from
R1 and
R2 values provided in
Table 3.
The corrosion protection effectiveness values of 70.2% and 84.6% for PSS and PDADMA coating, respectively, indicate that the corrosion properties were greatly improved upon polyions adsorption and polyelectrolyte coating formation on flat TiO
2 surface. PDADMA modification offers higher corrosion protection to the underlying titanium material in sodium chloride electrolyte solution. This can be the consequence of PDADMA coating’s more compact structure and better reorganization due to the stronger condensation of chloride anions to polycation chain than sodium cations to polyanion chain. Previous experimental investigations with another pair of polyelectrolytes suggested that counterion condensation is more pronounced in the case of polycation than in the case of polyanion chain [
55]. Moreover, molecular dynamics (MD) simulations revealed higher fraction of directly bound counterions (closer to the chain backbone) in the case of polycation. These results were in accordance with potentiometric ones showing lower measured ion activity of free chloride than of sodium ions in solution at the same molar concentration of polyelectrolytes (poly(allylamine hydrochloride) versus poly(sodium styrenesulfonate)) [
56]. The higher fraction of condensed ions leads to the weakening of repulsive electrostatic interactions between charged monomer groups, i.e., more effective charge screening on PDADMA than PSS chains, causing different conformational changes. According to that, PDADMA chains could form structures consisting of higher and/or wider islands at the surface with more material adsorbed than in the case of PSS, leading to better surface coverage and higher surface roughness as shown by AFM measurements.
3.5. Inner Surface Potential Measurements
The open circuit potential of the cell composed of Ti/TiO
2-E (
EOC/mV) and reference electrode (Ag|AgCl|3 M KCl) arises as a result of the ion adsorption equilibrium within the TiO
2/aqueous electrolyte solution electrical interfacial layer. It was found that, as expected, electrode potential decreases with increasing pH of aqueous sodium chloride solution (
Figure 7), as by increasing the pH the Ti/TiO
2 surface becomes more negatively charged. The inner surface potential of TiO
2 was calculated from the measured electrode potential using Equation (3). The obtained slope of
Ψ0(pH) function for amorphous TiO
2 layer was found to be –5 mV, which is much lower than slopes measured for TiO
2 (110) and (100) crystal planes [
16]. It can also be noticed that absolute value of TiO
2 inner surface potential is significantly higher at pH = 11 than at pH = 3 i.e., at pH = 11 the TiO
2 surface is more negatively charged which affects the binding of polyions. This finding is in accordance with the published zeta potential values of spontaneously formed TiO
2 passive layer on titanium in potassium chloride aqueous solution measured by streaming current [
22]. The higher value of the surface potential in the basic pH region explains the better coverage of the Ti/TiO
2 surface with polycations.
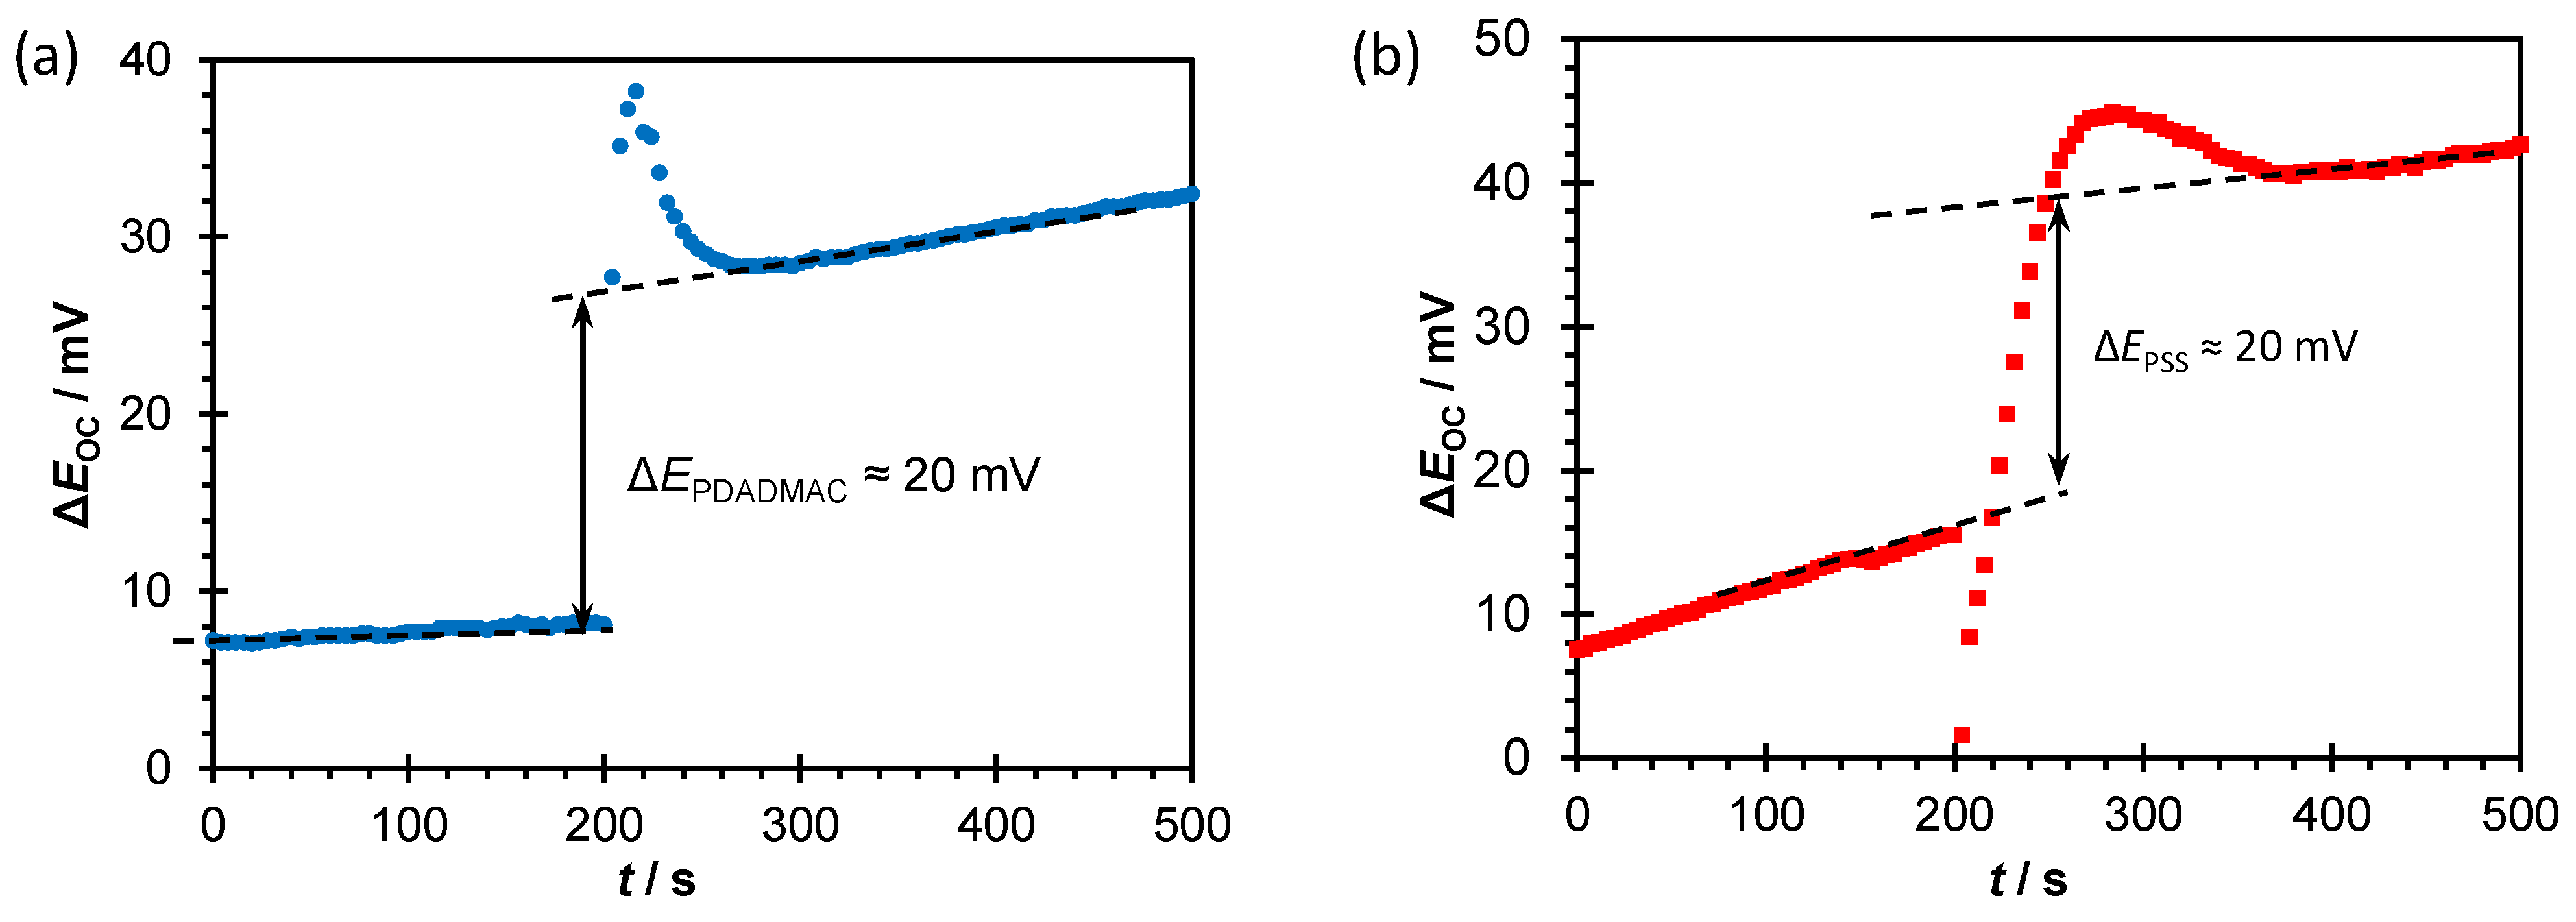
The electrode potential of Ti/TiO2 was measured before, during and after the addition of the polyions. Before the measurements the electrode was stabilized in aqueous sodium chloride solution of corresponding pH. By addition of polyions (PSS and PDADMA) in aqueous electrolyte solution, adsorption takes places. At pH ≈ 3 negatively charged PSS polyions adsorb on positively charged TiO2 surface. At pH ≈ 11 positively charged PDADMA polyions adsorb on negatively charged TiO2 surface.
After addition of polyelectrolyte solution, measured surface potential becomes more positive by approximately 20 mV for both polyelectrolytes (
Figure 8). A steep jump in the electrode potential followed by stabilization of the signal was observed. Stable signal was reached in approximately 1 min after addition of PDADMA, and in 3 min after addition of PSS. More positive surface potential is expected for adsorption of polycation on the negatively charged TiO
2 surface [
57]. It is to be expected that due to the electrostatic adsorption of polyanions on the positive TiO
2 surface, the value of the surface potential will decrease. The observed opposite trend can be explained by redistribution of ions and change of water molecules orientation due to penetration of PSS into the interfacial region. Such change in composition affects the involved capacitances (which is confirmed by EIS measurements,
Table 3). The decrease in capacitance values causes increase in the measured surface potential which may be stronger than the reduction of potential caused by the compensation of positively charged ≡TiO
2+ groups by negatively charged sulfonate groups of PSS chains. This finding suggests the weaker PSS-TiO
2 interactions, and better reorganization of polycation chains and confirms the results obtained by electrochemical measurements (CV and EIS).


 ,
, 


