
Illite-Age-Analysis (IAA) for the Dating of Shallow Faults: Prerequisites and Procedures for Improvement


Abstract
:1. Introduction
2. Basic Concept of IAA and Previous Studies
= (λe + λβ)(Ara(1 − x) + Ard·x)/λe·K
= (λe + λβ)(Ara + (Ard − Ara)x)/λe·K
3. Selection of Size Fractions and Its Interval
4. X-ray Diffractometry Procedure for IAA
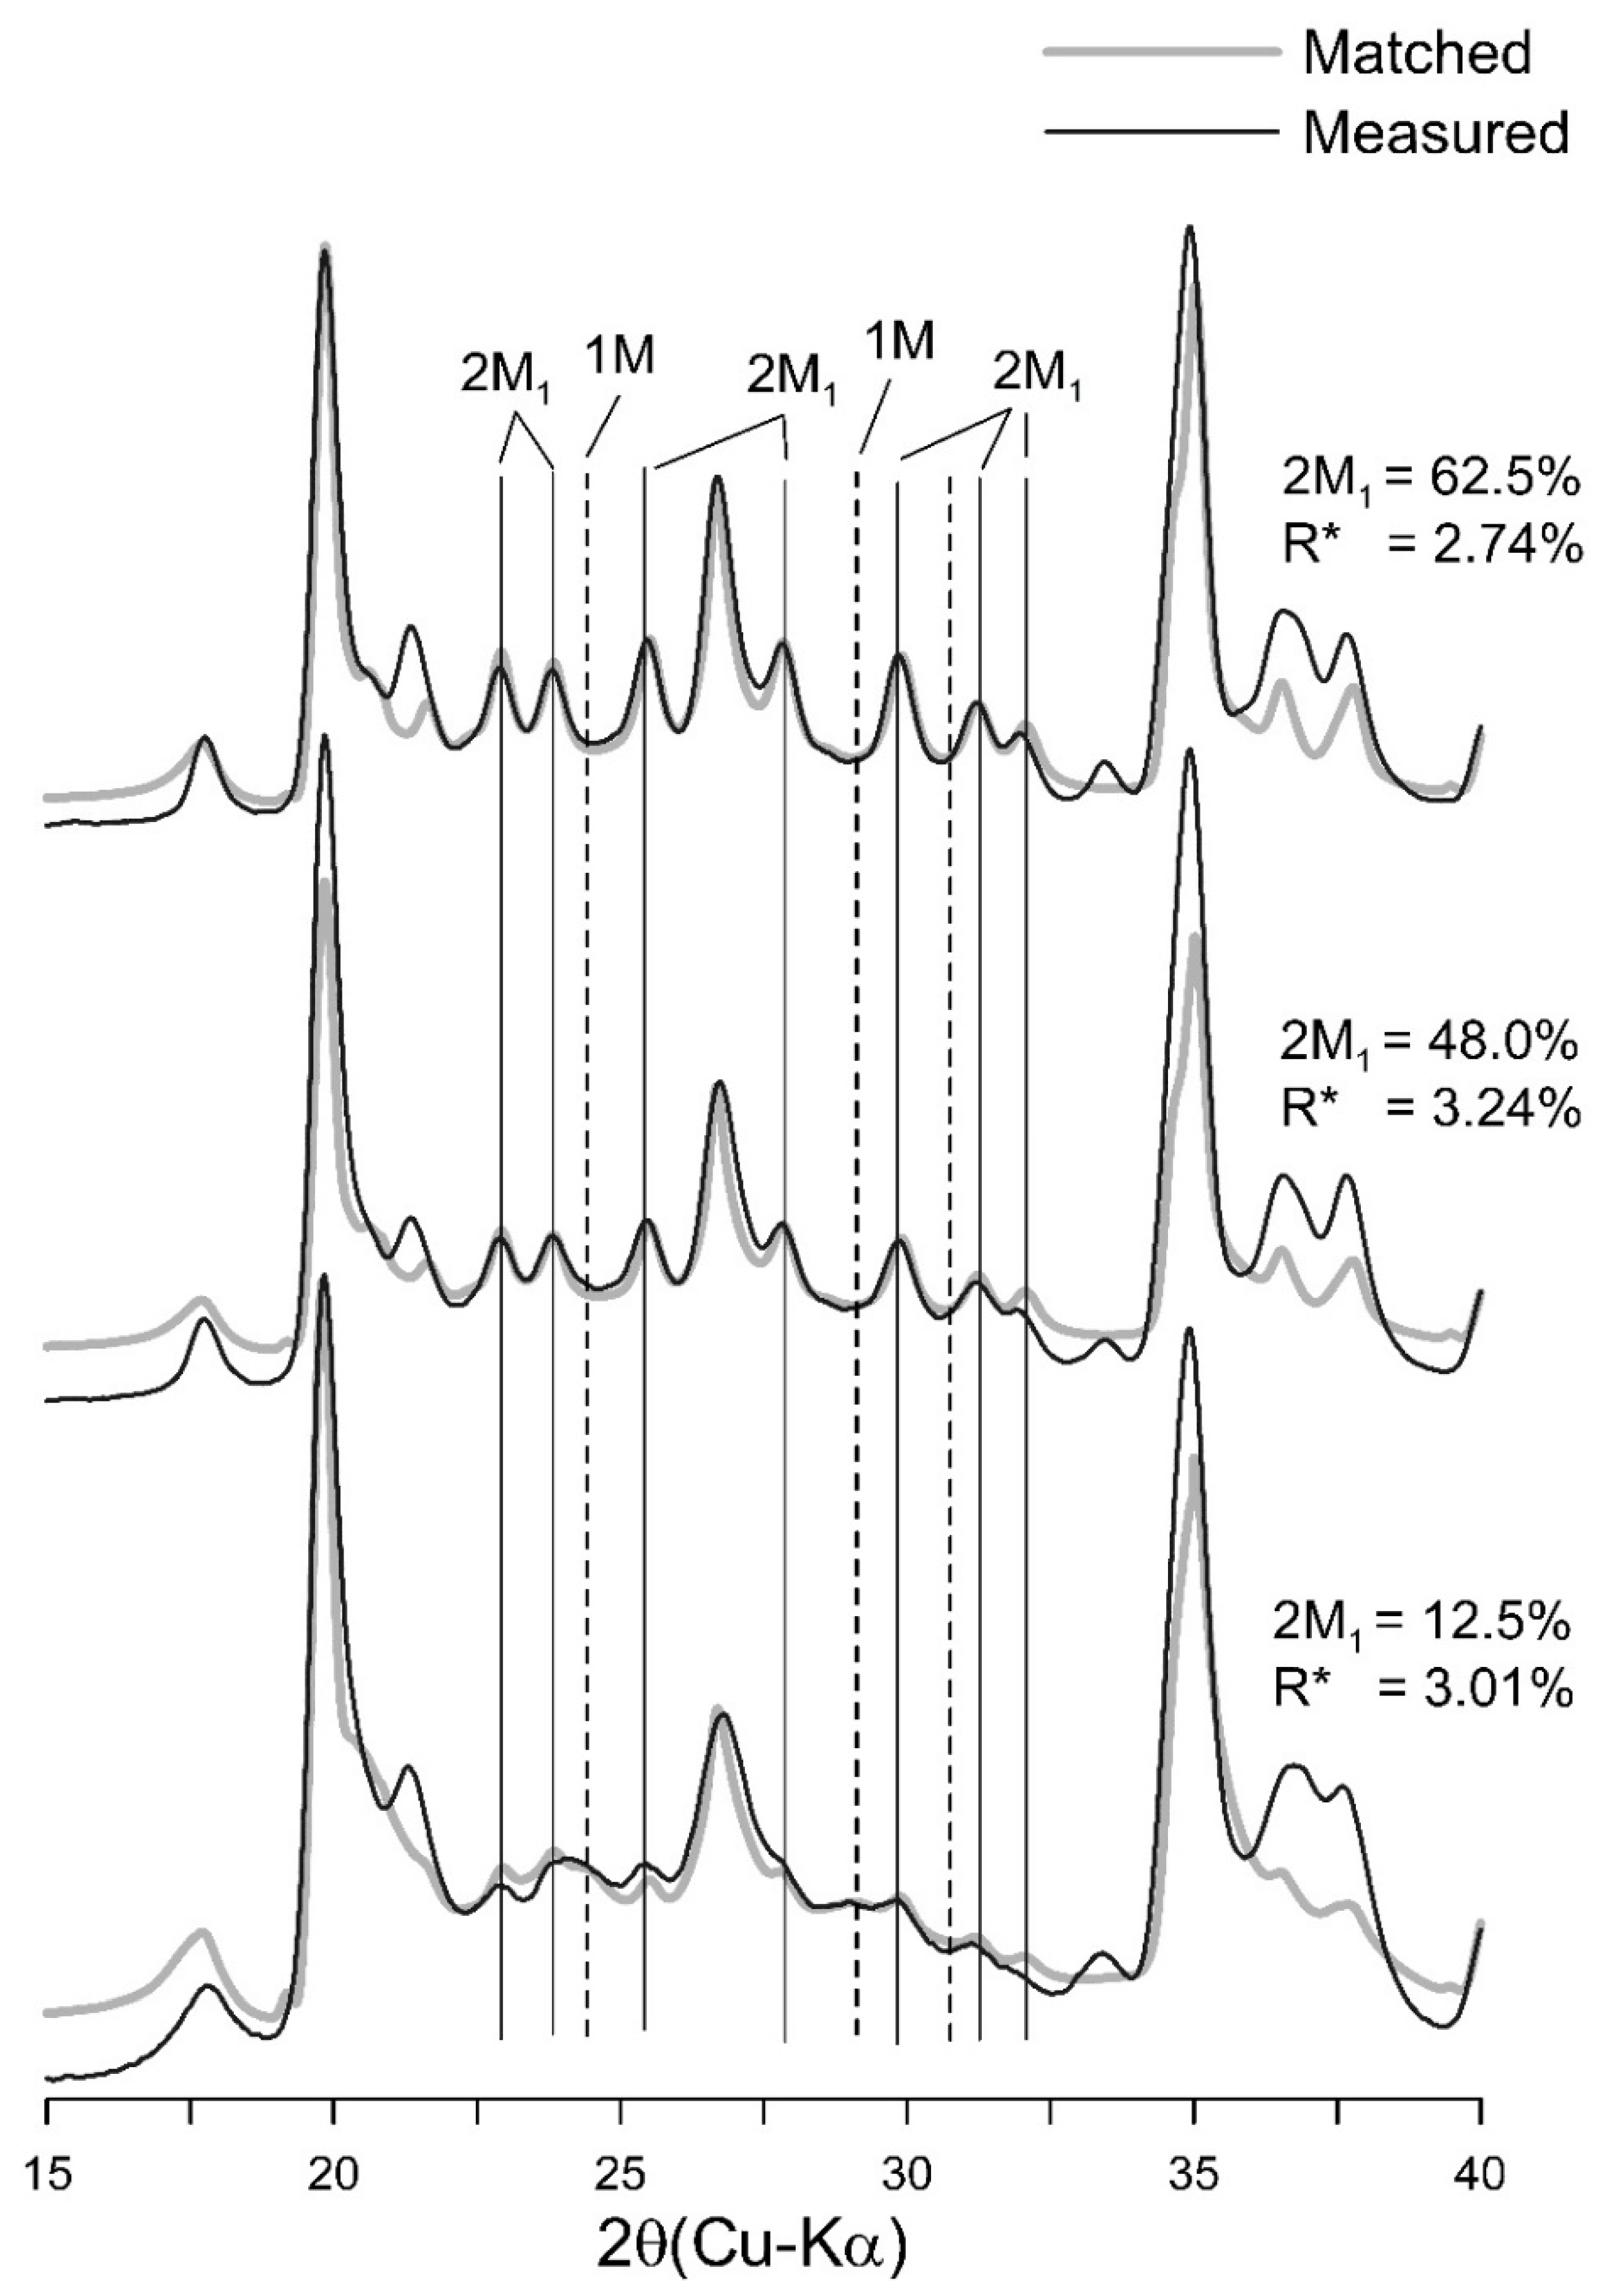
5. WILDFIRE©-Based Polytype Quantification
5.1. Simulation of Polytype XRD Patterns Using WILDFIRE©
- -
- probability of zero rotation (P0)
- -
- probability of 120 rotation (P120)
- -
- fraction of n.60 degree rotation (F60)
- -
- proportion of cis-vacant layers (Pcis)
- -
- mean defect-free (Coherence) distance (MDFD)
- -
- water in expandable interlayers
- -
- crystallite thickness (% expandability)
- -
- no. of unit cells along X (N1)
- -
- no. of unit cells along Y (N2)
- -
- no. of unit cells along Z (N3)
- -
- K and Fe fraction in the structure
- -
- Randomness of sample (Dollase factor)
- -
- ordering of the illite/smectite (Reichweite), etc.
5.2. Illite Polytype Quantification
6. Radiometric Dating Method
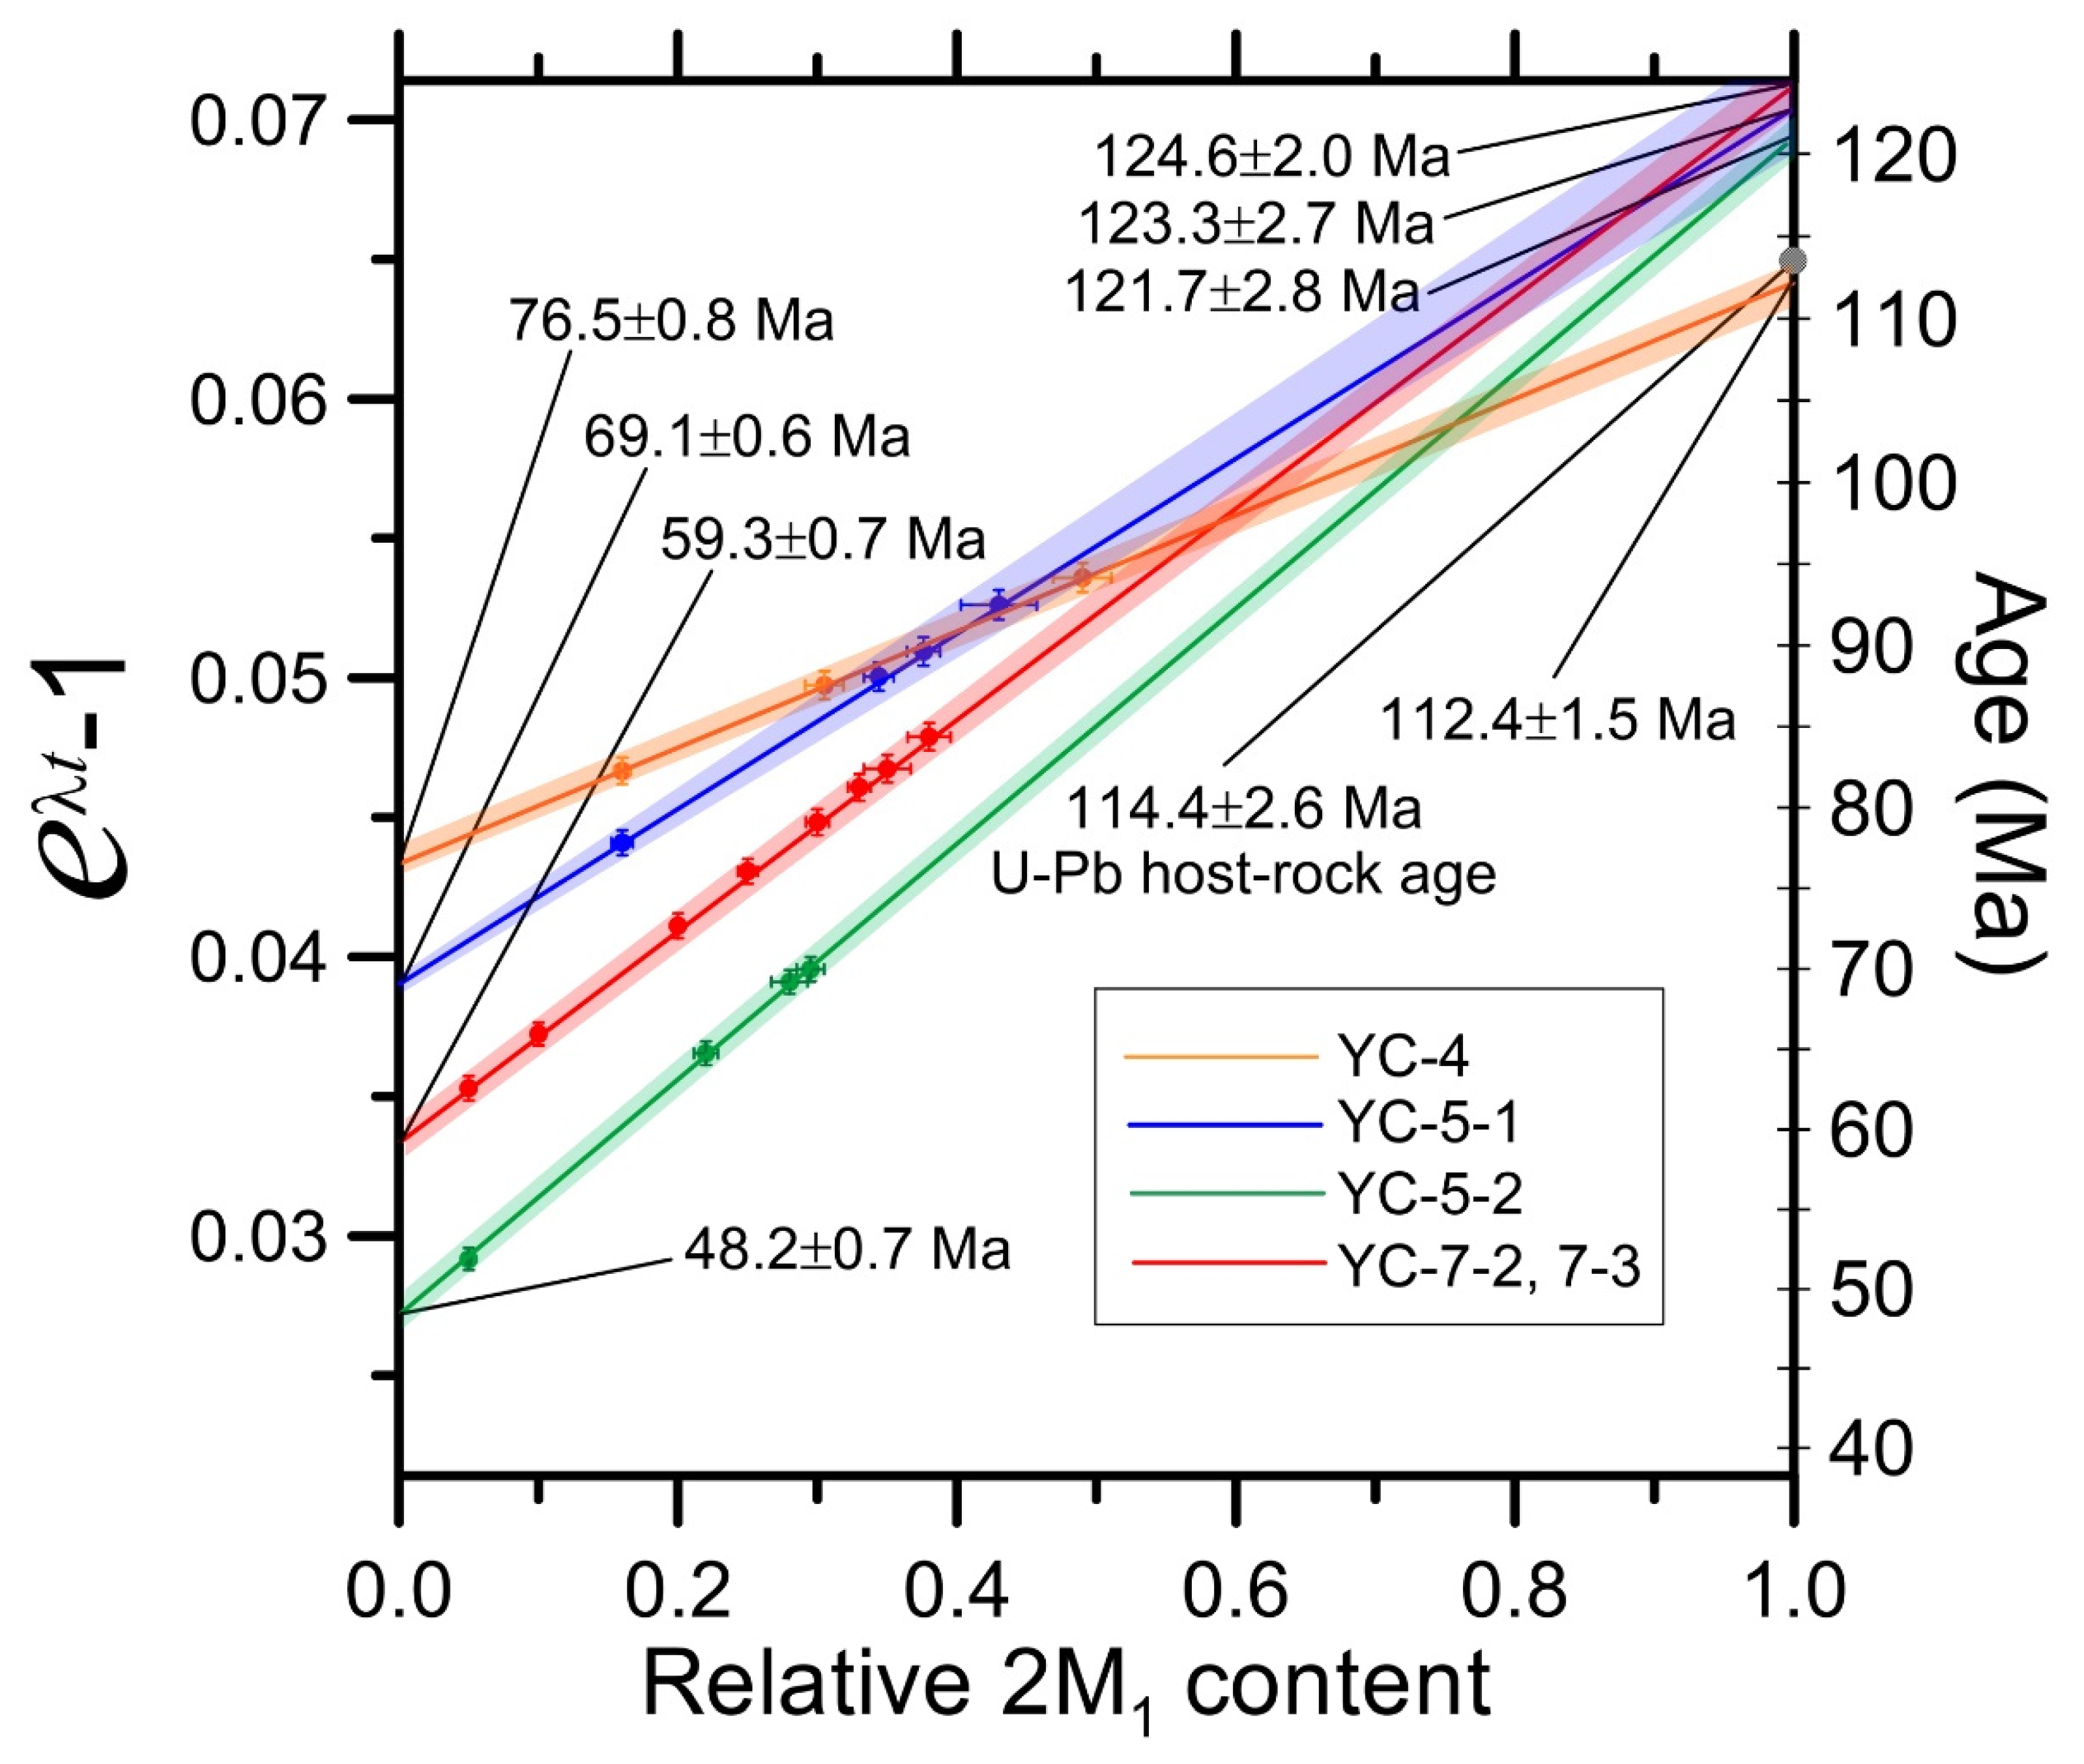
7. IAA (Illite-Age-Analysis) for Fault Dating
8. Prerequisites and Procedures for Improvement of IAA
9. Concluding Remarks
Author Contributions
Funding
Conflicts of Interest
References
- Pevear, D.R. Illite age analysis, a new tool for basin thermal history analysis. In Water-Rock Interaction; Kharaka, Y.K., Maest, A.S., Eds.; Balkema: Rotterdam, The Netherlands, 1992; pp. 1251–1254. [Google Scholar]
- Pevear, D.R. Illite and hydrocarbon exploration. Proc. Natl. Acad. Sci. USA 1999, 96, 3440–3446. [Google Scholar] [CrossRef] [PubMed] [Green Version]
- Van der Pluijm, B.A.; Hall, C.M.; Vrolijk, P.J.; Pevear, D.R.; Covey, M.C. The dating of shallow faults in the Earth’s crust. Nature 2001, 412, 172–175. [Google Scholar] [CrossRef] [Green Version]
- Reynolds, R.C., Jr. WILDFIRE: A Computer Program for the Calculation of Three-Dimensional X-ray Diffraction Patterns of Mica Polytypes and Their Disordered Variation; Wildfire©: Hanover, NH, USA, 1994. [Google Scholar]
- Solum, J.G.; van der Pluijm, B.A.; Peacor, D.R. Neocrystallization, fabrics and age of clay minerals from an exposure of the Moab Fault, Utah. J. Struct. Geol. 2005, 27, 1563–1576. [Google Scholar] [CrossRef]
- Van der Pluijm, B.A.; Vrolijk, P.J.; Pevear, D.R.; Hall, C.M.; Solum, J.G. Fault dating in the Canadian Rocky Mountains; Evidence for late Cretaceous and early Eocene orogenic pulse. Geology 2006, 34, 837–840. [Google Scholar] [CrossRef] [Green Version]
- Uysal, I.T.; Mutlu, H.; Altunel, E.; Karabacak, V.; Golding, S.D. Clay mineralogical and isotopic (K–Ar, δ18O, δD) constraints on the evolution of the North Anatolian Fault Zone, Turkey. Earth Planet. Sci. Lett. 2006, 243, 181–194. [Google Scholar] [CrossRef]
- Haines, S.H.; van der Pluijm, B.A. Clay quantification and Ar-Ar dating of synthetic and natural gouge: Application to the Miocene Sierra Mazatan detachment fault, Sonora, Mexico. J. Struct. Geol. 2008, 30, 525–538. [Google Scholar] [CrossRef]
- Haines, S.H.; van der Pluijm, B.A. Dating the detachment fault system of the Ruby Mountains, Nevada: Significance for the kinematics of low-angle normal faults. Tectonics 2010, 29, TC4028. [Google Scholar] [CrossRef]
- Schleicher, A.M.; van der Pluijm, B.A.; Warr, L.N. Nanocoatings of clay and creep of the San Andreas fault at Perkfield, California. Geology 2010, 38, 667–670. [Google Scholar] [CrossRef] [Green Version]
- Duvall, A.R.; Clark, M.K.; van der Pluijm, B.A.; Li, C. Direct dating of Eocene reverse faulting in northeastern Tibet using Ar-dating of fault clays and low-temperature thermochronometry. Earth Planet. Sci. Lett. 2011, 304, 520–526. [Google Scholar] [CrossRef]
- Rahl, J.M.; Haines, S.H.; van der Pluijm, B.A. Links between orogenic wedge deformation and erosional exhumation: Evidence from illite age analysis of fault rock and detrital thermochronology of syn-tectonic conglomerates in the Spanish Pyrenees. Earth Planet. Sci. Lett. 2011, 307, 180–190. [Google Scholar] [CrossRef]
- Chung, D.; Song, Y.; Park, C.-Y.; Kang, I.-M.; Choi, S.-J.; Khulganakhuu, C. Reactivated Timings of Some Major Faults in the Chugaryeong Fault Zone since the Cretaceous Period. Econ. Environ. Geol. 2014, 47, 29–38, (In Korean with English Abstract). [Google Scholar] [CrossRef] [Green Version]
- Song, Y.; Chung, D.; Choi, S.-J.; Kang, I.-M.; Park, C.; Itaya, T.; Yi, K. K-Ar illite dating to constrain multiple events in shallow crustal rocks: Implications for the Late Phanerozoic evolution of NE Asia. J. Asian Earth Sci. 2014, 95, 313–322. [Google Scholar] [CrossRef]
- Khulganakhuu, C.; Song, Y.; Chung, D.; Park, C.; Choi, S.-J.; Kang, I.-M.; Yi, K. Reactivated Timings of Inje Fault since the Mesozoic Era. Econ. Environ. Geol. 2015, 48, 41–49, (In Korean with English Abstract). [Google Scholar] [CrossRef] [Green Version]
- Bui, H.B.; Ngo, X.T.; Song, Y.; Itaya, T.; Yagi, K.; Khuong, T.H.; Nguyen, T.D. K-Ar Dating of Fault Gouges from the Red River Fault Zone of Vietnam. Acta Geol. Sin. (Engl. Ed.) 2016, 90, 1801–1811. [Google Scholar] [CrossRef]
- Fitz-Dıaz, E.; Hall, C.M.; van der Pluijm, B.A. XRD-based 40Ar/39Ar age correction for fine-grained illite, with application to folded carbonates in the Monterrey Salient (northern Mexico). Geochim. Cosmochim. Acta 2016, 181, 201–216. [Google Scholar] [CrossRef] [Green Version]
- Haines, S.; Lynch, E.; Mulch, A.; Valley, J.W.; van der Pluijm, B.A. Meteoric fluid infiltration in crustal-scale normal fault systems as indicated by d18O and d2H geochemistry and 40Ar/39Ar dating of neoformed clays in brittle fault rocks. Lithosphere 2016, 8, 587–600. [Google Scholar] [CrossRef]
- Song, Y.; Park, C.; Sim, H.; Choi, W.; Son, M.; Khulganakhuu, C. Reactivated Timings of Yangsan Fault in the Sangcheon-ri Area, Korea. Econ. Environ. Geol. 2016, 49, 97–104, (In Korean with English Abstract). [Google Scholar] [CrossRef]
- Bui, H.B.; Ngo, X.T.; Khuing, T.H.; Golonka, J.; Nguyen, T.D.; Song, Y.; Itaya, T.; Yagi, K. Episodes of brittle deformation within the Dien Bien Phu Fault zone, Vietnam: Evidence from K-Ar age dating of authigenic illite. Tectonophysics 2017, 695, 53–63. [Google Scholar] [CrossRef]
- Ring, U.; Uysal, I.T.; Glodny, J.; Cox, S.C.; Little, T.; Thomson, S.N.; Stübner, K.; Bozkaya, Ö. Fault-gouge dating in the Southern Alps, New Zealand. Tectonophysics 2017, 717, 321–338. [Google Scholar] [CrossRef]
- Sim, H.; Song, Y.; Son, M.; Park, C.; Choi, W.; Khulganakhuu, C. Reactivated Timings of Yangsan Fault in the Northern Pohang Area, Korea. Econ. Environ. Geol. 2017, 50, 97–104, (In Korean with English Abstract). [Google Scholar] [CrossRef]
- Jang, Y.; Kwon, S.; Song, Y.; Kim, S.W.; Kwon, Y.K.; Yi, K. Phanerozoic polyphase orogenies recorded in the northeastern Okcheon Belt, Korea from SHRIMP U-Pb detrital zircon and K-Ar illite geochronologies. J. Asian Earth Sci. 2018, 157, 198–217. [Google Scholar] [CrossRef]
- Kemp, S.J.; Gillespie, M.R.; Leslie, G.A.; Zwingmann, H.; Campbell, S.D.G. Clay mineral dating of displacement on the Sronlairig Fault: Implications for Mesozoic and Cenozoic tectonic evolution in northern Scotland. Clay Miner. 2019, 54, 181–196. [Google Scholar] [CrossRef]
- Lynch, E.A.; Mulch, A.; Yonkee, A.; van der Pluijm, B.A. Surface fluids in the evolving Sevier fold–thrust belt of ID–WY indicated by hydrogen isotopes in dated, authigenic clay minerals. Earth Planet. Sci. Lett. 2019, 513, 29–39. [Google Scholar] [CrossRef]
- Park, S.-I.; Noh, J.; Cheong, H.J.; Kwon, S.; Song, Y.; Kim, S.W.; Santosh, M. Inversion of two-phase extensional basin systems during subduction of the Paleo-Pacific Plate in the SW Korean Peninsula: Implication for the Mesozoic “Laramide-style” orogeny along East Asian continental margin. Geosci. Front. 2019, 10, 909–925. [Google Scholar] [CrossRef]
- Zhao, Q.; Yan, Y.; Tonai, S.; Tomioka, N.; Clift, P.D.; Hassan, M.H.A.; Aziz, J.H.B.A. A new K-Ar illite dating application to constrain the timing of subduction in West Sarawak, Borneo. GSA Bull. 2021. [Google Scholar] [CrossRef]
- Zwingmann, H.; Mancktelow, N.; Antognini, M.; Lucchini, R. Dating of shallow faults: New constraints from the AlpTransit tunnel site (Switzerland). Geology 2010, 38, 487–490. [Google Scholar] [CrossRef]
- Zwingmann, H.; Han, R.; Ree, J.-H. Cretaceous reactivation of the Deokpori Thrust, Taebaeksan Basin, South Korea, constrained by K-Ar dating of clayey fault gouge. Tectonics 2011, 30, TC5015. [Google Scholar] [CrossRef]
- Tonai, S.; Ito, S.; Hashimoto, Y.; Tamura, H.; Tomioka, N. Complete 40Ar resetting in an ultracataclasite by reactivation of a fossil seismogenic fault along the subducting plate interface in the Mugi Melange of the Shimanto accretionary complex, southwest Japan. J. Struct. Geol. 2016, 89, 19–29. [Google Scholar] [CrossRef]
- Aledga, L.; Viola, G.; Casas-Sainz, A.; Marcén, M.; Román-Berdiel, T.; van der Lelij, R. Unraveling multiple thermotectonic events accommodated by crustal-scale faults in northern Iberia, Spain: Insights from K-Ar dating of clay gouges. Tectonics 2019, 38, 3629–3651. [Google Scholar]
- Fisher, D.M.; Tonai, S.; Hashimoto, Y.; Tomioka, N.; Oakley, D. K-Ar dating of fossil seismogenic thrusts in the Shimanto Accretionary Complex, Southwest Japan. Tectonics 2019, 38, 3866–3880. [Google Scholar] [CrossRef]
- Grathoff, G.; Moore, D. Illite polytype quantification using WILDFIRE© calculated X-ray diffraction pat terns. Clays Clay Miner. 2016, 44, 835–842. [Google Scholar] [CrossRef]
- Ylagan, R.F.; Kim, C.S.; Pevear, D.R.; Vrolijk, P.J. Illite polytype quantification for accurate K-Ar age determination. Am. Mineral. 2002, 87, 1536–1545. [Google Scholar] [CrossRef]
- Boles, A.; Schleicher, A.M.; Solum, J.; van der Pluijm, B. Quantitative X-ray powder diffraction and the illite polytype analysis method for direct fault rock dating: A comparison of analytical techniques. Clays Clay Miner. 2018, 66, 220–232. [Google Scholar] [CrossRef]
- Chung, D.; Song, Y.; Kang, I.-M.; Park, C.-Y. Optimization of illite polytype quantification method. Econ. Environ. Geol. 2013, 46, 1–9, (In Korean with English Abstract). [Google Scholar] [CrossRef] [Green Version]
- Clauer, N.; Zwingmann, H.; Liewig, N.; Wendling, R. Comparative 40Ar–39Ar and K–Ar dating of illite-type clay minerals: A tentative explanation for age identities and differences. Earth-Sci. Rev. 2012, 115, 76–96. [Google Scholar] [CrossRef]
- Kübler, B. Les indicateurs des transformations physiques etchimiquesdans la diagènese, température et calorimétrie. In Thermométrie et Barométriegéologiques; Lagache, M., Ed.; French Society of Mineralogy and Crystallography: Paris, France, 1084; pp. 489–596. [Google Scholar]


| No. | Fault Name | Size Fractions (µm) | XRD Equipment with Sample Holder | Illute Polytype Quantification | Radiometric Dating | Year | Ref. No |
|---|---|---|---|---|---|---|---|
| 1 | Lewis thrust | <0.02, 0.02–0.2, 0.2–2 | Conventional | Grathoff and Moore (1996) method using WILDFIRE | 40Ar/39Ar | 2001 | 3 |
| 2 | Moab Fault, Utah | <0.05, 0.05–0.5, 0.5–2 | Conventional | Grathoff and Moore (1996) method using WILDFIRE | 40Ar/39Ar | 2005 | 5 |
| 3 | Faults in Canadian Rocky Mountains | <0.02, 0.02–0.2, 0.2–2 | Conventional | Grathoff and Moore (1996) method using WILDFIRE | 40Ar/39Ar | 2006 | 6 |
| 4 | Anatolian Fault | <0.2, 0.2–0.5, 0.5–1, 1–2, >2 | Conventional | Grathoff and Moore (1996) method using WILDFIRE | K-Ar | 2006 | 7 |
| 5 | Sierra Mazatan detachment fault | <0.05, 0.05–0.1, 0.1–0.5, 0.5–1, 1–2 | Conventional | Lowest-variance approach using WILDFIRE | 40Ar/39Ar | 2008 | 8 |
| 6 | Fault of the Ruby Mountains | <0.05, 0.05–0.4, 0.4–2 | Conventional | Lowest-variance approach using WILDFIRE | 40Ar/39Ar | 2009 | 9 |
| 7 | San Andreas fault, Parkfield, Califonia | <0.02, 0.02–0.2, 0.2–2 | Conventional | Lowest-variance approach using WILDFIRE | 40Ar/39Ar | 2010 | 10 |
| 8 | Faults in AlpTransit deep tunnel site | <0.1, 0.1–0.4, 0.4–2, 2–6, 6–10 | Conventional | SIROQUANT from Sietronics Pty Ltd. | K-Ar | 2010 | 28 |
| 9 | West Qinling fault | <0.05, 0.05–0.2, 0.2–2 | Conventional | Lowest-variance approach using WILDFIRE | 40Ar/39Ar | 2011 | 11 |
| 10 | Pyrenean thrusts | <0.05, 0.05–0.4, 0.4–2 | Conventional | Lowest-variance approach using WILDFIRE | 40Ar/39Ar | 2011 | 12 |
| 11 | Deokpori Thrust | <0.1, 0.1–0.4, 0.4–2, 2–6, 6–10 | Conventional | not mentioned in detail | K-Ar | 2011 | 29 |
| 12 | Chugaryeong fault zone, Korea | <0.1, 0.1–0.4, 0.4–1, 1–2 | Micro-focused with capillary, 2D detector | Iterative full-pattern-fitting with the WILDFIRE | K-Ar | 2014 | 13 |
| 13 | Daegwangri fault, Korea | <0.1, 0.1–0.4, 0.4–1, 1–2 | Micro-focused with capillary, 2D detector | Iterative full-pattern-fitting with the WILDFIRE | K-Ar | 2014 | 14 |
| 14 | Inje fault, Korea | <0.1, 0.1–0.4, 0.4–1, 1–2 | Micro-focused with capillary, 2D detector | Iterative full-pattern-fitting with the WILDFIRE | K-Ar | 2015 | 15 |
| 15 | Red River Fault, Vietnam | <0.1, 0.1–0.4, 0.4–1, 1–2 | Micro-focused with capillary, 2D detector | Iterative full-pattern-fitting with the WILDFIRE | K-Ar | 2016 | 16 |
| 16 | Mexican Fold-Thrust Belt | <0.05, 0.05–0.2, 0.2–1, 1–2 | Conventional | Lowest-variance approach using WILDFIRE | 40Ar/39Ar | 2016 | 17 |
| 17 | Faults in Death Valley and Panamint Valley | <0.05, 0.05–0.2, 0.2–2 | Conventional | Lowest-variance approach using WILDFIRE | 40Ar/39Ar | 2016 | 18 |
| 18 | Yangsan Fault in the Sangcheon-ri, Korea | <0.1, 0.1–0.4, 0.4–1, 1–2 | Micro-focused with capillary, 2D detector | Iterative full-pattern-fitting with the WILDFIRE | K-Ar | 2016 | 19 |
| 19 | Minami-Awa Fault | <0.2, 0.2–0.5, 0.5–1, 1–2, 2–4 | X’Pert Pro Multi-purpose with capillary | Iterative full-pattern-fitting with the WILDFIRE | K-Ar | 2016 | 30 |
| 20 | Dien Bien Phu Fault, Vietnam | <0.1, 0.1–0.4, 0.4–1, 1–2 | Micro-focused with capillary, 2D detector | Iterative full-pattern-fitting with the WILDFIRE | K-Ar | 2017 | 20 |
| 21 | Alpine Fault, New Zealand | <0.1, 0.1–0.2, 0.2–0.5, 0.5–1 | Conventional | Grathoff and Moore (1996) method using WILDFIRE | 40Ar/39Ar | 2017 | 21 |
| 22 | Yangsan Fault in the Pohang Area, Korea | <0.1, 0.1–0.4, 0.4–1, 1–2 | Micro-focused with capillary, 2D detector | Iterative full-pattern-fitting with the WILDFIRE | K-Ar | 2017 | 22 |
| 23 | Faults in Yeongwol are, Korea | <0.1, 0.1–0.4, 0.4–1, 1–2 | Micro-focused with capillary, 2D detector | Iterative full-pattern-fitting with the WILDFIRE | K-Ar | 2018 | 23 |
| 24 | Río Grío, Vallès-Penedès Faults | <0.1, 0.1–0.4, 0.4–2, 2–6, 6–10 | Conventional | Integrated peak areas, using calibration constant for standard | 40Ar/39Ar | 2019 | 31 |
| 25 | Faults within Shimanto accretionary complex | <0.2, 0.2–0.5, 0.5–1, 1–2, 2–4 | X’Pert Pro Multi-purpose with capillary | Iterative full-pattern-fitting with the WILDFIRE | K-Ar | 2019 | 32 |
| 26 | Sronlairig Fault | <0.05, 0.05–0.1, 0.1–0.2, 0.2–2 | X’Pert Pro Multi-purpose with capillary | corrected peak-area-measurement, Dalla Torre et al. (1994) | K-Ar | 2019 | 24 |
| 27 | Sevier fold–thrust | <0.05, 0.05–0.1, 0.1–0.5, 0.5–1, 1–2 | Conventional | Lowest-variance approach using WILDFIRE | 40Ar/39Ar | 2019 | 25 |
| 28 | Faults in Chungnam Basin, Korea | <0.1, 0.1–0.4, 0.4–1, 1–2 | Micro-focused with capillary, 2D detector | Iterative full-pattern-fitting with the WILDFIRE | K-Ar | 2019 | 26 |
| 29 | Faults in West Sarawak, Borneo | <0.2–0.5, 0.5–1, 1–2 | Conventional | Iterative full-pattern-fitting with the WILDFIRE | K-Ar | 2021 | 27 |
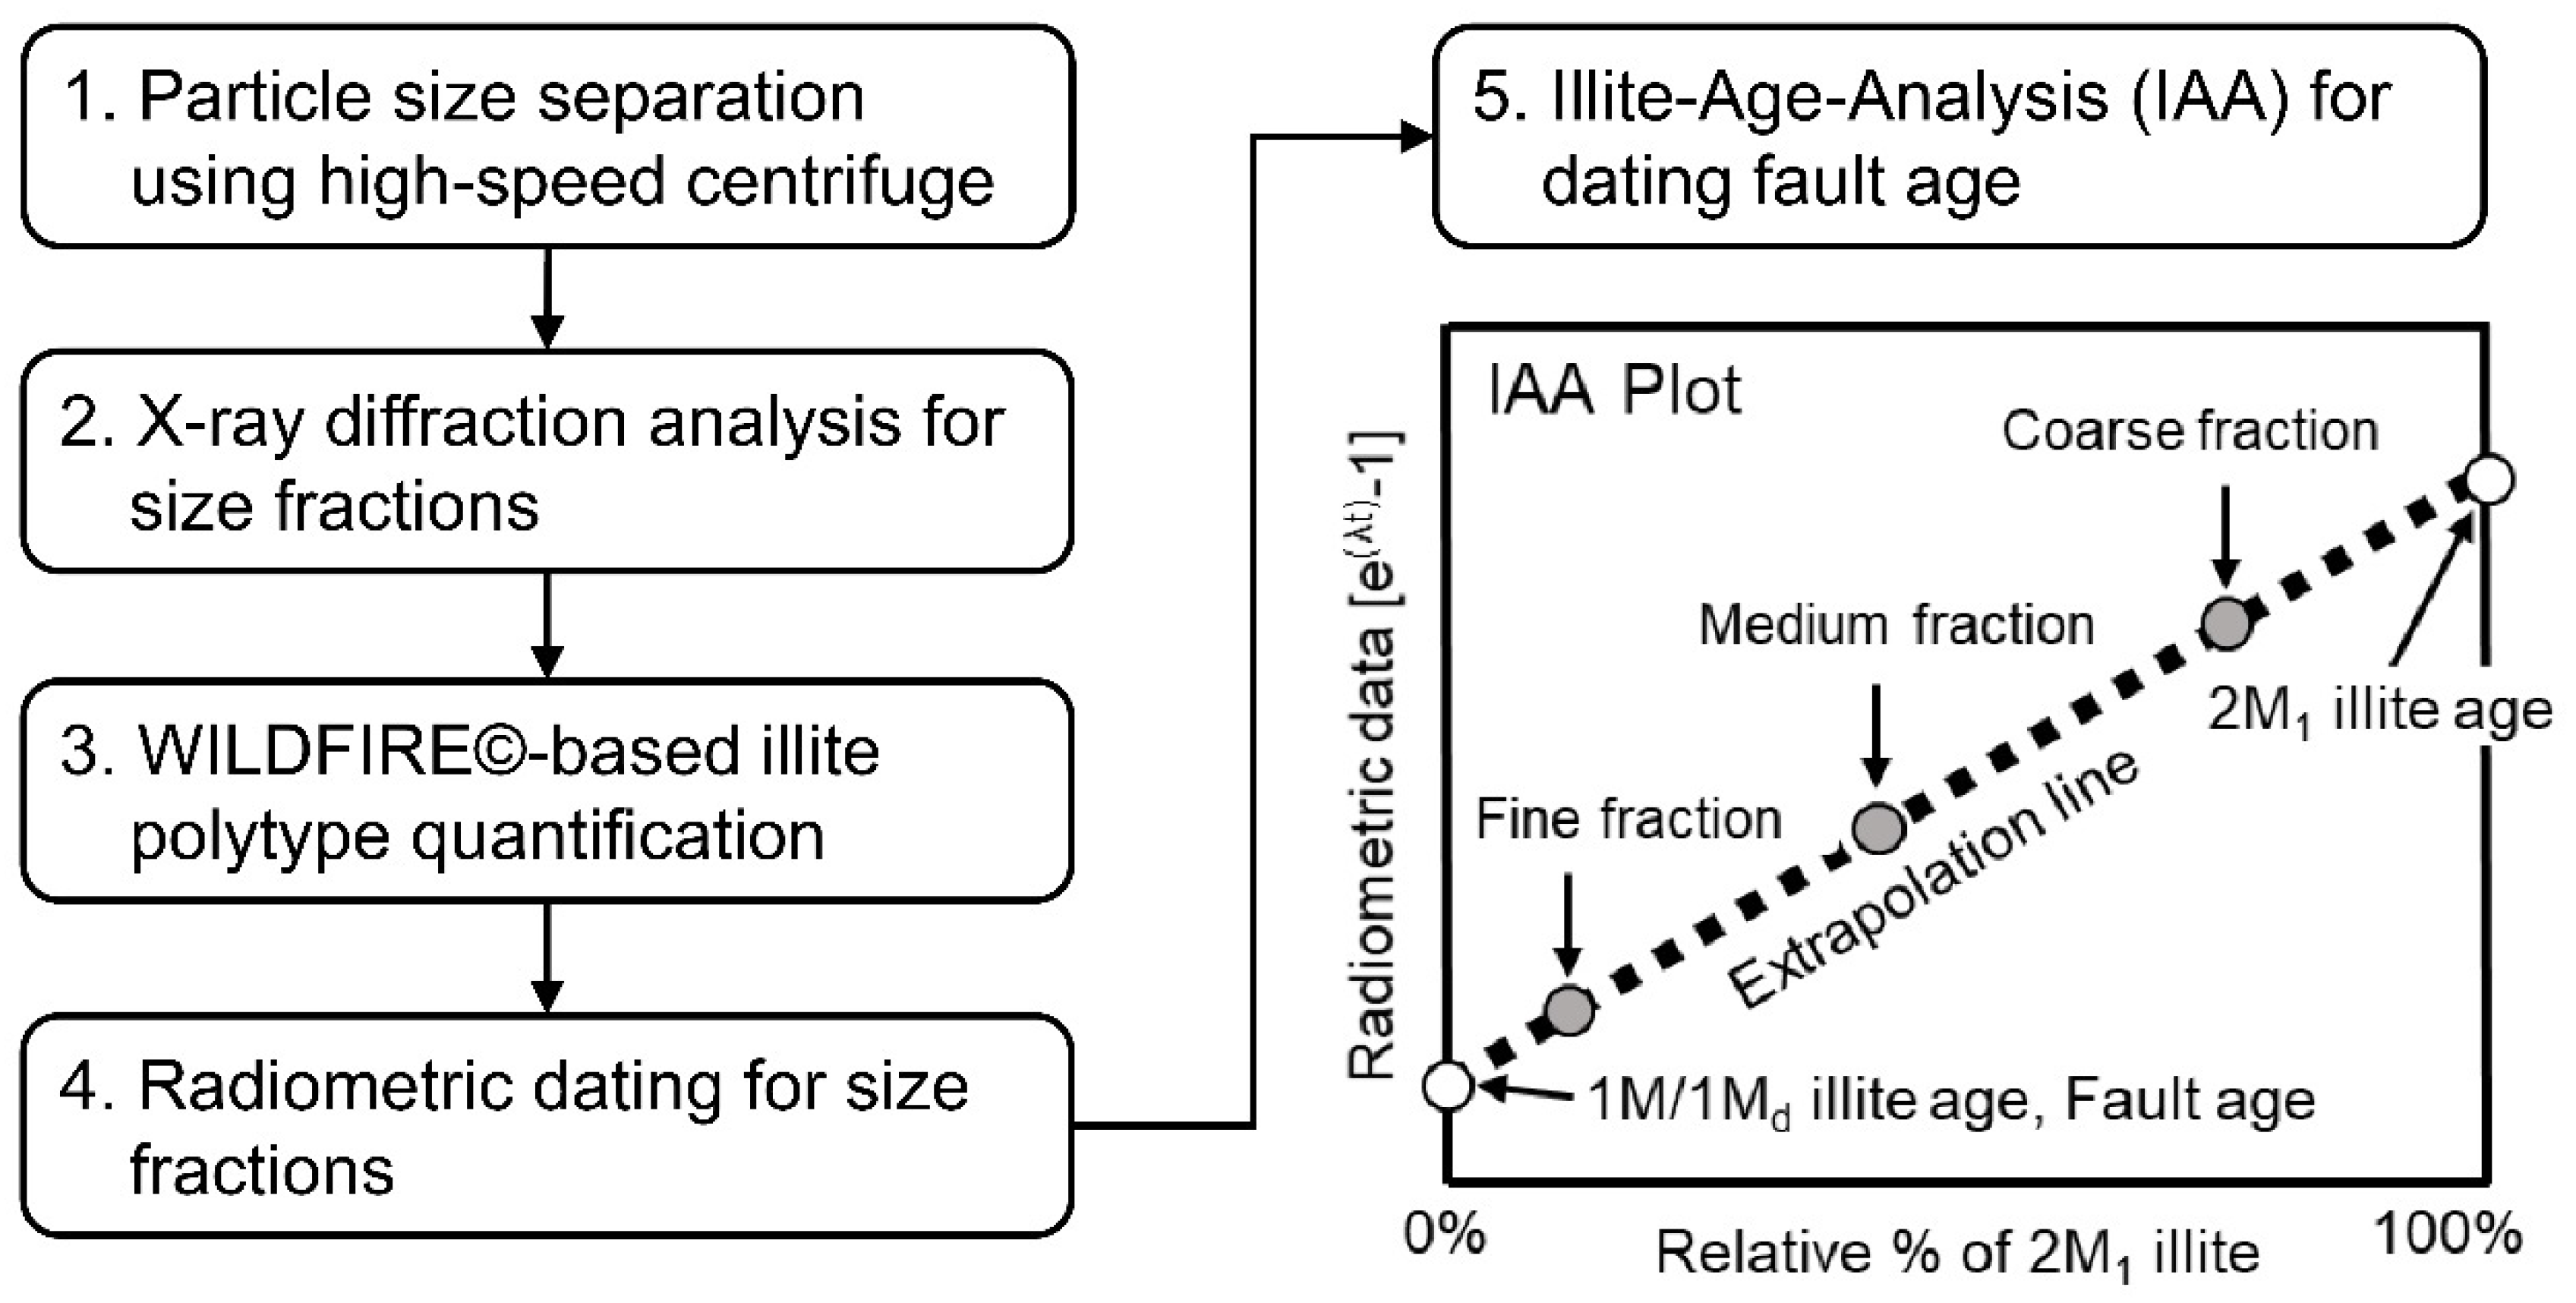
| Step | Descriptions of Procedures | Prerequisites and Recommendations |
|---|---|---|
| 1 | Particle size separation using high-speed centrifuge |
|
| 2 | X-ray diffraction analysis for size fractions |
|
| 3 | WILDFIRE©-based polytype quantification |
|
| 4 | Radiometric dating for size fractions |
|
| 5 | Illite-Age-Analysis (IAA) for dating fault age |
|
Publisher’s Note: MDPI stays neutral with regard to jurisdictional claims in published maps and institutional affiliations. |
© 2021 by the authors. Licensee MDPI, Basel, Switzerland. This article is an open access article distributed under the terms and conditions of the Creative Commons Attribution (CC BY) license (https://creativecommons.org/licenses/by/4.0/).
Share and Cite
Song, Y.; Sim, H. Illite-Age-Analysis (IAA) for the Dating of Shallow Faults: Prerequisites and Procedures for Improvement. Minerals 2021, 11, 1162. https://doi.org/10.3390/min11111162
Song Y, Sim H. Illite-Age-Analysis (IAA) for the Dating of Shallow Faults: Prerequisites and Procedures for Improvement. Minerals. 2021; 11(11):1162. https://doi.org/10.3390/min11111162
Chicago/Turabian StyleSong, Yungoo, and Ho Sim. 2021. "Illite-Age-Analysis (IAA) for the Dating of Shallow Faults: Prerequisites and Procedures for Improvement" Minerals 11, no. 11: 1162. https://doi.org/10.3390/min11111162
APA StyleSong, Y., & Sim, H. (2021). Illite-Age-Analysis (IAA) for the Dating of Shallow Faults: Prerequisites and Procedures for Improvement. Minerals, 11(11), 1162. https://doi.org/10.3390/min11111162