Article

The Effect of Carbon Defects in the Coal–Pyrite Vacancy on the Electronic Structure and Optical Properties: A DFT + U Study

1
College of Mining, Guizhou University, Guiyang 550025, China
2
National & Local Joint Laboratory of Engineering for Effective Utilization of Regional Mineral Resources from Karst Areas, Guiyang 550025, China
3
Guizhou Key Laboratory of Comprehensive Utilization of Non-metallic Mineral Resources, Guiyang 550025, China
*
Author to whom correspondence should be addressed.
Minerals 2020, 10(9), 815; https://doi.org/10.3390/min10090815
Submission received: 2 August 2020 / Revised: 20 August 2020 / Accepted: 31 August 2020 / Published: 15 September 2020
(This article belongs to the Special Issue First Principles Calculations of Minerals and Related Materials)

Abstract

:
Pyrite is a mineral often associated with coal in coal seams and is a major source of sulfur in coal. Coal–pyrite is widely distributed, easily available, low-cost, and non-toxic, and has high light absorption coefficient. So, it shows potential for various applications. In this paper, the density-functional theory (DFT + U) is used to construct coal–pyrite with carbon doped in the sulfur and iron vacancies of pyrite. The effects of different carbon defects, different carbon doping concentrations, and different doping distributions in the same concentration on the electronic structure and optical properties of coal–pyrite were studied. The results show that the absorption coefficient and reflectivity of coal–pyrite, when its carbon atom substitutes the iron and sulfur atoms in the sulfur and iron vacancies, are significantly higher than those of the perfect pyrite, indicating that coal–pyrite has potential for application in the field of photovoltaic materials. When carbon is doped in the sulfur vacancy, this impurity state reduces the width of the forbidden band; with the increase in the doping concentration, the width of the forbidden band decreases and the visible-light absorption coefficient increases. The distribution of carbon impurities impacts the band gap but has almost no effect on the light absorption coefficient, complex dielectric function, and reflectivity, indicating that the application of coal–pyrite to photovoltaic materials should mainly consider the carbon doping concentration instead of the distribution of carbon impurities. The research results provide a theoretical reference for the application of coal–pyrite in the field of photoelectric materials.

1. Introduction

Pyrite is a new type of solar cell with high research value due to its high light absorption coefficient (>10−5 cm−1), suitable band gap (0.95 eV), good environmental compatibility, and low preparation cost. It has been widely used in the field of photoelectric materials [1,2,3]. Researchers have prepared pyrite thin films and pyrite nanospheres via electrochemical deposition and thermal synthesis. Although they easily oxidize and degrade, they show good photoelectric properties. However, the band gap of pyrite (0.95 eV) is lower than the theoretical optimal band gap (1.3 eV) proposed by Shockley and Queisser [4] for photovoltaic materials. Many scholars have conducted research to better understand the electronic structure and optical properties of pyrite and then improve its optical properties. Part of this research focused on the use of the first-principles method based on density functional theory (DFT). Through the simulation and calculation of pyrite doped with more than 20 elements in nature (e.g., metal cations, including Co, Ni, Ca, and Zn, and anions such as O and As) and the analysis of electronic structure and optical properties of pyrite after doping, the electronic structure and optical properties of pyrite were found to be strongly affected by the doping of different elements [5,6,7]. Li et al. [8] studied the influence of an applied electric field on the electronic structure and optical properties of perfect pyrite and found that the band gap significantly reduces under a high electric field, the absorption coefficient curve of pyrite is redshifted through the applied electric field, and the light absorption coefficient decreases. Other scholars studied natural pyrite. Sun et al. [9] studied the possible defects (vacancies, interstitials, and anti-sites) of natural pyrite and oxygen-induced defects. They found that the native defects have high formation energies, and the oxygen impurities may be the reason for the p-type conductivity of pyrite under full oxidation, thus providing guidance for controlling the performance of synthetic pyrite thin films by regulating oxidation. Synthetic pyrite doping elements have also been studied. Lenner et al. [10] prepared Ni-doped pyrite thin films via chemical-vapor deposition and found that Ni-doping can significantly affect the photoelectric properties of pyrite. Ferrer et al. [11] prepared Cu-doped pyrite thin films and found that the resistivity and optical absorption of such films are markedly higher.
In nature, lattice defects often occur in the process of pyrite formation and geological deposit change, leading the stoichiometric composition of the pyrite molar ratio to deviate from 2:1 [12]. Coal–pyrite, different from the ore pyrite formed in the sulfide ore, is often an associated mineral in coal seams and also the main source of sulfur in coal. It is widely distributed and easy to obtain, and it has wide application potential. Many scholars have conducted studies in this field, among whom Yu et al. [13,14] examined the influence of carbon doping on the electronic structure and properties of bulk pyrite using DFT theory. They found that that the band gap of the carbon-doped pyrite bulk becomes narrow, S 3P and Fe 3d states shift to lower energy, and the Fermi level decreases, which promotes the transformation between pyrite and reagents in the process of electrochemical reaction. Qi et al. [15] analyzed the structure and properties of carbon-doped pyrite via the first-principles method based on DFT with the Hubbard U correction (DFT + U and found that carbon-doping can reduce the hardness of pyrite and enhance its oxidizability, leading to difficult coal–pyrite depression in coal flotation. Xi et al. [16,17] studied the effect of carbon defects and surface carbon atom adsorption on the hydrophilicity of the whole surface of the coal–pyrite using DFT calculations. They found that the carbon defects reduced the hydrophilicity of the pyrite surface (the closer to the carbon defect center, the weaker the hydrophilicity) and that the adsorption of carbon atoms on the pyrite surface markedly enhanced its hydrophobicity. Qi et al. [15] focused on the light absorption coefficient and dielectric function of perfect pyrite and interstitial C-doped pyrite using the DFT + U method, but they did not discuss carbon doping at the vacancy defect site.
Lattice defects are widely found in mineral crystals. Chen [18] used the first principle based on DFT to discuss the effect of sulfide minerals bearing lattice defects on flotation and established the principles of the flotation of sulfide minerals bearing lattice defects. Li et al. [19,20,21] studied the effect of lattice vacancy defects on the electronic structures and properties of the pyrite surface (including density of states, spin states, etc.) and its flotation behavior; they found that vacancy defects affect the bands near Fermi levels and depress the floatation of pyrite. Vacancy defects in the pyrite crystal can lead to the doping of impurities. Such defects play an important role in the doping process. Many defects may be present in the coal–pyrite cell volume, including vacancy defects, interstitial carbon caused by substitutional carbon occupying iron sites or sulfur sites, and the lack of iron and sulfur or only sulfur. Qi et al. [15] found that the carbon interstitial model is more stable when it has a lower defect formation energy. However, the doping of interstitial atoms requires the atoms on the crystal surface to obtain enough kinetic energy through thermal fluctuation to enter an interstitial lattice site that is not occupied by atoms in the internal lattice of the crystal under ideal conditions, and the formation of such defects often requires more energy. However, when there are vacancy defects in the unit cell of pyrite, the energy required for carbon atoms to enter is greatly reduced. According to the irreversible adsorption of carbon dioxide in coal, Liu et al. [22] found through first-principle calculations that when there are hydrogen vacancies, oxygen vacancies, and epoxy functional group defects in the coal structure, carbon dioxide tends to form chemical bonds with the coal at the defect place, resulting in chemisorption. However, chemisorption struggles to occur in coal structures without defects. Bryan et al. [6] provided strong evidence through experiments that the n-type bulk behavior in unintentionally doped single pyrite crystals and thin films arises from sulfur vacancies; thus, it is necessary to study the doping of pyrite with sulfur vacancy defects. Therefore, we examined carbon doping at vacancy defects in this study.
The first-principles DFT calculation is an effective quantum chemistry method widely used to study the mineral lattice structure and optical properties of materials in the field of metallic minerals and materials. Ren et al. [23] studied the heterostructures formed by transition metal difluorides based on DFT calculations, and found that all heterostructures exhibit excellent optical absorption ability in the near-infrared and visible regions, and explored their applications for photocatalytic, photovoltaic, and optical devices. Deng et al. [24] considered perovskite, a promising photovoltaic material, through DFT calculations, and explored the influence of various doping concentrations and positions of stannum (Sn) atoms on the optical properties of perovskite. They found that the modification of metal concentration and position modulate the photovoltaic properties of perovskites. However, since the Kohn–Sham (KS) energy gap obtained by local and semi-local functionals seriously underestimated the band gap, Liechtenstein et al. [25] proposed the Hubbard U approach, which has been proved to be successful in the calculation of transition-metal electronic structures [26,27]. Traditional DFT methods, such as the local-density approximation(LDA) or the generalized gradient approximation(GGA), ignore the strong correlation effect of d or f electrons, and the corresponding correction involves introducing the correction effect, which is called DFT + U. U is the Coulomb repulsion energy, and the selection of the U value needs to be tested. Zhang et al. [28] and Sun et al. [29], via the GGA + U approach, calculated the band gap of pyrite unit cell (1.02 and 1.03 eV, respectively), which are close to the theoretical value of 0.95 eV, using a U value of 2 eV.
In this study, the DFT calculation with the Hubbard U correction was used to overcome the underestimation of the energy band. The effects of different carbon defect forms, different carbon doping concentrations, and different positions at the same concentration on the electronic band structures and optical properties of coal pyrite were studied. The application of coal pyrite in the field of photovoltaic materials was also explored.

2. Model and Calculation Method

The first-principles calculation method based on DFT and the CASTEP module (an ab initio quantum mechanics program based on density functional method) in Materials Studio 8.0 (Accelrys, San Diego, CA, USA) were adopted to calculate the crystal structure, electronic structure, and common optical properties. The calculation parameters were as follows: the Hubbard U correction was adopted for the treatment of Fe 3d orbitals, with a U of 2.0 eV [9]. An energy cutoff of 350 eV [15] was used for the plane-wave basis expansion. GGA-PW91 [30] was selected as the exchange-correlation function and Monkhorst–Pack [8] k-point meshes of 4 × 4 × 4 were used for sampling of unit cell. For 2 × 1 × 1, 2 × 2 × 1 and 2 × 2 × 2 supercells, the corresponding Monkhorst–Pack meshes were set as 2 × 4 × 4, 2 × 2 × 4 and 2 × 2 × 2, respectively. There were 4 irreducible k-points for all these structures. The ultrasoft pseudopotentials (USPs) were used to represent valence electrons [31], and the BFGS algorithm was used for geometry optimization. The convergence criteria were as follows: the maximum displacement convergence was set to 0.002 Å; convergence values of interatomic forces, internal stresses, and maximum energy change were set to 0.05 eV/Å, 0.1 GPa, and 2.0 × 10⁻⁵ eV/atom, respectively; and the self-consistent iterative convergence accuracy was set to 2.0 × 10⁻⁶ eV/atom. Firstly, the unit cell model of perfect pyrite was calculated, the pyrite cell parameter 5.36 Å was found to have an error of 0.09% compared with the experimental value (5.41 Å), and the band gap was 1.156 eV, which is close to the theoretical value of 0.95 eV. All calculations adopted spin polarization and were conducted in reciprocal space.
Pyrite (FeS2) belongs to the space group T h 6 P a 3 ¯ , with the Fe2+ cations on the corners and the face-centers positions of the cubic cell, and the S 2 2 dimers occupying the anion sites. The unit cell of pyrite contains four Fe atoms and eight S atoms, with formula Fe4S8. Each Fe atom is coordinated to six S atoms, creating a distorted octahedron, while each S atom is coordinated to three Fe atoms and one S atom in a tetrahedral configuration (Figure 1e). In this paper, (Fe4S7C-1) and (Fe4S7C-2) represent the carbon-bearing pyrite with different forms of carbon atom occurrence formed when one carbon atom is doped into the sulfur vacancy. Among them, the carbon atom of Fe4S7C-1 occupies the position where the original sulfur atom is located and has a weak bonding effect with the surrounding sulfur and iron atoms, whereas the carbon atom of Fe4S7C-2 has a strong bonding effect with the surrounding iron atom. (Fe3S8C-1) and (Fe3S8C-2) represent the carbon-bearing pyrite with different forms of carbon atom occurrence formed when one carbon atom is doped into the iron vacancy. Among them, the carbon atom of the Fe3S8C-1 model occupies the position where the original iron atom is located and has a weak bonding effect with the surrounding sulfur atom, whereas the carbon atom of Fe3S8C-2 has a strong bonding effect with the surrounding sulfur atom. The structures of perfect pyrite and carbon-bearing pyrite with different forms of carbon atom occurrence formed are shown in Figure 1. The specific bonding analysis is shown in Table 3.
To discuss the influence of different carbon doping concentrations, supercells and pyrite unit cells of 2 × 2 × 2, 2 × 2 × 1 and 2 × 1 × 1 were established. One sulfur atom was removed and one carbon atom was doped at the vacancy to represent coal pyrite under different carbon doping concentrations (0.3%, 0.6%, 1.2%, and 2.4%). The configuration diagrams of the models are shown in Figure 2.
To discuss the influence of different doping positions with the same concentration, four models with the same carbon doping concentration (1.2%) but different positions were constructed. The configuration diagrams of the models are depicted in Figure 8.
Formation energy refers to the energy required for atoms to substitute lattice atoms or enter the unit cell of pyrite containing vacancy defects. In this paper, the formation energy of one impurity atom doped into the unit cell of pyrite containing vacancy defects is determined by the following equation, whose numerical value directly reflects the difficulty of defect formation and the stability of the system. The larger the value of substitution energy ΔE, the more difficult the substitution reaction—that is, the more difficult it is for carbon impurity defects to form in the pyrite lattice.
Δ E = E t o t a l + n E X E p e r f e c t n E C
where   E t o t a l is the total energy of the defective pyrite, E X is the energy of the iron/sulfur atom, E p e r f e c t is the total energy of pure pyrite, E C is the energy of carbon atoms, and n is the number of atoms.
All the optical properties were calculated by CASTEP. We specified 10 eV as the maximum energy above the Fermi level for which optical properties were calculated. The band energy tolerance was 1 × 10⁻⁵ eV. The k-point separation for the optical properties calculation was 0.05 Å−1. The separate XC functional for optics calculation was not used.

3. Results and Discussion

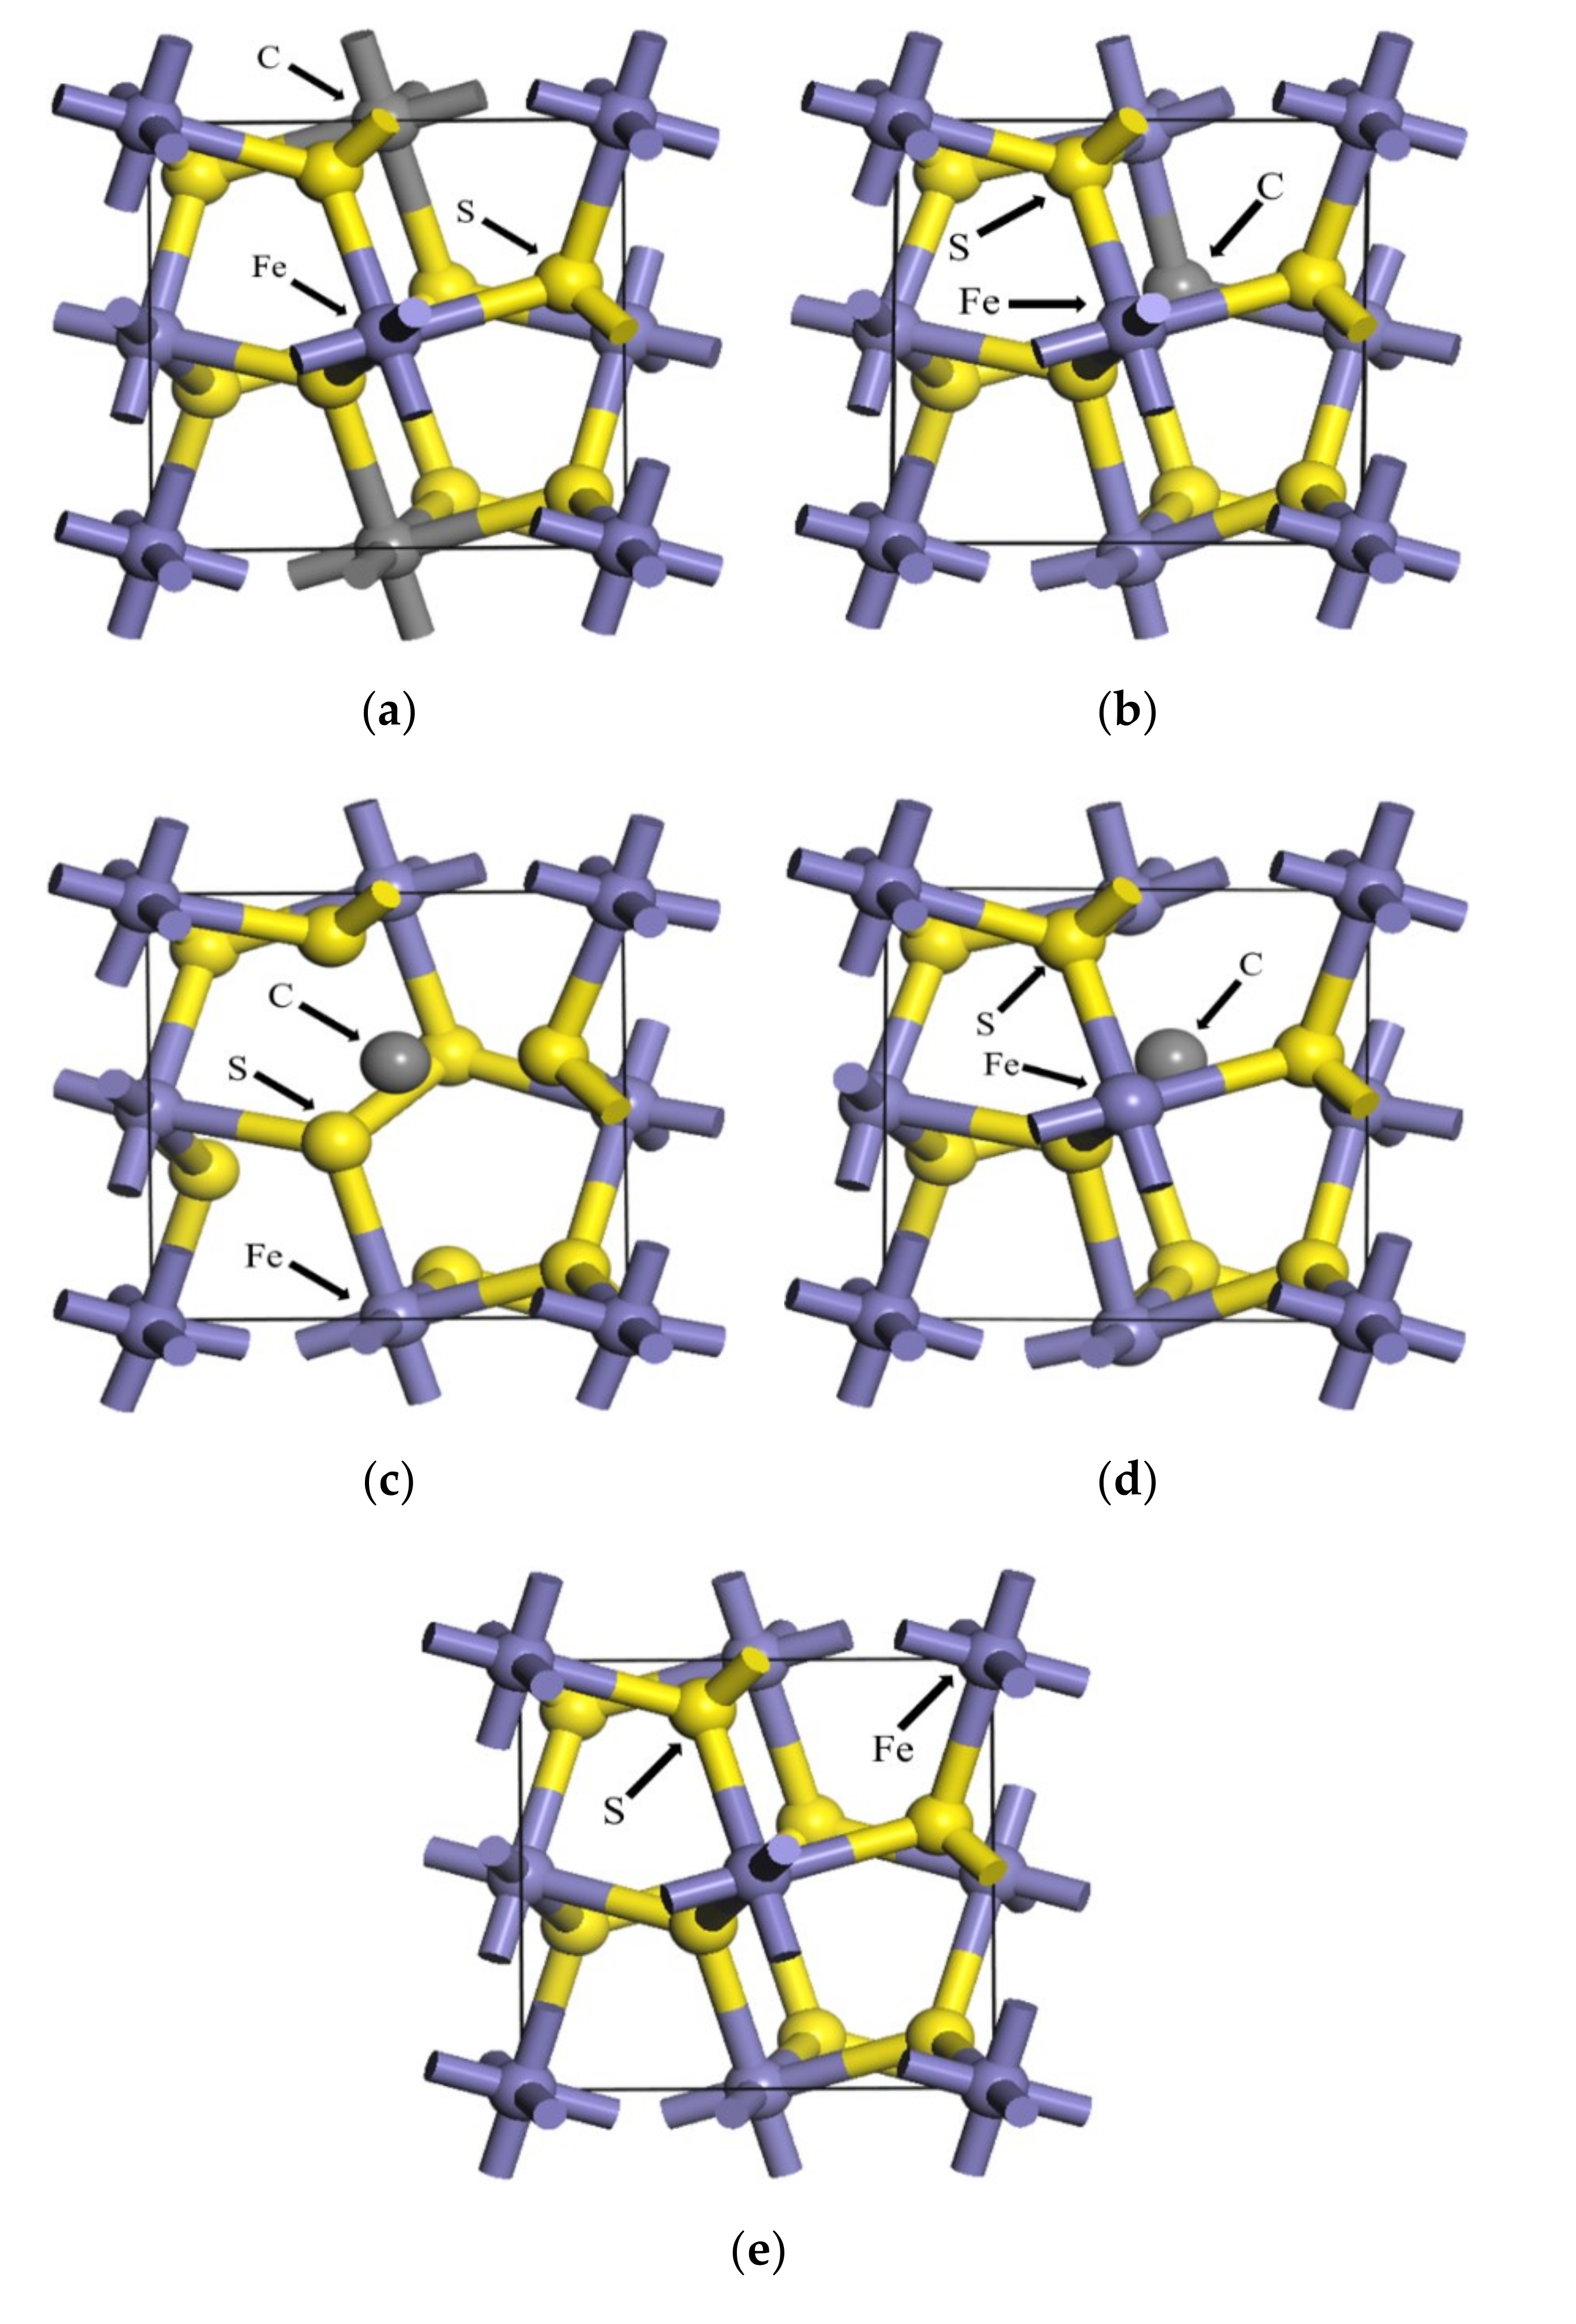
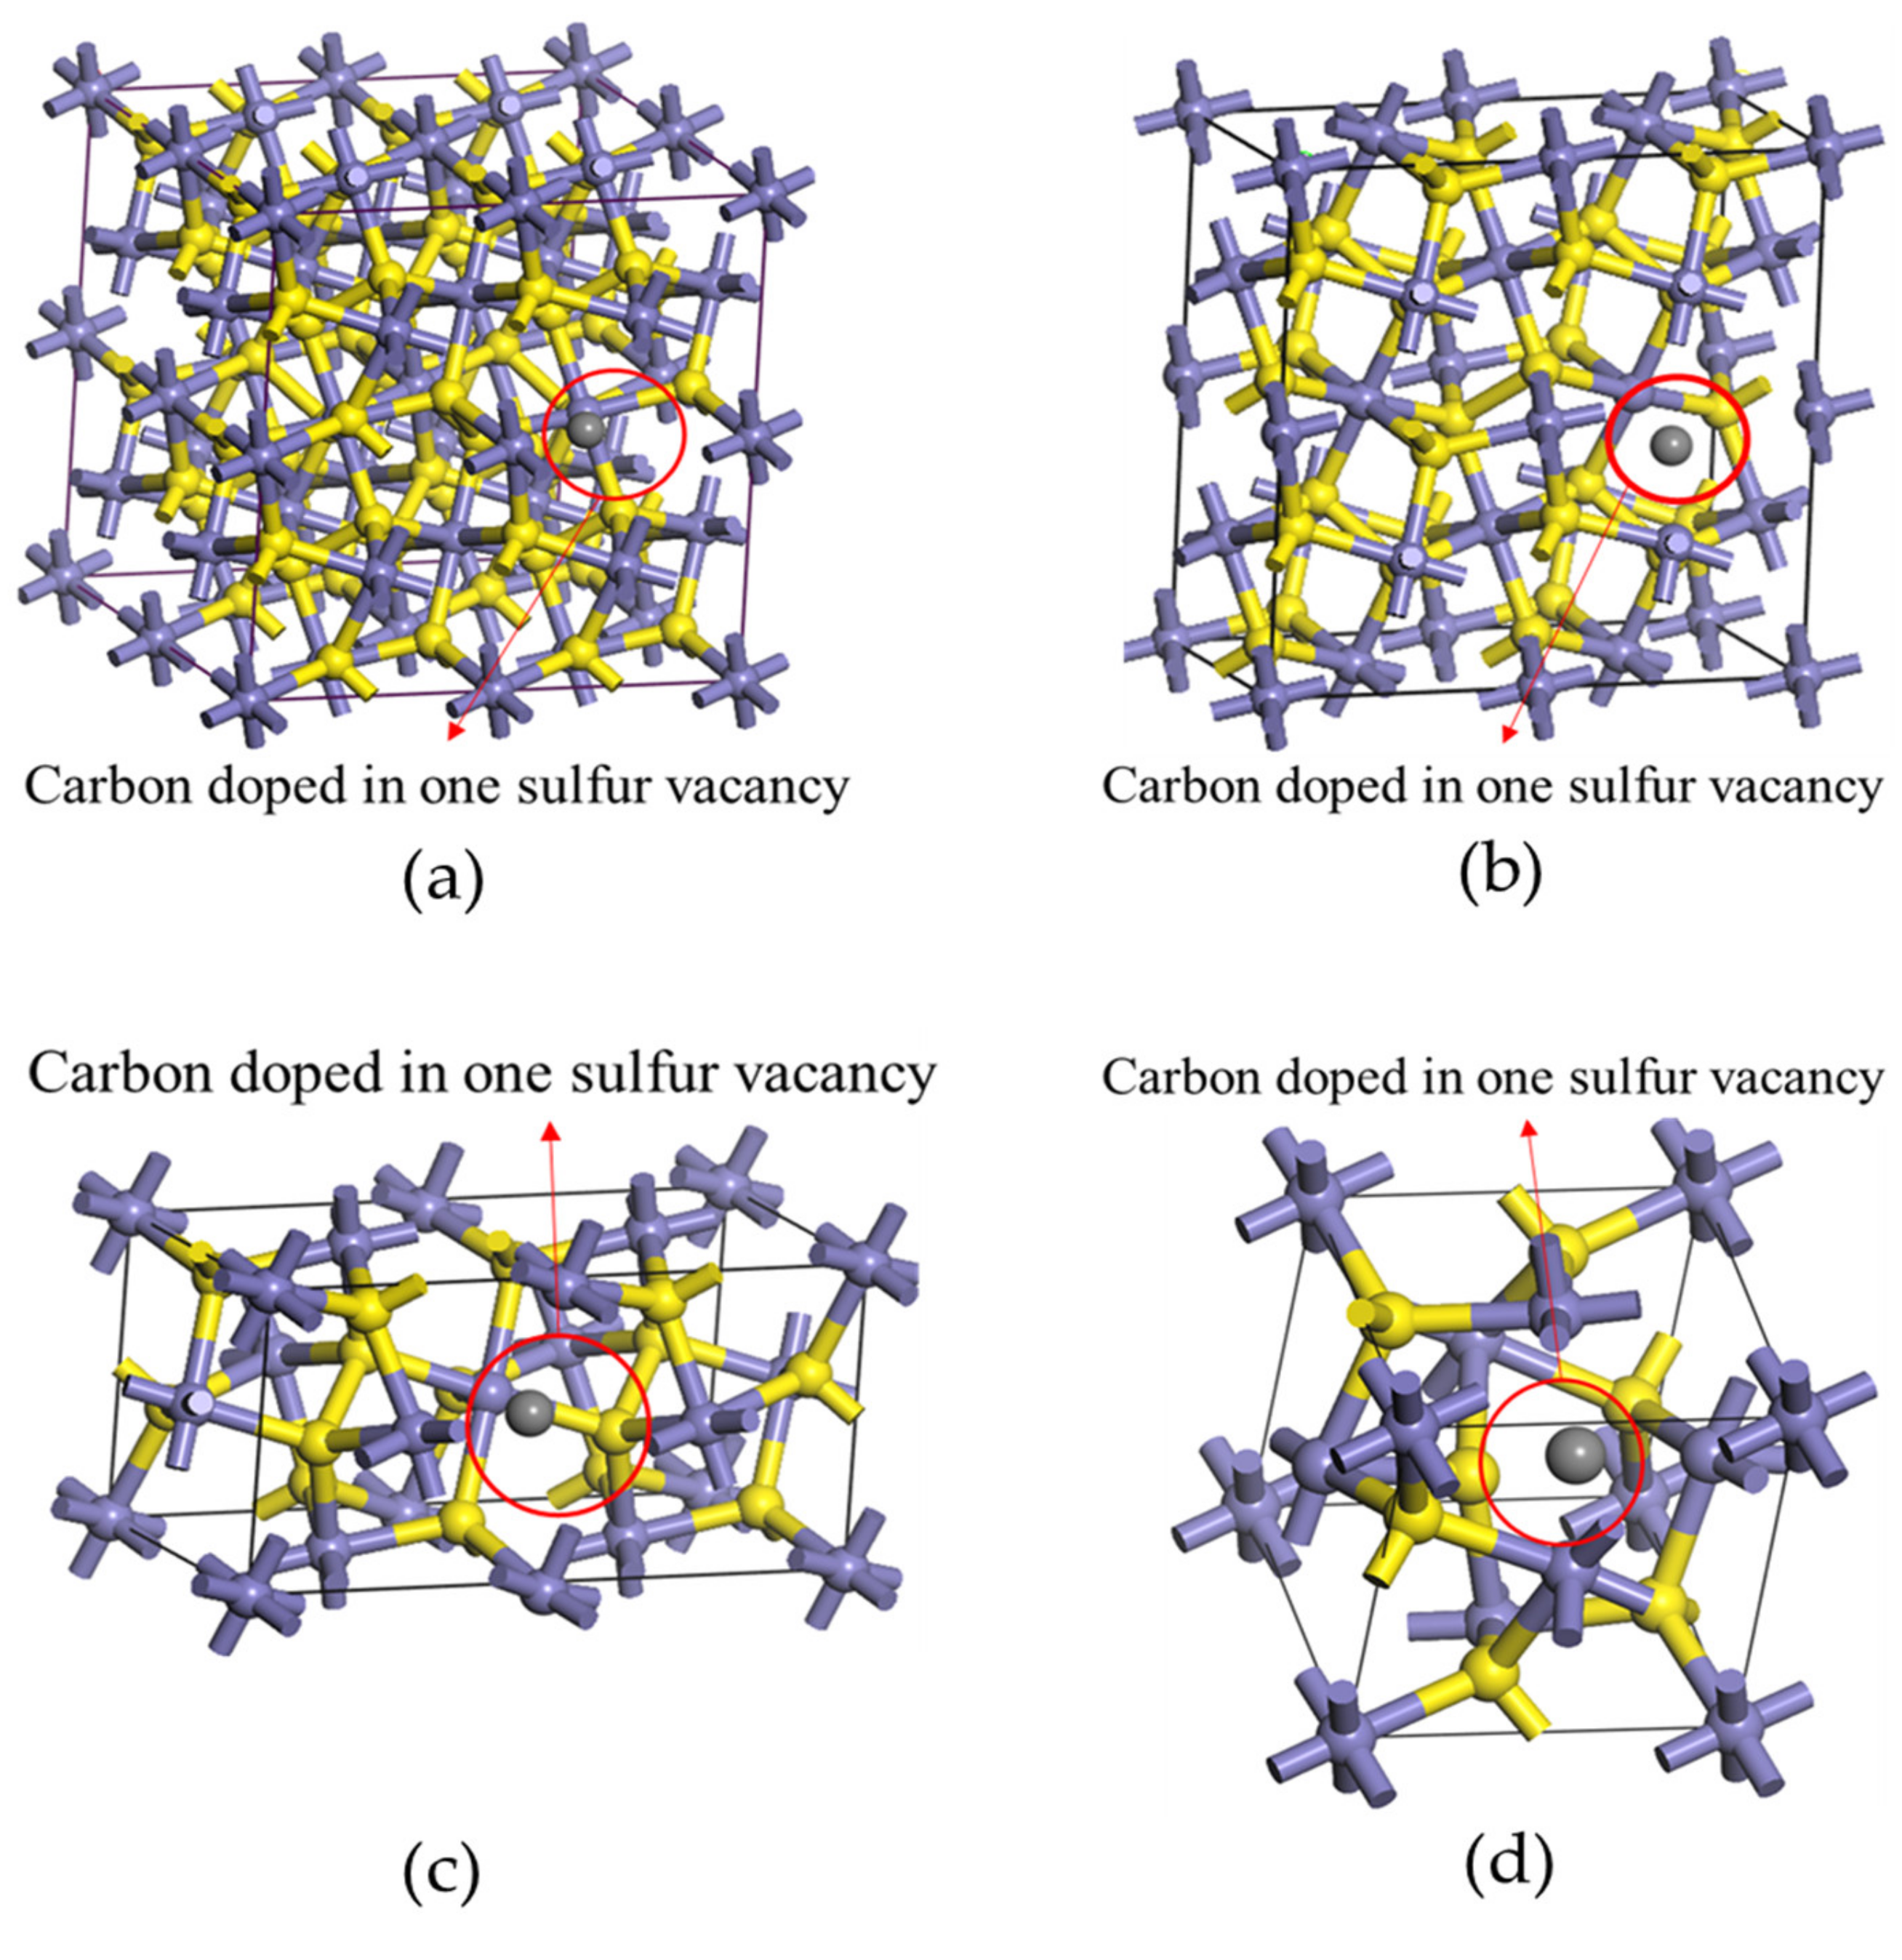
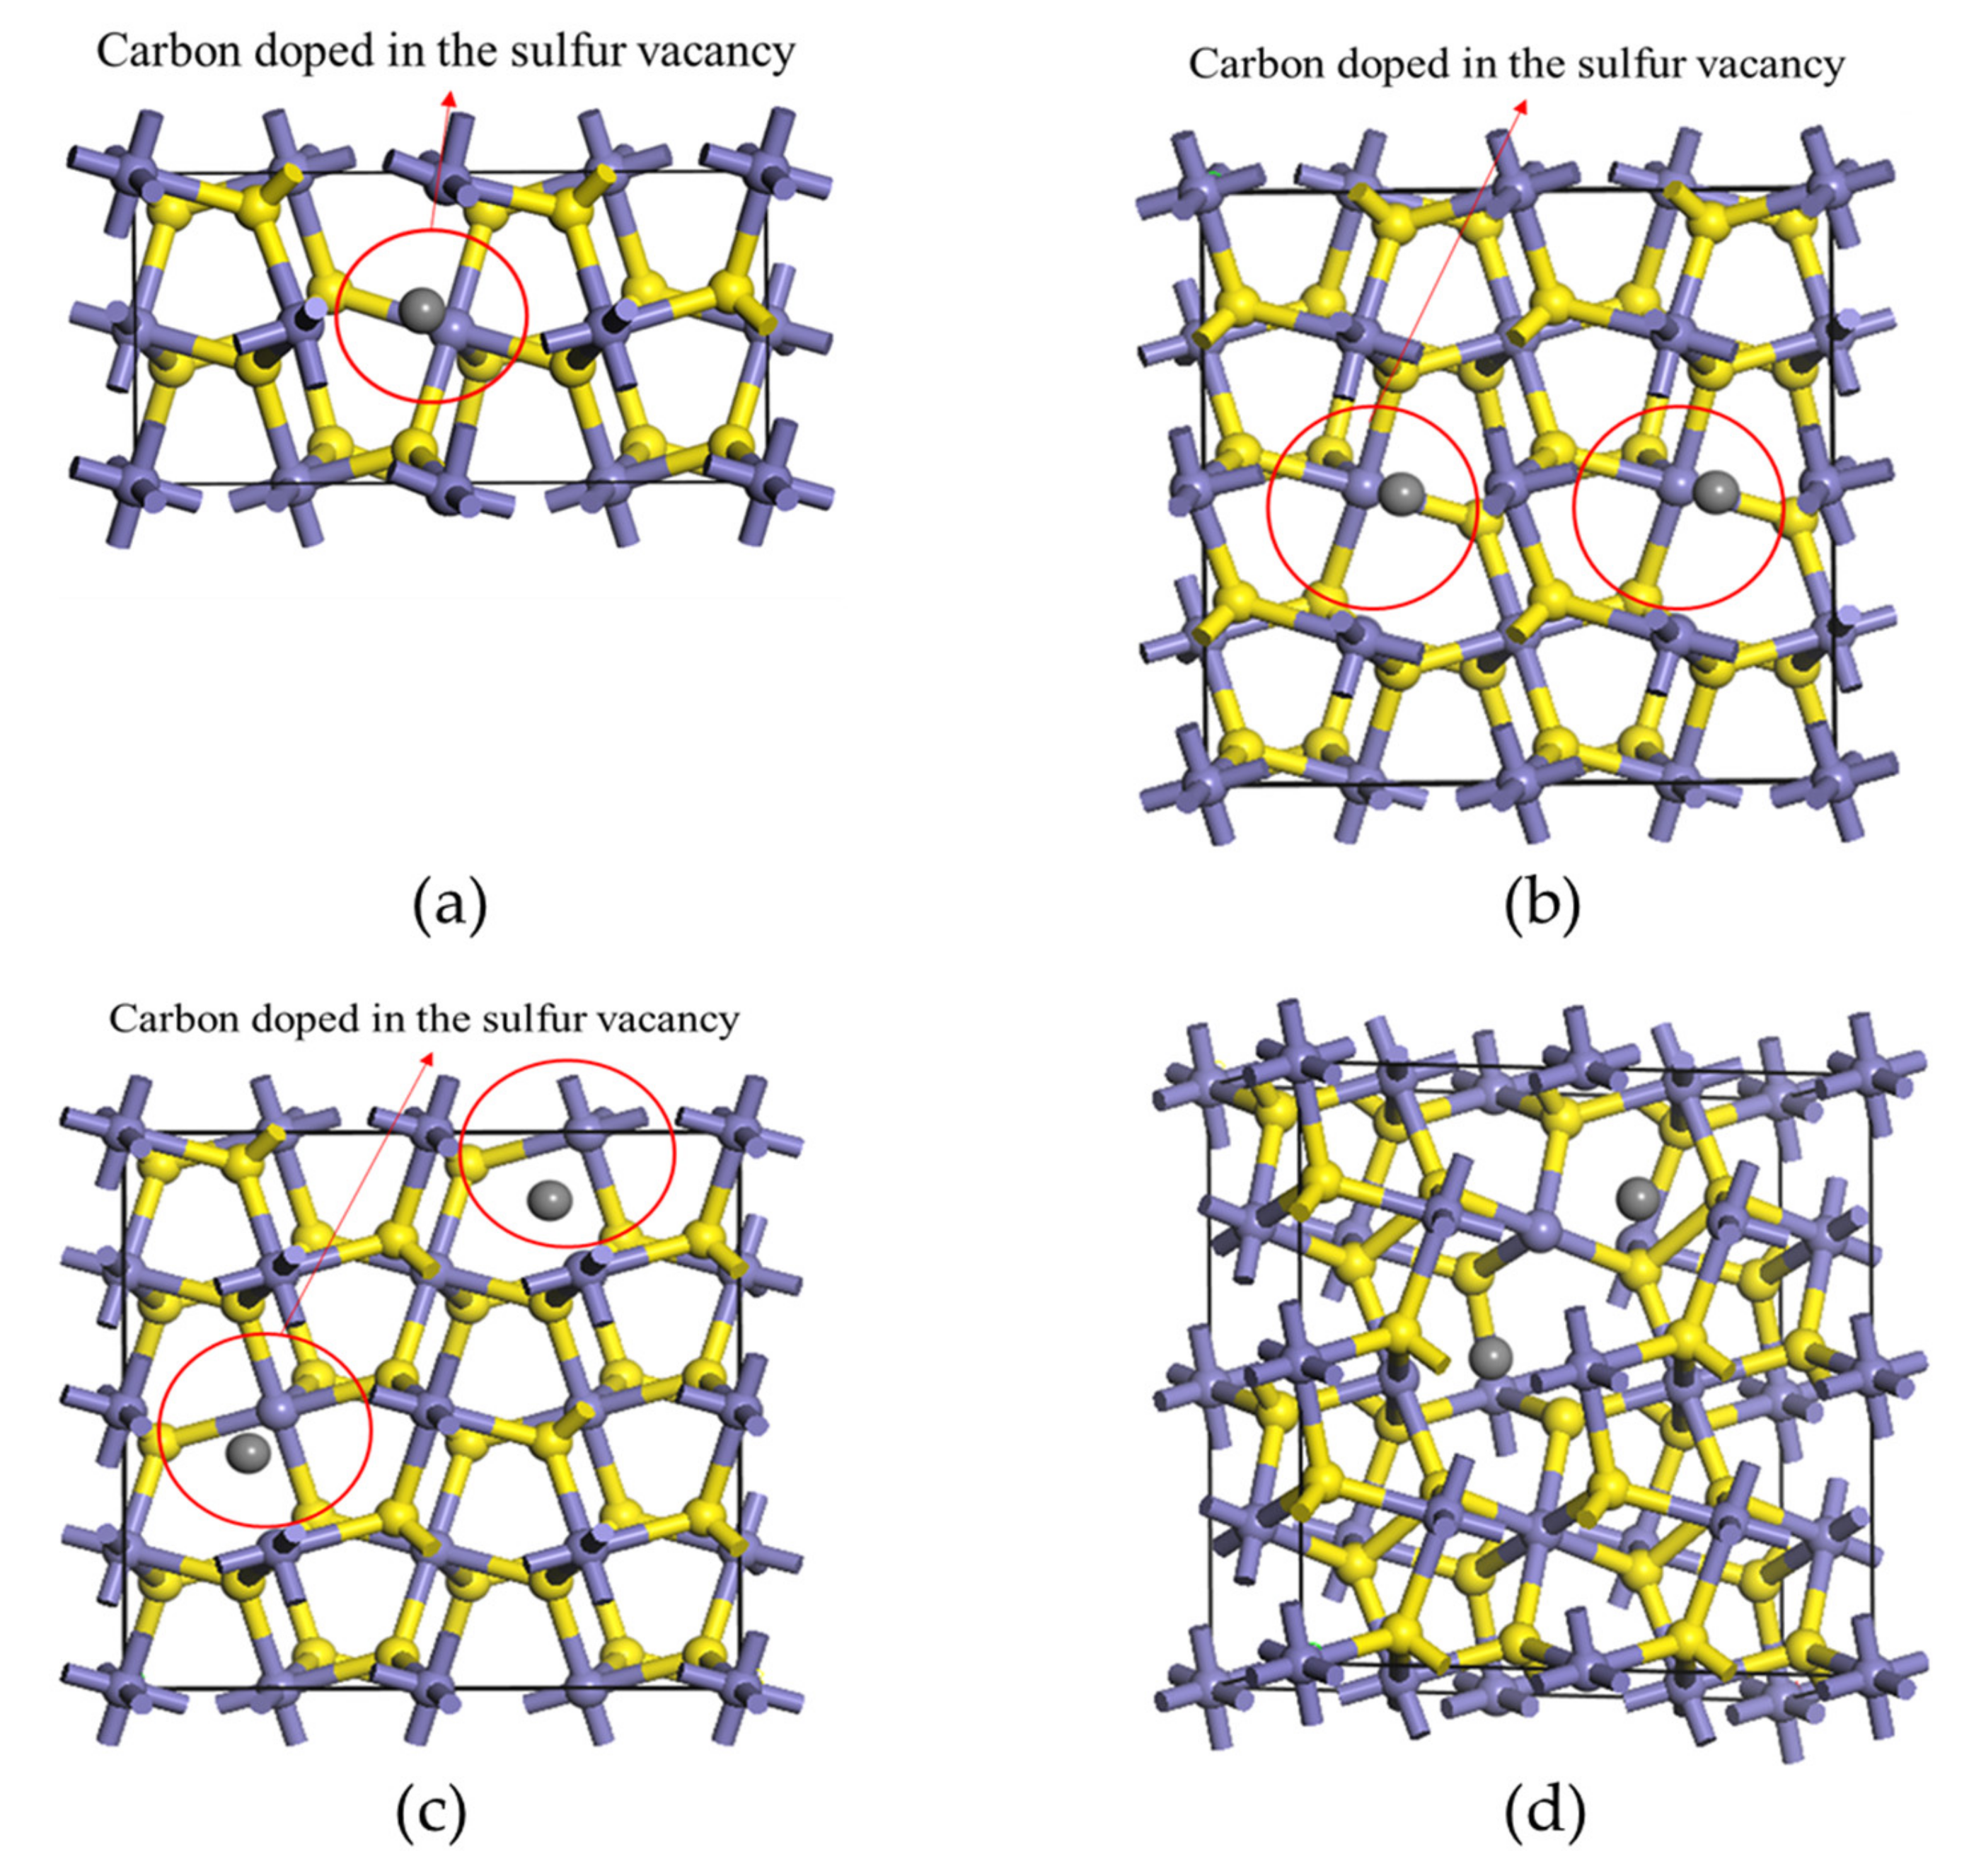
3.1. The Effect of Different Carbon Impurity Defects on the Crystal Structure of Pyrite

The presence of impurity atoms in mineral cells rebalances the lattice, and then the mineral cell volumes expand or shrink, resulting in lattice distortion from its ideal form. Firstly, the structure of the pyrite unit cell under different defect conditions was optimized, the formation energy under different defect conditions was calculated, and the change in its cell structure was analyzed. The calculated defect formation energy is shown in Table 1, and the cell parameters are listed in Table 2.
Table 1 shows that the formation energy of the four structures are low, which means that the defects form spontaneously, but the iron defect formation energy is greater than that of sulfur defects, indicating that sulfur defects are more likely to occur in pyrite. The vacancy defect formation energy is the largest, reaching 869.36 and 282.19 kJ/mol−1 for iron and sulfur vacancies, respectively. The sulfur vacancy defect is much more likely to occur. Many experimental data proved that the concentration of sulfur vacancy defects in pyrite is high [32,33,34,35]. These studies provided strong evidence for the existence of sulfur vacancy defects in pyrite. The formation energy of carbon atom doping at the sulfur vacancy defect is significantly lower, indicating that it is a stable form of defect. Xi et al. [16] and Qi et al. [15] also reported that the formation energy of carbon doping at the sulfur vacancy is low and the structure is stable. Therefore, the influence of doping concentration and the location of carbon atoms at the vacancy defect is discussed in this paper.
Table 2 shows that when the configuration is Fe3S8C-1 or Fe3S8C-2, the cell volume expands because the atomic radius of carbon (0.086 nm) is larger than the covalent radius of iron (0.061 nm). When carbon atoms are doped, the surrounding atoms are squeezed and shifted outward, resulting in the expansion of cell volume. When the configuration is Fe4S7C-1 or Fe4S7C-2, the crystal cell volume decreases, which is due to the S–S bond breaking and the sulfur dimer becoming a sulfur monomer when carbon doping occurs. Compared with the S–S bond, the binding in the C–S bond is weaker, which leads to carbon-doped pyrite cell having a lower volume compared with that of perfect pyrite. When only vacancy defects occur, the cell volume expands under the condition of both sulfur and iron vacancies.
The four configurations were optimized, and the bond lengths between carbon atoms and surrounding atoms were calculated, as shown in Table 3. We found that compared with Fe3S8C-2, the bond length is longer between the carbon atoms and surrounding atoms of Fe3S8C-1. Compared with Fe4S7C-1, the configuration of Fe4S7C-2 has a shorter bond length between carbon atoms and sulfur atoms, yet a significantly shorter bond length with iron atoms.

3.2. Effect of Carbon Occurrence on Electronic Structure and Optical Properties in Vacancy Defects of Pyrite

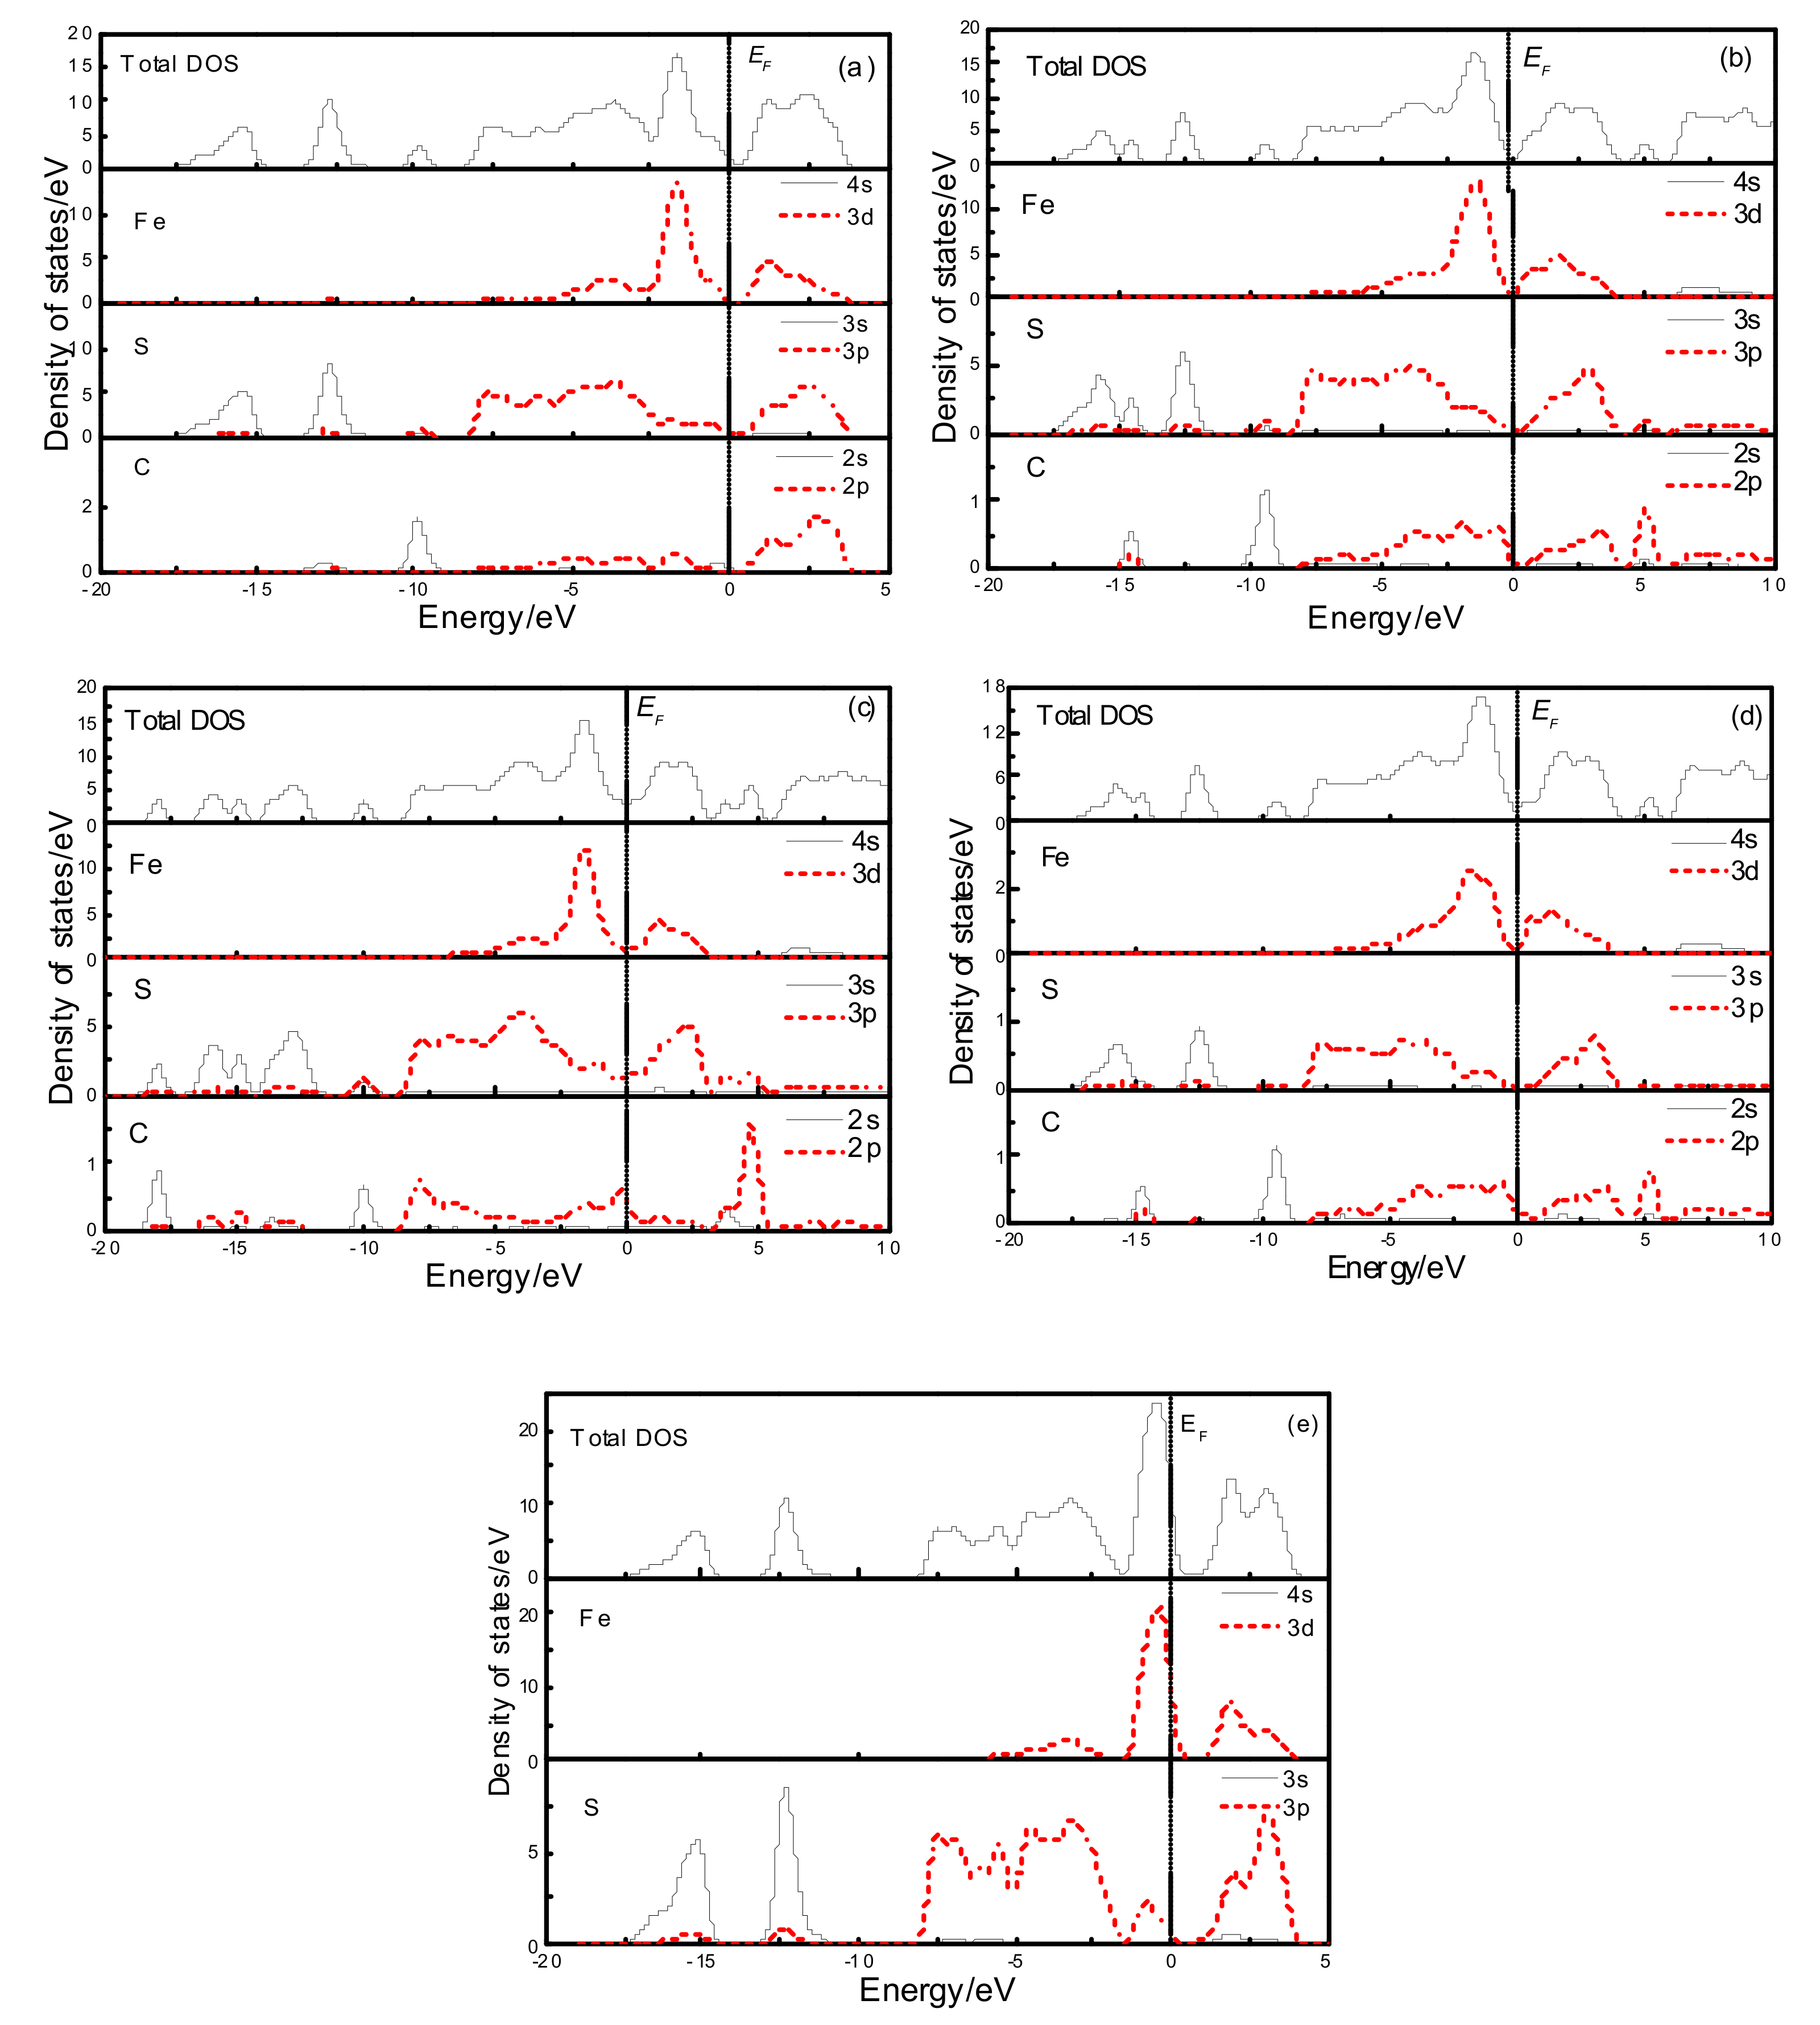
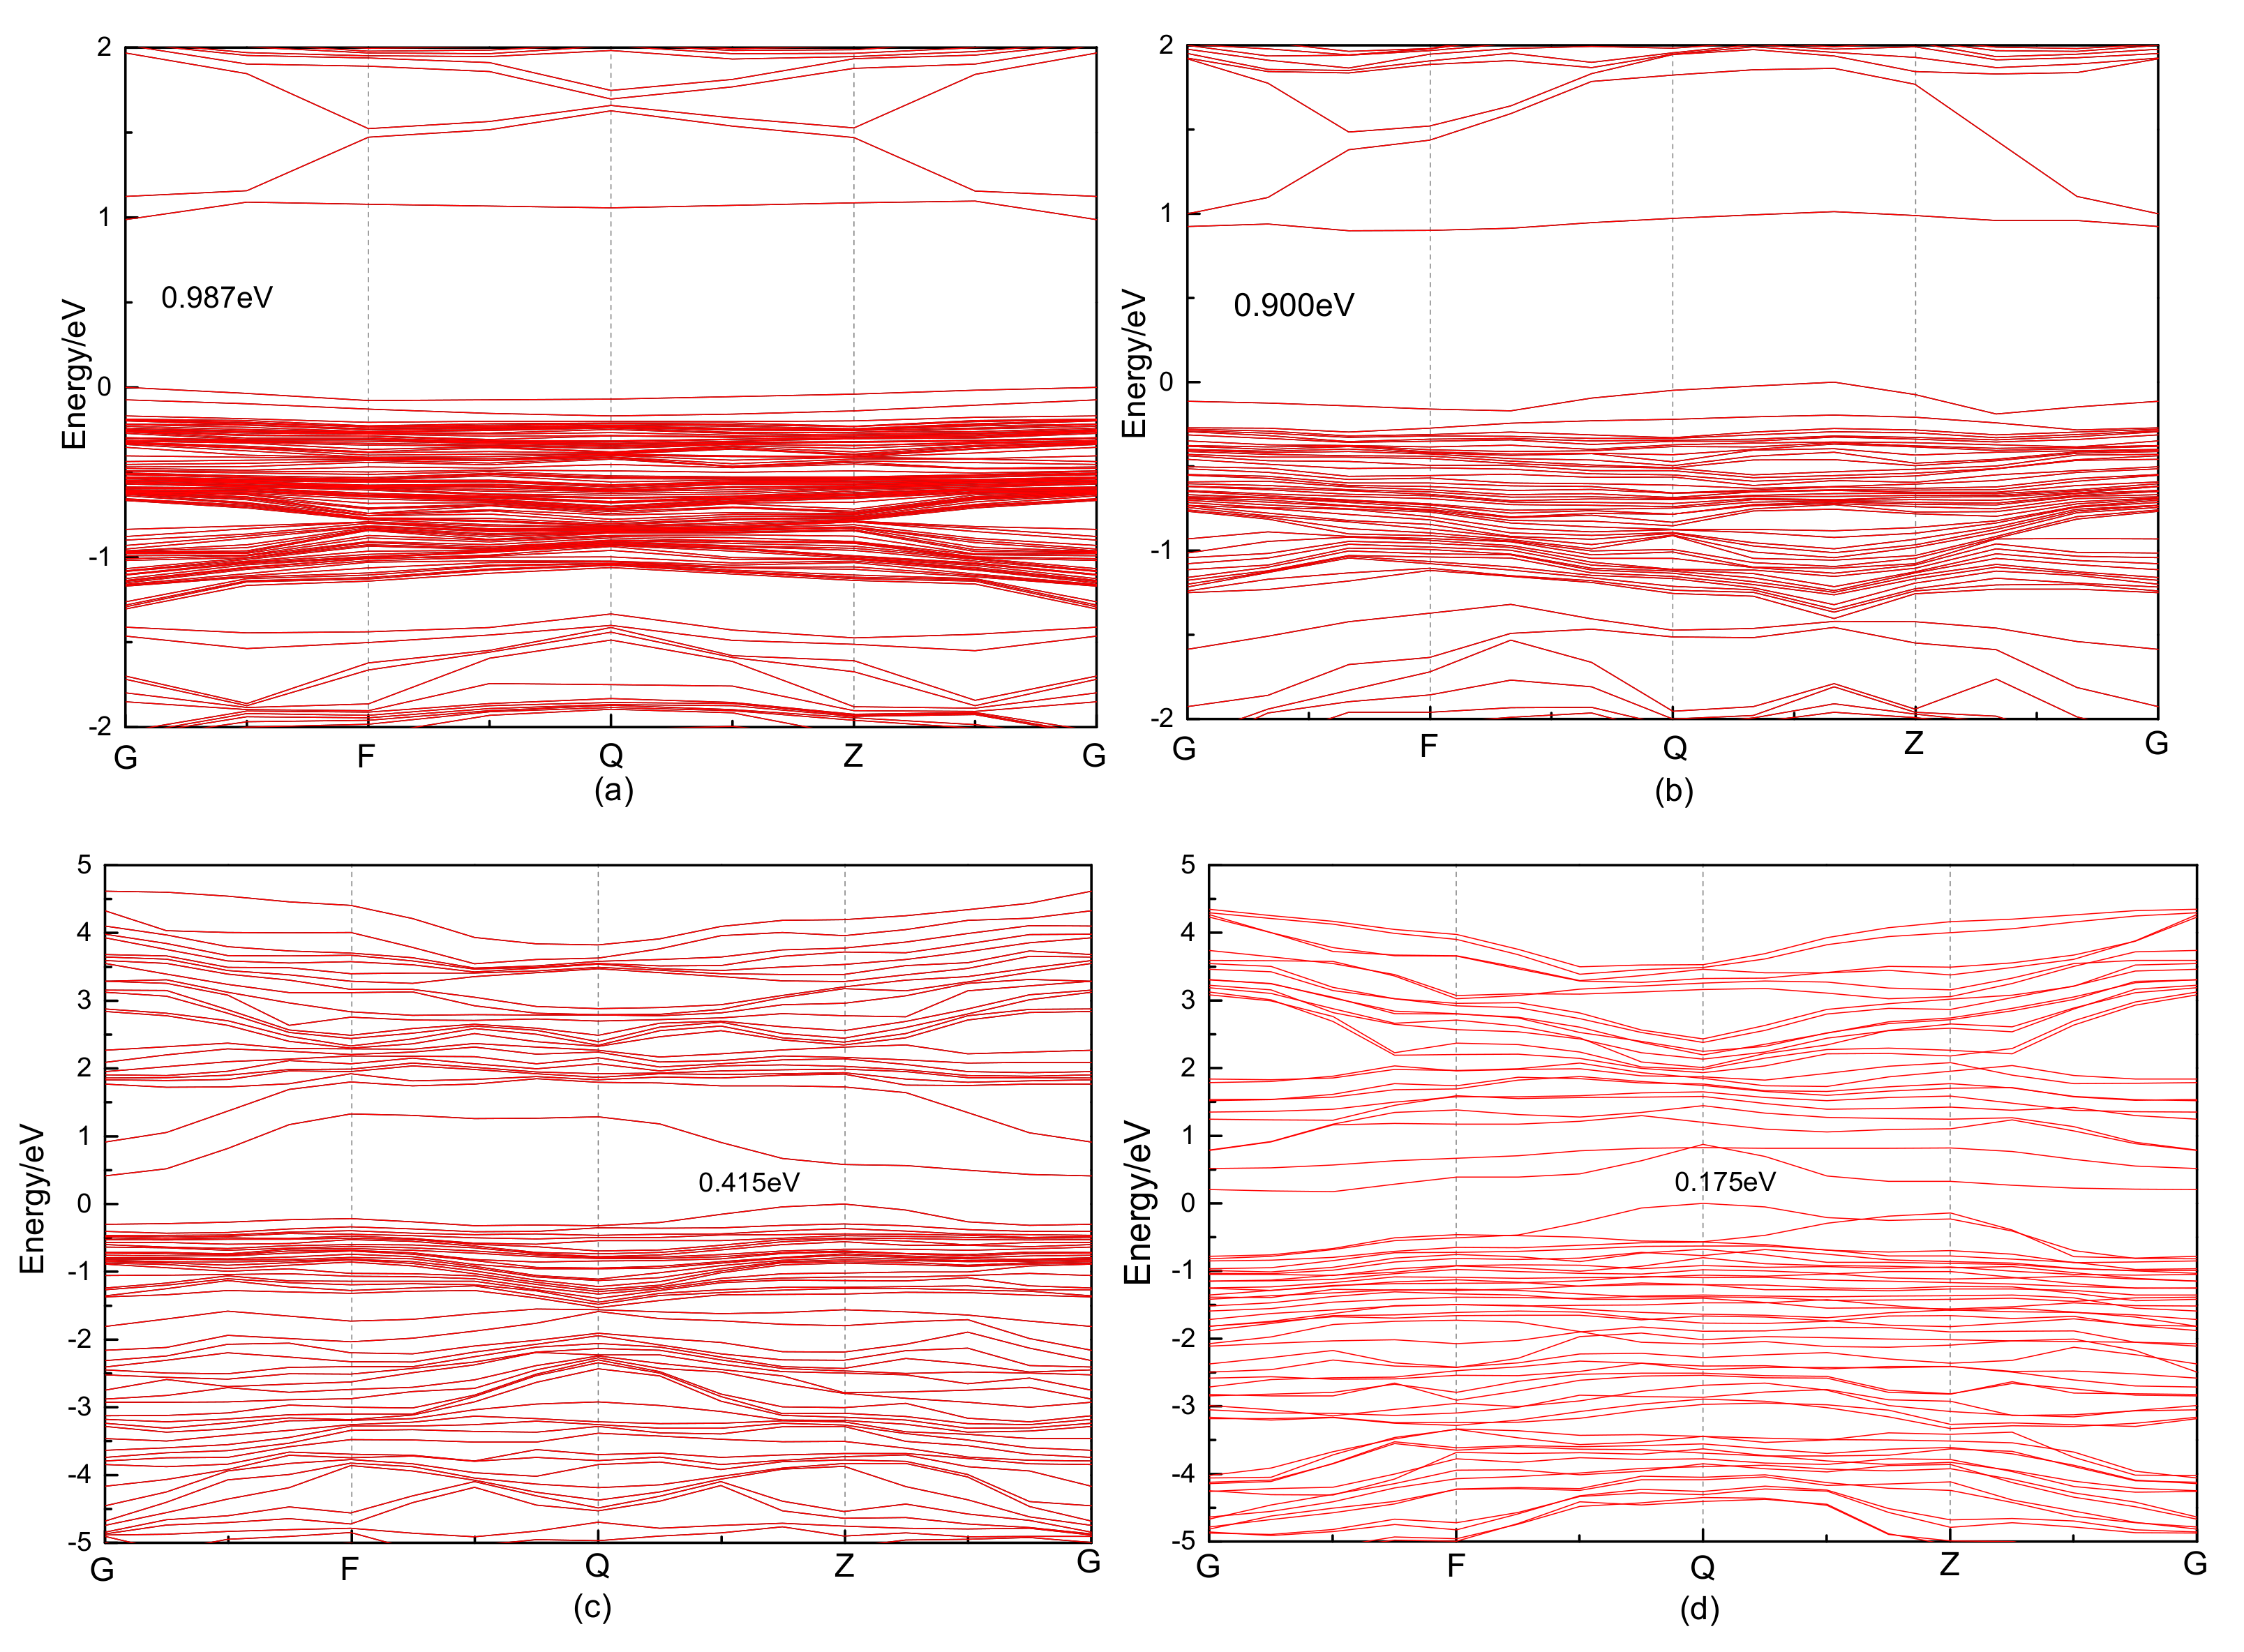
3.2.1. Electronic Structure

The unit cells of perfect pyrite and pyrite with different defect types were calculated, and the calculated band gap is shown in Table 4. The defects significantly reduced the band gap of pyrite, the semiconducting property of pyrite changed, and its metallic property was enhanced. To analyze the cause of the energy band reduction, diagrams of the total and partial density of states were drawn.
Figure 3 provides diagrams of the total and partial density of states of perfect pyrite and pyrite with different defects. In the density of states diagram, the orbital contribution means that the orbital overlaps, and the greater the overlap, the stronger the orbital hybridization. When the configuration is Fe3S8C-1 (Figure 3a), an impurity level forms near the low energy of −9.5 eV, which is mainly composed of S 3s states and C 2s states. The 2s and 2p orbitals of C can be observed near the Fermi level. Combined with the analysis of the partial density of states diagram, it is mainly composed of C 2p states. When the configuration is Fe4S7C-1 (Figure 2b), impurity levels form near the low energies of −9.5 and −14.5 eV, which are mainly composed of S 3s and C 2s states. The impurity level also appears near the Fermi level. Combined with the partial density of states diagram, it is mainly composed of C 2p states. The two forms of carbon occurrence enhance the conductivity and metallic properties of pyrite crystals. When the configuration is Fe3S8C-2 (Figure 3c), carbon impurities have a greater impact on the electronic structure near the Fermi level, resulting in a defect level near the Fermi level, which is mainly composed of C 2p states. Many impurity levels are formed within the energy range of −18 to −8.5 eV, which are mainly composed of S 3s and C 2s states. The impurity levels formed around the energy of 5 eV are mainly composed of S 3p and C 2p states. When the configuration is Fe4S7C-2 (Figure 3d), the defect level is near the Fermi level, which is mainly composed of C 2p states, and the impurity level forms near the low energy of −9.5 and −14.5 eV, which is mainly composed of S 3s and C 2s states. Compared with Fe3S8C-1, the hybridization of p orbitals of C and S in Fe3S8C-2 is stronger, while compared with Fe4S7C-1, the hybridization of d orbitals of Fe and S orbitals of C in Fe4S7C-2 is stronger.

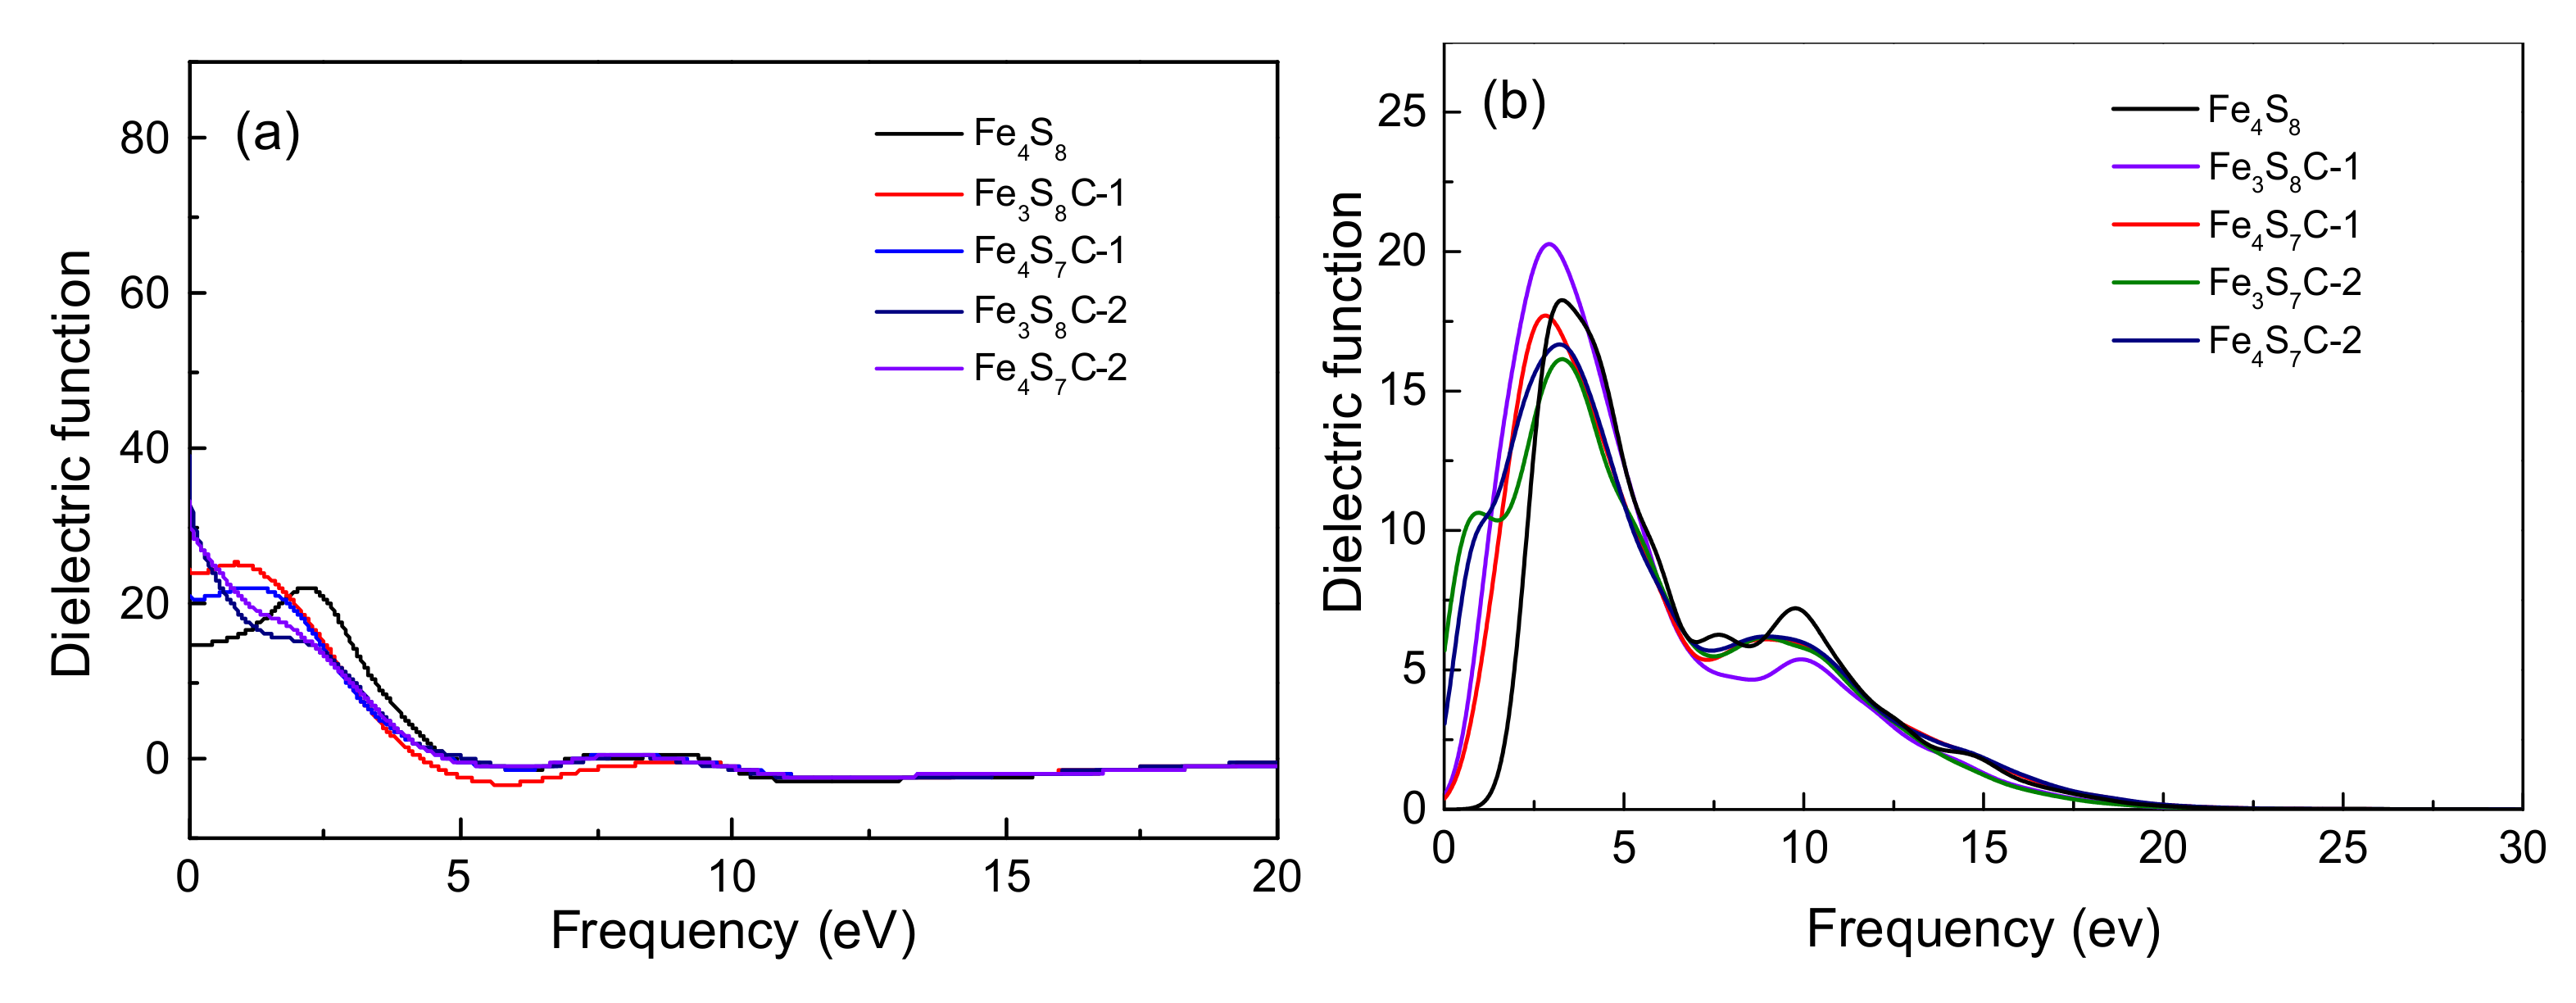
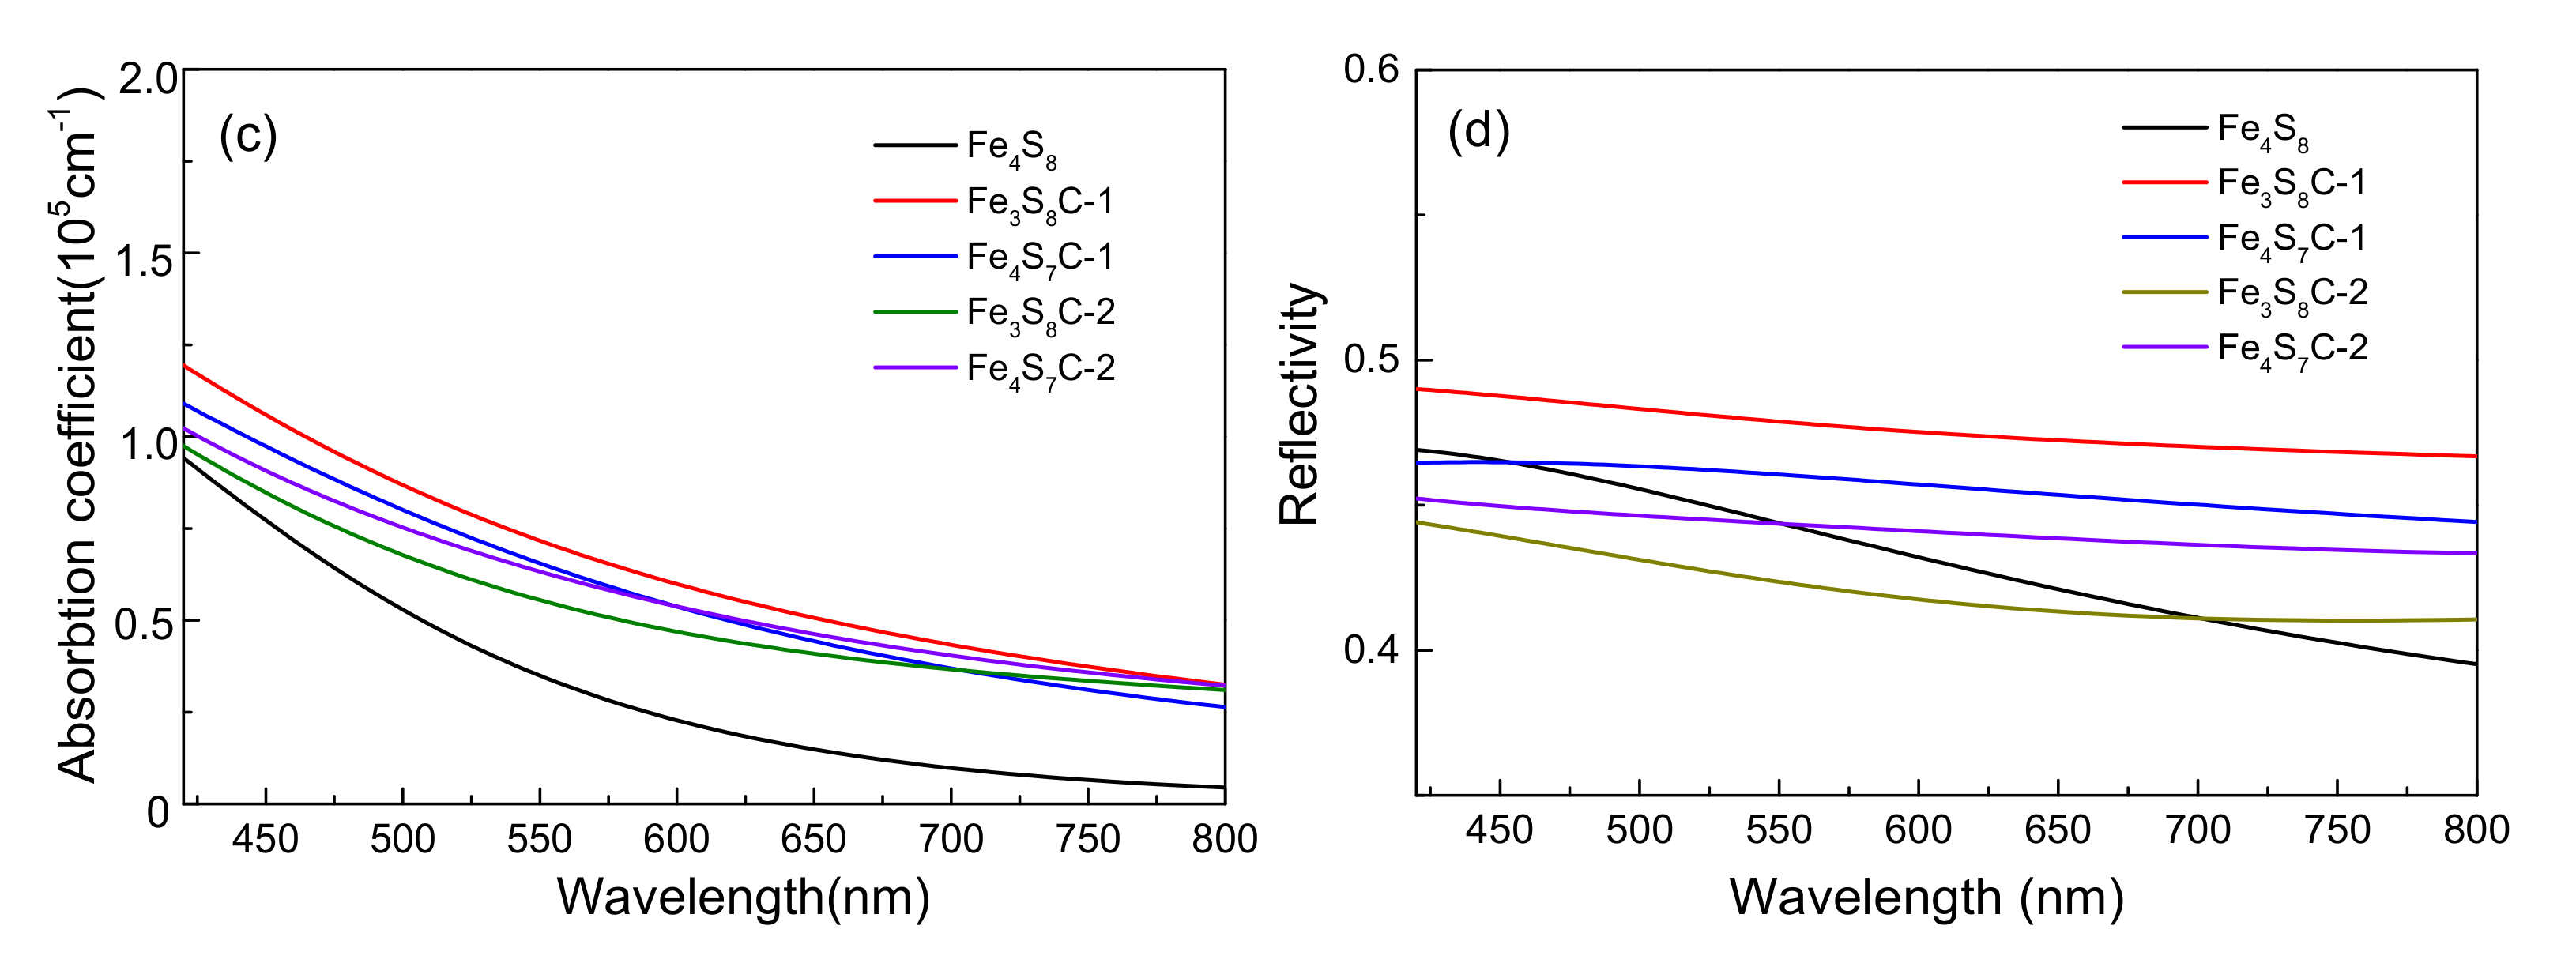
3.2.2. Effect of Optical Properties

CASTEP can calculate the optical properties of solids produced by electronic transitions. The commonly used indexes of optical properties calculated in this study included: dielectric function, absorption coefficient, and refractive index, with the results shown in Figure 4.
The complex dielectric function is commonly used to evaluate optical properties and then other properties can be expressed on its terms. The real and imaginary parts of the complex dielectric function are plotted as a function of electric field in Figure 3a,b. The Gaussian broadening used for calculating the dielectric function was set to 0.5 eV. The real part of the dielectric function at a frequency of 0 eV corresponds to the static dielectric function. The static dielectric constant of perfect pyrite was 14.7, and there were three dielectric peaks at 2.26, 7.41, and 9.24 eV. The strongest dielectric peak appeared at about 2.26 eV, which is different from the value obtained by Li et al. [8] using Hubbard U (U = 1.2 eV) correction, where the strongest dielectric peak appears at about 3 eV. This also confirms the findings of Choi et al. [36] that, when using Hubbard U correction, different U values may change the critical point of the dielectric function. When the configuration is Fe3S8C-1, the static dielectric constant is 24.68 and there are two dielectric peaks at 1.11 and 9.5 eV, with the strongest peak appearing around 1.11 eV. When the configuration is Fe3S8C-1, the static dielectric constant is 21.23 and there are two dielectric peaks at 1.30 and 7.75 eV, with the strongest peak appearing around 1.30 eV. When the configuration is Fe3S8C-2, the static dielectric constant is 39.04, and there is only one dielectric peak at 8.09 eV. When the configuration is Fe4S7C-2, the static dielectric constant is 33.09, and there is only one dielectric peak at 8.01 eV. All forms of carbon doping increase the static dielectric constant of pyrite, among which Fe3S8C-2 exhibits the most obvious increase, and the whole dielectric function shifts toward low energy.
In the imaginary part of Figure 4b, the perfect pyrite has three dielectric peaks within this frequency range that correspond to the frequencies of 3.27, 7.63, and 9.77 eV. The strongest dielectric peak located at 3.27 eV is due to the electronic transition between the s and p orbitals of S and the conduction band after hybridization, with a peak value reaching 18.26. The remaining two dielectric peaks come from the electronic transition between the middle valence band of S 3p states and the conduction band of Fe 3d states. Compared with the perfect pyrite, the first transition peaks of pyrite with different carbon occurrences all shift toward low energy. When the configuration is Fe3S8C-1, the value of the first transition peak increases to 20.27, whereas the values of the first transition in other configurations all decrease. When the frequency is lower than 3.27 eV, compared with the perfect pyrite, the optical transition intensity of carbon-doped pyrite is stronger, whereas when the frequency is greater than 3.27 eV, the optical transition intensity weakens. This shows that the doping of carbon can improve the optical transition characteristics of electrons in the frequency range lower than 3.27 eV.
The absorption coefficients of pyrite with different forms of carbon occurrence to visible light (420–800 nm) were studied, as shown in Figure 4c. The visible light absorption coefficient of pyrite in different forms of carbon occurrence is significantly higher compared with that of perfect pyrite, and the incorporation of carbon impurities leads to the red shift in the absorption coefficient curve, indicating that the doping concentration can increase the absorption coefficient of pyrite. The reflectivity of pyrite with different forms of carbon occurrence to visible light is shown in Figure 3d. Among the two structures of carbon doping in the iron vacancy, the reflectivity of Fe3S8C-1 is higher than that of perfect pyrite in the whole visible light wavelength range, and when the structure is Fe3S8C-2, the carbon doping enhances the visible light reflectivity of pyrite to wavelengths over 550 nm. For the two structures of carbon doping in the sulfur vacancy, when the structure is Fe4S7C-1, the reflectivity increases in the wavelength range of 450 to 800 nm, but decreases in the wavelength range of 420 to 450 nm. When the structure is Fe4S7C-2, the reflectivity decreases significantly when the wavelength range is 420 to 700 nm.

3.3. Effects of Carbon Doping Concentrations on the Electronic Structure and Optical Properties of Coal–Pyrite

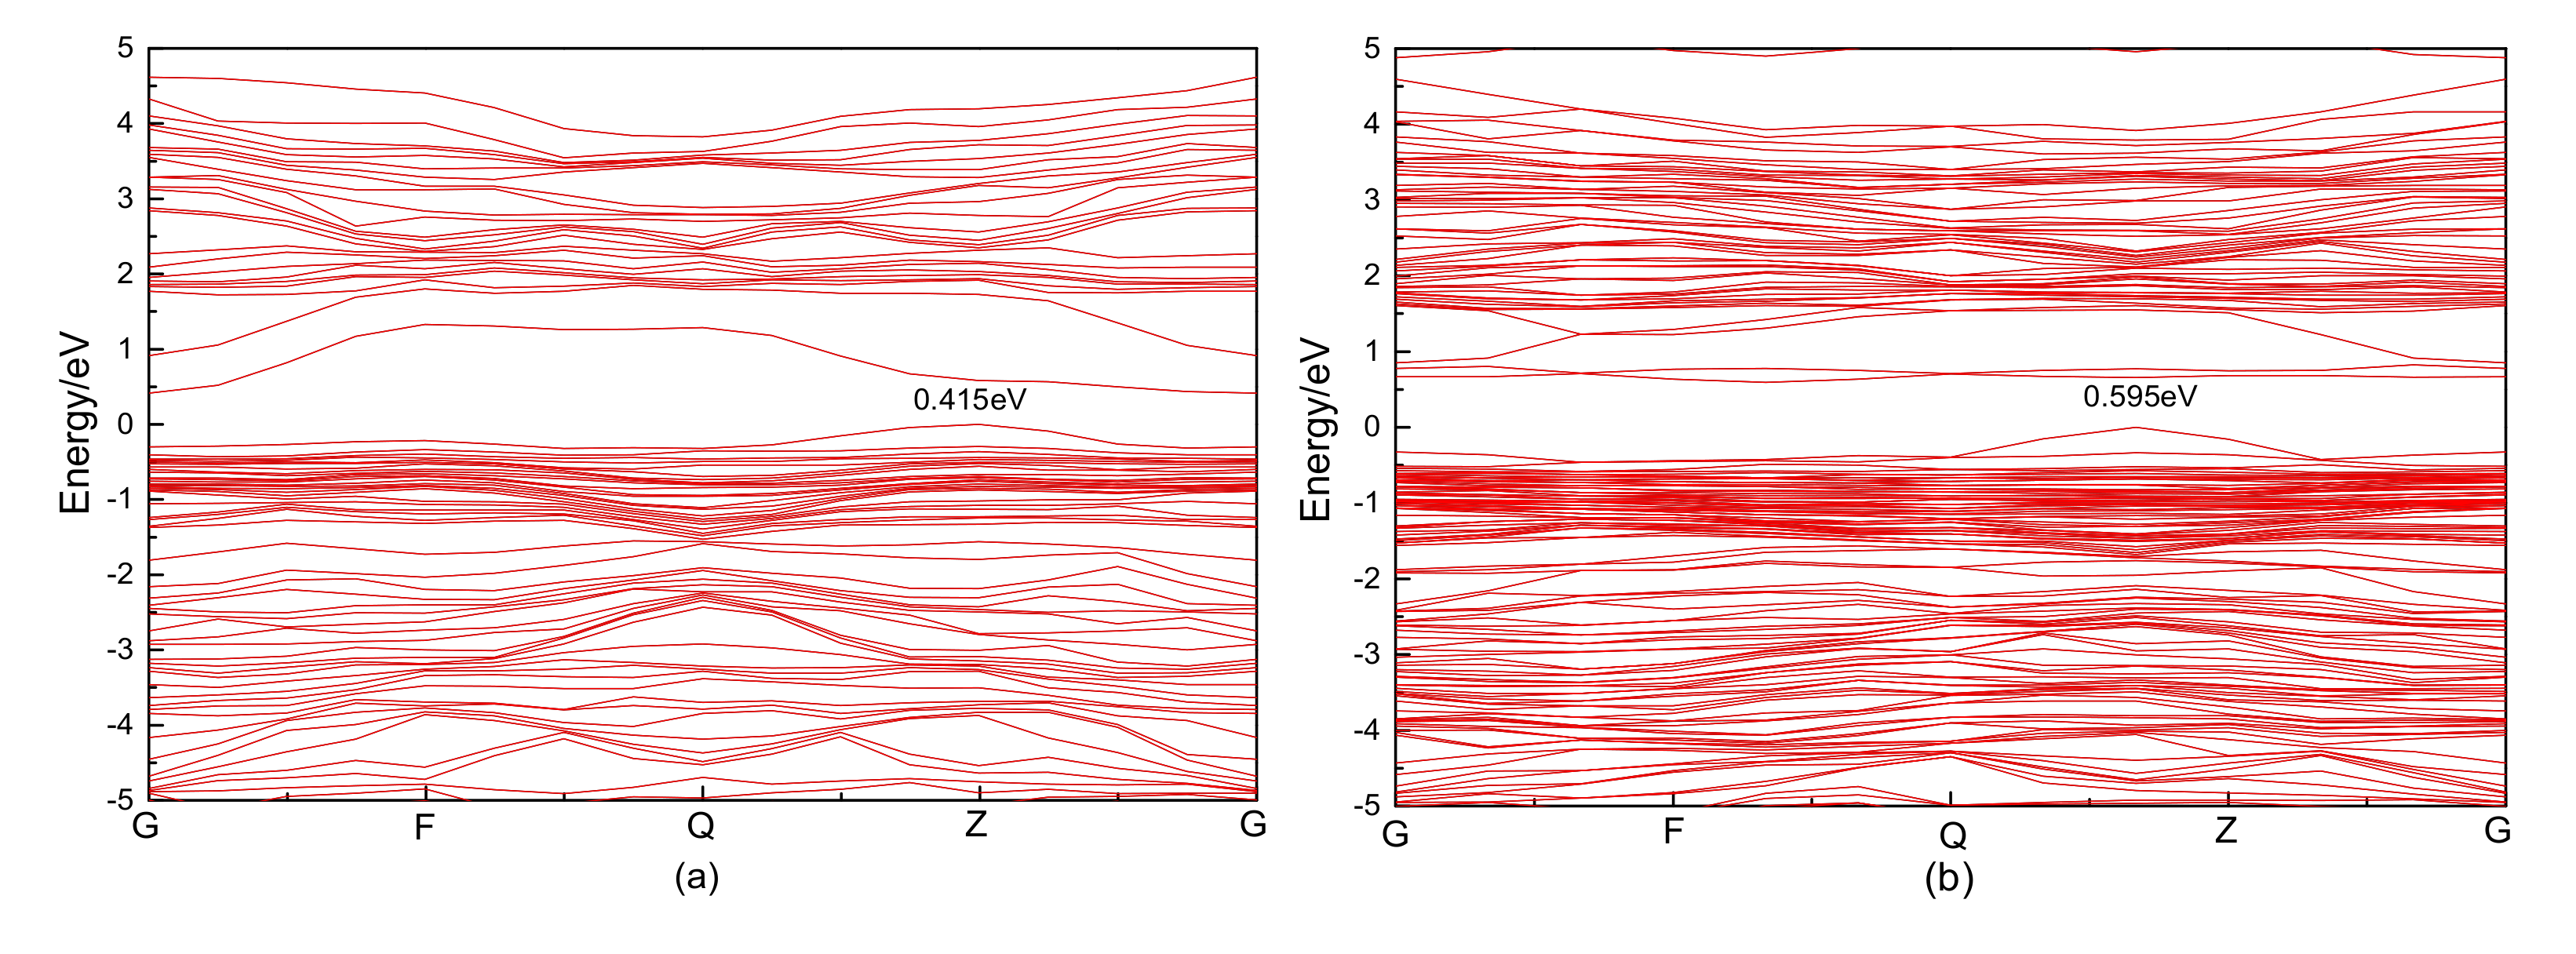
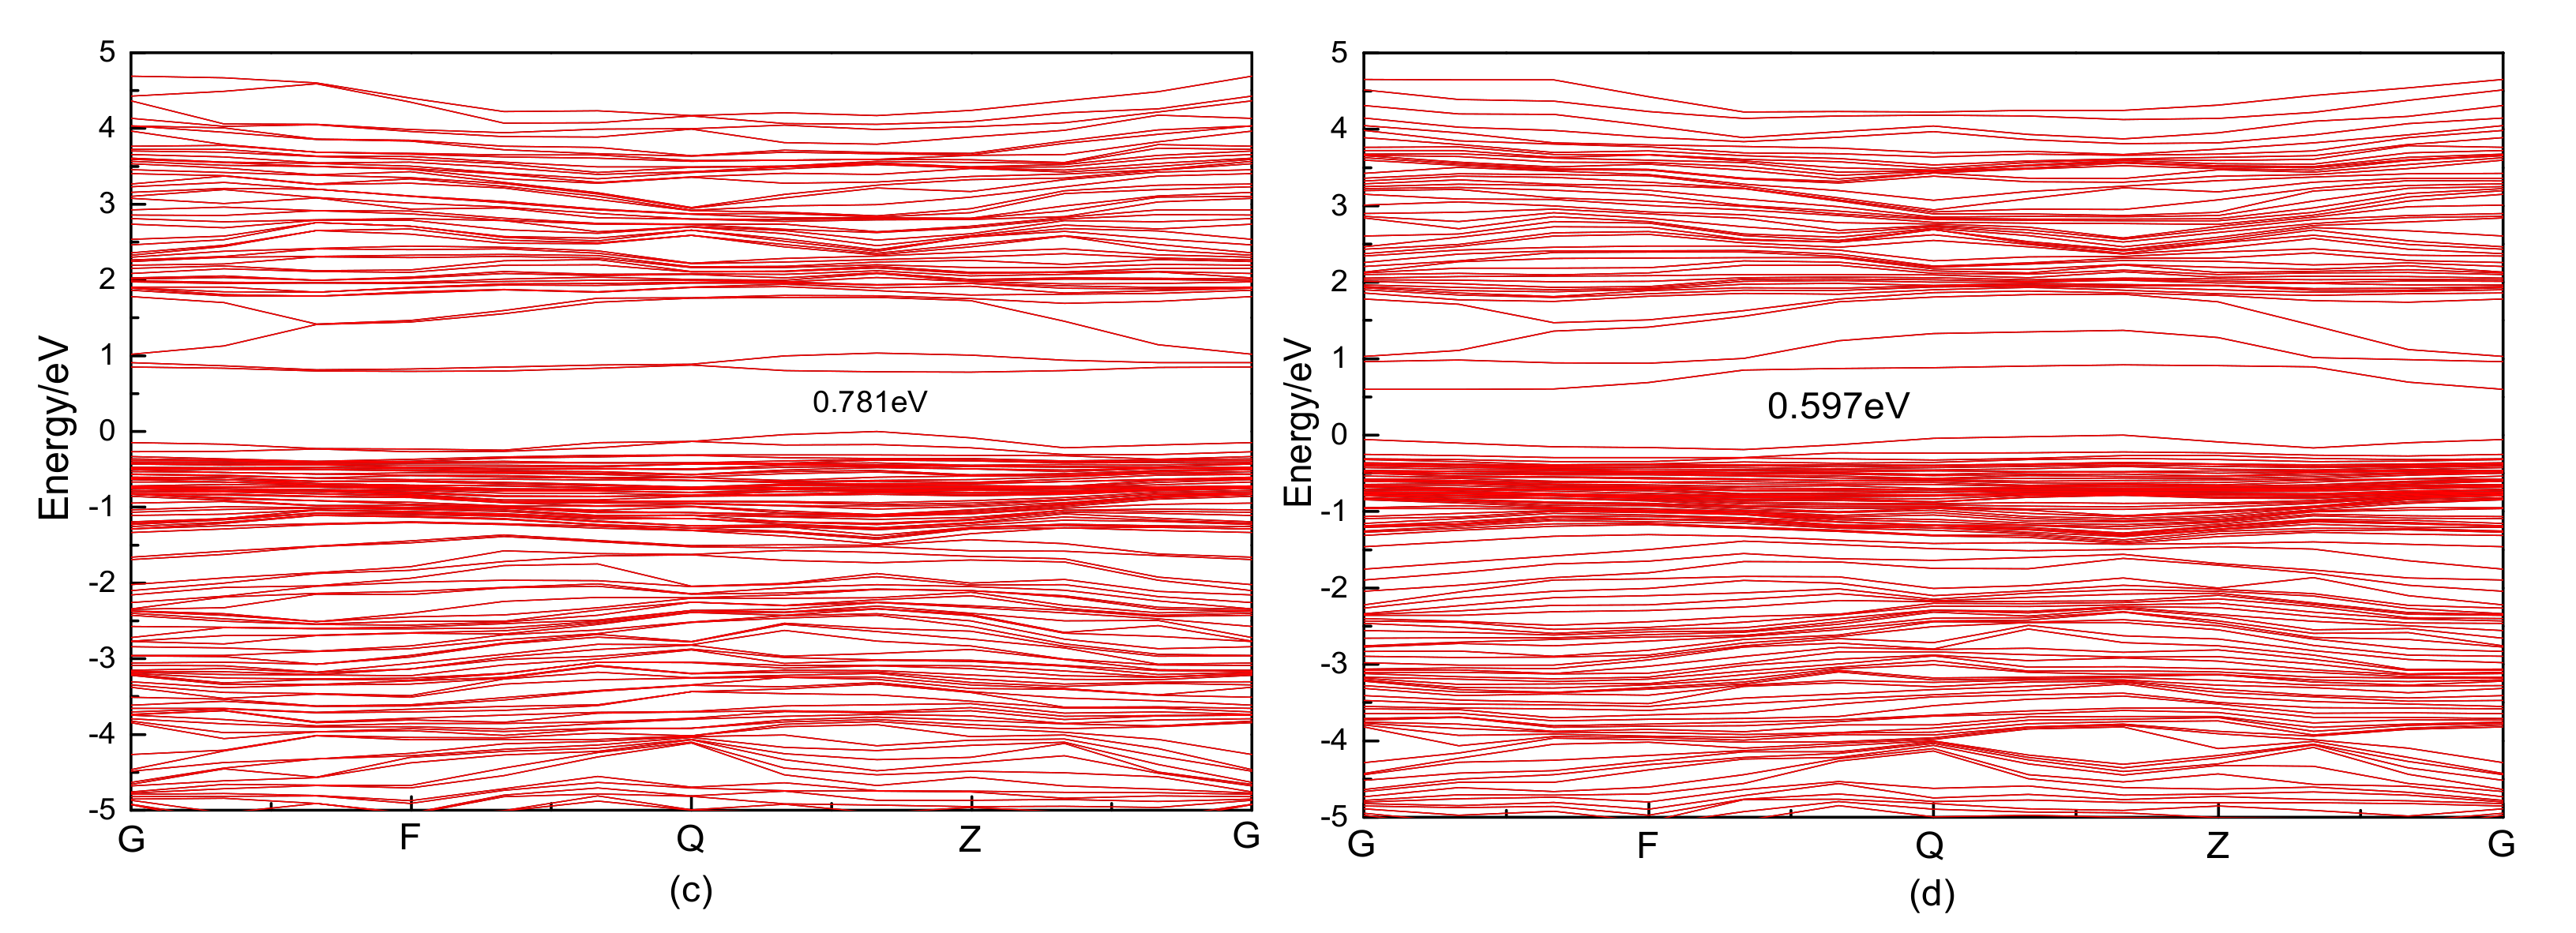
3.3.1. Electronic Structure

The calculated results show that the band gaps decrease with the increase in carbon doping concentration, as shown in Figure 5, and the band gaps are 0.987, 0.900, 0.415, and 0.175 eV, which are all lower than that of perfect pyrite. This occurs due to the formation of defect levels produced by carbon doping near the band gap and band edge; the Fermi level enters the band gap, which can be improved by doping with other isovalent elements or dimers [37].
To further explain the cause of this situation, the density of states and the partial density of states were plotted (Figure 6). The dashed line represents the Fermi energy level, EF. The total density of states shows that the minimum conduction band value significantly decreases, and carbon doping introduces impurity states into the band gap, leading to the decrease in the band gap. The photogenerated electrons in the higher energy states have a greater oxidizability and the photogenerated holes in the lower energy states have a stronger reducibility. Therefore, the incorporated carbon atoms in the pyrite cell increase the reducibility. Due to its strong reducibility, coal pyrite can be easily depressed by oxidizing agents, with hydrophilic species forming on the pyrite surface. The partial density of states diagram shows that the valence band (located in the interval from −1. to 0 eV) and the bottom conduction band of pyrite are predominantly composed of Fe 3d and S 3p states. The peak of S 3p states below EF hybridize with Fe 3d states. The S 3s states are mainly located in the bottom valence band, and the impurity gap states are mainly composed of C 2p orbitals in the upper valence band and the bottom of the conduction band. With the increase in doping concentration, most of the C 2s states form a deep impurity level in the bottom of the conduction band. Some C 2p states extend into the band gap, which is responsible for the band gap reduction.

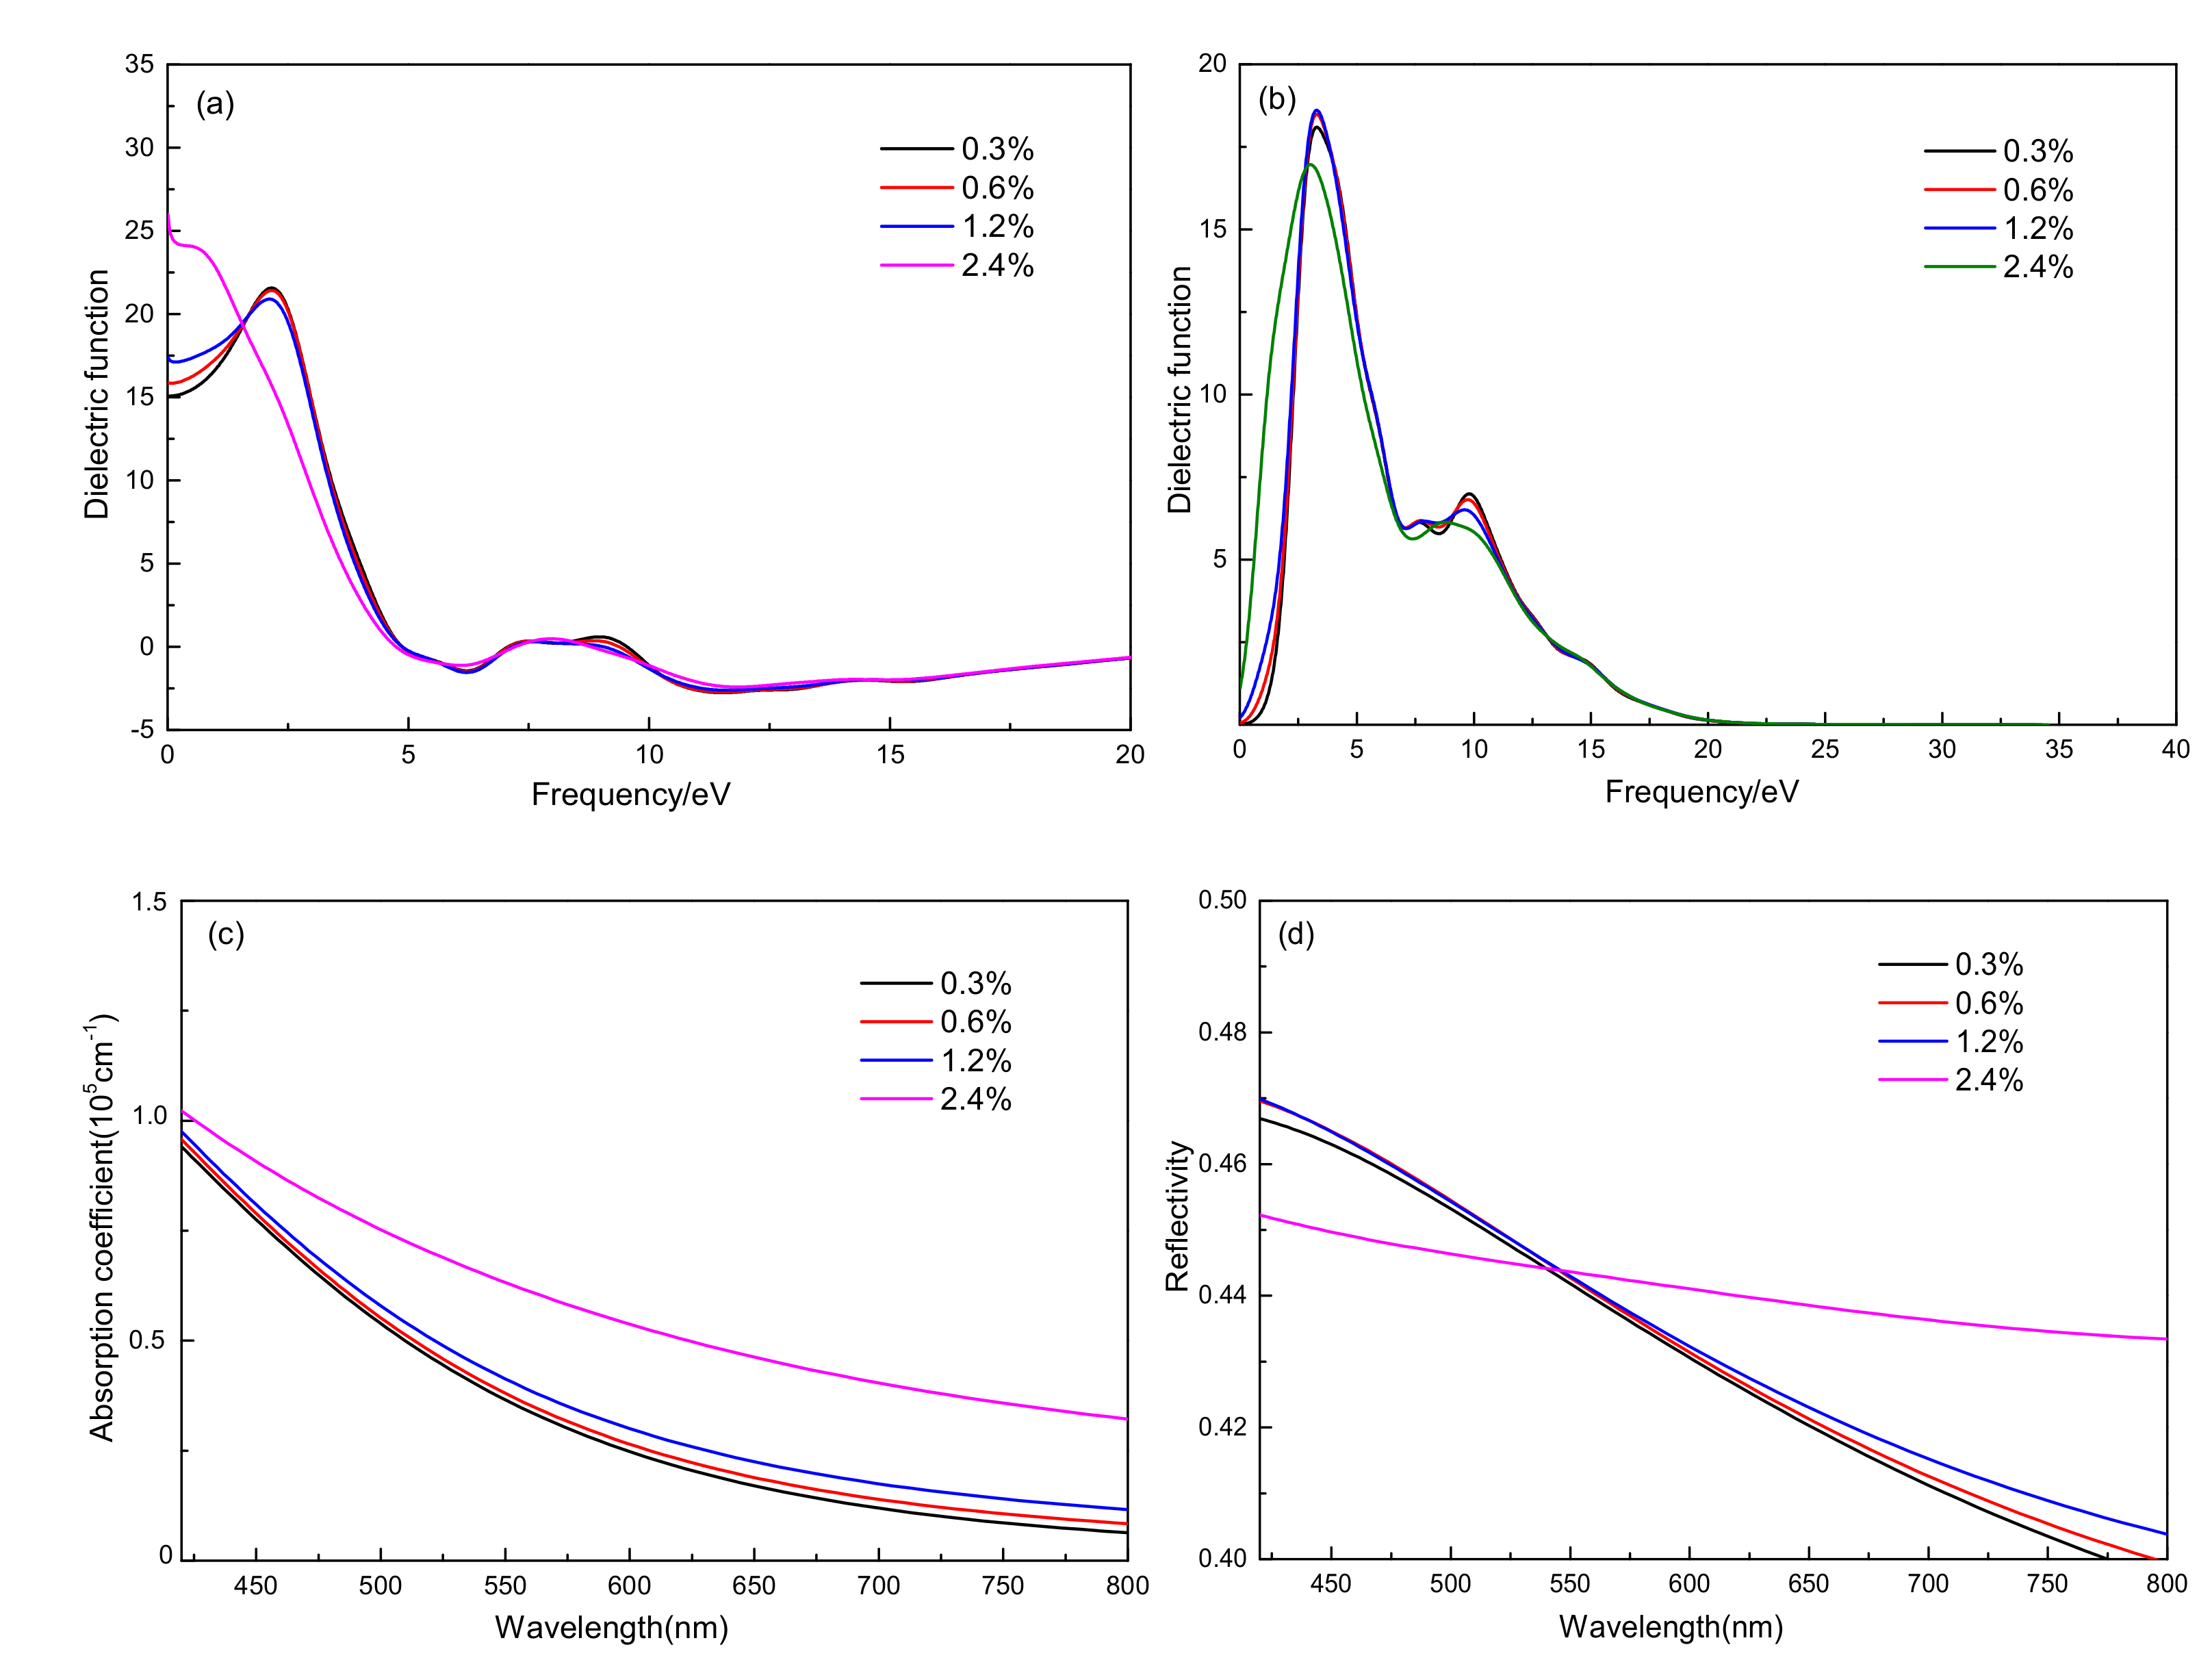
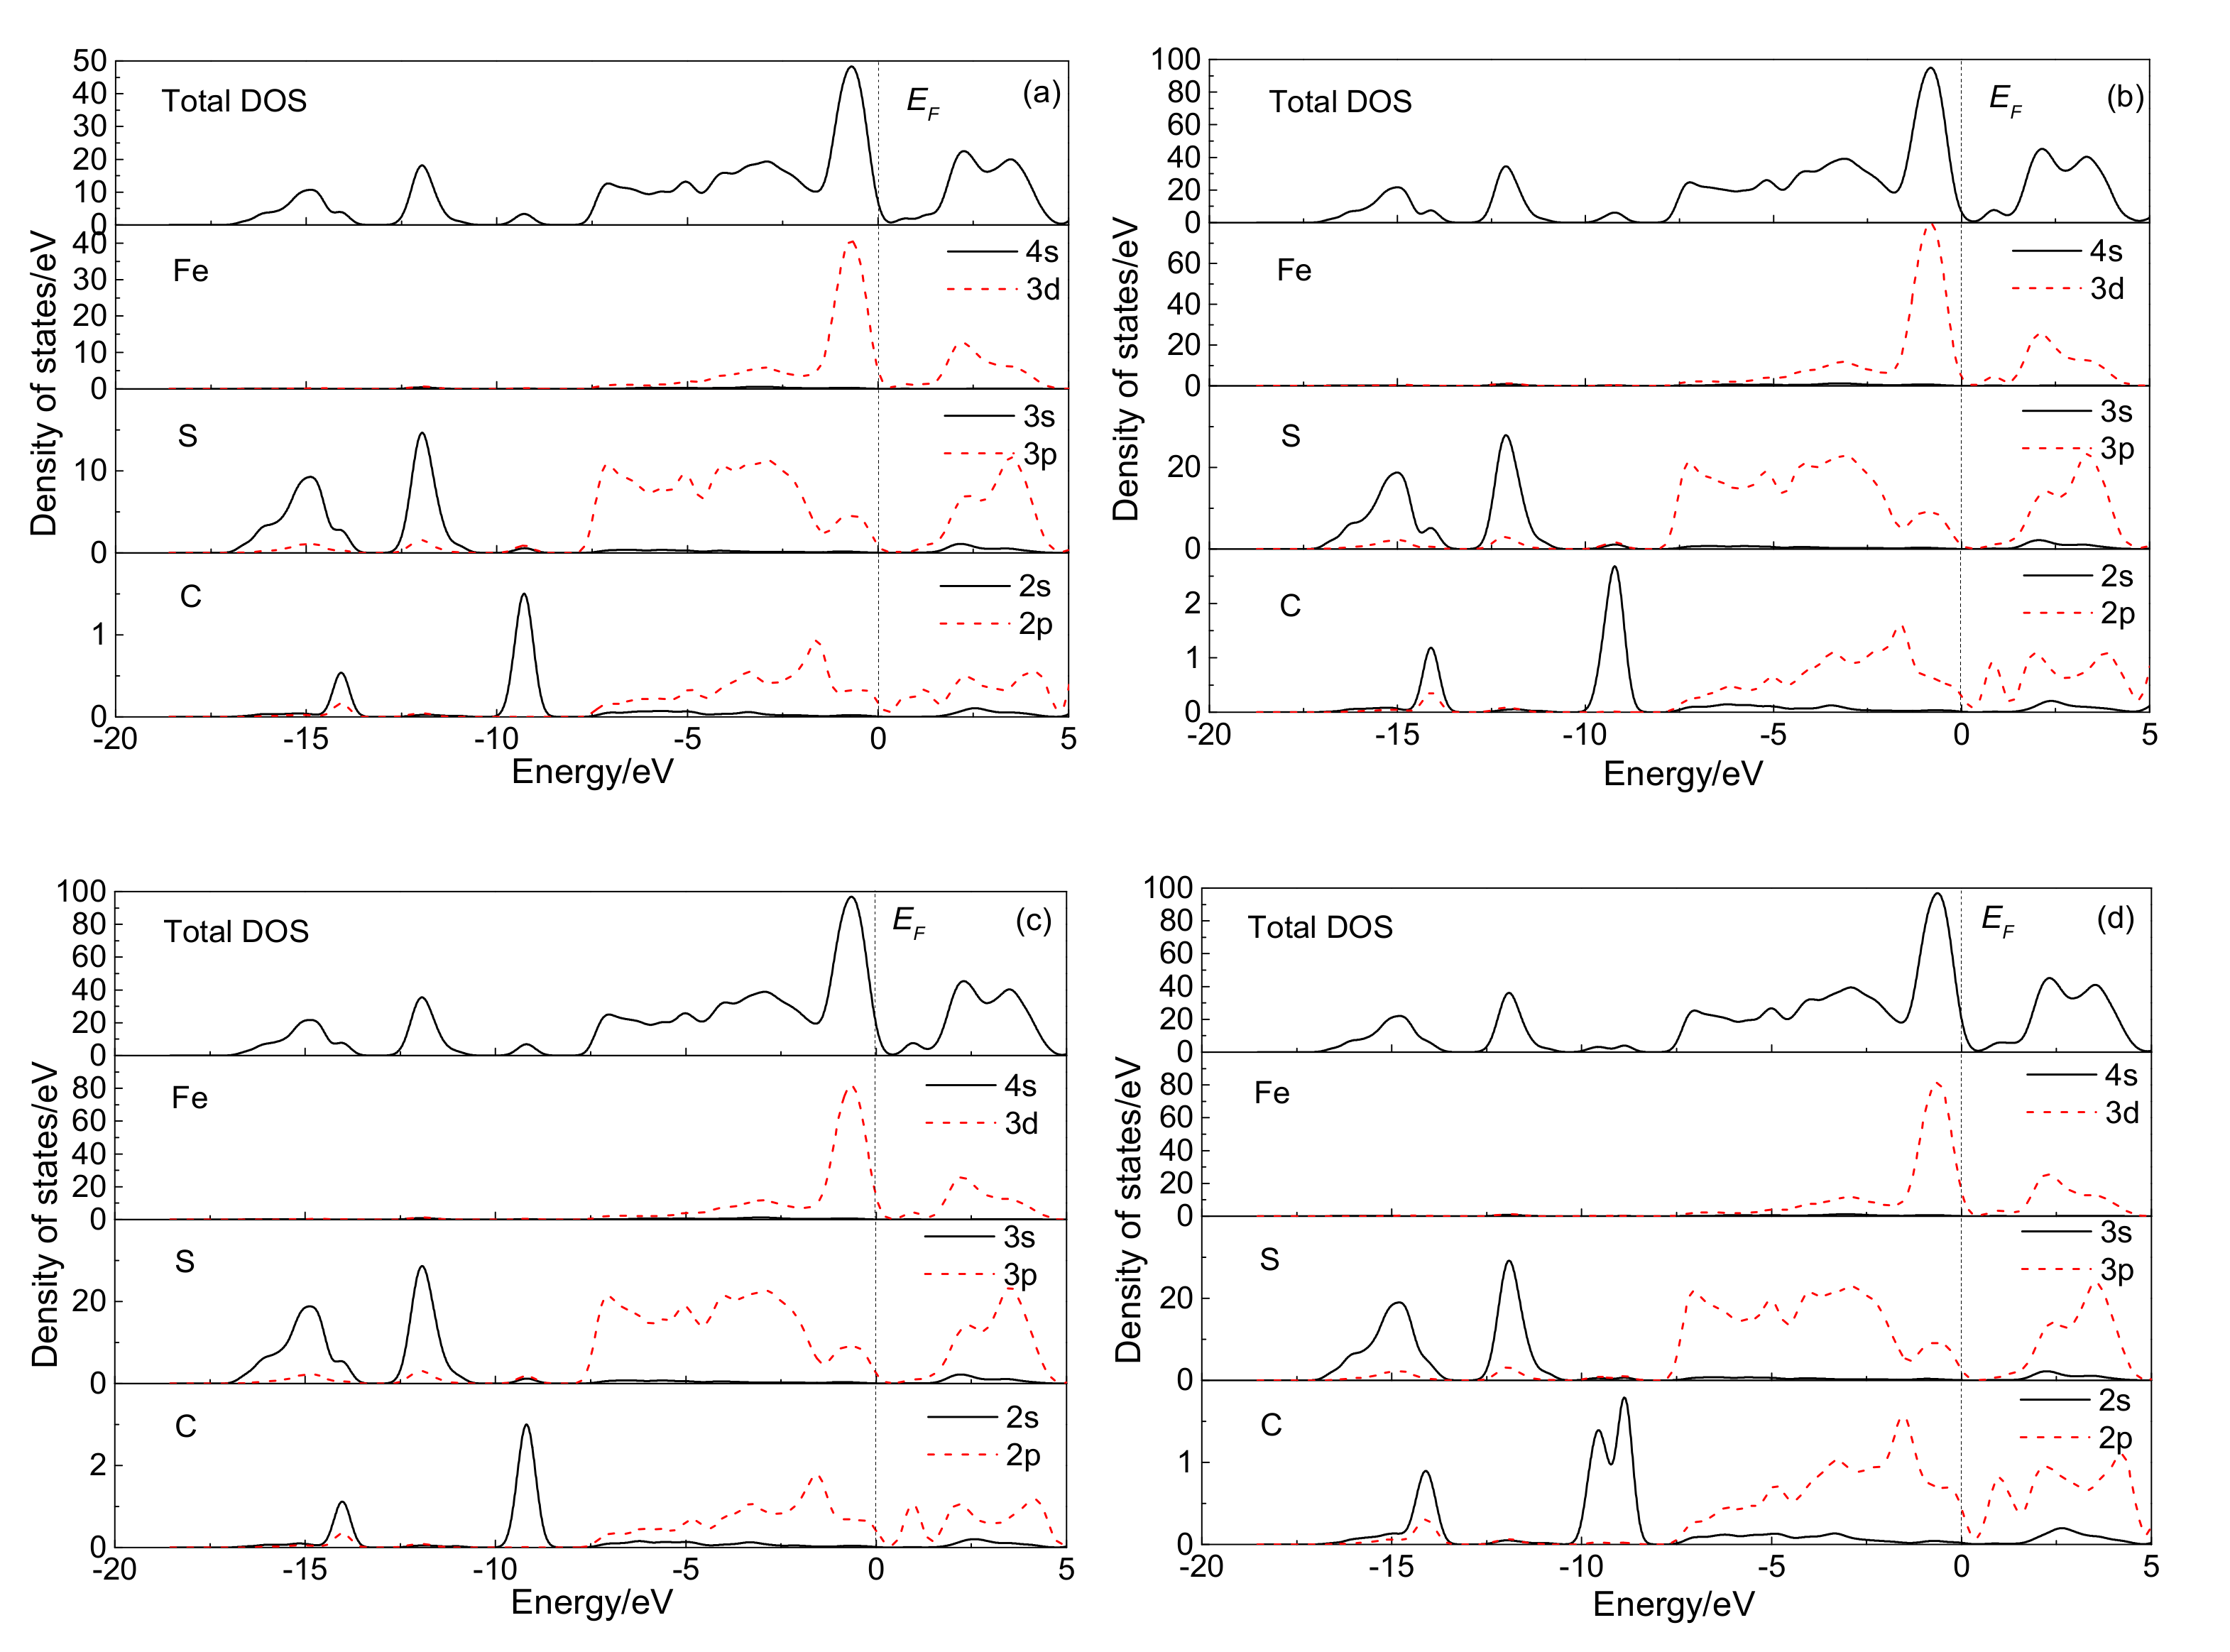
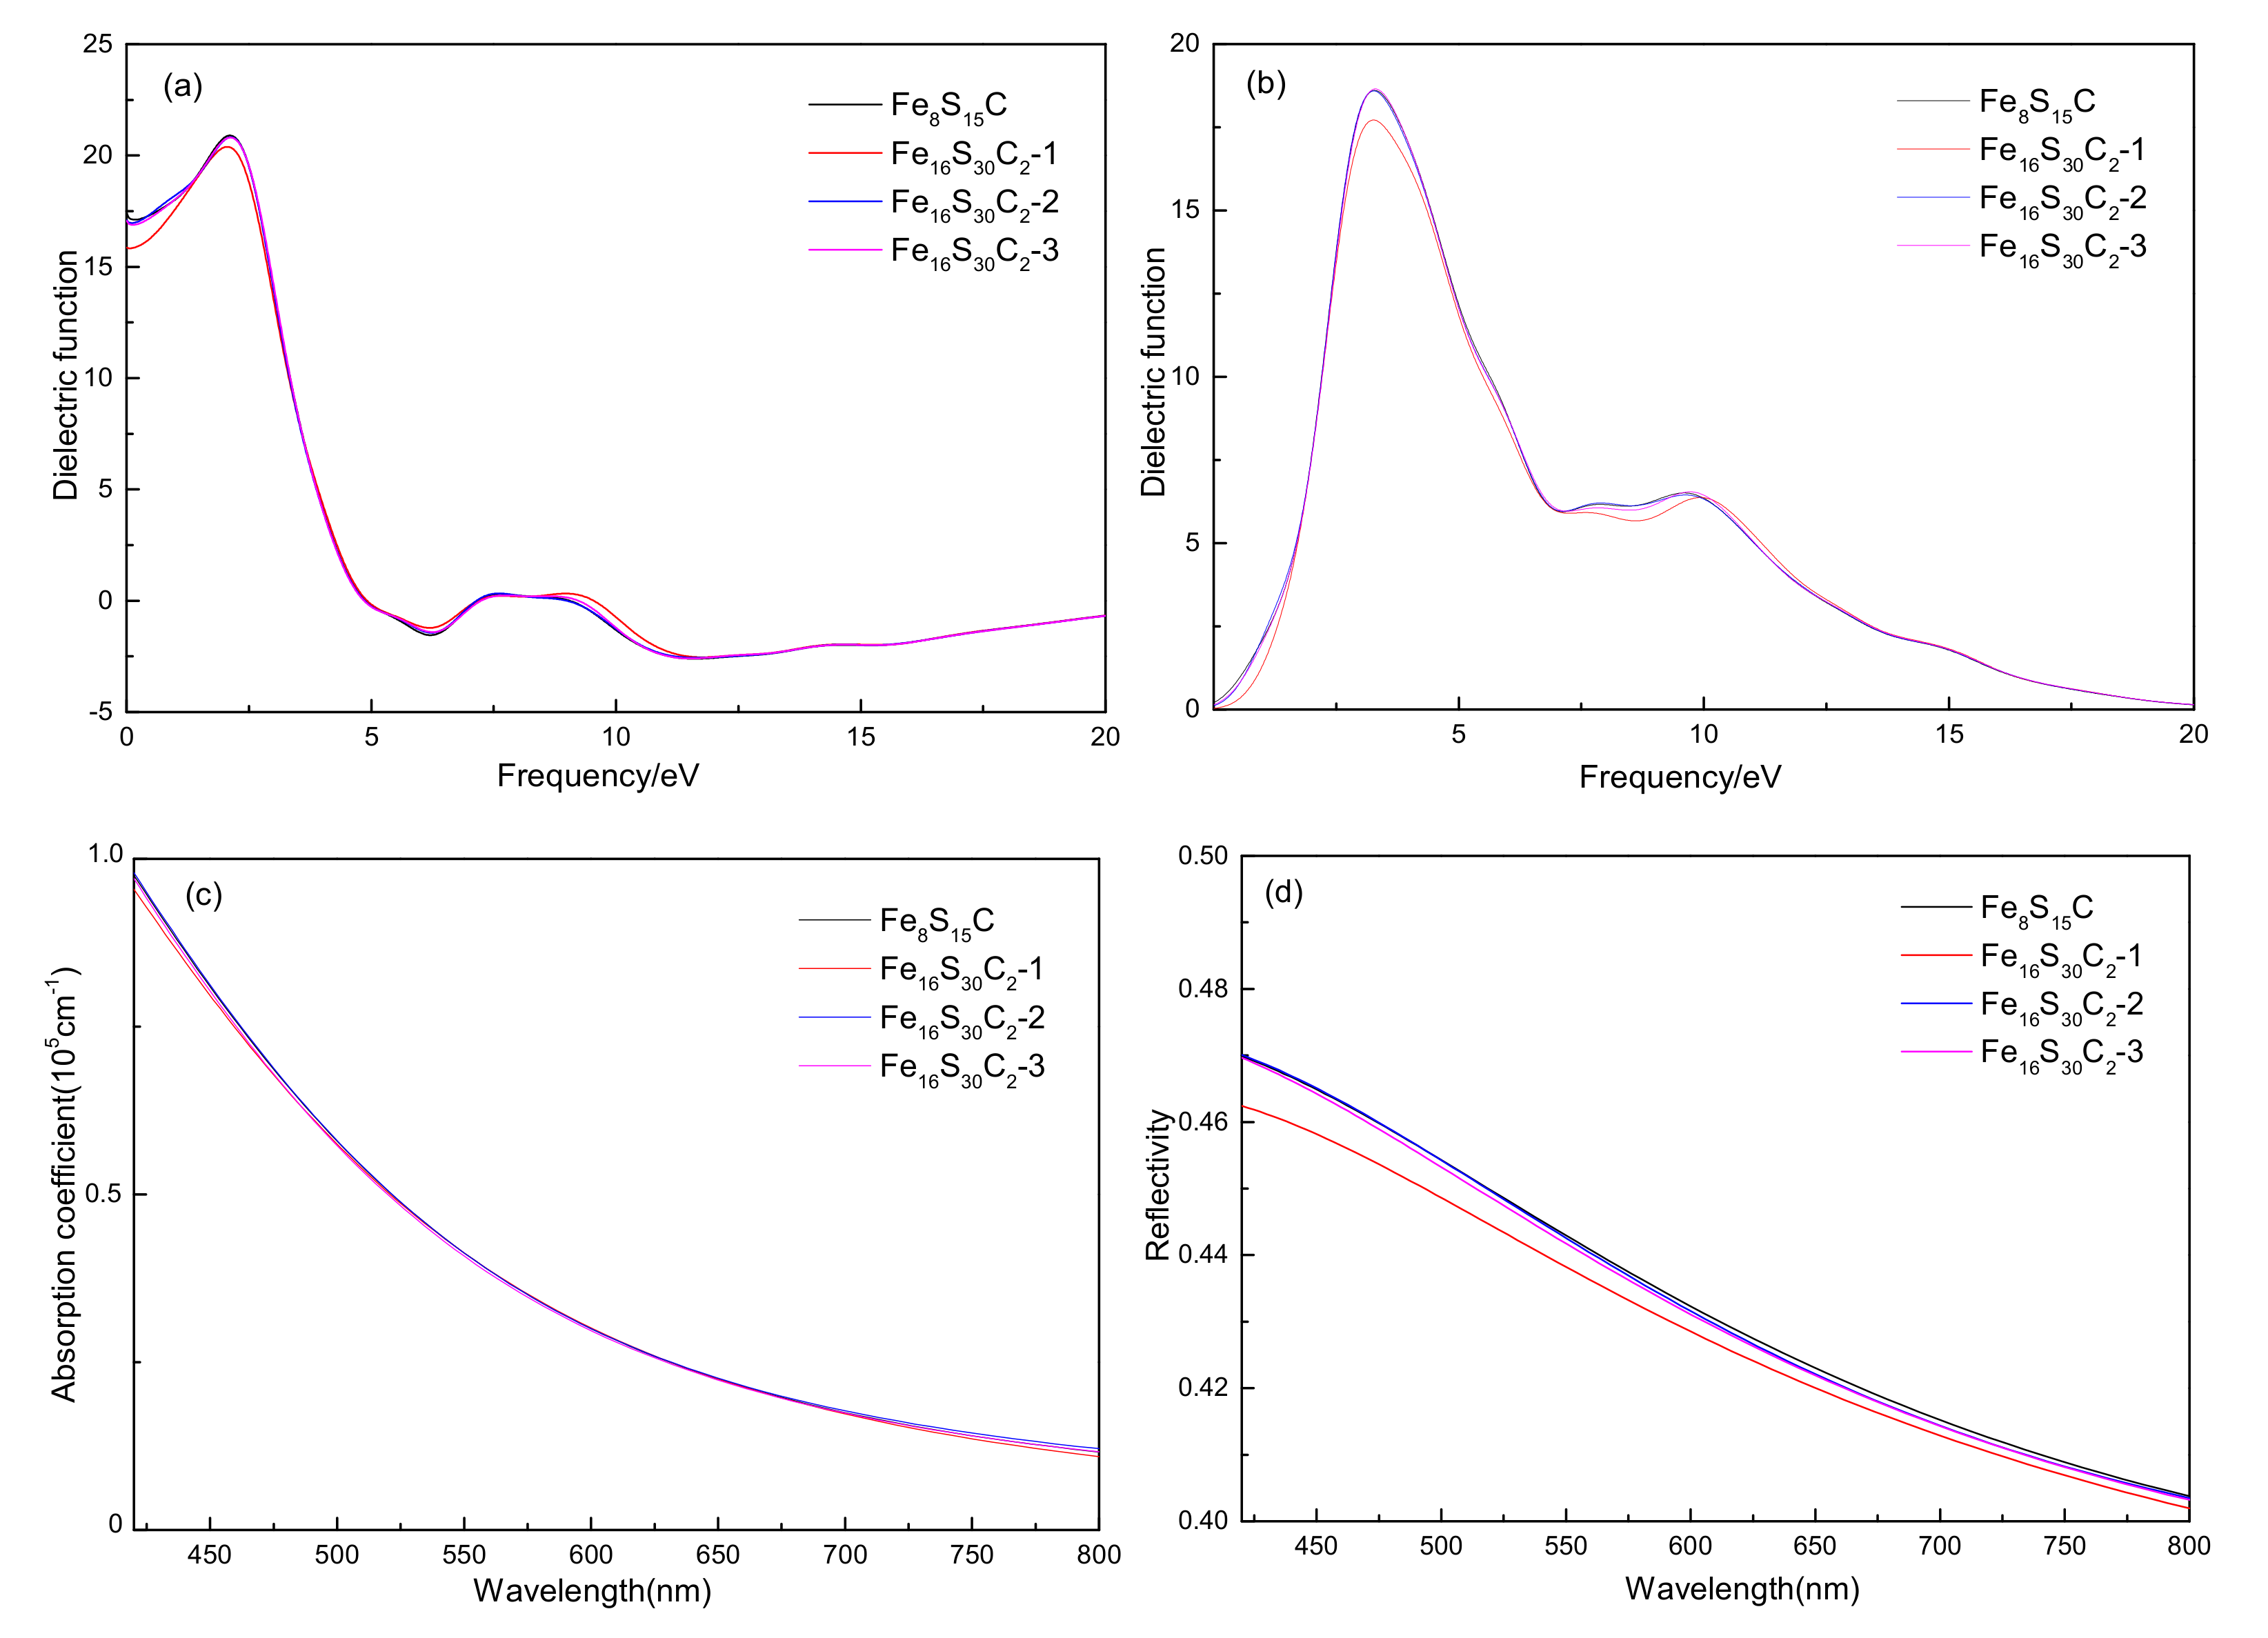
3.3.2. Effect of Optical Properties

Figure 7 depicts the optical properties (complex dielectric function, absorbance, and reflectivity) of pyrite with different carbon doping concentrations. Figure 7a shows that the static dielectric constant increases with the increase in carbon doping concentration. Figure 7b indicates that the increase in carbon doping concentration causes the first dielectric peak to shift toward low energy. When the doping concentration is lower than 1.2%, the intensity of the first dielectric peak increases with the increase in doping concentration, which indicates that the optical transition of electrons in the low energy range can be improved with the increase in doping concentration; the higher the doping concentration, the greater the intensity of the optical transition. However, when the doping concentration reaches 2.4%, the first dielectric peak decreases instead, indicating that excessively high doping concentration reduces the optical transition of electrons in the low energy, which also lowers the optical transition intensity. Figure 7b shows that coal pyrite has a high absorption coefficient in the visible light range, and with the increase in doping concentration, the absorption coefficient of coal pyrite to visible light increases, leading to the redshift of the absorption coefficient curve. From Figure 7c, in the visible light range of 550–800 nm, the reflectivity increases with the increase in doping concentration, while at the high doping concentration (2.4%) in the range of 380~550 nm, the reflectivity significantly decreases.

3.4. Effect of the Distribution of Carbon Impurities on the Electronic Structure and Optical Properties of Pyrite at the Same Doping Concentration

In previous studies, most simulations of different doping concentrations were conducted by increasing or decreasing cell volumes under the condition of doping one impurity atom, which means that the distribution position in the impurity phase is completely uniform by default. However, this completely uniform distribution is difficult to achieve in actual situations, and the carbon impurities may have various distributions. Under the same doping concentration, different distributions will have a certain impact on the energy band and optical properties of crystals, as proved by Deng et al. [24]. Therefore, we studied pyrite with a carbon doping concentration of 1.2% but different distribution positions.

3.4.1. Electronic Structure

To analyze the influence of different doping positions with the same concentration, four models, as shown in Figure 8, were constructed with a doping concentration of 1.2%. Figure 8a depicts the structure formed by doping one carbon atom into the 2 × 1 × 1 supercell, named Fe8S15C. Figure 8b–d depict Fe16S30C2 formed by doping two carbon atoms into the 2 × 2 × 1 supercell, named Fe16S30C2-1, Fe16S30C2-2, and Fe16S30C2-3, respectively. Figure 8b–d display three different distributions, and the distribution positions are marked with red circles. Figure 8d represents a situation where two adjacent vacancies form a larger space similar to a spindle vacancy. To facilitate representation, the model was placed at an angle, as shown in the figure. Among the four configurations, the local density of carbon atoms in Fe16S30C2-2 is the lowest and that in Fe8S15C is the highest. There are four irreducible k-points for all these structures.
The calculation results show that the band gap undergoes significant changes, as shown in Figure 9. Figure 9a–d correspond to the band gaps of pyrite at the doping position of Figure 8a–d, which are 0.415, 0.595, 0.781, and 0.597 eV, respectively. The distribution of carbon atoms has a certain influence on the band gap of pyrite. To analyze the causes of these results, the total state density diagram and the partial density diagram were drawn, as shown in Figure 10.
The total and partial densities of states in Figure 10 show that the impurity level is introduced into the Fermi level by carbon doping, which leads to the change in the minimum value of the conduction band. However, the partial density of states diagram shows that this change is mainly caused by the C 2p states. The more uniform the distribution of carbon atoms, the lower the local density, and the less the influence of impurity states of C on the energy band.

3.4.2. Effects of Optical Properties

The basic optical properties (complex dielectric function, absorption coefficient, and reflectivity) of carbon-doped pyrite at different positions and the same concentration were calculated, as shown in Figure 11. We found that at the same doping concentration, the static dielectric constant of pyrite decreases only when the configuration is Fe16S30C2-1 (Figure 8b). The imaginary dielectric peak intensity of the dielectric function and the reflectivity of visible light decrease, indicating that doping at this position slightly reduces the optical transition ability of electrons. However, for the other three configurations, the optical properties are almost the same. The carbon distribution has almost no effect on the absorbance of visible light. Hence, the doping concentration is the main factor affecting the optical properties rather than the distribution of carbon impurities.

4. Conclusions

The structure and properties of the coal pyrite were studied using DFT + U calculations. The effects of carbon doping at the sulfur vacancy and iron vacancy defects on the electronic structure and optical properties of pyrite were examined, and the effects of carbon doping at the sulfur vacancy defect, which may be closer to the actual carbon doping of coal pyrite, on the electronic structure and optical properties of pyrite were analyzed. Our conclusions are as follows:
(1) The calculation of four carbon-doped configurations (Fe3S8C-1, Fe3S8C-2, Fe4S7C-1, and Fe4S7C-2) with different vacancy defects showed that compared with perfect pyrite, all carbon impurities lead to the down-shift in the conduction band, a considerably reduced band gap, and enhanced metallic property, which is adverse for solar photovoltaics. Our analysis of the density of states diagram showed that this occurs because carbon doping contributes to the electron density of states at the Fermi level of pyrite and has more of an influence on the distribution of the density of states of iron and sulfur atoms, which shifts toward the low energy. The results of the calculation of optical properties showed that compared with perfect pyrite, carbon doping results in significant increases in the static dielectric constant and the first dielectric peak intensity of pyrite, a decrease in the number of dielectric peaks, and redshift in the light absorption coefficient curve. These findings indicate that coal pyrite has a certain potential in the field of photovoltaic applications. In terms of the influence of carbon doping on the reflectivity of pyrite in the visible range, the two structures of carbon doping in the sulfur vacancy are different. When the structure is Fe4S7C-1, the reflectivity increases in the wavelength range of 450 to 800 nm, but decreases in the wavelength range of 420 to 450 nm. When the configuration is Fe4S7C-2, the reflectivity decreases significantly when the wavelength is 420 to 700 nm.
(2) The calculation of different doping concentrations (0.3%, 0.6%, 1.2%, and 2.4%) of carbon impurities at the sulfur vacancy defects showed that the impurity state reduces the band gap, and the band gap decreases with the increase in doping concentration. The calculation of optical properties showed that carbon doping causes a red shift of the edge of the visible light absorption band, and as the doping concentration increases, the visible light absorption coefficient increases.
(3) For the same doping concentration of carbon impurities in the sulfur vacancy, the calculation of different distributions showed that different distributions have a certain influence on the band gap that mainly depends on the uniformity of the distribution of carbon impurities. In the case of a more uniform distribution, the local carbon atom density is small and the band gap is large. The study of optical properties showed that the distribution has little influence on optical properties, especially on the absorption coefficient, which is almost the same for the four distributions. The influence on the complex dielectric function and reflectivity is also small; only the optical properties of the uniformly distributed configuration are slightly reduced. The results show that the concentration of carbon doping should be considered when coal pyrite is applied in photovoltaic materials, whereas the distribution of carbon impurities has little effect in this regard.

Author Contributions

Conceptualization, B.K. and W.C.; Data curation, C.C. and W.C.; Funding acquisition, W.C.; Investigation and Methodology, W.C.; Project administration, B.K. and W.C.; Writing—original draft, C.C. and W.C.; and Writing—review and editing, B.K. All authors have read and agreed to the published version of the manuscript.

Funding

This study was supported by the National Natural Science Foundation (41802190 and 51964009) and Guizhou University High-level Talent Scientific Research Project (GZU R.J.H. 201803).

Conflicts of Interest

The authors declare no conflict of interest.

References

  1. Schlegel, A.; Wachter, P. Optical properties, phonons and electronic structure of iron pyrite (FeS2). J. Phys. C Solid State Phys. 1976, 9, 3363–3369. [Google Scholar] [CrossRef]
  2. Hu, J.; Zhang, Y.M.; Law, M.; Wu, R.Q. First-principles studies of the electronic properties of native and substitutional anionic defects in bulk iron pyrite. Phys. Rev. B 2012, 85, 085203. [Google Scholar] [CrossRef] [Green Version]
  3. Yu, Q.K.; Cai, S.; Jin, Z.G.; Yan, Z.P. Evolutions of composition, microstructure and optical properties of Mn-doped pyrite (FeS2) films prepared by chemical bath deposition. Mater. Res. Bull. 2013, 48, 3601–3606. [Google Scholar] [CrossRef]
  4. Shockley, W.; Queisser, H.J. Detailed balance limit of efficiency of p-n junction solar cells. J. Appl. Phys. 1961, 32, 510–519. [Google Scholar] [CrossRef]
  5. Liu, T.; Zhang, J. Feasibility of band gap engineering of iron pyrite (FeS2) by codoping Os, Ru or Zn together with O. Mater. Chem. Phys. 2020, 244, 122742. [Google Scholar] [CrossRef]
  6. Voigt, B.; Moore, W.; Manno, M.; Walter, J.; Jeremiason, J.D.; Aydil, E.S.; Leighton, C. Transport evidence for sulfur vacancies as the origin of unintentional n-Type doping in pyrite FeS2. ACS Appl. Mater. Interfaces 2019, 11, 15552–15563. [Google Scholar] [CrossRef]
  7. Tian, X.; Zhang, J. The electronic, magnetic and optical properties of Co doped marcasite FeS2. J. Phys. Chem. Solids 2018, 121, 285–291. [Google Scholar] [CrossRef]
  8. Li, Y.Q.; Chen J., H.; Zhao, C. Influence of external electric field on the electronic structure and optical properties of pyrite. RSC Adv. 2017, 7, 56676–56681. [Google Scholar] [CrossRef] [Green Version]
  9. Sun, R.; Chan, M.K.Y.; Kang, S.Y.; Ceder, G. Intrinsic stoichiometry and oxygen-induced p-type conductivity of pyrite FeS2. Phys. Rev. B. 2011, 84, 035212. [Google Scholar] [CrossRef]
  10. Lehner, S.W.; Newman, N.; van Schilfgaarde, M.; Bandyopadhyay, S.; Savage, K.; Buseck, P.R. Defect energy levels and electronic behavior of Ni-, Co-, and As-doped synthetic pyrite (FeS2). J. Appl. Phys. 2012, 111, 2072–2077. [Google Scholar] [CrossRef]
  11. Ferrer, I.J.; Delasheras, C.; Sanchez, C. Physical properties of Cu-doped FeS2 pyrite thin films. Appl. Surf. Sci. 1993, 70, 588–592. [Google Scholar] [CrossRef]
  12. Li, Y.Q. First Principle Study of the Influences of Lattice Defects on the Electronic Structures and Flotation Behaviours of Pyrite Crytal. Ph.D. Thesis, Guangxi University, Nanning, China, 2011. [Google Scholar]
  13. Yu, J.X. Study on the Physical and Chemical Characteristics of Coal-Pyrite and Its Inhibitors. Ph.D. Thesis, University of Mining and Technology, Beijing, China, 2013. [Google Scholar]
  14. Yu, J.X. Influence of carbon on electronic properties and flotation behavior of pyrite. Min. Metall. Eng. 2013, 33, 63–67. [Google Scholar]
  15. Qi, X.; Zhang, H.J.; Li, Y.Q.; Chen, J.H. Density functional theory study of the structure and properties of C-doped pyrite. Phys. B Condens. Matter. 2019, 572, 168–174. [Google Scholar] [CrossRef]
  16. Xi, P.; Ma, R.; Liu, W. Research on the Effect of carbon defects on the hydrophilicity of coal pyrite surface from the insight of quantum chemistry. Molecules 2019, 24, 228–512. [Google Scholar] [CrossRef] [Green Version]
  17. Xi, P.; Wang, D.H.; Liu, W.L.; Shi, C.S. DFT study into the Influence of carbon material on the hydrophobicity of a coal pyrite surface. Molecules 2019, 24, 3534. [Google Scholar] [CrossRef] [Green Version]
  18. Chen, J.H. Principles of the Flotation of Sulphide Minerals Bearing Lattice Defects; Central South University Press: Changsha, China, 2012. [Google Scholar]
  19. Guo, J.; Li, Y.Q.; Chen, J.H. Density functional theory study of influence of impurity on electronic properties and reactivity of pyrite. Trans. Nonferrous Metals Soc. China 2011, 21, 1887–1895. [Google Scholar]
  20. Li, Y.Q.; Chen, J.H.; Chen, Y. Electronic structures and flotation behavior of pyrite containing vacancy defects. Acta Physico-Chimica Sinica 2010, 26, 1435–1441. [Google Scholar]
  21. Li, Y.Q. Density functional theory calculation of surface properties of pyrite (100) with implications for flotation. Chinese J. Nonferrous Metals 2011, 21, 919–926. [Google Scholar]
  22. Liu, Y.; Dang, H.; Li, Y.; Charoensuppanimit, P.; Mohammad, S.A.; Gasem, K.A.M.; Wang, S. Sequestration of carbon dioxide in coal: Energetics and bonding from first-principles calculations. Comput. Mater. Sci. 2017, 133, 145–151. [Google Scholar] [CrossRef]
  23. Ren, K.; Sun, M.L.; Luo, Y.; Wan, S.; Yu, J.; Tang, W.C. First-principle study of electronic and optical properties of two-dimensional materials-based heterostructures based on transition metal dichalcogenides and boron phosphide. Appl. Surf. Sci. 2019, 476, 70–75. [Google Scholar] [CrossRef]
  24. Deng, X.Z.; Zhao, Q.Q.; Zhao, Y.Q.; Cai, M.Q. Theoretical study on photoelectric properties of lead-free mixed inorganic perovskite RbGe1−xSnxI3. Curr. Appl. Phys. 2019, 19, 279–284. [Google Scholar] [CrossRef]
  25. Liechtenstein, A.I.; Zaanen, J. Density-functional theory and strong interactions: Orbital ordering in Mott-Hubbard insulators. Phys. Rev. B 1995, 52, R5467–R5470. [Google Scholar] [CrossRef] [PubMed] [Green Version]
  26. Kulik, H.J.; Cococcioni, M.; Scherlis, D.A.; Marzari, N. Density functional theory in transition-metal chemistry: A self-consistent Hubbard U approach. Phys. Rev. Lett. 2006, 97, 103001. [Google Scholar] [CrossRef] [PubMed] [Green Version]
  27. Wang, L.; Thomas, M.; Ceder, G. Oxidation energies of transition metal oxides within the GGA+U framework. Phys. Rev. B 2006, 73, 195107. [Google Scholar] [CrossRef] [Green Version]
  28. Zhang, Y.N.; Hu, J.; Law, M.; Wu, R.Q. Effect of surface stoichiometry on the band gap of the pyrite FeS2(100) surface. Phys. Rev. B 2012, 85, 085314. [Google Scholar] [CrossRef]
  29. Perdew, J.P.; Chevary, J.A.; Vosko, S.H.; Jackson, K.A.; Pederson, M.R.; Singh, D.J.; Fiolhais, C. Atoms, molecules, solids, and surfaces: Applications of the generalized gradient approximation for exchange and correlation. Phys. Rev. B 1992, 46, 6671–6687. [Google Scholar] [CrossRef]
  30. Sun, R.S.; Chan, M.K.Y.; Kang, S.Y.; Ceder, G. First-principles electronic structure and relative stability of pyrite and marcasite: Implications for photovoltaic performance. Phys. Rev. B 2011, 83, 235311. [Google Scholar] [CrossRef] [Green Version]
  31. Vanderbilt, D. Soft self-consistent pseudopotentials in a generalized eigenvalue formalism. Phys. Rev. B 1990, 4, 7892–7895. [Google Scholar] [CrossRef]
  32. Fiechter, S.; Birkholz, M.; Hartmann, A.; Dulski, P.; Giersig, M.; Tributsch, H.; Tilley, R.J.D. The microstructure and stoichiometry of pyrite FeS2x. J. Mater. Res. 1992, 7, 1829–1838. [Google Scholar] [CrossRef]
  33. Andersson, K.J.; Ogasawara, H.; Nordlund, D.; Brown, G.E.J.; Nilsson, A. Preparation, structure, and orientation of pyrite FeS2{100} surfaces: Anisotropy, sulfur monomers, dimer vacancies, and a possible FeS surface phase. J. Phys. Chem. C 2014, 118, 21896–21903. [Google Scholar] [CrossRef]
  34. Andersson, K.; Nyberg, M.; Ogasawara, H.; Nordlund, D.; Kendelewicz, T.; Doyle, C.S.; Brown, G.E., Jr.; Pettersson, L.G.M.; Nilsson, A. Experimental and theoretical characterization of the structure of defects at the pyrite FeS2(100) surface. Phys. Rev. B 2004, 70, 195404. [Google Scholar] [CrossRef]
  35. Luck, J.; Hartmann, A.; Fiechter, S. Stoichiometry and impurity concentration in synthetically grown iron pyrite crystals and their constituents. Fresenius’ Z. Anal. Chem. 1989, 334, 441–446. [Google Scholar] [CrossRef]
  36. Choi, S.G.; Hu, J.; Abdallah, L.S.; Limpinsel, M.; Zhang, Y.N.; Zollner, S.; Wu, R.Q.; Law, M. Pseudodielectric function and critical-point energies of iron pyrite. Phys. Rev. B 2012, 86, 115207. [Google Scholar] [CrossRef] [Green Version]
  37. Hu, J.; Zhang, Y.N.; Law, M.; Wu, R.Q. Increasing the band gap of iron pyrite by alloying with oxygen. J. Am. Chem. Soc. 2012, 134, 13216–13219. [Google Scholar] [CrossRef] [PubMed]
Figure 1. The structures of carbon-bearing pyrite and perfect pyrite: (a) Fe3S8C-1, (b) Fe4S7C-1, (c) Fe3S8C-2, (d) Fe4S7C-2, and (e) perfect Fe4S8.
Minerals 10 00815 g001
Figure 2. Supercell models with different carbon concentrations (The red circle indicates the location of the sulfur vacancy): (a) 2 × 2 × 2 supercell with concentration of 0.3%, 2 × 2 × 1 supercell with a concentration of (b) 0.6% and (c) 1.2%, and (d) unit cell with concentration of 2.4%.
Minerals 10 00815 g002
Figure 3. Density of states of pyrite with different forms of carbon occurrence and perfect pyrite: (a) Fe3S8C-1, (b) Fe4S7C-1, (c) Fe3S8C-2, (d) Fe4S7C-2, and (e) perfect Fe4S8.
Minerals 10 00815 g003
Figure 4. (a) The real and (b) imaginary parts, (c) the absorption coefficient, and (d) the reflectivity of the dielectric function as a function of the electric field.
Minerals 10 00815 g004aMinerals 10 00815 g004b
Figure 5. The band diagram of pyrite with different carbon doping concentration: (a) 0.3%, (b) 0.6%, (c) 1.2%, and (d) 2.4%.
Minerals 10 00815 g005
Figure 6. Total and partial density of states of different doping concentrations: (a) 0.3%, (b) 0.6%, (c) 1.2%, and (d) 2.4%.
Minerals 10 00815 g006
Figure 7. The optical properties of pyrite with different carbon doping concentrations: (a) real and (b) imaginary parts of dielectric function, (c) absorption coefficient, and (d) reflectivity.
Minerals 10 00815 g007
Figure 8. Different distribution models of carbon impurities with a doping concentration of 1.2% (The red circle indicates the location of the sulfur vacancy): (a) Fe8S15C, (b) Fe16S30C2-1, (c) Fe16S30C2-2, and (d) Fe16S30C2-3.
Minerals 10 00815 g008
Figure 9. Energy band diagram of pyrite with different carbon atom distribution at the same concentration: (a) Fe8S15C, (b) Fe16S30C2-1, (c) Fe16S30C2-2, and (d) Fe16S30C2-3.
Minerals 10 00815 g009aMinerals 10 00815 g009b
Figure 10. Total and partial density of states of pyrite at different doping positions at the same concentration: (a)Fe8S15C, (b) Fe16S30C2-1, (c) Fe16S30C2-2, and (d) Fe16S30C2-3.
Minerals 10 00815 g010
Figure 11. Optical properties of pyrite with different carbon impurity distributions at the same doping concentration: (a) real and (b) imaginary parts of the dielectric function, (c) light absorption coefficient, and (d) optical reflectivity.
Minerals 10 00815 g011
Table 1. Formation energies of different lattice defects in pyrite crystals.
Defect Formation   Energy   ( Δ E )   ( kJ   mol 1 )
Fe3S8C-13.83
Fe4S7C-10.24
Fe3S8C-23.32
Fe4S7C-20.25
Fe3S8869.36
Fe4S7282.19
Table 2. Cell parameters of perfect pyrite and pyrite with different defect types.
DefectCell Parameters
a (Å)b (Å)c (Å)α (°)β (°)γ (°)V (Å3)
Fe4S85.3631155.3631155.363115909090154.26
Fe3S8C-15.4237415.4236225.4223490.2193289.767489.78359159.50
Fe4S7C-15.3112655.3109375.31876889.7385789.2119590.01553150.02
Fe3S85.453025.4534995.45330489.5332189.5575190.5055162.15
Fe4S75.4516255.454595.45147591.8546191.8518291.87544161.85
Fe3S8C-25.3470745.5600315.46290884.7942190.2349790.06698161.74
Fe4S7C-25.3191185.3113585.31228690.0244989.7534889.19101150.06
Table 3. Bond lengths between carbon atoms and surrounding atoms in the pyrite unit cells under different carbon occurrences.
SpeciesBondLength (Å)
Fe3S8C-1C–S2.361
2.361
2.359
C–Fe3.827
Fe3S8C-2C–S1.777
1.778
1.779
C–Fe3.532
Fe4S7C-1C–S1.831
C–Fe2.166
2.059
Fe4S7C-2C–S2.971
C–Fe1.943
1.958
Table 4. Band gap of pure pyrite and pyrite with various defects.
DefectBand Gap (eV)
Fe4S81.156
Fe3S8C-10.119
Fe4S7C-10.068
Fe3S8C-20.018
Fe4S7C-20.175

