Article

Infrared and Raman Spectroscopy of Ammoniovoltaite, (NH4)2Fe2+5Fe3+3Al(SO4)12(H2O)18

by
Anastasia V. Sergeeva
1,
Elena S. Zhitova
1,*,
Anton A. Nuzhdaev
1,
Andrey A. Zolotarev
2,
Vladimir N. Bocharov
3 and
Rezeda M. Ismagilova
1,2
1
Institute of volcanology and seismology FEB RAS, 9 Piip Boulevard, 683006 Petropavlovsk-Kamchatsky, Russia
2
Institute of Earth Sciences, St. Petersburg State University, 199034 St. Petersburg, Russia
3
Geo Environmental Centre “Geomodel”, St. Petersburg State University, 198504 St. Petersburg, Russia
*
Author to whom correspondence should be addressed.
Minerals 2020, 10(9), 781; https://doi.org/10.3390/min10090781
Submission received: 31 July 2020 / Revised: 1 September 2020 / Accepted: 2 September 2020 / Published: 3 September 2020
(This article belongs to the Special Issue Vibrational (Infrared and Raman) Spectroscopy of Minerals)

Abstract

:
Ammoniovoltaite, (NH4)2Fe2+5Fe3+3Al(SO4)12(H2O)18, is a complex hydrated sulphate of the voltaite group that has been recently discovered on the surface of the Severo-Kambalny geothermal field (Kamchatka, Russia). Vibrational spectroscopy has been applied for characterization of the mineral. Both infrared and Raman spectra of ammoniovoltaite are characterized by an abundance of bands, which corresponds to the diversity of structural fragments and variations of their local symmetry. The infrared spectrum of ammoniovoltaite is similar to that of other voltaite-related compounds. The specific feature related to the dominance of the NH4 group is its ν4 mode observed at 1432 cm−1 with a shoulder at 1510 cm−1 appearing due to NH4 disorder. The Raman spectrum of ammoniovoltaite is basically different from that of voltaite by the appearance of an intensive band centered at 3194 cm−1 and attributed to the ν3 mode of NH4. The latter can serve as a distinctive feature of ammonium in voltaite-group minerals in resemblance to recently reported results for another NH4-mineral—tschermigite, where ν3 of NH4 occurs at 3163 cm−1. The values calculated from wavenumbers of infrared bands at 3585 cm−1, 3467 cm−1 and 3400 cm−1 for hydrogen bond distances: d(O···H) and d(O···O) correspond to bonding involving H1 and H2 atoms of Fe2+X6 (X = O, OH) octahedra. The infrared bands observed at 3242 cm−1 and 2483 cm−1 are due to stronger hydrogen bonding, that may refer to non-localized H atoms of Al(H2O)6 or NH4.

1. Introduction

Ammoniovoltaite, (NH4)2Fe2+5Fe3+3Al(SO4)12(H2O)18, is the voltaite-group mineral that was recently discovered at the surface of Severo-Kambalny geothermal field (southern Kamchatka, Russia) [1]. To date the mineral has only been confirmed in this one locality. However, the synthetic analogue of ammoniovoltaite was known prior to its discovery in nature [2,3]. Voltaite-group minerals form in volcanic fumaroles: ammoniovoltaite [1], voltaite [4,5] or as oxidation (alteration) product of pyrite, marcasite or both, especially in arid conditions or as a post-mining product: ammoniomagnesiovoltaite [6], magnesiovoltaite [7], zincovoltaite [8], pertlikite [9] and voltaite. The source of ammonium in voltaite-group minerals may be from the NH4-rich fluid in specific geothermal systems (as in case of ammoniovoltaite) or from organic matter, namely, coal (as for ammoniomagnesiovoltaite); the source of Fe and S is typically from decomposition of sulfides under oxidizing conditions.
The mineralogy of fumaroles is in close relation to technogenic/natural phase formation at burning coal dumps under so-called “pseudofumarolic” conditions, for example, at the Chelyabinsk coal basin (Chelyabinsk, Russia) [10,11]. It is worth noting that numerous technogenic mineral-like phases representing Fe-Al sulphates have been identified at burning coal dumps [12]. Thus, the current study is not only providing new knowledge about natural ammonium Fe-Al sulfate systems, and their spectroscopic features, but also makes it possible to draw parallels with similar phases formed in technogenic conditions, including phases from burned coal dumps.
Recently, vibrational spectroscopy of hydrated sulphates attracted considerable attention since some of them have been identified on other bodies of the Solar System. Many sulphate findings are described for Mars including such minerals as jarosite, KFe3(SO4)2(OH)6; alunite, KAl3(SO4)2(OH)6; phase Fe3+SO4(OH); kieserite, MgSO4⋅H2O; gypsum, CaSO4⋅2H2O and other polyhydrated sulfates [13,14,15]. In addition to this, hydrated sulphate salts have been proposed as a component covering the surface of Europa (Jupiter moon) by reflectance spectroscopy [16]. Originally authors suggested hydrated magnesium sulfates and sodium carbonates and their mixtures as major components of the surface minerals [16]. Later, the similar mineral composition was proposed for Ganymede’s surface (Jupiter moon) [17]. Laboratory study has shown that heavily hydrated MgSO4 and perhaps Na2SO4 are strongly suggested as candidates for Europa surface products [18]. Later study have shown that the circle of heavily hydrated sulphates of Mg and Na can be widened to include hexahydrite, MgSO4⋅6H2O; epsomite, MgSO4⋅7H2O; bloedite, Na2Mg(SO4)2⋅4H2O; mirabilite, Na2SO4⋅10H2O; sodium sulfide nonahydrate, Na2S⋅9H2O; supersaturated MgSO4, NaHCO3, and Na2SO4 brines; and magnesium sulfate dodecahydrate, MgSO4⋅12H2O [19]. Apart from that, ammonium salts are considered as a reservoir of nitrogen in a cometary nucleus and possibly on some asteroids [20].
It is noteworthy that acid mine drainage (AMD) sites covered by efflorescent minerals (usually sulphates) formed as the result of element leaching and oxidation of primary minerals are considered as proxy for the Martian environment [21,22]. These efflorescent minerals and their mixtures are widely investigated by means of vibrational spectroscopy. At the same time, some natural geothermal fields (including the Severo-Kambalny geothermal field in southern Kamchatka, Russia) are also characterized by the circulation of acidic hydrothermal fluid resulting in a similar environment to AMD sites’ sets of efflorescent minerals among which ammoniovoltaite has been detected. However, the geochemistry of geothermal field may be more complex in comparison to AMD sites due to fluid/gas enrichment or depletion in certain chemical elements and elevated temperatures.
Vibrational spectroscopy is an important tool for the study of minerals using non-destructive methods [23,24,25,26]. Taking into account the process of miniaturization of Raman spectrometers, the Raman spectroscopy can be considered as very promising for in situ mineral identifications in different Earth environments and for planetary sciences [27,28]. ExoMars rover’s analytical laboratory drawer planned to equip the Raman spectrometer for rapid mineral identification [22,29]. The introduction of this method requires the accumulation of data on the detailed characteristics of the vibrational spectra of minerals, especially of those having complex chemical composition. The present study is devoted to the characterization of the complex hydrated sulphate mineral—ammoniovoltaite—by the infrared and Raman spectroscopy. The infrared spectra of ammoniovoltaite or its synthetic analogue has been reported previously [1,3], however, the Raman spectra has not yet been published.

2. Materials and Methods

The Raman and infrared spectra have been recorded from part of the holotype specimen of ammoniovoltaite originating from the Severo-Kambalny geothermal field (Southern Kamchatka, Russia) and deposited in the Elena S. Zhitova collection. The sample has been characterized in detail including its crystal structure and chemistry [1]. The empirical chemical formula is ((NH4)1.88K0.08Ca0.04)(Fe2+3.74Mg1.17Fe3+0.05Zn0.01)(Fe3+2.89Al0.09)Al1.00(SO4)12.00(H2O)18.00, the simplified chemical formula is (NH4)2Fe2+5Fe3+3Al(SO4)12(H2O)18. The mineral is cubic, Fd-3c, a = 27.322(1) Å and V = 20,396(3) Å3, Z = 16 [1].
Infrared (IR) spectra were obtained using the KBr pellet method and a Bruker Vertex 70 FTIR spectrometer at room temperature in the 4000 cm−1 to 400 cm−1 range of wavenumbers and 4 cm−1 resolution.
The Raman spectra were obtained with a spectrometer Horiba Jobin-Yvon LabRam HR 800 in the range of 4000 cm−1 to 70 cm−1 and the 2 cm−1 to 3 cm−1 resolution. The excitation source was an Ar+ laser with a wavelength of 514 nm and a maximum power of 50 mW, the power at the sample ~8 mW. The spectra were recorded at a room temperature.
Band component analysis was undertaken using the OriginPro 7.0 software package that enabled the type of fitting function to be selected and allows specific parameters to be fixed or varied accordingly. Band fitting was done using Gaussian function. The positions of the bands and their variance were refined by the steepest descent method, by minimizing the sum of the squares of the deviations of the experimental curve and the theoretical one (the sum of Gaussians), using the algorithms implemented in the OriginPro 7.0 program.

3. Theoretical Background

3.1. Crystal Structure

All voltaite-group minerals are cubic and crystallize in Fd-3c space group [3] with the exception of pertlikite [9] that is tetragonal, space group I41/acd. The crystal structures of voltaite-type minerals (Figure 1a) consists of 3D polymerized kröhnkite-type chains composed of corner-shared iron-centered octahedra with sulphate tetrahedra (Figure 1b) where Fe2+X6 (X = O, OH) and Fe3+O6 octahedra are alternating in the chain. The Al(H2O)6 complexes and ammonium ions are located in cavities (Figure 1b).

3.2. Local Symmetry; Infrared and Raman Band Activiation

The sites, their occupancy and symmetry in the crystal structure of ammoniovoltaite are given in Table 1. The crystal structure of ammoniovoltaite can be considered as consisting of the following fragments for interpretation of vibrational spectra: NH4, FeX6, FeO6, Al(H2O)6 and SO4 (Table 1). Table 1 also shows the symmetry transformations of the infrared and Raman vibrations of structural fragments in accordance with the local symmetry and lattice symmetry.
It is worth noting that ammonium cation represents tetrahedra with symmetry Td, whereas site symmetry of the N atom (in NH4 group) in the ammoniovoltaite crystal structure is lower, D3. This mismatch of the symmetry of the cation and its environment results in the disorder of the NH4 group in ammoniovoltaite. To the best of our knowledge, no information on the character of this disorder (dynamic or statistic) is available. The same situation may be characteristic for other ions having their own symmetry, for example, hydroxonium, H3O, as observed for hydroniumjarosite and hydronium-bearing jarosites [30,31].

4. Results

The IR and Raman spectra of ammoniovoltaite are given in Figure 2; the details of the spectra regions 4000 cm−1 to 2000 cm−1, 2000 cm−1 to 800 cm−1 and 800 cm−1 to 400/70 cm−1 (400 cm−1—infrared, 70 cm−1—Raman) are given in Figure 3, Figure 4 and Figure 5. In general, both infrared and Raman spectra of ammoniovoltaite are characterized by an abundance of bands (Figure 2), which corresponds to the diversity of structural fragments and variations of their local symmetry. Table 2 lists the infrared and Raman bands with their assignment.

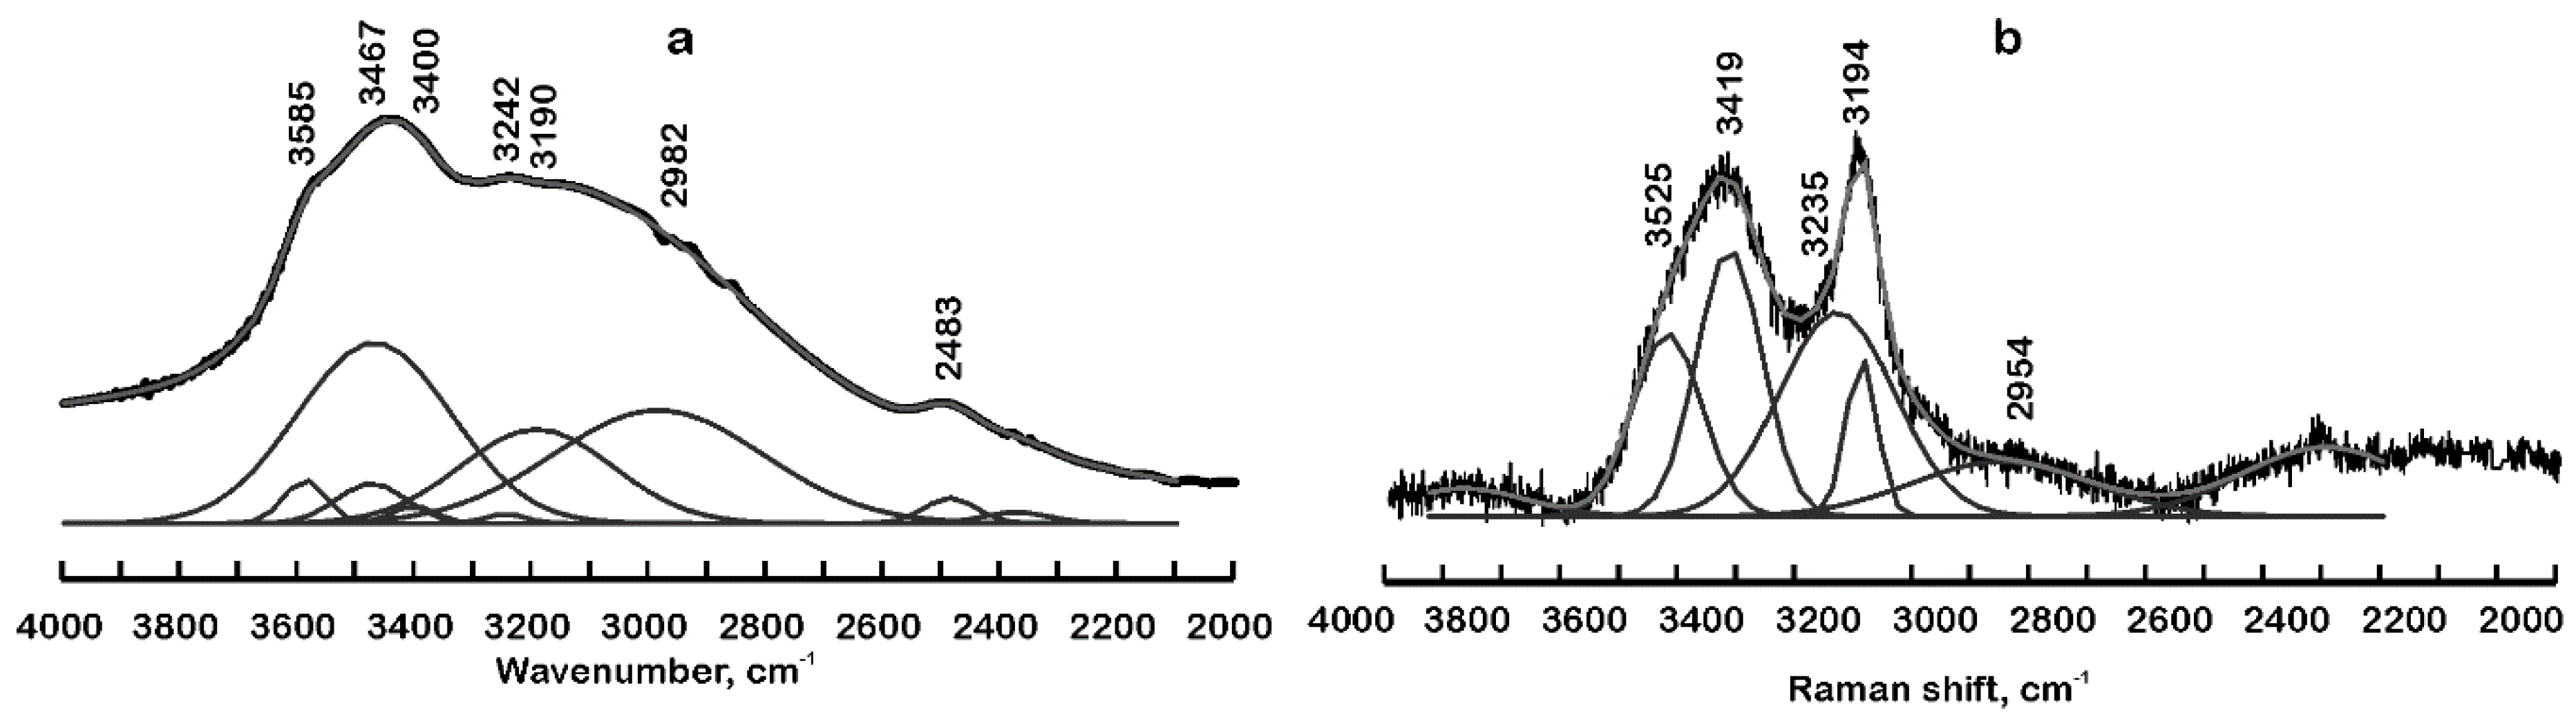
4.1. Infrared and Raman Spectra in the Region 4000 cm−1 to 2000 cm−1

4.1.1. Band Assignment

The Raman and infrared spectra of the 4000 cm−1 to 2000 cm−1 region is shown in Figure 3. This region includes the vibrational spectrum of the stretching vibrations of hydroxyl, water and ammonium units. It is also worth noting that two types of water are present in ammoniovoltaite: hydroxyl group coordinated to Fe2+ and water molecules coordinated to Al3+. The IR spectrum contains the following bands 3585 cm−1, 3467 cm−1 with a shoulder ~3400 cm−1, 3242 cm−1, 3190 cm−1, 2982 cm−1, 2483 cm−1. The Raman spectrum contains the following bands 3525 cm−1, 3419 cm−1, 3235 cm−1, 3194 cm−1 and 2954 cm−1.
The shoulder observed at 3585 cm−1 (IR spectrum) and 3525 cm−1 (Raman spectrum) is assigned to the symmetric stretching mode of the hydroxyl units (Al–OH), (Fe–OH) and ν3 vibration of (H2O) fragments. The stretching vibrations of water molecules occur at lower wavenumbers than that of the hydroxyl unit. The ν1 vibration of (H2O) is found at 3467 cm−1 with a shoulder ~3400 cm−1 at the IR spectrum and at 3419 cm−1 at the Raman spectrum. The overlapping modes of ν3 (NH4), ν3 (H2O) and 2ν2 (H2O) occur at 3242 cm−1 and 3235 cm−1 in the IR and Raman spectrum, respectively. The details of OH and HOH modes are shown in Table 3.
The modes of ammonium ion are registered at (a) 3190 cm−1 (IR spectrum) and 3194 cm−1 (Raman spectrum) assigned to ν3 (NH4) vibration and at (b) 2982 cm−1 (IR spectrum) and 2954 cm−1 (Raman spectrum) that refers to completely symmetric vibration ν1 (NH4) (Figure 3). The band at 2483 cm−1 corresponds to the vibrations of ν3 (Al–H2O) (see Table 3) and ν (HSO4); the hydrosulfate in the structure appears as a result of the equilibrium Me–H2O + SO4 = Me–OH + HSO4 (where Me—metal).

4.1.2. Hydrogen Bonding

Previous studies of natural [1] and synthetic [3] ammoniovoltaite included structure determination and refinement based on single-crystal X-ray diffraction data with localization of H1 and H2 hydrogen atoms that belong to Fe2+X6 (X = O, OH) octahedra. The hydrogen atoms that belong to Al(H2O)6 octahedra or NH4 group have not been localized previously due to significant disorder of both units. The study of Libowitzky [32] has shown that correlation between OH stretching frequencies and both the O· ·O and the H· ·O bond distances exists.
The d(O···H) distances calculated from the position of bands at 3585 cm−1, 3467 cm−1 and 3400 cm−1 range from 1.99 Å to 2.25 Å, while d(O···O) distances are within 2.83 Å to 3.24 Å range. The calculated values from infrared spectra d(O···H) and d(O···O) distances agree well with those derived from structure refinement [1] for H1 and H2 atoms: d(O2-H1) is 2.22 Å; d(O2-O5w) is 2.95 Å and d(O3-H2) is 1.99 Å; d(O3-O5w) is 2.94 Å (Figure 4). The infrared bands observed at 3242 cm−1 and 2483 cm−1 correspond to stronger bonding, the calculated values are d(O···H) = 1.87 Å; d(O···O) = 2.72 Å and d(O···H) 1.59 Å, d(O···O) = 2.53 Å (Table 4). This stronger bonding may refer to H atoms of Al(H2O)6 octahedra or NH4 tetrahedra that have not been localized in the previous studies.

4.2. Infrared and Raman Spectra in the Region 2000 cm−1 to 800 cm−1

The 2000 cm−1 to 800 cm−1 region of Raman and infrared spectra is shown in Figure 5. The water bending mode is registered at the IR spectrum at 1637 cm−1. The ammonium modes are evident at the IR spectrum: ν2 (NH4) at 1694 cm−1 and ν4 (NH4) at 1510 cm−1 and 1432 cm−1; the ammonium bands at 1544 cm−1 and 1453 cm−1 are hardly visible at the Raman spectrum. The weak shoulder at the IR spectrum at about 1337 cm−1 is likely due to overtones of 2ν4 (SO4) and 2ν3 (AlO6).
The most intense bands in the region 2000 cm−1 to 800 cm−1 at both IR and Raman spectra correspond to sulphate modes. The Raman 1207 cm−1 and 1149 cm−1 and infrared 1166 cm−1 and 1121 cm−1 bands correspond to ν3 (SO4) vibrations. The bands assigned to ν1 (SO4) vibration are found at 1032 cm−1, 1005 cm−1 and 986 cm−1 in the Raman spectrum and at 1059 cm−1, 1004 cm−1 and 985 cm−1 in the IR spectrum. The weak shoulder in the IR spectrum at 875 cm−1 corresponds to the Fe2+–OH fragment.

4.3. Infrared and Raman Spectra in the Region 800 cm−1 to 400(70) cm−1

The 800 cm−1 to 70 cm−1 and 800 cm−1 to 400 cm−1 regions of Raman and infrared spectra, respectively, are shown in Figure 6. The infrared bands at 740 cm−1 and 725 cm−1 correspond to librational vibrations of water coordinated to Al. Hydroxyl groups in the crystal structure of ammoniovoltaite appear as a result of dynamic equilibrium: Me–H2O + SO4 = Me–OH + HSO4, which is the sum of two processes, acid dissociation of aquacomplexes and protonation of the sulfate ion.
The infrared bands observed at 661 cm−1, 625 cm−1 and 591 cm−1 and Raman bands at 659 cm−1, 625 cm−1 and 589 cm−1 are due to the overlap of ν4 (SO4), ν3 (AlO6) and ν3 (FeO6). Theoretically, the ν3 (AlO6) vibration has one active component in both IR and Raman spectra (Figure 6). Most likely, this vibration overlaps with ν4 (SO4) vibration and is found at 591 cm−1 (IR spectrum) and 589 cm−1 (Raman spectrum). The bands 481 cm−1, 450 cm−1 and 437 cm−1 in the IR spectrum and 463 cm−1, 452 cm−1 and 432 cm−1 in the Raman spectrum correspond to overlaps ν2 (SO4), ν3 (AlO6) and ν3 (FeO6).
The frequencies of lattice modes: librational (incomplete turns) and translational vibrations of sulfate, ammonium and metal-oxygen octahedra are located below 400 cm−1 in the Raman spectrum. In addition, valence and deformation vibrations are located here for metal-oxygen octahedra. The 394 cm−1 band corresponds to ν2 (SO4), ν3 (AlO6), ν3 (FeO6) vibrations. The lattice modes assigned to vibrations of (MeO6), (SO4), (NH4) units are reflected by the following Raman bands: 335 cm−1, 266 cm−1, 182 cm−1 and 92 cm−1.

5. Discussion

5.1. Infrared Spectroscopy of Voltaites

The infrared spectrum of ammoniovoltaite obtained in this work is compared to that of ammoniomagnesiovoltaite, (NH4)2Mg2+5Fe3+3Al(SO4)12(H2O)18, [6] and synthetic voltaite members [3]: ammoniovoltaite, voltaite, K2Fe2+5Fe3+3Al(SO4)12(H2O)18; ammoniomagnesiovoltaite and Mn-voltaite, K2Mn2+5Fe3+3Al(SO4)12(H2O)18 (Table 5). The position of bands in the 3500 cm−1 to 3000 cm−1 region differs for voltaites. This is probably due to difference in the cation composition (compared samples differ in the composition of divalent cation) affecting the hydrogen bonding system. The presence of ammonium likely also affects the spectra shape in the region 3300 cm−1 to 2900 cm−1, but this change is almost imperceptible since there is a stronger change related to modes of water and hydroxyl. In general, the bands at 3600 cm−1 to 3000 cm−1 are due to various O–H and N–H stretching vibrations.
The band assigned to Al–H2O, hydrosulphate or both as a result of dynamic equilibrium: Me–H2O + SO4 = Me–OH + HSO4 mode is weak, but distinctive at all spectra at 2501 cm−1 to 2483 cm−1. The H–O–H bending in the H2O molecules is evident by two bands at 1641 cm−1 to 1630 cm−1 and 1694 cm−1 to 1686 cm−1. As noted previously [3] the distinctive infrared band of ammonium occurs at 1432 cm−1 to 1431 cm−1 due to the asymmetric bending vibrations of NH4. In samples studied by us, this band has a shoulder ~1510 cm−1 that we attribute to ammonium disorder.
In the region 1200 cm−1 to 980 cm−1 sulphate vibrations occur: ν3 at 1130 cm−1 to 1121 cm−1 and 1182 cm−1 to 1143 cm−1, while ν1 at 1065 cm−1 to 1053 cm−1, 1014 cm−1 to 1004 cm−1 and 985 cm−1. The M2+–OH mode is present at 879 cm−1 to 854 cm−1. The position of the band depends on the cation: for samples with Fe2+ (ammoniovoltaite, voltaite) it is observed at 879 cm−1 to 875 cm−1; for Mg- and Mn-dominated samples the band occurs at lower wavenumbers: 866 cm−1 and 854 cm−1, respectively. The band centered at 735 cm−1 to 725 cm−1 in voltaites is assigned to Al–H2O mode. In the region below 700 cm−1 the most intensive bands are found at 634 cm−1 to 625 cm−1, 596 cm−1 to 591 cm−1 and 445 cm−1 to 437 cm−1 (with lower intensity shoulders listed in Table 5) and are assigned to complex vibration of the sulphate group and metal-oxygen octahedra.

5.2. Raman Spectroscopy of Voltaites

The Raman spectrum of ammoniovoltaite obtained in this work is compared to very recently published spectra of voltaite [34] and tschermigite, (NH4)Al(SO4)2·12H2O, the latter is an ammonium alum [35], but it is chemically related to voltaites since it is hydrated ammonium sulphate (Table 6). The Raman spectrum of voltaite from Iron Mountain Mine Superfund Site (Redding, CA, USA) has also been reported previously [22]; however, in the cited work, the inverse problem of identifying minerals by spectra without their detailed chemical characteristics is solved. Therefore, these data are not used for comparison.
The main difference between Raman spectra of ammoniovoltaite and voltaite [34] is in the shape of the 3400 cm−1 to 2800 cm−1 region. The spectra of ammoniovoltaite has a very intensive and distinctive band centered at 3194 cm−1, although the spectrum of voltaite has a band with similar Raman shift, 3209 cm−1, the shape of the spectra in this region is evidently different. It should be noted that Raman spectrum of tschermigite [35] contains the bands at 3163 cm−1 and 3124 cm−1 that were absent in the spectrum of its K-analogue and thus assigned to ν3 (NH4). On that basis, we assign the bands in the Raman spectrum of ammoniovoltaite as the following (Table 6): 3525 cm−1 and 3419 cm−1 to O–H stretching, 3235 cm−1 to overlap of O–H and N–H stretching and 3194 cm−1 exclusively to N–H stretching. The very weak bands at 1544 cm−1 and 1453 cm−1 refer to ν4 of NH4, the band splitting is due to NH4 disorder similar to that observed for the infrared spectrum. Sulphate vibrations are manifested in the 1210 cm−1 to 980 cm−1 region: ν3 mode at 1207 cm–1 and 1143 cm−1, while ν1 mode at 1032 cm−1, 1005 cm−1 and 986 cm−1. In the region below 980 cm−1 and above 300 cm−1 the complex overlapping vibrations of different modes of SO4 tetrahedra and metal-oxygen octahedra are detected. The bands below 300 cm−1 are assigned to lattice modes involving MeO6 octahedra, SO4 and NH4 tetrahedra.

6. Conclusions

1. The infrared spectrum in the region 4000 cm−1 to 2500 cm−1 contains bands centered at 3585 cm−1, 3467 cm−1, 3400 cm−1, 3242 cm−1, 3190 cm−1 and 2982 cm−1. Among them, the bands at 3585 cm−1, 3467 cm−1 and 3400 cm−1 are assigned solely to O–H vibrations. The band at 3242 cm−1 is an overlap of O–H and N–H vibrations. The N–H vibrations are reflected by bands at 3190 cm−1 and 2982 cm−1.
2. The Raman spectrum of the same area is similar to that of infrared spectrum and contains bands at 3525 cm−1 and 3419 cm−1 assigned to O–H vibrations; the band at 3235 cm−1 that is due to an overlap of O–H and N–H vibrations and two bands at 3194 cm−1 and 2954 cm−1 are attributed to N–H vibrations.
3. The calculated values from the wavenumbers of infrared bands at 3585 cm−1, 3467 cm−1 and 3400 cm−1 hydrogen bond distances: d(O···H) and d(O···O) correspond to bonding involving H1 and H2 atoms of Fe2+X6 (X = O, OH) octahedra. The infrared bands observed at 3242 cm−1 and 2483 cm−1 are due to stronger hydrogen bonding, that may refer to non-localized H atoms of Al(H2O)6 or NH4.
4. The middle region of the infrared spectrum contains bands at 2483 cm−1, 1694 cm−1, 1637 cm−1, 1510sh cm−1, 1432 cm−1, 1337sh cm−1, 1166 cm−1, 1121 cm−1, 1059 cm−1, 1004 cm−1, 985sh cm−1 and 875sh cm−1. The band at 2483 cm−1 is due to O–H stretching in Al(H2O)6 octahedra or HSO4 complex, the latter appearing as a result of the equilibrium Me–H2O + SO4 = Me–OH + HSO4. The band at 1694 cm−1 represents an overlap of N–H and O–H bending vibrations. The band at 1637 cm−1 is due to O–H bending vibrations, whereas solely N–H bending vibrations occur at 1432 cm−1 (as a distinctive spectral feature) with a shoulder at 1510 cm−1 appearing due to ammonium disorder. The band at 1337sh cm−1 is a complex overlap of sulphate, AlO6 and water vibrations. The bands at 1166 cm−1, 1121 cm−1, 1059 cm−1, 1004 cm−1 and 985sh cm−1 are assigned to vibrations of the sulphate group. The bands at 875sh cm−1, 740sh cm−1 and 725 cm−1 are assigned to the water librational modes.
5. The N–H bending vibrations are evident as very weak Raman bands centered at 1544 cm−1 and 1453 cm−1. The sulphate vibrations in the Raman spectrum are detected at 1207 cm−1, 1149 cm−1, 1032 cm−1, 1005 cm−1 and 986 cm−1.
6. The low wavenumber region of the infrared spectrum of ammoniovoltaite is represented by the overlap of sulphate and MeO6 vibrations found at 661sh cm−1, 625 cm−1, 591 cm−1, 481 cm−1, 450 cm−1 and 437 cm−1.
7. The Raman bands observed at 659 cm−1, 625 cm−1, 589 cm−1, 463 cm−1, 452 cm−1, 432 cm−1 and 394 cm−1 are due to complex overlaps of vibrations originated from SO4, AlO6 and FeO6 structural fragments. The low wavenumber Raman bands occur at 335 cm−1, 266 cm−1, 182 cm−1 and 92 cm−1 and correspond to lattice modes: MeO6, SO4 and NH4.

Author Contributions

Conceptualization, A.V.S. and E.S.Z.; methodology, E.S.Z., V.N.B. and R.M.I.; validation, A.V.S., E.S.Z., A.A.N. and R.M.I.; formal analysis, E.S.Z., V.N.B. and R.M.I.; investigation, A.V.S., E.S.Z., A.A.N., A.A.Z., R.M.I. and V.N.B.; data curation, A.V.S., E.S.Z. and A.A.Z.; writing—original draft preparation, A.V.S. and E.S.Z.; writing—review and editing, A.V.S., E.S.Z., A.A.N., A.A.Z., R.M.I. and V.N.B.; visualization, A.V.S. and E.S.Z.; supervision, A.A.Z.; project administration, E.S.Z.; funding acquisition, E.S.Z. All authors have read and agreed to the published version of the manuscript.

Funding

This research was funded by the President Federation Grant for Young Candidates of Sciences (ESZ, AAN, RMI) project No. MK-3246.2019.5 and by the Russian Foundation for Basic Research (AAZ), project No. 19-05-00628.

Acknowledgments

The Raman and infrared spectra of ammoniovoltaite were recorded at Geomodel and XRD Resource Center of SPBU, respectively.

Conflicts of Interest

The authors declare no conflict of interest.

References

  1. Zhitova, E.S.; Siidra, O.I.; Belakovsky, D.I.; Shilovskikh, V.V.; Nuzhdaev, A.A.; Ismagilova, R.M. Ammoniovoltaite, (NH4)2Fe2+5Fe3+3Al(SO4)12(H2O)18, a new mineral from the Severo-Kambalny geothermal field, Kamchatka, Russia. Mineral. Mag. 2018, 82, 1057–1077. [Google Scholar] [CrossRef]
  2. Sajó, I.E. Characterization of synthetic voltaite analogues. Eur. Chem. Bull. 2012, 1, 35–36. [Google Scholar]
  3. Majzlan, J.; Schlicht, H.; Wierzbicka-Wieczorek, M.; Giester, G.; Pöllmann, H.; Brömme, B.; Doyle, S.; Buth, G.; Koch, C.B. A contribution to the crystal chemistry of the voltaite group: Solid solutions, Mössbauer and infrared spectra, and anomalous anisotropy. Mineral. Petrol. 2013, 107, 221–233. [Google Scholar] [CrossRef]
  4. Breislak, S. Sulfate d’Alumine & de Fer. In Essais Mineralogiques sur la Solfatare de Pouzzole; Chez Janvier Giaccio: Naples, Italy, 1792; pp. 148–158. [Google Scholar]
  5. Ciesielczuk, J.; Żaba, J.; Bzowska, G.; Gaidzik, K.; Głogowska, M. Sulphate efflorescences at the geyser near Pinchollo, southern Peru. J. S. Am. Earth Sci. 2013, 42, 186–193. [Google Scholar] [CrossRef]
  6. Szakáll, S.; Sajó, I.; Fehér, B.; Bigi, S. Ammoniomagnesiovoltaite, a new voltaite-related mineral species from Pécs-Vasas, Hungary. Can. Mineral. 2012, 50, 65–72. [Google Scholar] [CrossRef]
  7. Chukanov, N.V.; Aksenov, S.M.; Rastsvetaeva, R.K.; Möhn, G.; Rusakov, V.S.; Pekov, I.V.; Scholz, R.; Eremina, T.A.; Belakovskiy, D.I.; Lorenz, J.A. Magnesiovoltaite, K2Mg5Fe3+3Al(SO4)12·18H2O, a new mineral from the Alcaparrosa mine, Antofagasta region, Chile. Eur. J. Mineral. 2016, 28, 1005–1017. [Google Scholar] [CrossRef]
  8. Li, W.; Chen, G.; Sun, S. Zincovoltaite—A new sulfate mineral. Acta Mineral. Sinica 1987, 4, 307–312, (In Chinese with English abstract). [Google Scholar]
  9. Ertl, A.; Dyar, M.D.; Hughes, J.M.; Brandstätter, F.; Gunter, M.E.; Prem, M.; Peterson, R.C. Pertlikite, a new tetragonal Mg-rich member of the voltaite group from Madeni Zakh, Iran. Can. Mineral. 2008, 46, 661–669. [Google Scholar] [CrossRef]
  10. Zolotarev, A.A.; Krivovichev, S.V.; Panikorovskii, T.L.; Gurzhiy, V.V.; Bocharov, V.N.; Rassomakhin, M.A. Dmisteinbergite, CaAl2Si2O8, a Metastable Polymorph of Anorthite: Crystal-Structure and Raman Spectroscopic Study of the Holotype Specimen. Minerals 2019, 9, 570. [Google Scholar] [CrossRef] [Green Version]
  11. Zolotarev, A.A.; Zhitova, E.S.; Krzhizhanovskaya, M.G.; Rassomakhin, M.A.; Shilovskikh, V.V.; Krivovichev, S.V. Crystal chemistry and high-temperature behaviour of ammonium phases NH4MgCl3·6H2O and (NH4)2Fe3+Cl5·H2O from the burned dumps of the Chelyabinsk coal basin. Minerals 2019, 9, 486. [Google Scholar] [CrossRef] [Green Version]
  12. Chesnokov, B.V.; Shcherbakova, E.P.; Nishanbaev, T.P. Minerals of Burnt Dumps of the Chelyabinsk Coal Basin; Ural branch of RAS: Miass, Russia, 2008; pp. 1–139. (In Russian) [Google Scholar]
  13. Gendrin, A.; Mangold, N.; Bibring, J.P.; Langevin, Y.; Gondet, B.; Poulet, F.; Bonello, G.; Quantin, C.; Mustard, J.; Arvidson, R.; et al. Sulfates in Martian layered terrains: The OMEGA/Mars express view. Science 2005, 307, 1587–1591. [Google Scholar] [CrossRef] [Green Version]
  14. Carter, J.; Poulet, F.; Bibring, J.P.; Mangold, N.; Murchie, S. Hydrous minerals on Mars as seen by the CRISM and OMEGA imaging spectrometers: Updated global view. J. Geophys. Res. Planets 2013, 118, 831–858. [Google Scholar] [CrossRef]
  15. Ehlmann, B.L.; Edwards, C.S. Mineralogy of the Martian Surface. Annu. Rev. Earth Planet. Sci. 2014, 42, 291–315. [Google Scholar] [CrossRef] [Green Version]
  16. McCord, T.B.; Hansen, G.B.; Fanale, F.P.; Carlson, R.W.; Matson, D.L.; Johnson, T.V.; Smythe, W.D.; Crowley, J.K.; Martin, P.D.; Ocampo, A.; et al. Salts on Europa’s surface detected by Galileo’s near infrared mapping spectrometer. Science 1998, 280, 1242–1245. [Google Scholar] [CrossRef] [PubMed]
  17. McCord, T.B.; Hansen, G.B.; Hibbitts, C.A. Hydrated salt minerals on Ganymede’s surface: Evidence of an ocean below. Science 2001, 292, 1523–1525. [Google Scholar] [CrossRef] [PubMed]
  18. Mccord, T.B.; Teeter, G.; Hansen, G.B.; Sieger, M.T.; Orlando, T.M. Brines exposed to Europa surface conditions. J. Geophys. Res. Planets 2002, 107, 4-1. [Google Scholar] [CrossRef]
  19. Dalton, J.B.; Prieto-Ballesteros, O.; Kargel, J.S.; Jamieson, C.S.; Jolivet, J.; Quinn, R. Spectral comparison of heavily hydrated salts with disrupted terrains on Europa. Icarus 2005, 177, 472–490. [Google Scholar] [CrossRef]
  20. Poch, O.; Istiqomah, I.; Quirico, E.; Beck, P.; Schmitt, B.; Theulé, P.; Faure, A.; Hily-Blant, P.; Bonal, L.; Raponi, A.; et al. Ammonium salts are a reservoir of nitrogen on a cometary nucleus and possibly on some asteroids. Science 2020, 367, 7462. [Google Scholar] [CrossRef]
  21. Amils, R.; Fernández-Remolar, D.; IPBSL Team. Río Tinto: A Geochemical and Mineralogical Terrestrial Analogue of Mars. Life 2014, 4, 511–534. [Google Scholar] [CrossRef]
  22. Sobron, P.; Alpers, C.N. Raman spectroscopy of efflorescent sulfate salts from iron mountain mine superfund site, California. Astrobiol. 2013, 13, 270–278. [Google Scholar] [CrossRef] [Green Version]
  23. Makreski, P.; Jovanovski, G.; Dimitrovska, S. Minerals from Macedonia: XIV Identification of some sulfate minerals by vibrational (infrared and Raman) spectroscopy. Vib. Spectrosc. 2005, 39, 229–239. [Google Scholar] [CrossRef]
  24. Košek, F.; Culka, A.; Jehlička, J. Raman spectroscopic study of six synthetic anhydrous sulfates relevant to the mineralogy of fumaroles. J. Raman Spectrosc. 2018, 49, 1205–1216. [Google Scholar] [CrossRef]
  25. Žáček, V.; Škoda, R.; Laufek, F.; Kosek, F.; Jehlička, J. Complementing knowledge about rare sulphates lonecreekite, NH4Fe3+(SO4)2·12H2O and sabieite, NH4Fe3+(SO4)2: Chemical composition, XRD and RAMAN spectroscopy (Libušín near Kladno, the Czech Republic). J. Geosci. 2019, 64, 149–159. [Google Scholar] [CrossRef]
  26. Rull, F.; Guerrero, J.; Venegas, G.; Gázquez, F.; Medina, J. Spectroscopic Raman study of sulphate precipitation sequence in Rio Tinto mining district (SW Spain). Environ. Sci. Pollut. Res. 2014, 21, 6783–6792. [Google Scholar] [CrossRef]
  27. Blacksberg, J.; Alerstam, E.; Maruyama, Y.; Cochrane, C.J.; Rossman, G.R. Miniaturized time-resolved Raman spectrometer for planetary science based on a fast single photon avalanche diode detector array. Appl. Opt. 2016, 55, 739–748. [Google Scholar] [CrossRef] [Green Version]
  28. Jehlička, J.; Vítek, P.; Edwards, H.G.M.; Hargreaves, M.D.; Capoun, T. Fast detection of sulphate minerals (gypsum, anglesite, baryte) by a portable Raman spectrometer. J. Raman Spectrosc. 2009, 40, 1082–1086. [Google Scholar] [CrossRef]
  29. Rull, F.; Sansano, A.; Diaz, E.; Canora, C.P.; Moral, A.G.; Tato, C.; Colombo, M.; Belenguer, T.; Fernández, M.; Rodríguez-Manfredi, J.A.; et al. ExoMars Raman laser spectrometer for Exomars. Proc. SPIE 2011, 8152. [Google Scholar] [CrossRef]
  30. Plášil, J.; Škoda, R.; Fejfarová, K.; Čejka, J.; Kasatkin, A.V.; Dušek, M.; Talla, D.; Lapčák, L.; Machnovič, V.; Dini, M. Hydroniumjarosite, (H3O)+Fe3(SO4)2(OH)6, from Cerros Pintados, Chile: Single-crystal X-ray diffraction and vibrational spectroscopic study. Mineral. Mag. 2014, 78, 535–547. [Google Scholar] [CrossRef]
  31. Najorka, J.; Lewis, J.M.; Spratt, J.; Sephton, M.A. Single-crystal X-ray diffraction study of synthetic sodium-hydronium jarosite. Phys. Chem. Miner. 2016, 43, 377–386. [Google Scholar] [CrossRef] [Green Version]
  32. Libowitzky, E. Correlation of O-H stretching frequencies and O-HO hydrogen bond lengths in minerals. Monatsh. Chem. 1999, 130, 1047–1059. [Google Scholar] [CrossRef]
  33. Momma, K.; Izumi, F. VESTA 3 for three-dimensional visualization of crystal, volumetric and morphology data. J. Appl. Crystallogr. 2011, 44, 1272–1276. [Google Scholar] [CrossRef]
  34. Košek, F.; Edwards, H.G.M.; Jehlička, J. Raman spectroscopic vibrational analysis of the complex iron sulfates clairite, metavoltine, and voltaite from the burning coal dump Anna I, Alsdorf, Germany. J. Raman Spectrosc. 2019, 1–8. [Google Scholar] [CrossRef]
  35. Sergeeva, A.V.; Zhitova, E.S.; Bocharov, V.N. Infrared and Raman spectroscopy of tschermigite, (NH4)Al(SO4)2·12H2O. Vib. Spectrosc. 2019, 105, 102983. [Google Scholar] [CrossRef]
Figure 1. (a) Crystal structure of ammoniovoltaite and (b) kröhnkite-type chains as its building blocks.
Minerals 10 00781 g001
Figure 2. Infrared (a) and Raman (b) spectra of ammoniovoltaite.
Minerals 10 00781 g002
Figure 3. Infrared (a) and Raman (b) spectra of ammoniovoltaite in the 4000 cm−1 to 2000 cm−1 range.
Minerals 10 00781 g003
Figure 4. Hydrogen bond distances in the crystal structure of ammoniovoltaite [1]. Visualized using Vesta program [33].
Minerals 10 00781 g004
Figure 5. Infrared (a) and Raman (b) spectra of ammoniovoltaite in the 2000 cm−1 to 800 cm−1 range.
Minerals 10 00781 g005
Figure 6. Infrared (a) and Raman (b) spectra of ammoniovoltaite in the 800 cm−1 to 400 cm−1 and 800 cm−1 to 70 cm−1 ranges, respectively.
Minerals 10 00781 g006
Table 1. Some symmetric characteristics of ammoniovoltaite crystal structure and data on activation of infrared and Raman bands.
SiteDominantly Occupied byWyckoff PositionSite SymmetryStructure FragmentInfrared Active 1Raman Active 2
AN32bD3NH4ν1, ν2, ν3, ν4ν1, ν2, ν3, ν4
M1Fe3+32cS6 = C3iFe2+X6ν1, ν2, ν3, ν4, ν5, ν6ν1, ν2, ν3, ν4, ν5, ν6
M2Fe2+96gC2Fe3+O6ν1, ν2, ν5ν3, ν4, ν6
AlAl3+16aTAl(H2O)6ν1, ν2, ν3, ν4, ν5, ν6ν3, ν4, ν5, ν6
SS192hC1SO4ν1, ν2, ν3, ν4ν1, ν2, ν3, ν4
O1-O7O192hC1---
H1, H2H192hC1---
1 active component: T1u; 2 active components: A1g, Eg, T2g.
Table 2. Infrared and Raman bands of ammoniovoltaite.
Infrared Spectra, cm−1Raman Spectra, cm−1Band Assignment
35853525(Al–OH), (Fe–OH), ν3 (H2O)l 1
3467-ν1 (H2O)l
3400sh3419ν1 (H2O)s 1
32423235ν3 (NH4), 2ν2 (H2O), ν3 (H2O)s,
31903194ν3 (NH4)
29822954ν1 (NH4)
2483-ν3 (Al–H2O), ν (HSO4)
1694-ν2 (NH4) and/or ν2 (H2O)
1637-ν2 (H2O)
1510sh, 14321544, 1453ν4 (NH4)
1337sh-2 ν4 (SO4), 2 ν3 (AlO6)
1166sh, 11211207, 1149ν3 (SO4)
1059, 1004, 985sh1032, 1005, 986ν1 (SO4)
875sh, 740sh, 725-(Me–H2O)
661, 625, 591659, 625, 589ν4 (SO4), ν3 (AlO6), ν3 (FeO6)
481, 450463, 452ν2 (SO4), ν3 (FeO6)
437432 ν2 (SO4), ν3 (AlO6), ν3 (FeO6)
-394, 335, 266, 182, 92Lattice modes: (MeO6), (SO4), (NH4)
1 Two types of water molecules can be distinguished. The first type of (H2O) molecule is spectrally similar to liquid water and its frequencies are indicated by the index l. The second type of (H2O) molecule is similar to water in I1h ice crystals, denoted by s.
Table 3. The details of OH and HOH modes.
Type of VibrationsStretchingBendingDeformation
Wavenumber, cm−135853585, 3467, 3400, 324224831637875, 740, 725
Band assignmentAl–OH, Fe–OHH2OAl–H2OH2OMe1–H2O
Structure fragment 1 Minerals 10 00781 i001 Minerals 10 00781 i002 Minerals 10 00781 i003 Minerals 10 00781 i004 Minerals 10 00781 i005
1Me—metal.
Table 4. Hydrogen bond distances according to infrared spectroscopy and previously published single-crystal structure refinement [1].
Infrared SpectroscopyCrystal Structure Data [1]
Wavenumber, cm−1d(O···H) (Å) 1d(O···O) (Å) 1D2-Hd(O···H) (Å) 1D-Dd(O···O) (Å) 1
35852.253.24O2-H1 32.22O2-O5w2.95
34672.062.90
3400sh1.992.83O3-H2 31.99O3-O5w2.94
32421.872.72Probably corresponds to H atoms of Al(H2O)6 or NH4
24831.592.53
1 Calculated according to Libowitsky equations [32], v = 3592 304 × 10 9 × exp ( d ( O · · · O ) 0.1321 ) ; v = 3632 1.79 × 10 6 × exp ( d ( O · · · H ) 0.2146 ) ; 2 D, donor; 3 H1 and H2 atoms belong to Fe2+X6 (X = O, OH) octahedra.
Table 5. Infrared bands of selected natural and synthetic voltaite-group members.
Ammonio-VoltaiteAmmonio-Magnesio-Voltaite 1Synthetic Ammonio-VoltaiteSynthetic Mn-Ammonio-VoltaiteSynthetic VoltaiteSynthetic Magnesio-VoltaiteBand Assignment
3585-3562356035583579Me–OH, ν3 (H2O)
3467 34003423341733793417-ν1 (H2O)
3242326332483261--ν3 (NH4), ν3 (H2O),
2 (H2O)
3190-3091311430743083ν3 (NH4)
2982-ν1 (NH4)
2483-2501250124992497ν3 (Al–H2O), ν (HSO4)
1694-1689168616871691ν2 (NH4) and ν2 (H2O)
163716411639164116301635ν2 (H2O)
1510sh-----ν4 (NH4)
1432143114311431--ν4 (NH4)
1337sh-----4 (SO4), 2ν3 (AlO6),
2ν (Al–H2O)
1166-1153 114311571182ν3 (SO4)
112111221130---
105910651055 1053 1055 1065ν1 (SO4)
100410141007100510071014
985sh-----
875sh-879854876866Me2+–OH
740sh-731729735733Al–H2O
725
661sh -----ν4 (SO4), ν3 (AlO6), ν3 (MeO6)
625-627627627634
591594592596592596
481, 450, 437-442444442445ν2 (SO4), ν3 (AlO6), ν3 (MeO6)
This work[6][3]Reference
1 The absence of some bands is due to lower quality of the spectrum and lower resolution of the bands.
Table 6. Raman bands observed for ammoniovoltaite in comparison to voltaite and tschermigite (ammonium alum).
AmmoniovoltaiteVoltaiteTschermigiteBand Assignment
352535833573ν (Al–OH), (Fe–OH), ν3 (H2O)
341934413379ν1 (H2O)
32353209-ν3 (NH4), ν3 (H2O), 2ν2 (H2O)
3194--ν3 (NH4)
--3163ν3 (NH4)
--3124ν1 (H2O), ν1 (NH4)
2954--ν1 (NH4)
--28834 (NH4)
--2562 ν3 (H2O–Al) or possibly ν (HSO4)
--2461
--1680ν2 (NH4)
-16421600δ (H2O)
1544--ν4 (NH4)
145314281445ν4 (NH4)
-1280-ν3 (SO4)
12071215-ν3 (SO4)
1149-1133ν3 (SO4)
--1100ν3 (SO4)
-1055-ν1 (SO4)
10321036-ν1 (SO4)
10051011-ν1 (SO4)
986991990ν1 (SO4)
659660-ν4 (SO4), ν3 (AlO6), ν3 (FeO6)
625629615ν4 (SO4), ν3 (AlO6), ν3 (FeO6)
589594-ν4 (SO4), ν3 (AlO6), ν3 (FeO6)
--535ν2, ν4 (SO4); ν1, ν3 (AlO6)
463469460ν2 (SO4), ν3 (FeO6)
452--ν2 (SO4), ν3 (FeO6)
432439440ν2 (SO4), ν3 (AlO6), ν3 (FeO6)
394398-ν2 (SO4), ν3 (AlO6), ν3 (FeO6)
335338326Lattice modes: (MeO6), (SO4), (NH4)
-310-
266268-
182192192
92-80
This work[34][35]Reference

