Abstract
The equation of state and stability of topaz at high-pressure/high-temperature conditions have been investigated by in situ synchrotron X-ray diffraction (XRD) and Raman spectroscopy in this study. No phase transition occurs on topaz over the experimental pressure–temperature (P-T) range. The pressure–volume data were fitted by the third-order Birch–Murnaghan equation of state (EoS) with the zero-pressure unit–cell volume V0 = 343.86 (9) Å3, the zero-pressure bulk modulus K0 = 172 (3) GPa, and its pressure derivative K’0 = 1.3 (4), while the obtained K0 = 155 (2) GPa when fixed K’0 = 4. In the pressure range of 0–24.4 GPa, the vibration modes of in-plane bending OH-groups for topaz show non-linear changes with the increase in pressure, while the other vibration modes show linear changes. Moreover, the temperature–volume data were fitted by Fei’s thermal equation with the thermal expansion coefficient α300 = 1.9 (1) × 10−5 K−1 at 300 K. Finally, the P-T stability of topaz was studied by a synchrotron-based single-crystal XRD at simultaneously high P-T conditions up to ~10.9 GPa and 700 K, which shows that topaz may maintain a metastable state at depths above 370 km in the upper mantle along the coldest subducting slab geotherm. Thus, topaz may be a potential volatile-carrier in the cold subduction zone. It can carry hydrogen and fluorine elements into the deep upper mantle and further affect the geochemical behavior of the upper mantle.
1. Introduction
Plate subduction is an important way to carry water into the deep Earth, and hydrous minerals in subduction zones are important carriers of water into the Earth’s interior [1,2,3,4]. With the increase in subduction depth, hydrous minerals will dehydrate, and the produced fluids will react with mantle wall-rocks inducing their melting to form arc magma in subduction zones [5]. This process has a significant influence on the physical and chemical properties of the Earth’s mantle [2,5,6]. Furthermore, the dehydration occurs in the crust and the subducting lithosphere of the deep mantle, and it is mainly dependent on the stability of hydrous minerals in subduction zones [7,8,9,10]. Therefore, the structural stability and thermoelastic properties of hydrous minerals at high-pressure and high-temperature (high P-T) conditions are the keys to understanding the geodynamic processes in subduction zones [10,11,12,13,14,15,16].
Topaz has a wide P-T stability field, at least up to 12 GPa and ~ 1100 °C [17]. The synthesis experiment showed that topaz-OH breaks down to kyanite + H2O above 1023 K at 6 GPa [18]. A previous study even indicated that topaz can be subducted to a depth of 1400 km under the cold subduction conditions, showing a metastable state under very high pressures [19]. As an important hydrous aluminosilicate mineral, topaz is widely found in granitoids and metamorphic sedimentary rock. Some studies have shown that topaz in subduction zones can carry water and fluorine to a depth of more than 150 km [17,20,21,22]. Moreover, the occurrence of ultrahigh-pressure (UHP) metamorphic assemblages in the collisional orogenic belts suggests that continent crust subduction might reach depths of 200–300 km [17,19,22,23]. For example, granitoid subduction can be seen in the western Pacific region, through tectonic erosion, arc subduction, and sediment-trapped subduction [20]. The content of topaz in granitoids is up to 3–5% [24]. Granitoids account for more than 45% of the upper part of the continental crust [21]. Therefore, topaz might reach depths of 200–300 km with the continent crust subduction. In the Earth’s interior, topaz does not experience low-temperature transition, and the major transformations undergone by topaz are likely to be either dehydration or conversion to high-pressure hydrous aluminous phases [19,23,25]. Thus, topaz is an important carrier of water and fluorine components from the subducting plate into the deep mantle, especially at the cold subducted slabs.
Topaz with a chemical formula of Al2[SiO4](F,OH)2 is an important aluminosilicate mineral containing water and fluorine. Furthermore, fluorine-bearing topaz mainly occurs in fluorine-rich pegmatite, while the hydroxyl topaz group mainly occurs in ultra-high-pressure metamorphic rocks [26]. The proportion of F and OH in topaz is above 20 wt.%, while the molar ratio of OH in OH and F (XOH = OH/(OH + F)) is generally less than 0.5 [27,28,29,30]. Consequently, the maximum OH content of topaz is about 10 wt.%. Therefore, topaz contains much more water than nominally anhydrous minerals.
Topaz belongs to the orthorhombic crystal system with a space group of Pbnm. In the crystal structure of topaz (Figure 1), Si4+ occupies isolated tetrahedral [SiO4] sites, while Al3+ occupies the space of octahedron to form [AlO6]/[AlO4F2] octahedron, and the tetrahedron is connected by a curved chain to a pair of [AlO6]/[AlO4F2] octahedrons [31]. All four corner tops of each [SiO4] tetrahedron are connected with adjacent [SiO4] tetrahedrons and [AlO6]− octahedrons to form a framework silicate structure. O2− in the [AlO6]− octahedron has some residual charge, and the gap between tetrahedron and octahedron in the frame structure is large, which is easy to absorb F− and H+ anions (Figure 1a). Along the b axis (010) (Figure 1b), the crystal is stacked in the manner of “ABAB”.
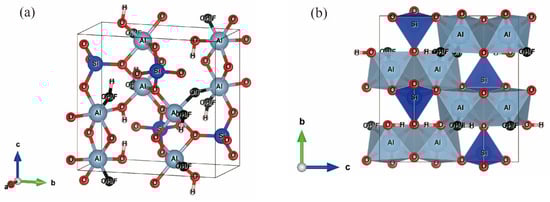
Figure 1.
Crystal structure of topaz at ambient conditions with the style of ball-and-stick (a) and the style of polyhedron (b). Light blue for aluminum, dark blue for silicon, red for oxygen, light red for hydrogen, and black for fluorine instead of oxygen or hydroxide. The crystal structure data are obtained from Gatta et al. (2006) [30].
At present, there are many studies, including experiments and theoretical calculations, about the equation of state (EoS) on topaz, where the highest pressure condition is 60 GPa [19,30,32,33,34]. However, the experimental results are not completely consistent. Gatta et al. conducted a single-crystal X-ray diffraction (XRD) study of topaz with composition Al2.00Si1.05O4.00(OH0.26F1.75) up to 10.55 GPa and obtained K0 = 164 (2) GPa [30]. Similarly, Komatsu et al. (2003) obtained K0 = 154 (2) GPa of topaz with composition Al2.01SiO4F1.57(OH)0.43, which is 6% lower than that of Gatta et al. [30,34]. Furthermore, Komatsu et al. (2008) obtained K0 = 145 (4) GPa of topaz with composition Al2SiO4(OD1.45, OH0.55)Σ2.0 using neutron powder diffraction method, which is 12% lower than that of Gatta et al. [33]. In addition, there are also some theoretical calculation studies about the EoS of topaz. Mookherjee et al. investigated the K0 of topaz with composition Al2SiO4(OH)2 by first principles simulation and obtained K0 = 166.4 (6) GPa, while Ulian et al. calculated the K0 of topaz with composition Al2SiO4F(OH) by quantum mechanical approach and obtained K0 = 165 (3) GPa [35,36]. The theoretical calculation results of topaz with different composition (Al2SiO4(OH)2 vs. Al2SiO4F(OH)) are very similar with each other (K0 = 166.4 (6) GPa vs. K0 = 165 (3) GPa), which is clearly different from the experimental results. Thus, there is still a great controversy on the EoS parameters of topaz.
Furthermore, there are only two previous studies on the thermal expansion of topaz at high temperatures [34,37]. The highest experimental temperature in these two studies was 1173 K finished by Komatsu et al. using the powder XRD method [34]. However, there were only six data points in the temperature range up to 1173 K, which may seriously affect the fitting accuracy of the thermal expansion coefficient. Therefore, the thermal expansion of topaz needs to be further investigated.
Additionally, the high P-T stable field of topaz in different chemical systems has been investigated extensively. Wunder et al. [22] studied the paragenetic mineral assemblage in the Al2O3-SiO2-H2O system at 5–10 GPa and up to 1273 K. Their result indicated that topaz with a composition close to Al2SiO4(OH)2 is stable in the P-T field of 700–1000 K and 5.5–10 GPa. Subsequently, Ono et al. [23] carried out a similar experiment and found that topaz can be stable up to 1800 K and 13 GPa. On the other hand, the results of single-crystal/powder XRD, neutron powder diffraction, and luminescence spectroscopy of Cr3+ implied that topaz is metastable up to 1173 K at atmospheric pressure and up 60 GPa at room temperature [19,30,32,33,34,35,36,38]. For example, Komatsu et al. [34] found that the metastable temperature of topaz was 1173 K at atmosphere pressure by powder XRD experiment, while Gatta et al. [32] found that the metastable pressure of topaz was 45 GPa at room temperature by single-crystal XRD experiment. Recently, O’Bannon and Williams [19] found that topaz can exist in the form of metastable state at 60 GPa by luminescence spectroscopy.
The above previous studies have addressed, to some extent, the P-T stable field of topaz in the hot subduction zone. However, the stability of topaz under relatively low-temperature and high-pressure conditions in the cold subduction zone remains unclear. This will hinder our correct understanding of the water circulation and dynamic process in the cold subduction zone.
Based on the above discussion, the EoS, thermal expansion, and stability of a natural topaz were studied using the synchrotron single-crystal XRD under high temperature and pressure in this study. Apart from the single-crystal XRD, Raman spectroscopy was also used to judge the structural stability of topaz at high-pressure conditions. Finally, the P-T phase diagram and stability of topaz and its effect on water and fluorine migration in the subduction zone, especially in the cold subducting zone, are further discussed.
2. Sample and Experiments
2.1. Sample
A natural topaz crystal selected in this study was collected from Brazil. It was colorless, transparent, and columnar, and had good crystal morphology. The chemical composition of the topaz sample was determined by JXA-8230 electron microprobe (JEOL, Akishima-shi, Japan) with the accelerating voltage of 15 kV, a beam current of 20 nA, and a beam diameter of 5 μm. And then the chemical formula was estimated as Al1.935 ± 0.011[(Si0.935 ± 0.011Al0.065 ± 0.011) O4.000](OH0.408 ± 0.021F1.592 ± 0.021).
2.2. Synchrotron Single-Crystal XRD Experiments
In situ Synchrotron single-crystal XRD experiments contain two-types of experiments; one was conducted at high-pressure and ambient-temperature conditions, while the other was carried out under simultaneous high-pressure and high-temperature conditions.
2.2.1. High-Pressure and Ambient-Temperature Single-Crystal XRD Experiment
A short symmetrical diamond anvil cell (DAC) containing a pair of diamond anvils (500 μm culets) was used for the high-pressure measurements up to 13.4 GPa. A rhenium gasket pre-indented to a thickness of ~65 μm with a hole of 300 µm in diameter was used as the sample chamber. One piece of the single-crystal topaz sample, together with Au powder, which was used as the pressure calibrator [39], were loaded into the sample chamber. XRD patterns of Au were collected at each pressure before and after sample data collection, and the average pressure value was taken. Neon gas was used as the pressure medium by the gas-loading system at the GeoSoilEnviroConsortium for Advanced Radiation Sources (GSECARS) of the Advanced Photon Source (APS), Argonne National Laboratory (ANL) [40].
Synchrotron single-crystal XRD experiments under high-pressure and ambient-temperature conditions were carried out at the 13-BM-D experimental station of GSECARS, APS. The wavelength of the incident X-ray beam was 0.3344 Å, and the beam size was 3 × 7 µm2. Data were collected rotating the DAC for 30° around the vertical axis of the instrument (ω-axis, from −15° to +15°), with a typical exposure time of 2 s/deg. The GSE_ADA software package was used to analyze all the diffraction images. The unit–cell parameters of topaz at high pressure (Table 1) were further re-calibrated by RSV software [41].

Table 1.
The unit–cell parameters of topaz at high pressures.
2.2.2. High-Pressure and High-Temperature Single-Crystal XRD Experiment
A BX90-type external-heating DAC (EHDAC, Beijing Scistar Technology Co. Ltd., Beijing, China) [42] was used for the simultaneous high-pressure and high-temperature measurements up to 10.9 GPa and 700 K. A rhenium foil was placed between a pair of diamond anvils as a gasket with an original thickness of about 250 µm. A K-type thermocouple was used for the high-temperature measurements of the sample chamber in the EHDAC. The thermocouple was attached to one of the diamond surfaces approximately 500 μm away from its culet and clad with a ceramic adhesive (Resbond 920) [43], which was thermally conductive and electrically insulating. A single-crystal platelet was then placed into the sample chamber, together with gold (Au) powder as the pressure calibrant for the XRD experiments [39] as well as a few ruby spheres as pressure indicators for the neon gas-loading [44]. The neon pressure medium was loaded into the sample chamber using the GSECARS gas-loading system [40]. After neon gas loading, the sample chamber was reduced from ~300 µm to ~180 µm, and the initial pressure was about 0.33 GPa. At each P-T point, the diffraction patterns of Au were collected before and after the sample diffraction data collected, and the pressure change no more than ±0.1 GPa. Temperatures of the sample chamber were actively stabilized within ±1 K using the temperature-power feedback program with a remotely controlled.
The synchrotron single-crystal XRD experiment under high-pressure and high-temperature conditions was carried out at 13-BM-C experimental station of the GSECARS, APS. The wavelength of the incident X-ray beam was 0.4335 Å, and the beam size was 15 × 20 µm2. We used a MAR165 CCD detector (Rayonix, L.L.C, Evanston, IL, USA) to collect the diffraction images, and LaB6 powder was used as the diffraction standard [45]. Wide and stepped φ exposures were collected for each single-crystal sample at each P-T point with a typical exposure time of 3 s/deg. The APEX3 software package (DOC-M86-EXX229 V1, Bruker AXS Inc., Madison, WI, USA) was used to analyze all the diffraction images.
2.3. High-Temperature Synchrotron Powder XRD Experiment
A modified Merrill–Bassett type DAC with a pair of 400 µm culet-size diamond anvil was used for high-temperature powder XRD experiment up to 713 K. The T301 stainless steel foil was used for gasket, which was pre-indented to a thickness of ~100 µm and then drilled to a diameter of 300 μm, served as the sample chamber. The topaz sample powders were slightly pressed between two opposing diamond anvils to form an approximately 80 μm thick disk, and a piece of topaz sample about 250 μm in diameter was loaded into the sample chamber without any pressure medium. Heating was carried out using a resistance-heating system, and the temperature was measured by the K-type thermocouple, which was attached to the pavilion of the diamond. Each in situ XRD pattern was collected after heating, and the spectra were selected after the experiment temperature was kept for 600 s. The typical exposure time for collecting diffraction patterns of the topaz sample was 300 s. Details of the experimental setup and cell assembly were described in Fan et al. (2010) [46].
The in situ powder XRD experiment at high temperature up to 713 K was completed at the 4W2 beamline of the Beijing Synchrotron Radiation Facility (BSRF). The wavelength of the monochromatic incident X-ray beam was 0.6199 Å, and the beam size was 20 × 30 µm2. CeO2 was adopted as the diffraction standard. The sample-detector distance was calculated from the powder CeO2 diffraction pattern at ambient conditions. XRD patterns were collected by an image plate detector (MAR-345, MarXperts, Norderstedt, Germany). The diffraction patterns were integrated to generate the conventional one-dimensional profiles using the Fit2D program (1987–2001 Andy Hammersley, European Synchrotron Radiation Facility, Grenoble, France [47]). Analysis of all the patterns was carried out by means of the full profile-fitting technique implemented in the EXPGUI/GSAS software package (1.80 (readexp.tcl 1.46), Los Alamos National Laboratory, Los Alamos, NM, USA) [48,49]. Refinement of peak positions and extraction of cell parameters were achieved by reducing full diffraction patterns following the Le Bail method [50]. The unit–cell volumes of topaz were estimated from the full spectrum fitting (Le Bail refinement) of XRD profiles.
2.4. High-Pressure Raman Spectroscopy Experiment
A symmetrical DAC containing a pair of diamonds with 500 μm culets was used for the high-pressure Raman spectroscopy measurements up to 24.4 GPa. A stainless steel foil (type T301) gasket was pre-indented to a thickness of ~65 μm, and then a hole was drilled in the center with a diameter of 300 μm used as the sample chamber. One piece of the single-crystal topaz sample, together with one ruby chip (as the pressure calibrant), was loaded in the sample chamber. The neon pressure medium was loaded into the sample chamber using the gas-loading system at the GSECARS of the APS, ANL [40]. The fluorescence spectra of ruby were collected before and after each data collection, and the positions of R1 and R2 peaks were determined by Lorentzian function fitting. The pressure was calculated from the fitted R1 and R2 peak positions using the method of Mao et al. (1986) [44]. Raman spectra were collected with the Renishaw InVia spectrometer equipped with a Peltier-cooled charge-coupled device (CCD) detector. The sample was excited with a 532 nm wavelength laser. The laser light was focused using a Leica microscope with a long-distance 20× objective to a beam size of about 2 μm diameter with the laser powder being 2 mW on the sample. The laser heating effect should not occur under these conditions. The wavenumber of Raman displacement was calibrated with a single crystal silicon. Each Raman spectrum was collected with a total exposure time of 300 s, and Raman spectra of 100~1200 cm−1 were measured. Raman peaks were fitted to obtain peak parameters, Raman mode frequencies, and peak widths [full width at half maximum (FWHM)] from these spectra.
3. Results
3.1. P-V Equation of State and Raman Spectroscopy
The unit-cell parameters and volumes of topaz at various pressures up to 13.4 GPa are shown in Table 1. Moreover, the V/V0 as a function of pressure are plotted in Figure 2. With the increasing pressure, no abrupt change in the unit–cell volumes were observed in Figure 2, indicating that there is no phase transition within this pressure range.
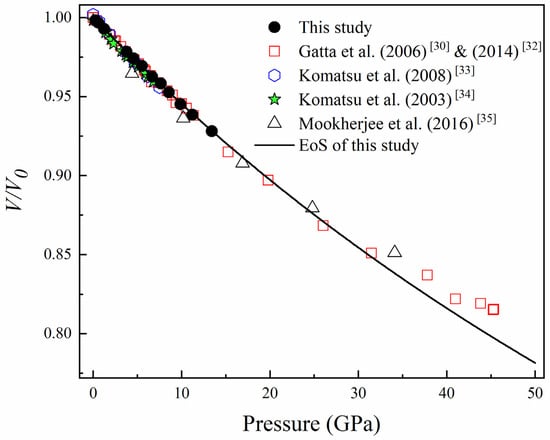
Figure 2.
The V/V0 changed with the pressure, the black solid points represent the data points measured in this experiment, and the black lines were obtained by BM3 EoS-fitting. The red hollow square represents the data points of Gatta et al. (2006) [30] & (2014) [32], the blue hollow hexagon represents the data points of Komatsu et al. (2008) [33], the green solid pentacle represents the data points of Komatsu et al. (2003) [34], and the black hollow triangle represents the data points of Mookherjee et al. (2016) [35].
The P-V data (Table 1) were fitted using the third-order Birch–Murnaghan EoS as follows:
where V0, K0, and K’0 are the zero-pressure volume, isothermal bulk modulus, and its pressure derivative, respectively. Analyses of Equation (1) by the EoSFit 7c program (7.5, University of Padova, Veneto, Italy) [51] with all parameters free, obtained the following results: V0 = 343.86 (9) Å3, K0 = 172 (3) GPa, and K’0 = 1.3 (4). When K’0 fixed at 4, the fitting results yielded V0 = 344.2 (2) Å3 and K0 = 155 (2) GPa. The relationship between the Eulerian definition of finite strain fE(fE = [(V0/V)2/3 − 1]/2) and “normalized stress” FE(FE = P/3fE(1 + 2fE)5/2) is shown in Figure 3 [52]. The weighted linear fit of the data points yielded the intercept value of FE (0) = 172 (2) GPa, which is consistent with the isothermal bulk modulus obtained by the third-order Birch–Murnaghan EoS (K0 = 172 (3) GPa). Moreover, the relationship between FE and fE has a negative slope, indicating that K’0 is less than 4. This is consistent with K’0 = 1.3 (4) obtained from the third-order Birch–Murnaghan EoS [52]. Therefore, the third-order Birch–Murnaghan EoS is a good description of the P-V data in this study.
P = (3/2) K0 [(V0/V)7/3 − (V0/V)5/3] × [1 + (3/4) (K’0 − 4) [(V0/V)2/3 − 1]]

Figure 3.
Volume Eulerian strain–normalized pressure (FE–fE) plot. The solid line is the linear fit of the data.
High-pressure Raman spectra of topaz were also collected up to 24.4 GPa. Typical Raman spectra at selected pressures are shown in Figure 4. No evidence for a phase transition of topaz was observed up to 24.4 GPa. With the pressure increasing, ten Raman peaks of topaz gradually shifted to high frequencies in the range of 200–1200 cm−1. It is worth noting that two peaks at about 924.6 cm−1 overlapped at 0.2 GPa and separated at 10.8 GPa and higher pressures.
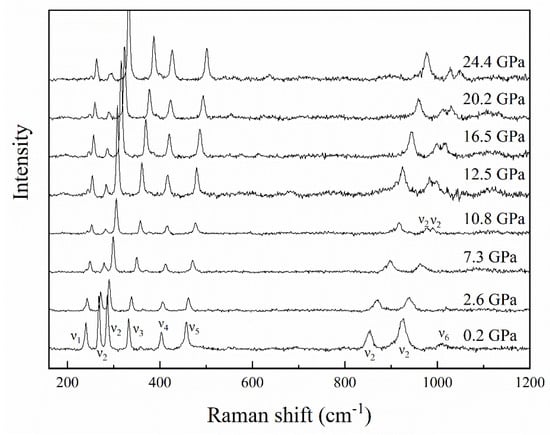
Figure 4.
Representative Raman spectra of topaz up to 24.4 GPa. ν1, Symmetric Si-O ring deformation, ν2, Vibrational modes of [SiO4] tetrahedra, ν3, Stretching modes of Al-F, ν4, Stretching modes of [AlO6] octahedra, ν5, Stretching and bending modes of [AlO6] octahedra and bending modes of [SiO4] tetrahedra, ν6, In-plane bending OH-groups.
According to the results of previous studies, these ten kinds of vibration peaks can be assigned to six vibration modes [53,54]. Among the ten vibration modes, six vibration modes are symmetric Si-O ring deformations (ν1). The other four vibration modes are vibrational modes of [SiO4] tetrahedrons (ν2), stretching modes of Al-F (ν3), stretching modes of [AlO6] octahedrons (ν4), stretching and bending modes of [AlO6] octahedrons, and bending modes of [SiO4] tetrahedrons (ν5), and in-plane bending OH-groups (ν6) [53,54]. Figure 5 shows several vibration mode frequencies as a function of pressure. Except for the ν6 vibration mode, other vibration modes are linear. With the increase in pressure, all bands move to high frequencies. Table 2 summarizes the Raman spectra results of topaz under high pressures in this study, which shows that the pressure derivatives of Raman shift (dν/dP) are in the range of 0.93–5.12 cm−1/GPa. At last, the results of our high-pressure single-crystal XRD and Raman spectroscopy experiments clearly indicate that topaz can be metastable up to ~24.4 GPa at room temperature.
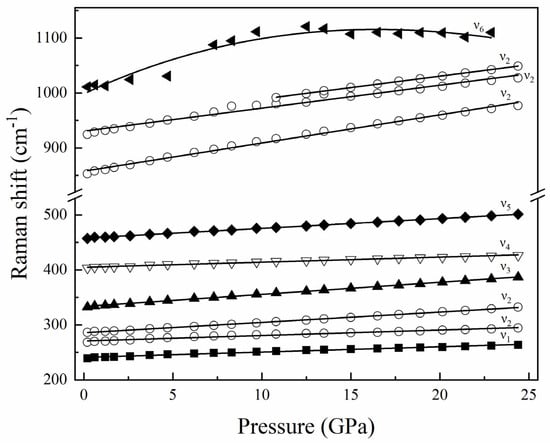
Figure 5.
Pressure dependences of the observed Raman modes for topaz up to 24.4 GPa. ν1, Symmetric Si-O ring deformation, ν2, Vibrational modes of [SiO4] tetrahedra, ν3, Stretching modes of Al-F, ν4, Stretching modes of [AlO6] octahedra, ν5, Stretching and bending modes of [AlO6] octahedra and bending modes of [SiO4] tetrahedra, ν6, In-plane bending OH-groups.
Table 2.
Mode shifts, derivative of Raman shift to pressure, and mode Grüneisen parameter of topaz.
3.2. Thermal Expansion of Topaz
The high-temperature XRD data were collected to 713 K at ambient pressure. All of the XRD patterns at each temperature of topaz are similar up to 713 K, with Bragg peaks shifted to lower 2θ, indicating that topaz did not undergo any phase transition up to the experimental maximum temperature (713 K) (Figure 6). Figure 7a–d shows the typical Le Bail profile fitting results of the XRD profiles at 298 K, 413 K, 533 K, and 713 K, respectively. Unit–cell parameters and volumes (a, b, c, and V) at all temperature points from 298 K to 713 K with an interval of 30 K are given in Table 3.

Figure 6.
Typical X-ray diffraction patterns of topaz from powder X-ray diffraction experiments at ambient pressure and high temperature.

Figure 7.
The representative Le Bail profile fitting pattern of topaz at 298 K (a), 413 K (b), 533 K (c), and 713 K (d). Observed spectra (black line), fitted spectra (red solid line), difference plot (blue solid line), and Bragg peak positions (tick marks) are shown.
Table 3.
The unit–cell parameters of topaz at high temperature and ambient pressure.
Figure 8 shows the variations of the unit–cell volumes with temperature. When the temperature increased from 300 K to 713 K, the unit–cell volume increased by 0.5%. We used Fei’s thermal expansion equation to fit our high-temperature XRD data:
where VT represents the unit–cell volume at high temperature and ambient pressure, V0 represents the unit–cell volume at ambient conditions, and Tref is the reference temperature. α0, α1, and α2 are the three parameters to describe the relationship between the thermal expansion coefficient and the temperature with the form of αT = α0 + α1T + α2T−2. Since our experimental temperature range was limited, α1 = α2 = 0 was set in the fitting process and the αT equal to α0. It can be seen from Figure 8 that most of the high-temperature XRD data points fall on the fitting line, which indicates that Fei’s equation was suitable for fitting the high-temperature XRD data in this study. By fitting our high-temperature XRD data using Equation (2), we obtained the thermal expansion coefficient α300 = 1.9 (1) × 10−5 K−1, as shown in Table 4. The thermal expansion coefficient obtained in this study is consistent with Komatsu’s [34] results (α300 = 2.0 (1) × 10−5 K−1).

Figure 8.
Temperature-Volume (T-V) data of topaz at ambient pressure and high temperature.
Table 4.
Comparison of thermoelasticity of Topaz.
4. Discussion
4.1. P-V Equation of State
Figure 2 shows the volume compression (V/V0) of topaz as a function of pressure in this study and a comparison with the results from previous studies. The solid curves in Figure 2 are the calculated compression curve with K0 = 172 (3) GPa and K’0 = 1.3 (4) for the topaz in this study. From Figure 2, we can find that our data are consistent with most the previous experimental data within 13.4 GPa [30,32,33,34], but are a little different from the theoretical data of Mookherjee et al. (2016) [35].
The comparison of K0 and K’0 in this study and previous studies for topaz is summarized in Table 4. The EoS of topaz has been extensively studied by experiments and theoretical calculation, but there is a large difference among the K0 of previous studies (Table 4). Detailed analysis results of previous studies show that different sample compositions and experimental methods may have an important influence on the EoS parameters (K0 and K’0) of topaz. Furthermore, compared with previous results (Table 4), the obtained K0 = 172 (3) GPa and K’0 = 1.3 (4) in this study were 3.3–8.1% larger and 55.2–67.7% smaller than those obtained in previous studies within their uncertainties, respectively.
We infer that there are three possible reasons for the difference in K0 of topaz. Initially, the compositional differences among different studies of topaz are some of the most important factors. For example, the compositions among this study, Gatta et al. (2006) [30], and Komatsu et al. (2003) [34] are different (Table 4), which may cause the difference among the obtained K0 (Figure 9). In addition, in static compression studies, there is a trade-off between the fitted K0 and K’0, which have a negative correlation [55]. Our result of K’0 = 1.3 (4) was less than those reported by previous studies (2.9–4.03), and accordingly, K0 was larger. Therefore, the difference in K’0 may be another cause of the different K0 of topaz (Figure 10). Moreover, the pressure medium is also a factor that affects the result of K0 value. The hydrostatic limit of 4:1 methanol–ethanol and 16:3:1 methanol–ethanol–water mixtures is about 9.8–10.5 GPa, while that of the neon can reach 15 GPa [56,57]. Gatta et al. (2006, 2014) [30,32] used neon and 16:3:1 methanol–ethanol–water mixtures as the pressure medium, and found the difference between the obtained K0 was 3.7%. Furthermore, Komatsu et al. (2003, 2008) [33,34] used 4:1 methanol–ethanol mixtures and 16:3:1 methanol–ethanol–water mixtures as the pressure medium, respectively, and indicated that the difference of K0 between them and Gatta et al. (2006, 2014) was 2.5–8.2% [32,33,34]. Considering the above three factors, we further compared the fitted K0 of this study with Komatsu et al. (2003) [34] at fixed K’0 = 4, which had a similar sample composition and the hydrostatic environment with this study, and found that the obtained K0 = 155 (2) GPa of this study is consistent with the result of Komatsu et al. (2003) [34].

Figure 9.
The relationship between K0 and F content. The red solid square represents the data points of Gatta et al. (2006) [30], the red hollow square represents the data points of Gatta et al. (2014) [32], and the green solid pentacle represents the data points of Komatsu et al. (2003) [34].
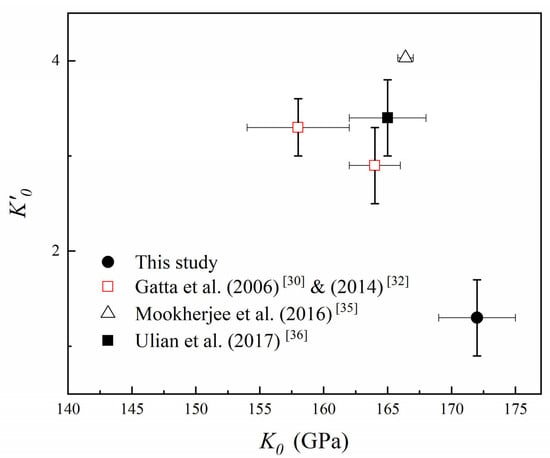
Figure 10.
The relationship between K0 and K’0 value. The red hollow square represents the data points of Gatta et al. (2006) [30] & (2014) [32], the black hollow triangle represents the data points of Mookherjee et al. (2016) [35], and the black solid square represents the data points of Ulian et al. (2017) [36].
4.2. P-T Phase Diagram and Stability of Topaz under High P-T Conditions
A hydrous mineral is one of the important constituent minerals of the subducted plate [2]. The P-T stability and dehydration of hydrous minerals have a profound effect on understanding the dynamic process of plate subduction [5]. Under the P-T conditions of cold subduction, especially ultra-cold subduction, the dehydration of hydrous minerals is likely to be restrained by the low-temperature condition, which may push them into the deep mantle along with the subducted plates and transport a large amount of water into the middle and lower part of the upper mantle, thus exerting a profound influence on the geological process of deep Earth [17,18,23,58].
Topaz, as an important aluminosilicate mineral that occurs in the shallow crust, is an important carrier of F and H2O. Moreover, as mentioned in the introduction part, topaz in granitoid might reach depths of 200–300 km with continent crust subduction [17,19,22,23]. Figure 11 shows the P-T stability area and metastable area of topaz. The stability area was obtained from Wunder et al. and Ono et al. experimental data [18,23], and the metastable area was obtained from this study and other previous studies [30,32,33,34,35].

Figure 11.
The P-T stability of topaz. Data of P-T stable area were obtained from Wunder et al. (1993) [18,22] and Ono et al. (1999) [23]. In the metastable area, black solid points are the data points of this experiment, and other data were obtained from Komatsu et al. (2003) [34], Gatta et al. (2006) [30], Komatsu et al. (2008) [33], Gatta et al. (2014) [32], Mookherjee et al. (2016) [35]. The dotted lines represent the Tonga slab geotherm (red), Aleutian slab geotherm (blue) (Bina and Navrotsky (2000) [62]), Normal geotherm (black) (Pollack and Chapman (1977) [59]), and adiabatic geotherm (green) (Artemieva et al. (2001) [61] and Zang et al. (2002) [60]).
Under the normal geothermal gradient conditions (1.3–12.7 GPa, 740–1700 K) [59,60,61], the stability depth of topaz is in the range of about 248 km to 413 km (7.5 to 12.5 GPa, 1244–1700 K). However, the stability depth of topaz is quite different in subduction zones. As shown in Figure 11, although in the case of hot subduction zones, such as Aleutian (2.2–13.7 GPa, 740–1260 K), the stability depth of topaz is in the range of about 120 km to 396 km (5–12 GPa, 970–1200 K), topaz may be completely devolatilized at depths above 100 km and cannot carry F and H2O into the deep upper mantle [62,63]. Contrarily, in the case of cold subduction zones, such as Tonga (2.1–15.7 GPa, 425–708 K), topaz may be metastable at depths above 350 km (2.1–10.5 GPa, 425–613K) [62]. It is consistent with the results of this experiment that topaz is stable under 700 K and 10.9 GPa. Furthermore, as mentioned above, the maximum OH content of topaz is about 10 wt.%. However, the water content of olivine is in the range of 49 ppm to 392 ppm [64], the water content of ortho- and clinopyroxenes is in the range of 215 ppm to 263 ppm and 195 ppm to 620 ppm, respectively [65], and the water content of garnet is in the range of 50 ppm to 150 ppm [66]. Therefore, topaz contains much more water than nominally anhydrous minerals, even though its content is much less in the slab than that of nominally anhydrous minerals. According to the present study, topaz can carry plenty of H2O and F to the deepest depth of 370 km in the coldest subduction zones (Figure 11). Due to the temperature of the surrounding mantle being much higher than that of the subduction slab, the temperature of the subduction slab will rise with time. Consequently, topaz will devolatilize. Hence, the released F and H2O from topaz may potentially affect the geochemical behavior of the upper mantle [67].
5. Conclusions
The P-V and T-V relationship, and the P-T stability of topaz were carried out using the synchrotron-based single-crystal XRD and Raman spectroscopy methods up to 713 K and 24.4 GPa in this study. There was no phase transition in the maximum P-T conditions in this study. P-V data fitted by third-order Birch–Murnaghan EoS, obtained V0 = 343.86 (9) Å3, K0 = 172 (3) GPa, and K’0 = 1.3 (4) for topaz. Simultaneously, we discussed the possible reasons for the different K0 between this study and previous studies. In addition, T-V data fitted by using Fei’s thermal expansion equation obtained α300 = 1.9 (1) × 10−5 K−1 for topaz. Finally, combining with the obtained experimental data in this study with previous results, we plotted the P-T phase diagram of topaz and concluded that under cold subduction conditions. Topaz can carry hydrogen and fluorine elements into the deep upper mantle and further affect the geochemical behavior of the upper mantle.
Author Contributions
Conceptualization and methodology, D.F. and W.Z.; investigation, J.X. and S.H.; sample source, C.C.; experimental analysis, D.F., W.Z., J.X. and S.H.; writing—original draft preparation, S.H.; writing—review and editing, D.F., W.Z., M.M., S.H., J.X., Z.Y., Y.K., B.L. and W.C.; plotting, S.H.; software, S.H. and J.X. All authors have read and agreed to the published version of the manuscript.
Funding
This project was funded by the National Natural Science Foundation of China (Grant Nos. 41772043, 41802043, and 41674089), the Chinese Academy of Sciences “Light of West China” Program (2017, 2019), the Youth Innovation Promotion Association CAS (Dawei Fan, 2018434), and the Innovation and Entrepreneurship Funding of High-Level Overseas Talents of Guizhou Province (Dawei Fan, [2019] 10).
Acknowledgments
We thank Sergey N. Tkachev, Dongzhou Zhang, Xiaodong Li, and Yanchun Li for the synchrotron XRD experiments assistance. We want to thank two anonymous reviewers for their thoughtful and thorough comments.
Conflicts of Interest
The authors declare no conflict of interest.
References
- Ni, H.W.; Zheng, Y.F.; Mao, Z.; Wang, Q.; Chen, R.; Zhang, L. Distribution, cycling and impact of water in the Earth’s interior. Natl. Sci. Rev. 2017, 4, 879–891. [Google Scholar] [CrossRef]
- Zheng, Y.F.; Chen, R.X.; Xu, Z.; Zhang, S.B. The transport of water in subduction zones. Sci. China Earth Sci. 2016, 59, 651–682. [Google Scholar] [CrossRef]
- Bindi, L.; Bendeliani, A.; Bobrov, A.; Matrosova, E.; Irifune, T. Incorporation of Mg in phase Egg, AlSiO3OH: Toward a new polymorph of phase H, MgSiH2O4, a carrier of water in the deep mantle. Am. Mineral. 2020, 105, 132–135. [Google Scholar] [CrossRef]
- Panero, W.R.; Caracas, R. Stability and Solid Solutions of Hydrous Alumino-Silicates in the Earth’s Mantle. Minerals 2020, 10, 330. [Google Scholar] [CrossRef]
- Zheng, Y.F. Subduction zone geochemistry. Geosci. Front. 2019, 10, 1223–1254. [Google Scholar] [CrossRef]
- Piet, H.; Leinenweber, K.D.; Tappan, J.; Greenberg, E.; Prakapenka, V.B.; Buseck, P.R.; Shim, S.H. Dehydration of delta-AlOOH in Earth’s Deep Lower Mantle. Minerals 2020, 10, 384. [Google Scholar] [CrossRef]
- Nakao, A.; Iwamori, H.; Nakakuki, T. Effects of water transportation on subduction dynamics: Roles of viscosity and density reduction. Earth Planet. Sci. Lett. 2016, 454, 178–191. [Google Scholar] [CrossRef]
- Liu, X.C.; Matsukage, K.N.; Nishihara, Y.; Suzuki, T.; Takahashi, E. Stability of the hydrous phases of Al-rich phase D and Al-rich phase H in deep subducted oceanic crust. Am. Mineral. 2019, 104, 64–72. [Google Scholar] [CrossRef]
- Kakizawa, S.; Inoue, T.; Nakano, H.; Kuroda, M.; Sakamoto, N.; Yurimoto, H. Stability of Al-bearing superhydrous phase B at the mantle transition zone and the uppermost lower mantle. Am. Mineral. 2018, 103, 1221–1227. [Google Scholar] [CrossRef]
- Zhang, L.; Smyth, J.R.; Kawazoe, T.; Jacobsen, S.D.; Niu, J.J.; He, X.J.; Qin, S. Stability, composition, and crystal structure of Fe-bearing Phase E in the transition zone. Am. Mineral. 2019, 104, 1620–1624. [Google Scholar] [CrossRef]
- Peng, Y.; Mookherjee, M. Thermoelasticity of tremolite amphibole: Geophysical implications. Am. Mineral. 2020, 105, 904–916. [Google Scholar] [CrossRef]
- Satta, N.; Marquardt, H.; Kurnosov, A.; Buchen, J.; Kawazoe, T.; McCammon, C.; Ballaran, T.B. Single-crystal elasticity of iron-bearing phase E and seismic detection of water in Earth’s upper mantle. Am. Mineral. 2019, 104, 1526–1529. [Google Scholar] [CrossRef]
- Schulze, K.; Pamato, M.G.; Kurnosov, A.; Ballaran, T.B.; Glazyrin, K.; Pakhomova, A.; Marquardt, H. High-pressure single-crystal structural analysis of AlSiO3OH phase egg. Am. Mineral. 2018, 103, 1975–1980. [Google Scholar] [CrossRef]
- Xu, J.G.; Kuang, Y.Q.; Zhang, B.; Liu, Y.G.; Fan, D.W.; Li, X.D.; Xie, H.S. Thermal equation of state of natural tourmaline at high pressure and temperature. Phys. Chem. Miner. 2016, 43, 315–326. [Google Scholar] [CrossRef]
- Xu, J.G.; Zhang, D.Z.; Fan, D.W.; Wu, X.; Shi, F.; Zhou, W.G. Compressional behavior of natural eclogitic zoisite by synchrotron X-ray single-crystal diffraction to 34 GPa. Phys. Chem. Miner. 2019, 46, 333–341. [Google Scholar] [CrossRef]
- Yang, C.P.; Inoue, T.; Kikegawa, T. P–V–T equation of state of hydrous phase A up to 10.5 GPa. Am. Mineral. 2020. [Google Scholar] [CrossRef]
- Holland, T.J.B.; Redfern, S.A.T.; Pawley, A.R. Volume behavior of hydrous minerals at high pressure and temperature; II, Compressibilities of lawsonite, zoisite, clinozoisite, and epidote. Am. Mineral. 1996, 81, 341–348. [Google Scholar] [CrossRef]
- Wunder, B.; Rubie, D.C.; Ross, C.R.; Medenbach, O.; Seifert, F.; Schreyer, W. Synthesis, stability, and properties of Al2SiO4(OH)2: A fully hydrated analog of topaz. Am. Mineral. 1993, 78, 285–297. [Google Scholar]
- O’Bannon, E.F.; Williams, Q. A Cr3+ luminescence study of natural topaz Al2SiO4(F,OH)2 up to 60 GPa. Am. Mineral. 2019, 104, 1656–1662. [Google Scholar] [CrossRef]
- Yamamoto, S.; Senshu, H.; Rino, S.; Omori, S.; Maruyama, S. Granite subduction: Arc subduction, tectonic erosion and sediment subduction. Gondwana Res. 2009, 15, 443–453. [Google Scholar] [CrossRef]
- Zou, T.R.; Chao, H.Z.; Wu, B.Q. Orogenic and anorogenic granitoids in the altay mountains of xinjiang and their discrimination criteria. Acta Geol. Sinica Engl. Ed. 1989, 2, 45–64. [Google Scholar] [CrossRef]
- Wunder, B.; Medenbach, O.; Krause, W.; Schreyer, W. Synthesis, properties and stability of Al3Si2O7(OH)3 (Phase Pi), a hydrous high-pressure phase in the system Al2O3-SiO2-H2O (ASH). Eur. J. Mineral. 1993, 5, 637–649. [Google Scholar] [CrossRef]
- Ono, S. High temperature stability limit of phase egg, AlSiO3(OH). Contrib. Mineral. Petr. 1999, 137, 83–89. [Google Scholar] [CrossRef]
- Letnikov, F.A. Topaz granites in northern Kazakhstan. Petrology 2008, 16, 319–334. [Google Scholar] [CrossRef]
- Dobrzhinetskaya, L.F.; Green, H.W. Experimental studies of mineralogical assemblages of metasedimentary rocks at Earth’s mantle transition zone conditions. J. Metamorph. Geol. 2007, 25, 83–96. [Google Scholar] [CrossRef]
- Tennakoon, S.; Peng, Y.; Mookherjee, M.; Speziale, S.; Manthilake, G.; Besara, T.; Andreu, L.; Rivera, F. Single crystal elasticity of natural topaz at high-temperatures. Sci. Rep. UK 2018, 8, 9. [Google Scholar] [CrossRef]
- Barton, M.D.; Haselton, H.T.; Hemingway, B.S.; Kleppa, O.J.; Robie, R.A. The thermodynamic properties of fluor-topaz. Am. Mineral. 1982, 67, 350–355. [Google Scholar]
- Zhang, R.Y.; Liou, J.G.; Shu, J.F. Hydroxyl-rich topaz in high-pressure and ultrahigh-pressure kyanite quartzites, with retrograde woodhouseite, from the Sulu terrane, eastern China. Am. Mineral. 2002, 87, 445–453. [Google Scholar] [CrossRef]
- Alberico, A.; Ferrando, S.; Ivaldi, G.; Ferraris, G. X-ray single-crystal structure refinement of an OH-rich topaz from Sulu UHP terrane (Eastern China)-Structural foundation of the correlation between cell parameters and fluorine content. Eur. J. Mineral. 2003, 15, 875–881. [Google Scholar] [CrossRef]
- Gatta, G.D.; Nestola, F.; Ballaran, T.B. Elastic behaviour and structural evolution of topaz at high pressure. Phys. Chem. Miner. 2006, 33, 235–242. [Google Scholar] [CrossRef]
- Liu, Y.X.; Qin, S.; Li, H.J.; Li, X.D.; Liu, J. In situ high-pressure X-ray diffraction of natural topaz. Nucl. Sci. Tech. 2008, 31, 497–500. [Google Scholar]
- Gatta, G.D.; Morgenroth, W.; Dera, P.; Petitgirard, S.; Liermann, H.P. Elastic behavior and pressure-induced structure evolution of topaz up to 45 GPa. Phys. Chem. Miner. 2014, 41, 569–577. [Google Scholar] [CrossRef]
- Komatsu, K.; Kagi, H.; Marshall, W.G.; Kuribayashi, T.; Parise, J.B.; Kudoh, Y. Pressure dependence of the hydrogen-bond geometry in topaz-OD from neutron powder diffraction. Am. Mineral. 2008, 93, 217–227. [Google Scholar] [CrossRef]
- Komatsu, K.; Kuribayashi, T.; Kudoh, Y. Effect of temperature and pressure on the crystal structure of topaz, Al2SiO4(OH, F)2. J. Miner. Petrol. Sci. 2003, 98, 167–180. [Google Scholar] [CrossRef][Green Version]
- Mookherjee, M.; Tsuchiya, J.; Hariharan, A. Crystal structure, equation of state, and elasticity of hydrous aluminosilicate phase, topaz-OH (Al2SiO4(OH)2) at high pressures. Phys. Earth Planet. Inter. 2016, 251, 24–35. [Google Scholar] [CrossRef]
- Ulian, G.; Valdre, G. Effects of fluorine content on the elastic behavior of topaz [Al2SiO4(F,OH)2]. Am. Mineral. 2017, 102, 347–356. [Google Scholar] [CrossRef]
- Haussuhl, S. Thermoelastic properties of beryl, topaz, diaspore, sanidine and periclase. Z. Kristallogr. 1993, 204, 67–76. [Google Scholar] [CrossRef]
- Komatsu, K.; Kagi, H.; Okada, T.; Kuribayashi, T.; Parise, J.B.; Kudoh, Y. Pressure dependence of the OH-stretching mode in F-rich natural topaz and topaz-OH. Am. Mineral. 2005, 90, 266–270. [Google Scholar] [CrossRef]
- Fei, Y.W.; Ricolleau, A.; Frank, M.; Mibe, K.; Shen, G.Y.; Prakapenka, V. Toward an internally consistent pressure scale. Proc. Natl. Acad. Sci. USA 2007, 104, 9182–9186. [Google Scholar] [CrossRef]
- Rivers, M.; Prakapenka, V.B.; Kubo, A.; Pullins, C.; Holl, C.M.; Jacobsen, S.D. The COMPRES/GSECARS gas-loading system for diamond anvil cells at the Advanced Photon Source. High Press. Res. 2008, 28, 273–292. [Google Scholar] [CrossRef]
- Dera, P.; Zhuravlev, K.; Prakapenka, V.; Rivers, M.L.; Finkelstein, G.J.; Grubor-Urosevic, O.; Tschauner, O.; Clark, S.M.; Downs, R.T. High pressure single-crystal micro X-ray diffraction analysis with GSE_ADA/RSV software. High Press. Res. 2013, 33, 466–484. [Google Scholar] [CrossRef]
- Kantor, I.; Prakapenka, V.; Kantor, A.; Dera, P.; Kurnosov, A.; Sinogeikin, S.; Dubrovinskaia, N.; Dubrovinsky, L. BX90: A new diamond anvil cell design for X-ray diffraction and optical measurements. Rev. Sci. Instrum. 2012, 83, 6. [Google Scholar] [CrossRef] [PubMed]
- Fan, D.W.; Fu, S.Y.; Yang, J.; Tkachev, S.N.; Prakapenka, V.B.; Lin, J.F. Elasticity of single-crystal periclase at high pressure and temperature: The effect of iron on the elasticity and seismic parameters of ferropericlase in the lower mantle. Am. Mineral. 2019, 104, 262–275. [Google Scholar] [CrossRef]
- Mao, H.K.; Xu, J.; Bell, P.M. Calibration of the ruby pressure gauge to 800 kbar under quasi-hydrostatic conditions. J. Geophys. Res. Solid Earth Planet. 1986, 91, 4673–4676. [Google Scholar] [CrossRef]
- Zhang, D.Z.; Dera, P.K.; Eng, P.J.; Stubbs, J.E.; Zhang, J.S.; Prakapenka, V.B.; Rivers, M.L. High pressure single crystal diffraction at PX^2. Jove J. Vis. Exp. 2017. [Google Scholar] [CrossRef]
- Fan, D.W.; Zhou, W.G.; Wei, S.Y.; Liu, Y.G.; Ma, M.N.; Xie, H.S. A simple external resistance heating diamond anvil cell and its application for synchrotron radiation X-Ray diffraction. Rev. Sci. Instrum. 2010, 81, 5. [Google Scholar] [CrossRef] [PubMed]
- Hammersley, A.P.; Svensson, S.O.; Hanfland, M.; Fitch, A.N.; Hausermann, D. Two-dimensional detector software: From real detector to idealised image or two-theta scan. High Pressure Res. 1996, 14, 235–248. [Google Scholar] [CrossRef]
- Toby, B.H. EXPGUI, a graphical user interface for GSAS. J. Appl. Crystallogr. 2001, 34, 210–213. [Google Scholar] [CrossRef]
- Toby, B.H.; Von Dreele, R.B.; Larson, A.C. CIF applications. XIV. Reporting of Rietveld results using pdCIF: GSAS2CIF. J. Appl. Crystallogr. 2003, 36, 1290–1294. [Google Scholar] [CrossRef]
- Le Bail, A.; Duroy, H.; Fourquet, J.L. Ab-initio structure determination of LiSbWO6 by X-ray-powder diffraction. Mater. Res. Bull. 1988, 23, 447–452. [Google Scholar] [CrossRef]
- Angel, R.J.; Gonzalez-Platas, J.; Alvaro, M. EosFit7c and a Fortran module (library) for equation of state calculations. Z. Krist. Cryst. Mater. 2014, 229. [Google Scholar] [CrossRef]
- Angel, R.J. Equations of State. Rev. Mineral. Geochem. 2000, 41, 35–59. [Google Scholar] [CrossRef]
- Gauzzi, T.; Graca, L.M.; Lagoeiro, L.; Mendes, I.D.; Queiroga, G.N. The fingerprint of imperial topaz from Ouro Preto region (Minas Gerais state, Brazil) based on cathodoluminescence properties and composition. Mineral. Mag. 2018, 82, 943–960. [Google Scholar] [CrossRef]
- Agangi, A.; Gucsik, A.; Nishido, H.; Ninagawa, K.; Kamenetsky, V.S. Relation between cathodoluminescence and trace-element distribution of magmatic topaz from the Ary-Bulak massif, Russia. Mineral. Mag. 2018, 80, 881–899. [Google Scholar] [CrossRef][Green Version]
- Gatta, G.D.; Merlini, M.; Lee, Y.; Poli, S. Behavior of epidote at high pressure and high temperature: A powder diffraction study up to 10 GPa and 1,200 K. Phys. Chem. Miner. 2011, 38, 419–428. [Google Scholar] [CrossRef]
- Angel, R.J.; Bujak, M.; Zhao, J.; Gatta, G.D.; Jacobsen, S.D. Effective hydrostatic limits of pressure media for high-pressure crystallographic studies. J. Appl. Crystallogr. 2007, 40, 26–32. [Google Scholar] [CrossRef]
- Klotz, S.; Chervin, J.C.; Munsch, P.; Le Marchand, G. Hydrostatic limits of 11 pressure transmitting media. J. Phys. D Appl. Phys. 2009, 42, 7. [Google Scholar] [CrossRef]
- Pawley, A.R. The pressure and temperature stability limits of lawsonite-implications for H2O recycling in subduction zones. Contrib. Mineral. Petr. 1994, 118, 99–108. [Google Scholar] [CrossRef]
- Pollack, H.N.; Chapman, D.S. Regional Variation of Heat-Flow, Geotherms, and Lithospheric Thickness. Tectonophysics 1977, 38, 279–296. [Google Scholar] [CrossRef]
- Zang, S.X.; Liu, Y.G.; Ning, J.Y. Thermal structure of the lithosphere in North China. Chin. J Geophys. 2002, 45, 56–66. [Google Scholar] [CrossRef]
- Artemieva, I.M.; Mooney, W.D. Thermal thickness and evolution of Precambrian lithosphere: A global study. J. Geophys. Res. Solid Earth 2001, 106, 16387–16414. [Google Scholar] [CrossRef]
- Bina, C.R.; Navrotsky, A. Possible presence of high-pressure ice in cold subducting slabs. Nature 2000, 408, 844–847. [Google Scholar] [CrossRef] [PubMed]
- Domanik, K.J.; Holloway, J.R. The stability and composition of phengitic muscovite and associated phases from 5.5 to 11 GPa: Implications for deeply subducted sediments. Geochim. Cosmochim. Acta 1996, 60, 4133–4150. [Google Scholar] [CrossRef]
- Koch-Muller, M.; Matsyuk, S.S.; Rhede, D.; Wirth, R.; Khisina, N. Hydroxyl in mantle olivine xenocrysts from the Udachnaya kimberlite pipe. Phys. Chem. Miner. 2006, 33, 276–287. [Google Scholar] [CrossRef]
- Bell, D.R.; Rossman, G.R.; Moore, R.O. Abundance and partitioning of OH in a high-pressure magmatic system: Megacrysts from the Monastery kimberlite, South Africa. J. Petrol. 2004, 45, 1539–1564. [Google Scholar] [CrossRef]
- Katayama, I.; Nakashima, S.; Yurimoto, H. Water content in natural eclogite and implication for water transport into the deep upper mantle. Lithos 2006, 86, 245–259. [Google Scholar] [CrossRef]
- Grutzner, T.; Klemme, S.; Rohrbach, A.; Gervasoni, F.; Berndt, J. The effect of fluorine on the stability of wadsleyite: Implications for the nature and depths of the transition zone in the Earth’s mantle. Earth Planet Sci. Lett. 2018, 482, 236–244. [Google Scholar] [CrossRef]
© 2020 by the authors. Licensee MDPI, Basel, Switzerland. This article is an open access article distributed under the terms and conditions of the Creative Commons Attribution (CC BY) license (http://creativecommons.org/licenses/by/4.0/).